 Zeyi Zhang
 Longshan Yang
 Heng Cao
- 1Department of Surgical Intensive Care Unit, Shandong Provincial Hospital Affiliated to Shandong First Medical University, Jinan, China
- 2Department of General Surgery, Qilu Hospital of Shandong University, Jinan, China
Objectives: We aimed to assess the potential time-varying associations between HbA1c and mortality, as well as the terminal trajectory of HbA1c in the elderly to reveal the underlying mechanisms.
Design: The design is a longitudinal study using data from the Health and Retirement Study.
Setting and participants: Data were from the Health and Retirement Study. A total of 10,408 participants aged ≥50 years with available HbA1c measurements at baseline (2006/2008) were included.
Methods: Longitudinal HbA1c measured at 2010/2012 and 2014/2016 were collected. HbA1c values measured three times for their associations with all-cause mortality were assessed using Cox regression and restricted cubic splines. HbA1c terminal trajectories over 10 years before death were analyzed using linear mixed-effect models with a backward time scale.
Results: Women constitute 59.6% of the participants with a mean age of 69 years, with 3,070 decedents during the follow-up (8.9 years). The mortality rate during follow-up was 29.5%. Increased mortality risk became insignificant for the highest quartile of HbA1c compared to the third quartile (aHR 1.148, 1.302, and 1.069 for a follow-up of 8.9, 6.5, and 3.2 years, respectively) with a shorter follow-up, while it became higher for the lowest quartile of HbA1c (aHR 0.986, 1.068, and 1.439 for a follow-up of 8.9, 6.5, and 3.2 years, respectively). Accordingly, for both decedents with and without diabetes, an initial increase in HbA1c was followed by an accelerating terminal decline starting 5–6 years before death.
Conclusions and implications: The time-varying association between HbA1c and mortality mapped to the terminal trajectory in HbA1c. High and low HbA1c may have different clinical relationships with mortality. The HbA1c paradox may be partially explained by reverse causation, namely, early manifestation of death.
Highlights
This study found a time-varying association of HbA1c and mortality as death approaches, indicating an initial rise and then a decline in the terminal trajectory of HbA1c. The HbA1c paradox may be explained by reverse causation.
Introduction
The average plasma glucose level for the 2 to 3 months prior was reflected by glycated hemoglobin (HbA1c) (1), which increases with age (2–4). It is acknowledged that a high HbA1c level is an independent indicator of mortality among middle-aged and older adults with and without diabetes (5, 6). Nevertheless, studies demonstrating the detrimental effects of low HbA1c and the protective benefit of high HbA1c have emerged over the past few decades, which is counterintuitive and known as the HbA1c paradox. This inconsistency regarding the association between HbA1c and mortality was noteworthy among older adults (7–9). According to a recent large-scale observational study conducted in primary care in the UK, this inconsistency may be interpreted in terms of possible varying magnitudes of the association between HbA1c and mortality over time (8). Indeed, the effect of HbA1c on mortality may vary across follow-up (10), which is seldom considered in prior studies.
Several researchers have highlighted the potential of reverse causation for explaining the varied effects of HbA1c on mortality, or sometimes known as the HbA1c paradox. This suggests that rather than being randomly associated with long-term mortality, low HbA1c may instead be associated with poor health in older adults (11, 12), which could be an early sign of mortality. However, such hypothesis has not been examined using formal analyses. Terminal trajectories with a backward time scale (13) can be used to characterize the exact changes of HbA1c in the years immediately before death, and therefore can be applied to examine the early manifestations of death. Furthermore, several studies that have modeled biomarker terminal trajectories as time to death in older adults have identified a terminal decline for blood pressure (BP) (14–16) and total cholesterol (TC) (17), indicating that low BP or TC is a proxy of mortality. Nevertheless, the terminal trajectory of HbA1c with proximity to death has not been assessed. Addressing such an issue will not only shed light on the understanding of the time-varying association of HbA1c with mortality from a clinical perspective, but also inform risk assessment and treatment decision-making.
Therefore, the aims of this study were (1) to investigate the associations between HbA1c measured at multiple times and mortality to assess the potential time-varying association, and (2) to estimate the terminal HbA1c trajectories as death approached and compare them with the HbA1c trajectory for survivors over a 10-year period in a middle-aged and older population with and without diabetes.
Materials and methods
Study population
This study used data from the Health and Retirement Study (HRS). HRS is a nationally representative longitudinal survey of noninstitutionalized older adults aged ≥50 years in the United States (18). Biomarker measures including HbA1c are examined during the enhanced face-to-face interview, with a randomized half of the sample first measured in 2006 and the other half measured in 2008. Each group then had follow-up exams every 4 years following the initial exam. For this study, we used data covering 2006 over 2016. The study population (n = 10,852) consisted of respondents who satisfied the following criteria: (1) completed the interview in 2006 or 2008 (i.e., baseline); (2) had baseline HbA1c measures; and (3) had reported their history of diabetes (yes/no) at baseline. We further excluded participants who had missing data for any of the baseline covariates (n = 444). A total of 23,273 interviews of 10,408 participants were eligible (mean, 2.2 interviews/person) (Figure S1). Of those with baseline HbA1c measure, 7,286 (70.0%) participated during the second wave (2010/2012) and 5,801 (55.7%) participated during the third wave (2014/2016). Having baseline diabetes was defined as individuals who answered “yes” to the question “Has a doctor ever told you that you have diabetes or high blood sugar?” or had baseline HbA1c ≥6.5% (19). In HRS, proxy interview rates across years (i.e., 2006–2016) ranged from 4.5% to 6.8%. All participants or their proxy respondents have provided written informed consent.
HbA1c measurement (2006/2008, 2010/2012, 2014/2016)
We used three waves of HbA1c data collected at interviews of 2006/2008, 2010/2012, and 2014/2016 for analysis. In the HRS, HbA1c was measured by dried blood spots (DBSs), which are highly correlated with the whole blood (r = 0.956) (20). Because the biomarker values based on DBS vary across assays and laboratories, the HRS adjusted DBS values to levels consistent with the National Health and Nutrition Examination Survey (NHANES) (21). We used the NHANES-equivalent assays for analysis, which are recommended by HRS and used in previous studies.
Mortality
Deaths from any cause through 2018 and the date of death (year) were determined by exit interviews with proxy respondents as well as the National Death Index data linked to respondents. For this study, included participants who died from 2006 to 2018 are identified as decedents, and those who survived 2018 were identified as survivors.
Covariates
Information on covariates were obtained from the baseline interview, including sociodemographic variables (sex, age, race, education, and marital status), lifestyle variables [physical activity, smoking, drinking, and body mass index (BMI)], and health conditions (diabetes, hypertension, heart diseases, and multimorbidity score). Details were presented in the Supplementary Materials (eMethod 1).
Statistical analyses
Baseline characteristics of participants by survival status at the end of follow-up were described. Comparisons between decedents and survivors were performed using t-test, Kruskal–Wallis test, or chi-square test.
Three Cox proportional regression models were used to examine the time-varying association between HbA1c and mortality risk. HbA1c values measured in 2006/2008, 2010/2012, and 2014/2016 were, respectively, the independent variables in the three models. Follow-up was from HbA1c measurements until death or December 2018. As a result, the time-varying connection between HbA1c and mortality can be examined under various follow-up durations (as shown in Figure S2). In particular, the quartiles of the baseline HbA1c test were used to classify the HbA1c values obtained in the three waves. We reported the hazard ratios (HRs) and 95% confidence intervals (CIs) for different HbA1c categories in the three models respectively. Based on earlier research suggesting that 5.6%–6.5% may be the ideal ranges for overall survival, we selected the third quartile as our reference (22). Proportional hazards assumption was tested by the Schoenfeld residuals trend test (all p > 0.333). Analyses were adjusted for sociodemographic variables (model 1), additionally for lifestyle variables (model 2), and then for health condition variables (model 3). Restricted cubic splines (RCS) with four knots (selected based on model R2) were applied to visualize the nonlinear association between continuous HbA1c and mortality across different exposure times.
We estimated the terminal trajectory of HbA1c using linear mixed models. Models were fitted with HbA1c as the dependent variable, and survival status, time terms, and their interactions as independent variables. As for the time terms, we adopted a backward time scale spanning to 10 years before death or end of follow-up. The random effects for the intercept and time in the linear mixed models allowed for differences in HbA1c at the intercept (time 0) and change in HbA1c over time. Models were adjusted for age at death and covariates mentioned above. For better comprehension, continuous variables were centered around the baseline mean. Because of the non-normal distribution, the HbA1c values were converted logarithmically, and the coefficients can be understood as percentage differences in means.
We performed subgroup analysis by diabetes status at baseline in all of the above analyses. For sensitivity analyses, we additionally adjusted for self-reported medication use relating to hypertension, diabetes, and heart diseases at baseline. Moreover, to control for hemoglobinopathy, we excluded participants with HbA1c < 4.5% (n = 99). We also excluded those who had a diagnosis of cancer at baseline (n = 1701). Finally, we included participants who had missing covariates (n = 444) and re-analyzed by imputing the missing values. Statistical significance was set to two-sided p < 0.05. STATA version 14 and R version 4.1.2 were used for analyses (23, 24). Details about statistical analyses are provided in the Supplementary Materials (eMethod 2).
Results
Of the 10,408 included participants, 3,070 were identified as decedents while the remaining 7,338 were identified as survivors with a 5-year follow-up mortality rate of 13.3% and 29.5%, respectively, during the full follow-up. Table 1 displays the baseline characteristics by survival status. Decedents were older at baseline (76.3 vs. 65.9 years) and time 0 (81.2 vs. 74.1 years), and had a higher proportion of men (47.0% vs. 37.6%) and self-reported history of diabetes at baseline [27.2% (n = 836) vs. 17.7% (n = 1,301)]. The median level of HbA1c at baseline was 5.8% in decedents and 5.6% in survivors. There were also differences between decedents and survivors in other sociodemographic, lifestyle, and health condition variables. Respondents who were excluded from the study were older, had more comorbidities, and had higher HbA1c (Table S1).
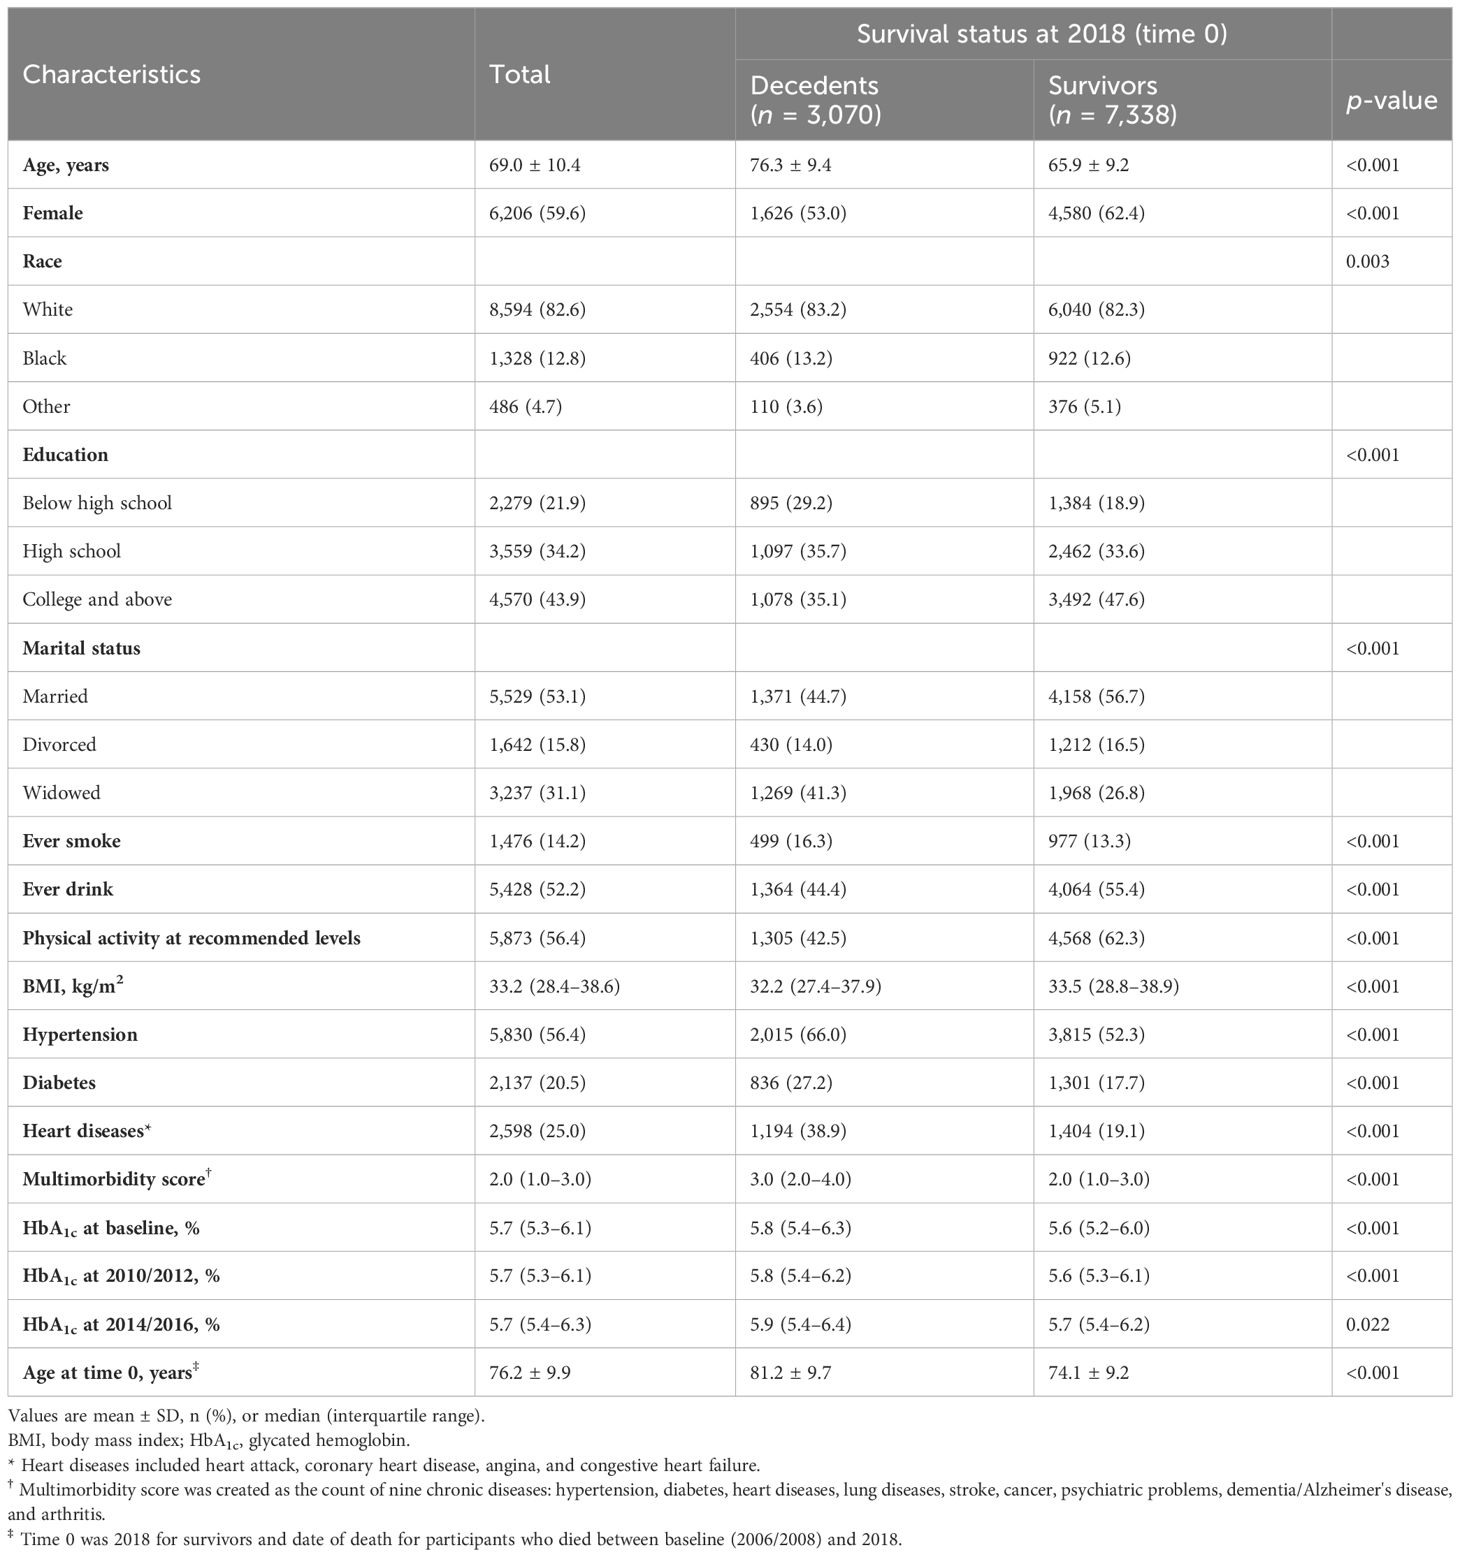
Table 1 Baseline characteristics (2006/2008) of participants by survival status at the end of the follow-up (2018).
Time-to-event analyses
We observed time-varying associations of HbA1c with mortality across different follow-up durations (Table 2). For the Cox model with 2006/2008 HbA1c measures as the independent variable (mean follow-up, 8.9 years), the highest quartile showed a significantly higher risk of mortality compared with the third quartile in all adjusted models (fully adjusted HR, 1.148; p = 0.013). This was also the case for the model of 2010/2012 (mean follow-up, 6.5 years; fully adjusted HR, 1.302; p = 0.001), but not for the model with a short follow-up (i.e., measures at 2014/2016; mean follow-up, 3.2 years; fully adjusted HR, 1.069; p = 0.597). Conversely, the lowest quartile of HbA1c became significantly associated with a 43.9% higher mortality risk relative to the third quartile (p = 0.006) as follow-up was shorter (e.g., measures at 2014/2016). These temporal relationships between HbA1c and mortality were visualized using RCS (Figure 1), showing a shift from “J-shape” to “L-shape” as the HbA1c measurements get closer to death.
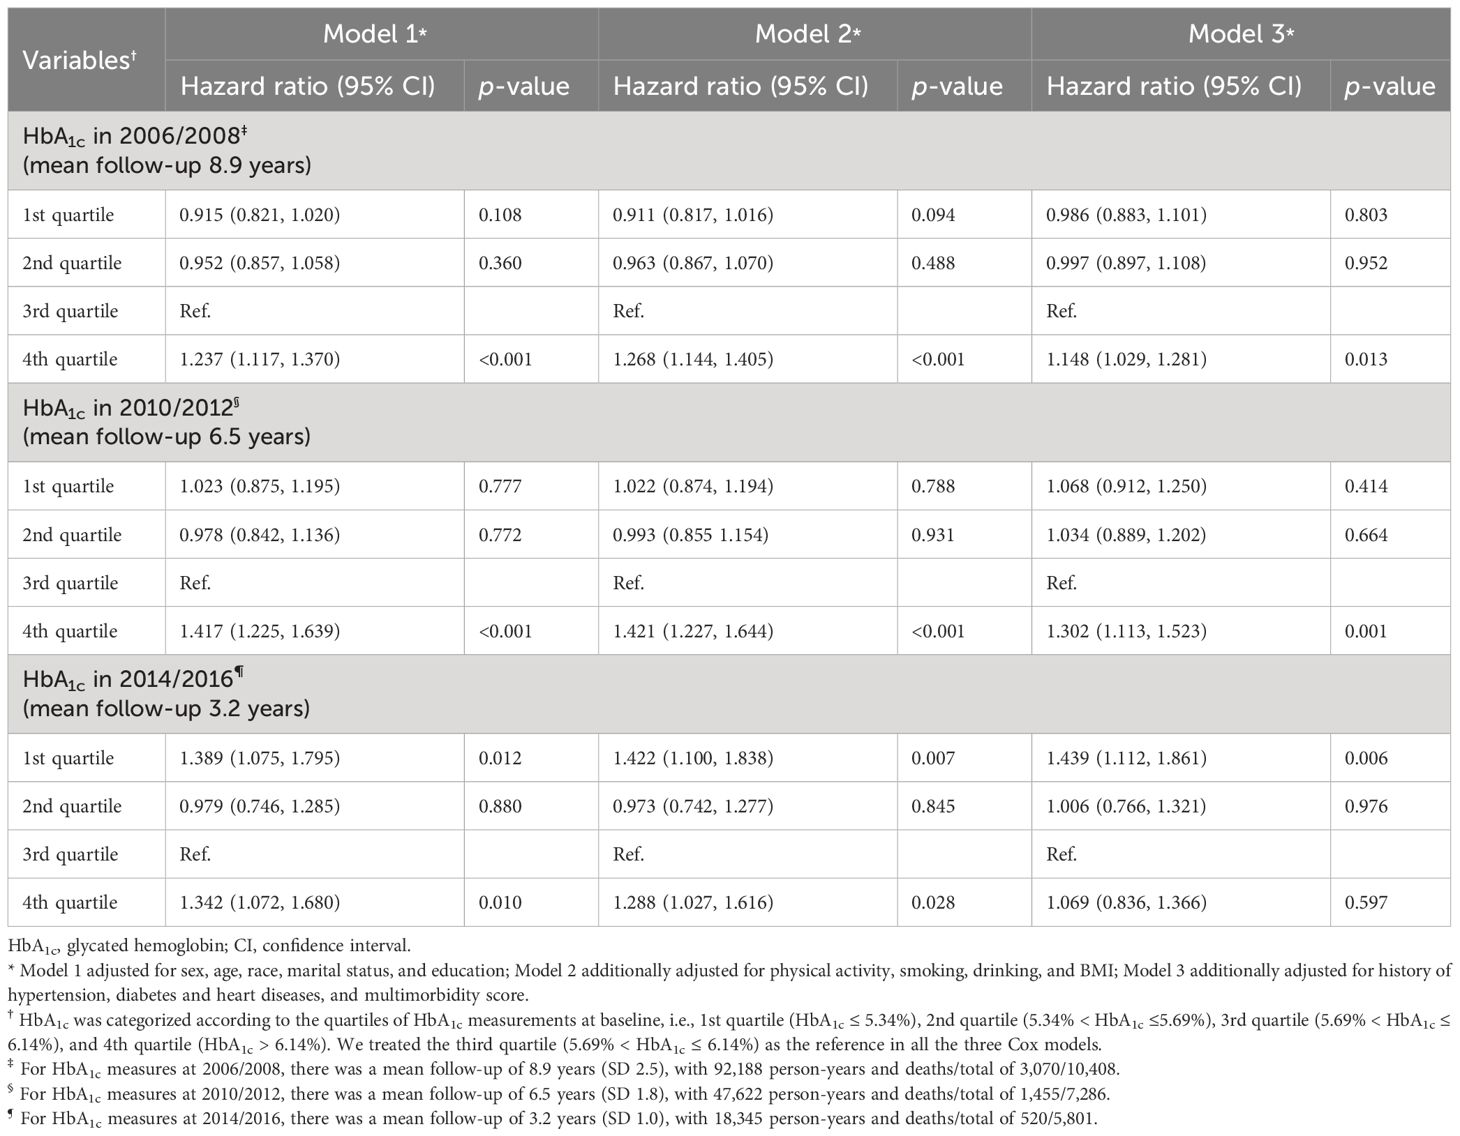
Table 2 Association between multiple measurements of HbA1c and subsequent mortality.
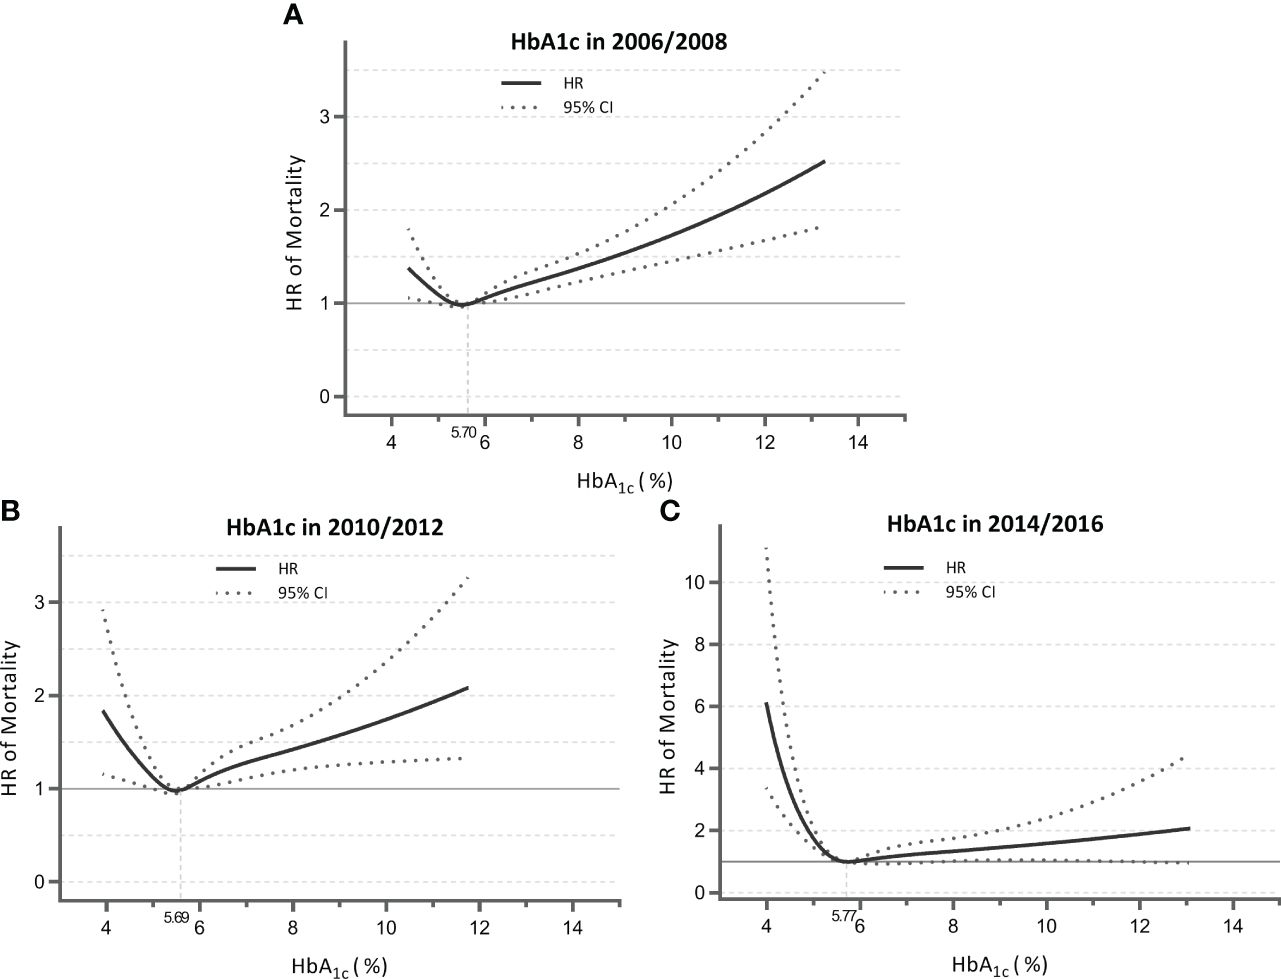
Figure 1 Nonlinear association of HbA1c measured in 2006/2008 (A), 2010/2012 (B), and 2014/2016 (C) with mortality for total sample. Data were derived from the Cox models with restricted cubic splines. Analyses were adjusted for HbA1c; sex; age; race; marital status; education; physical activity; smoking; drinking; body mass index; history of hypertension, diabetes, and heart diseases; and multimorbidity score. HbA1c, glycated hemoglobin; HR, hazard ratio; CI, confidence interval.
When stratified by diabetes status reported at baseline (Table S2; Figure S3), participants without diabetes showed that the highest quartile of HbA1c was consistently associated with higher mortality risk compared with the third quartile across the three measurements. For participants with diabetes, there was a more significant increase in mortality risk for the lowest quartile of HbA1c as follow-up was shorter.
Terminal HbA1c trajectories over 10 years
The clinical reasons underlying the time-varying link between HbA1c and mortality were further suggested by the terminal HbA1c trajectories for survivors and deceased individuals. As indicated (Figure 2A), survivors experienced a consistent increase in HbA1c. In contrast, decedents initially experienced a higher level of and a steeper rise in HbA1c, peaking in years 5–6, and then declined more quickly as they approached death. An intersection point was captured at year 5, whereby survivors had a higher HbA1c level than decedents. Table 3 summarizes the intercept and slope differences of HbA1c trajectories across survival status. There were significant interactions of survival status with linear time (p < 0.001) and quadratic time (p < 0.001), indicating an intensified decline in HbA1c for decedents compared with survivors (Table 3).
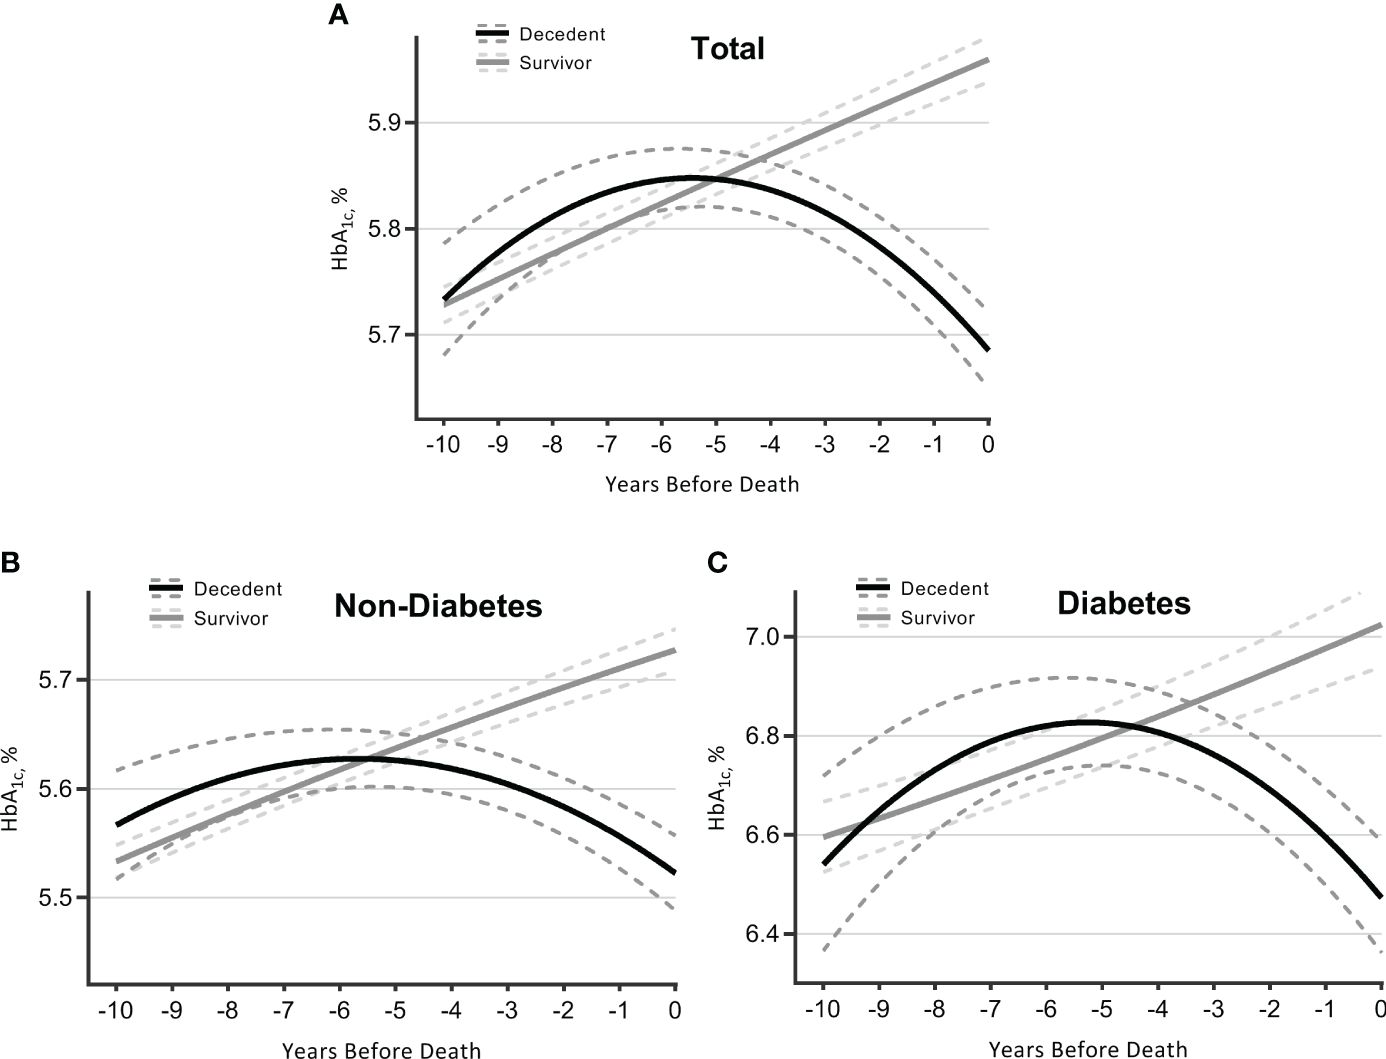
Figure 2 Trajectories of HbA1c over 10 years before death (decedents, n = 3,070) or end of follow-up (survivors, n = 7,338). Estimated mean values were from linear mixed-effect models for total sample (A), participants without diabetes (B), and those with diabetes (C). Analyses were adjusted for sex, age at time 0, race, marital status, education, smoking, drinking, body mass index, physical activity, hypertension, diabetes [not for figure (B) or (C)], heart diseases, multimorbidity score, survival status, time terms (time and time 2), and interactions of survival status and time terms. HbA1c, glycated hemoglobin.
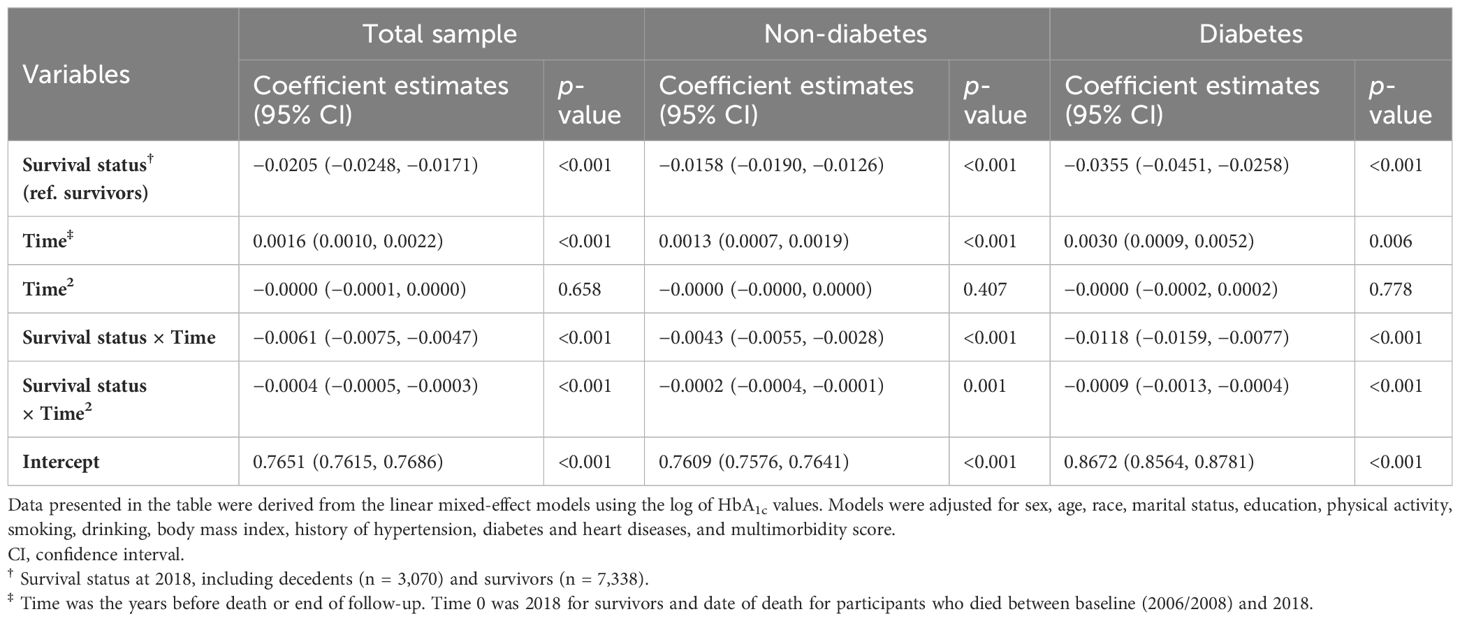
Table 3 Coefficient estimates of HbA1c trajectories for decedents and survivors for 10 years from linear mixed-effect models.
Participants were further stratified by diabetes status collected at baseline. Those without diabetes followed a similar pattern of HbA1c trajectories as observed in the total sample, although the overall HbA1c levels were lower and changes were gentler (Figure 2B; Table 3). As for participants with diabetes (Figure 2C; Table 3), decedents showed a more remarkable upward trend than survivors until years 5–6, with a later intersection (at year 4.5) and a subsequently wider negative gap (i.e., decedents had lower HbA1c levels) (Table S3).
Sensitivity analyses
Sensitivity analyses as described above did not alter the results (Tables S4-S10).
Discussion
This study shows that low HbA1c is associated with higher mortality within short follow-up periods, while high HbA1c is associated with higher mortality in long follow-up periods, indicating a change from a “J-shaped” to an “L-shaped” association between HbA1c level and mortality as death approached. Accordingly, HbA1c trajectory first rose and then terminally declined at an accelerated rate as death approached. Participants who had and those who did not have diabetes at baseline followed a similar pattern. These findings revealed that the effect of HbA1c on mortality that varied across follow-up in older adults may be a reflection of terminal HbA1c trajectory. As a result, there may be differences in the clinical and biological significance of high and low HbA1c levels with respect to mortality risk. Reverse causality provides some explanation for the HbA1c paradox.
Comparisons with previous studies
Recently, the paradoxically protective effects of higher glycemia have been extensively investigated, with studies showing that HbA1c <5.0% and ≥6.5% would increase 30-day, 90-day, and 1-year mortality for critically ill patients, as well as an approximate U-shape association between HbA1c and the risk of mortality being recognized (25–28). As for long-term effects, similar results—subjects with HbA1c level <6% and ≥10% were more likely to have in-hospitality mortality—were found (29). However, prior studies on the HbA1c paradox have largely focused on mean HRs over the follow-up period, potentially ignoring the varied effects for the temporal pattern of exposure. A meta-analysis found that both high and low HbA1c were risk factors for mortality, with duration of follow-up being one of the sources of heterogeneity (30). Accounting for this, Laiteerapong et al. reported that longer period of exposure to high HbA1c (>8.0%) among adults with diabetes was linked to higher mortality risk (31). Comparably, a recent nationally representative study conducted in the United States showed that a low HbA1c was associated with an elevated risk of all-cause death at 5 and 10 years of follow-up, respectively, of 30% and 12% (32). Although they involve different populations and HbA1c levels, these findings were in parallel to our results, in which increased mortality risk became lower for high HbA1c, while it became higher for low HbA1c when follow-up was shorter (i.e., closer to death). Such results highlight the necessity of taking into account differences in magnitude when evaluating the effect of HbA1c on mortality. In particular, when stratified by diabetes status, we observed that increased mortality risk was consistently correlated to high HbA1c for participants without diabetes, while it was more significantly correlated to low HbA1c for participants with diabetes. Therefore, while strict glycemic control may not always assist those with diabetes, maintaining a healthy HbA1c level over time may be crucial for those without the disease (33).
A growing number of studies argue that the observed increased mortality risk associated with low HbA1c or intensive glucose therapy may not be a casual effect of low HbA1c (32, 34); an epidemiological investigation using the United States national database also supported the idea that low HbA1c level was a proxy of end stage of life after adjusting for an extensive set of potential confounders with flexible modeling (8). However, the above studies did not conduct a formal analysis of terminal HbA1c trajectory in decedents. Our study found an accelerated terminal decline in HbA1c over 5–6 years prior to death. Comparing survivors and decedents revealed that this terminal decline in HbA1c might not be the result of aging. Furthermore, HbA1c-lowering treatment also did not seem to explain such a decline since participants without diabetes also experienced a terminal decline. Therefore, our results expanded earlier studies on terminal trajectories of cardiometabolic indicators (14, 15, 17) and provide straightforward evidence for the hypothesis that low HbA1c is a sign of mortality. Although the exact mechanisms causing the observed terminal HbA1c fall are unknown, they may have to do with failing organs, malnourishment, and unfavorable profiles of components associated with red blood cells, among others (11, 35). Indeed, the relationship between low HbA1c and mortality was lessened in our study’s sensitivity analyses by removing people with an HbA1c of less than 4.5% (probable hemoglobinopathy).
It is interesting to note that the decedents’ trajectory showed an early rise in HbA1c. Some post-trial analyses have presented the HbA1c “legacy effect”; that is, exposure to adverse glucose control had a prolonged influence on the risk of future mortality (36). Several longitudinal studies have shown the adverse effects of poor glycemic control on major cardiovascular events and immune function related to COVID-19 over the years (37, 38). These data indicated that high HbA1c level may be a predictor for the long-term mortality risk. Furthermore, the initially rising and subsequently falling HbA1c trajectory is exactly mapped to the time-varying associations between HbA1c and mortality across follow-up, offering a mechanism explanation for the time-varying association. In fact, our conclusion is in line with several clinical mechanism studies that show that early glycemic intervention targeting glucose sodium-cotransporter-2 inhibitors can improve myocardial function (39–41). Conjunctively, we supposed that high HbA1c may be a long-term predictor of death, whereas low HbA1c is more likely a reverse causation, namely, an early manifestation of mortality, for this middle-aged and older adult population.
Meaning of findings
This study will be beneficial for the understanding of physiological change before death and the identification of risk populations. Results highlighted the importance of long-term HbA1c monitoring as early as possible in light of the probability of notable alterations occurring 10 years before to mortality (42, 43). In a clinical setting, effective glycemic treatment can be introduced early to patients with increased HbA1c (44, 45). However, an intensified glycemic control may not be appropriate for those who are at the end of life, supporting recent recommendations that the glycemic management of older adults with diabetes should be individualized depending on the patient’s life expectancy and overall health status (46, 47). Moreover, the identification of turning point at 5 years before death could have implications for the less glycemic targets in the context of life span. This study also supported the rationale of “reverse epidemiology/reverse causation” (48); that is, patients with a lower HbA1c were generally closer to death, which may partly explain the paradoxical effects of HbA1c in previous studies.
Strengths and limitations
This study allowed for additional insight into the processes behind the time-varying effects of HbA1c on mortality by combining retrospective terminal trajectory studies with prospective time-to-event analysis. Moreover, to our knowledge, this study provides the first evidence of the terminal trajectory in HbA1c using a backward time scale for 10 years before death. Another advantage is the application of a nationally representative sample of middle-aged and older adults drawn from the HRS panel study. However, some limitations should be considered. Firstly, we are unable to examine the HbA1c trajectory among specific causes of death because of a lack of information on cause-specific mortality. In addition, it remains unclear to what extent the diabetes phenotypes, treatments, and disease duration impact the HbA1c terminal trajectory, although we managed to control the usage of medication in sensitivity analyses. There was evidence that patients with a long duration of diabetes were more inclined to have poor outcomes when exposed to low HbA1c than those with a short duration (49). Therefore, future studies are expected to validate the present findings accounting for these factors. Moreover, we cannot completely rule out misclassification, nor did we take time-varying confounders into account. Information reported by agents at the time of data collection was incorporated into HRS, and this study may be exposed to additional unmeasured confounders. Moreover, we adopted the logarithmic transformation of HbA1c data as the analytical variable in our study, which may have limited how our findings could be interpreted and directly compared to those of other investigations. Furthermore, contrary to what previous studies have found, our study did not identify a steeper decline in HbA1c during the last 2 years before death (14, 17). This may arise from the relatively long measurement interval. Nevertheless, obtaining frequent HbA1c in representative populations over 10 years before death can be challenging, and the present data with repeated measurements are qualified for analysis.
Conclusions and implications
This analysis showed time-varying associations between HbA1c and mortality across different durations of follow-up, shifting from “J-shaped” to “L-shaped” as death approached. Such associations are exactly mapped to the HbA1c terminal trajectory showing an early increase followed by an accelerating terminal decline for 5–6 years before death in HbA1c, which was not observed in survivors. These results suggested that there might be differences in the clinical significance of high and low HbA1c with regard to mortality: high HbA1c may be a long-term predictor of death, while low HbA1c may be an early manifestation of death. Thus, the HbA1c conundrum in earlier research may be partially explained by reverse causation. Our findings underscore the necessity of long-term HbA1c monitoring as early as possible. Additionally, effective glycemic control should be introduced early but may not be appropriate when patients are at the end of life.
Data availability statement
The datasets presented in this study can be found in online repositories. The names of the repository/repositories and accession number(s) can be found in the article/Supplementary Material.
Ethics statement
The studies involving humans were approved by Behavioral Sciences Committee institutional review board at University of Michigan. The studies were conducted in accordance with the local legislation and institutional requirements. The participants provided their written informed consent to participate in this study.
Author contributions
HC: Writing – review & editing, Validation, Supervision, Resources, Funding acquisition, Conceptualization. ZZ: Writing – original draft, Software, Methodology, Investigation, Conceptualization. LY: Writing – review & editing, Validation, Software, Methodology, Investigation, Formal analysis, Data curation.
Funding
The author(s) declare that no financial support was received for the research, authorship, and/or publication of this article.
Acknowledgments
The authors would like to express genuine gratitude to participants and the staff of the Health and Retirement Study who contributed greatly to the academic community and made this study possible.
Conflict of interest
The authors declare that the research was conducted in the absence of any commercial or financial relationships that could be construed as a potential conflict of interest.
Publisher’s note
All claims expressed in this article are solely those of the authors and do not necessarily represent those of their affiliated organizations, or those of the publisher, the editors and the reviewers. Any product that may be evaluated in this article, or claim that may be made by its manufacturer, is not guaranteed or endorsed by the publisher.
Supplementary material
The Supplementary Material for this article can be found online at: https://www.frontiersin.org/articles/10.3389/fendo.2024.1383516/full#supplementary-material
Abbreviations
BMI, body mass index; BP, blood pressure; CPRD, Clinical Practice Research Datalink; CI, confidence interval; DBS, dried blood spots; HbA1c, glycated hemoglobin; HR, hazard ratio; HRS, Health and Retirement Study; NHANES, National Health and Nutrition Examination Survey; RCS, restricted cubic splines.
References
1. American Diabetes Association. 2. Classification and diagnosis of diabetes: standards of medical care in diabetes-2018. Diabetes Care. (2018) 41:S13–s27. doi: 10.2337/dc18-S002
2. Warren B, Rawlings AM, Lee AK, Grams M, Coresh J, Selvin E. Increases in biomarkers of hyperglycemia with age in the atherosclerosis risk in communities (ARIC) study. Diabetes Care. (2017) 40:e96–7. doi: 10.2337/dc17-0075
3. Pani LN, Korenda L, Meigs JB, Driver C, Chamany S, Fox CS, et al. Effect of aging on A1C levels in individuals without diabetes: evidence from the Framingham Offspring Study and the National Health and Nutrition Examination Survey 2001-2004. Diabetes Care. (2008) 31:1991–6. doi: 10.2337/dc08-0577
4. NCD Risk Factor Collaboration (NCD-RisC). Global variation in diabetes diagnosis and prevalence based on fasting glucose and hemoglobin A1c. Nat Med. (2023) 29:2885–901. doi: 10.1038/s41591-023-02610-2
5. Palta P, Huang ES, Kalyani RR, Golden SH, Yeh HC. Hemoglobin A(1c) and mortality in older adults with and without diabetes: results from the national health and nutrition examination surveys (1988-2011). Diabetes Care. (2017) 40:453–60. doi: 10.2337/dci16-0042
6. Rooney MR, Tang O, Pankow JS, Selvin E. Glycaemic markers and all-cause mortality in older adults with and without diabetes: the Atherosclerosis Risk in Communities (ARIC) study. Diabetologia. (2021) 64:339–48. doi: 10.1007/s00125-020-05285-3
7. Anyanwagu U, Mamza J, Donnelly R, Idris I. Relationship between HbA1c and all-cause mortality in older patients with insulin-treated type 2 diabetes: results of a large UK Cohort Study. Age Ageing. (2019) 48:235–40. doi: 10.1093/ageing/afy178
8. Zaccardi F, Ling S, Lawson C, Davies MJ, Khunti K. Severe hypoglycaemia and absolute risk of cause-specific mortality in individuals with type 2 diabetes: a UK primary care observational study. Diabetologia. (2020) 63:2129–39. doi: 10.1007/s00125-020-05223-3
9. Orozco-Beltrán D, Navarro-Pérez J, Cebrián-Cuenca AM, Álvarez-Guisasola F, Caride-Miana E, Mora G, et al. The influence of hemoglobin A1c levels on cardiovascular events and all-cause mortality in people with diabetes over 70 years of age. A prospective study. Prim Care Diabetes. (2020) 14:678–84. doi: 10.1016/j.pcd.2020.06.003
10. Forbes A, Murrells T, Mulnier H, Sinclair AJ. Mean HbA(1c), HbA(1c) variability, and mortality in people with diabetes aged 70 years and older: a retrospective cohort study. Lancet Diabetes Endocrinol. (2018) 6:476–86. doi: 10.1016/S2213-8587(18)30048-2
11. Aggarwal V, Schneider AL, Selvin E. Low hemoglobin A(1c) in nondiabetic adults: an elevated risk state? Diabetes Care. (2012) 35:2055–60. doi: 10.2337/dc11-2531
12. Carson AP, Fox CS, McGuire DK, Levitan EB, Laclaustra M, Mann DM, et al. Low hemoglobin A1c and risk of all-cause mortality among US adults without diabetes. Circ Cardiovasc Qual Outcomes. (2010) 3:661–7. doi: 10.1161/CIRCOUTCOMES.110.957936
13. Wilson RS, Yu L, Leurgans SE, Bennett DA, Boyle PA. Proportion of cognitive loss attributable to terminal decline. Neurology. (2020) 94:e42–50. doi: 10.1212/WNL.0000000000008671
14. Ravindrarajah R, Hazra NC, Hamada S, Charlton J, Jackson SHD, Dregan A, et al. Systolic blood pressure trajectory, frailty, and all-cause mortality >80 years of age: cohort study using electronic health records. Circulation. (2017) 135:2357–68. doi: 10.1161/CIRCULATIONAHA.116.026687
15. Delgado J, Bowman K, Ble A, Masoli J, Han Y, Henley W, et al. Blood pressure trajectories in the 20 years before death. JAMA Intern Med. (2018) 178:93–9. doi: 10.1001/jamainternmed.2017.7023
16. Rogers MA, Ward K, Gure TR, Choe HM, Lee PG, Bernstein SJ, et al. Blood pressure trajectories prior to death in patients with diabetes. Diabetes Care. (2011) 34:1534–9. doi: 10.2337/dc11-0441
17. Charlton J, Ravindrarajah R, Hamada S, Jackson SH, Gulliford MC. Trajectory of total cholesterol in the last years of life over age 80 years: cohort study of 99,758 participants. J Gerontol A Biol Sci Med Sci. (2018) 73:1083–9. doi: 10.1093/gerona/glx184
18. Sonnega A, Faul JD, Ofstedal MB, Langa KM, Phillips JW, Weir DR. Cohort profile: the health and retirement study (HRS). Int J Epidemiol. (2014) 43:576–85. doi: 10.1093/ije/dyu067
19. Gillett MJ. International Expert Committee report on the role of the A1C assay in the diagnosis of diabetes. Diabetes Care. (2009) 32:1327–34. doi: 10.2337/dc09-9033
20. Crimmins E, K J, M. H, Seeman T. Results from the Health and Retirement Study Biomarker Validation Project. Ann Arbor, MI: Institute for Social Research. University of Michigan (2013).
21. Crimmins E, F J, K. J, Weir D. Documen-tation of Biomarkers in the 2010 and2012 Health and Retirement Study. Institutefor Social Research. University of Michigan (2015).
22. Li FR, Zhang XR, Zhong WF, Li ZH, Gao X, Kraus VB, et al. Glycated hemoglobin and all-cause and cause-specific mortality among adults with and without diabetes. J Clin Endocrinol Metab. (2019) 104:3345–54. doi: 10.1210/jc.2018-02536
23. Boston RC, Sumner AE. STATA: a statistical analysis system for examining biomedical data. Adv Exp Med Biol. (2003) 537:353–69. doi: 10.1007/978-1-4419-9019-8_23
24. Luke SG. Evaluating significance in linear mixed-effects models in R. Behav Res Methods. (2017) 49:1494–502. doi: 10.3758/s13428-016-0809-y
25. Liu C, Pang K, Tong J, Ouyang W, Li L, Tang Y. The association between hemoglobin A1c and all-cause mortality in the ICU: A cross-section study based on MIMIC-IV 2.0. Front Endocrinol (Lausanne). (2023) 14:1124342. doi: 10.3389/fendo.2023.1124342
26. Liu L, Ye J, Ying M, Li Q, Chen S, Wang B, et al. The U-shape relationship between glycated hemoglobin level and long-term all-cause mortality among patients with coronary artery disease. Front Cardiovasc Med. (2021) 8:632704. doi: 10.3389/fcvm.2021.632704
27. Devries JH. Survival as a function of HbA(1c) in people with type 2 diabetes. Lancet. (2010) 375:1433–4; author reply 1434-5. doi: 10.1016/S0140-6736(10)60614-9
28. Saydah S, Tao M, Imperatore G, Gregg E. GHb level and subsequent mortality among adults in the U.S. Diabetes Care. (2009) 32:1440–6. doi: 10.2337/dc09-0117
29. Li TC, Kardia SL, Li CI, Chen CC, Liu CS, Yang SY, et al. Glycemic control paradox: Poor glycemic control associated with higher one-year and eight-year risks of all-cause hospitalization but lower one-year risk of hypoglycemia in patients with type 2 diabetes. Metabolism. (2015) 64:1013–21. doi: 10.1016/j.metabol.2015.05.004
30. Cavero-Redondo I, Peleteiro B, Álvarez-Bueno C, Rodriguez-Artalejo F, Martínez-Vizcaíno V. Glycated haemoglobin A1c as a risk factor of cardiovascular outcomes and all-cause mortality in diabetic and non-diabetic populations: a systematic review and meta-analysis. BMJ Open. (2017) 7:e015949. doi: 10.1136/bmjopen-2017-015949
31. Laiteerapong N, Ham SA, Gao Y, Moffet HH, Liu JY, Huang ES, et al. The legacy effect in type 2 diabetes: impact of early glycemic control on future complications (The diabetes & Aging study). Diabetes Care. (2019) 42:416–26. doi: 10.2337/dc17-1144
32. Inoue K, Nianogo R, Telesca D, Goto A, Khachadourian V, Tsugawa Y, et al. Low HbA1c levels and all-cause or cardiovascular mortality among people without diabetes: the US National Health and Nutrition Examination Survey 1999-2015. Int J Epidemiol. (2021) 50:1373–83. doi: 10.1093/ije/dyaa263
33. Action to Control Cardiovascular Risk in Diabetes Study Group, Gerstein HC, Miller ME, Byington RP, Goff DC, Bigger JT, et al. Effects of intensive glucose lowering in type 2 diabetes. N Engl J Med. (2008) 358:2545–59. doi: 10.1056/NEJMoa0802743
34. Abdelhafiz AH, Sinclair AJ. Low HbA1c and increased mortality risk-is frailty a confounding factor? Aging Dis. (2015) 6:262–70. doi: 10.14336/AD.2014.1022
35. Christman AL, Lazo M, Clark JM, Selvin E. Low glycated hemoglobin and liver disease in the U.S. population. Diabetes Care. (2011) 34:2548–50. doi: 10.2337/dc11-0944
36. Chalmers J, Cooper ME. UKPDS and the legacy effect. N Engl J Med. (2008) 359:1618–20. doi: 10.1056/NEJMe0807625
37. Marfella R, D'Onofrio N, Mansueto G, Grimaldi V, Trotta MC, Sardu C, et al. Glycated ACE2 reduces anti-remodeling effects of renin-angiotensin system inhibition in human diabetic hearts. Cardiovasc Diabetol. (2022) 21:146. doi: 10.1186/s12933-022-01573-x
38. Marfella R, Sardu C, D'Onofrio N, Prattichizzo F, Scisciola L, Messina V, et al. Glycaemic control is associated with SARS-CoV-2 breakthrough infections in vaccinated patients with type 2 diabetes. Nat Commun. (2022) 13:2318. doi: 10.1038/s41467-022-30068-2
39. Marfella R, Prattichizzo F, Sardu C, Rambaldi PF, Fumagalli C, Marfella LV, et al. GLP-1 receptor agonists-SGLT-2 inhibitors combination therapy and cardiovascular events after acute myocardial infarction: an observational study in patients with type 2 diabetes. Cardiovasc Diabetol. (2024) 23:10. doi: 10.1186/s12933-023-02118-6
40. Marfella R, Sardu C, D'Onofrio N, Fumagalli C, Scisciola L, Sasso FC, et al. SGLT-2 inhibitors and in-stent restenosis-related events after acute myocardial infarction: an observational study in patients with type 2 diabetes. BMC Med. (2023) 21:71. doi: 10.1186/s12916-023-02781-2
41. Prattichizzo F, de Candia P, De Nigris V, Nicolucci A, Ceriello A. Legacy effect of intensive glucose control on major adverse cardiovascular outcome: Systematic review and meta-analyses of trials according to different scenarios. Metabolism. (2020) 110:154308. doi: 10.1016/j.metabol.2020.154308
42. Battelino T, Alexander CM, Amiel SA, Arreaza-Rubin G, Beck RW, Bergenstal RM, et al. Continuous glucose monitoring and metrics for clinical trials: an international consensus statement. Lancet Diabetes Endocrinol. (2023) 11:42–57. doi: 10.1016/S2213-8587(22)00319-9
43. Johansson KS, Bülow C, Jimenez-Solem E, Petersen TS, Christensen MB. Age disparities in glucose-lowering treatment for Danish people with type 2 diabetes: a cross-sectional study between 2019 and 2020. Lancet Healthy Longev. (2023) 4:e685–92. doi: 10.1016/S2666-7568(23)00210-6
44. Minschart C, Myngheer N, Maes T, De Block C, Van Pottelbergh I, Abrams P, et al. Effectiveness of a blended mobile-based lifestyle intervention in women with glucose intolerance after a recent history of gestational diabetes (MELINDA): a 1-year, prospective, multicentre, randomised controlled trial. EClinicalMedicine. (2024) 70:102523. doi: 10.1016/j.eclinm.2024.102523
45. von Loeffelholz C, Birkenfeld AL. Tight versus liberal blood-glucose control in the intensive care unit: special considerations for patients with diabetes. Lancet Diabetes Endocrinol. (2024) 12:277–84. doi: 10.1016/S2213-8587(24)00058-5
46. Cahn A, Raz I, Kleinman Y, Balicer R, Hoshen M, Lieberman N, et al. Clinical assessment of individualized glycemic goals in patients with type 2 diabetes: formulation of an algorithm based on a survey among leading worldwide diabetologists. Diabetes Care. (2015) 38:2293–300. doi: 10.2337/dc15-0187
47. Strain WD, Down S, Brown P, Puttanna A, Sinclair A. Diabetes and frailty: an expert consensus statement on the management of older adults with type 2 diabetes. Diabetes Ther. (2021) 12:1227–47. doi: 10.1007/s13300-021-01035-9
48. Kalantar-Zadeh K, Block G, Horwich T, Fonarow GC. Reverse epidemiology of conventional cardiovascular risk factors in patients with chronic heart failure. J Am Coll Cardiol. (2004) 43:1439–44. doi: 10.1016/j.jacc.2003.11.039
Keywords: glycated hemoglobin (HbA1c), mortality, trajectory, terminal decline, time-varying
Citation: Zhang Z, Yang L and Cao H (2024) Terminal trajectory of HbA1c for 10 years supports the HbA1c paradox: a longitudinal study using Health and Retirement Study data. Front. Endocrinol. 15:1383516. doi: 10.3389/fendo.2024.1383516
Received: 07 February 2024; Accepted: 02 April 2024;
Published: 22 April 2024.
Edited by:
Francesco Prattichizzo, MultiMedica Holding SpA (IRCCS), ItalyReviewed by:
Nunzia D’Onofrio, University of Campania Luigi Vanvitelli, ItalyRoberto Carlos Castrejón Pérez, Instituto Nacional de Geriatría, Mexico
Copyright © 2024 Zhang, Yang and Cao. This is an open-access article distributed under the terms of the Creative Commons Attribution License (CC BY). The use, distribution or reproduction in other forums is permitted, provided the original author(s) and the copyright owner(s) are credited and that the original publication in this journal is cited, in accordance with accepted academic practice. No use, distribution or reproduction is permitted which does not comply with these terms.
*Correspondence: Heng Cao, caoheng_25@163.com