 Jos den Ouden1*
 Victor Ho2Tijs van der Smagt3Geerd Kakes4
 Simon Rommel1Igor Passchier2Jakub Juza5Idelfonso Tafur Monroy1
- 1Department of Electrical Engineering, Eindhoven University of Technology, Eindhoven, Netherlands
- 2Siemens Industry Software Netherlands, Helmond, Netherlands
- 3AI in Motion, Eindhoven, Netherlands
- 4Technology Office, KPN, Den Haag, Netherlands
- 5Roboauto, Brno, Czech Republic
Despite the progress in the development of automated vehicles in the last decade, reaching the level of reliability required at large-scale deployment at an economical price and combined with safety requirements is still a long road ahead. In certain use cases, such as automated shuttles and taxis, where there is no longer even a steering wheel and pedals required, remote driving could be implemented to bridge this gap; a remote operator can take control of the vehicle in situations where it is too difficult for an automated system to determine the next actions. In logistics, it could even be implemented to solve already more pressing issues such as shortage of truck drivers, by providing more flexible working conditions and less standstill time of the truck. An important aspect of remote driving is the connection between the remote station and the vehicle. With the current roll-out of 5G mobile technology in many countries throughout the world, the implementation of remote driving comes closer to large-scale deployment. 5G could be a potential game-changer in the deployment of this technology. In this work, we examine the remote driving application and network-level performance of remote driving on a recently deployed sub-6-GHz commercial 5G stand-alone (SA) mobile network. It evaluates the influence of the 5G architecture, such as mobile edge computing (MEC) integration, local breakout, and latency on the application performance of remote driving. We describe the design, development (based on Hardware-in-the-Loop simulations), and performance evaluation of a remote driving solution, tested on both 5G and 4G mobile SA networks using two different vehicles and two different remote stations. Two test cases have been defined to evaluate the application and network performance and are evaluated based on position accuracy, relative reaction times, and distance perception. Results show the performance of the network to be sufficient for remote driving applications at relatively low speeds (<40 km/h). Network latencies compared with 4G have dropped to half. A strong correlation between latency and remote driving performance is not clearly seen and requires further evaluation taking into account the influence of the user interface.
1 Introduction
In recent years, significant advances have been made (Chan, 2017) on the development of different kinds of automated driving vehicles: small people movers (shuttles), targeting public transport like services at relatively slow speeds; passenger cars, initially targeting taxi-like services, but potentially also usable for private transportation; and industrial vehicles, targeting, e.g., dedicated use cases in harbors or mining operations. Certain particular use cases, such as shuttles, are even being developed without any normal steering wheel and pedals anymore [being an L4 vehicle (SAE, 2021)]. However, one of the key difficulties in designing any automated vehicle is that the Operational Design Domains (ODDs) (BSI, 2020; Czarnecki, 2018) are vast and for large parts even unspecified (Khastgir, 2021) (especially to reach L5 at some point). Therefore, designing to cover all possible ODDs manually is an impossible task. Even if the L4/L5 vehicle would be able to drive itself in all these conditions, sensors can break down or become blocked, and the vehicle might have to fall back to a fail-operational state that limits its maneuverability.
Remote driving (also called remote operation or tele-operation) could bridge this gap (Baraniuk, 2020) by allowing a remote operator to take over control over the vehicle in case it is too difficult for an automated vehicle to figure out what to do by itself. In some use cases, e.g., in mining operations or other confined areas with very specific needs and potentially not a good road infrastructure, it can be advantageous to skip the autonomous part completely and perform the remote operations permanently. By moving the driver outside of the vehicle, it aims at reducing the risks in these potentially hazardous environments. Furthermore, as vehicles in these situations can be standing still for a significant part of the time, operators can be used much more efficiently when they operate multiple vehicles consecutively. Similarly, in the case of a long-haul truck, remote driving might even solve a more immediate issue; the current lack of truck drivers is causing logistics to find new ways of solving the issue. Remote driving could provide a possible solution for this (Gardner, 2021). Similar benefits as with mining apply in this field as well: multiple remote drivers can turn by turn take over control of one truck, without having to take into account the normal legal driving and resting times that come with one driver per one truck normally. With remote driving, the control over the truck can be easily shifted to another remote driver after the first has reached the driving time limit, so the truck can move onward. This could even be extending into truck platooning (Chandramouli et al., 2019; Ploeg et al., 2011). Remote driving can also be used to operate a vast range of machinery ranging from forklifts and mowers to diggers and excavators, thus helping to solve issues with operator logistics in hard-to-get places, such as mining sites. It is already common practice to include a hand-held remote-control device with smaller cranes, loaders, excavators, and similar equipment (Dadhich et al., 2016), in order to allow the operator to control the machine from outside the cabin. However, this principle still requires the operator to be present on the operating site. Remote driving transforms this approach into a fully remote experience, allowing the operator to view the surroundings of the machine using cameras and other sensors, thus removing the need for their on-site presence completely. In general, remote driving can be viewed as an intermediate step towards autonomy, while also being one of its core enabling functions that complement. Eventually, remote driving can even be used to teach the artificial intelligence (AI) in the automated driving system how to maneuver in certain difficult situations, which humans are far more capable of handling at this time (Baraniuk, 2020).
In general, remote driving systems might vary in complexity and setup, but in most cases, the concept is the same (Lane et al., 2002; Gnatzig et al., 2013; Neumeier et al., 2019). It consists of a feedback–control system between the remote operator and the work environment. The feedback pipeline usually comes in the form of a video feed, which has a high bandwidth requirement. The control pipeline only consists of commands with a smaller packet size (<factor 10, compared with video) and thus has a much lower bandwidth requirement. Every component in both these pipelines will add to the total round-trip delay, affecting the total performance of the system (Georg et al., 2020).
The main problem affecting performance in remote driving systems is the processing and communication delay that is fundamentally introduced (Figure 1 for a typical processing pipeline). Previous research on the effect of this has already been done in high-stake research areas such as space engineering and remote surgery (Lane et al., 2002). With additional delays, a moving vehicle will not be in the same position as it was when the operator decides to act. Also, the action of the operator will not be executed immediately due to this delay. Experiments have shown that operators already experience a loss of performance and a mismatch between input and output at as little as 300 ms of round-trip delay (Lane et al., 2002; Neumeier et al., 2019). In general, delays below 170 ms seem to be reasonable for remote driving of vehicles, but over 1,000 ms, it becomes unfeasible to remotely operate the vehicle in a safe manner (Zhang, 2020). Chandramouli et al. (2019) went as far as stating that requirements for the delay (termed latency in this work) should be between ∼50 and 150 ms but only stated this as a requirement, influenced by the availability of haptic/tactile feedback. Unfortunately, it is not stated what this requirement is based upon.
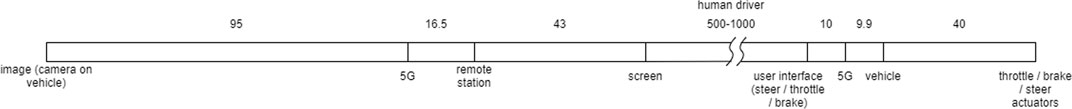
FIGURE 1. Remote driving pipeline latencies (measured). “Human driver” is estimated on literature, and “control signal to actuators” is estimated based on the in-vehicle CAN–bus interface frequency of 25 Hz.
Although remote driving can be implemented in a limited form also on 4G telecommunication networks, its performance can be boosted significantly due to the high demands on bandwidth for the video data, high reliability for the control commands, and overall low end-2-end round-trip latency. V2X applications in general have been identified by 3GPP as a driver for 5G networks (Chandramouli et al., 2019), and 5GAA has described the remote driving use case in more detail, as input for further requirement definition (5 GAA, 2020).
In this work, we therefore aim to evaluate the performance of remote driving in a real test setting. We build further on our previous work (Passchier et al., 2021) and describe in more detail the architecture, implementation, and performance testing of a remote driving solution. First, the overall developed network architecture will be described. This consists of multiple remotely operated vehicles, a mobile network, a local breakout, a gateway on a mobile edge computing (MEC), a fleet manager, and multiple remote driving stations. Second, the methodology to determine the performance of the remote driving use case is determined. This methodology is based on a combination of Hardware-in-the-Loop (HiL) simulations in order to evaluate more easily any network variations on the use case, used in the development of the system and of field tests, in order to verify the results. Finally, we conclude with the analysis of the results of the HiL and field tests, conclusions, and outlook to further work. The results set out in this work are based on two test sessions done in 2021.
2 Materials and Methods
This section explains the overall remote driving architecture used in the evaluation, implemented on a 4G and 5G network, the test case descriptions (straight-line braking and slalom), and its implementation using both a HiL setup and the implementation in a real driving test setup with multiple vehicles and remote stations.
2.1 Remote Driving Architecture
We have developed a remote driving setup that can be connected over both 4G and 5G networks. Figure 2 provides an overview of the entire setup. The setup allows for multiple vehicles and multiple remote stations being connected via (wired) local breakouts to the mobile network, allowing for low latency and high bandwidth connections between the vehicles and remote stations. On the back-end, a fleet manager dynamically controls which remote station is connected to which vehicle. Additionally, a gateway running on the MEC enables the query and setup of the direct connections between the vehicles and remote stations. Each remote station and vehicle logs into this gateway securely, after which the connection will be made, using the fleet manager and using login credentials. In the tests, the MEC is approx. 2 km from the test site and the base station.
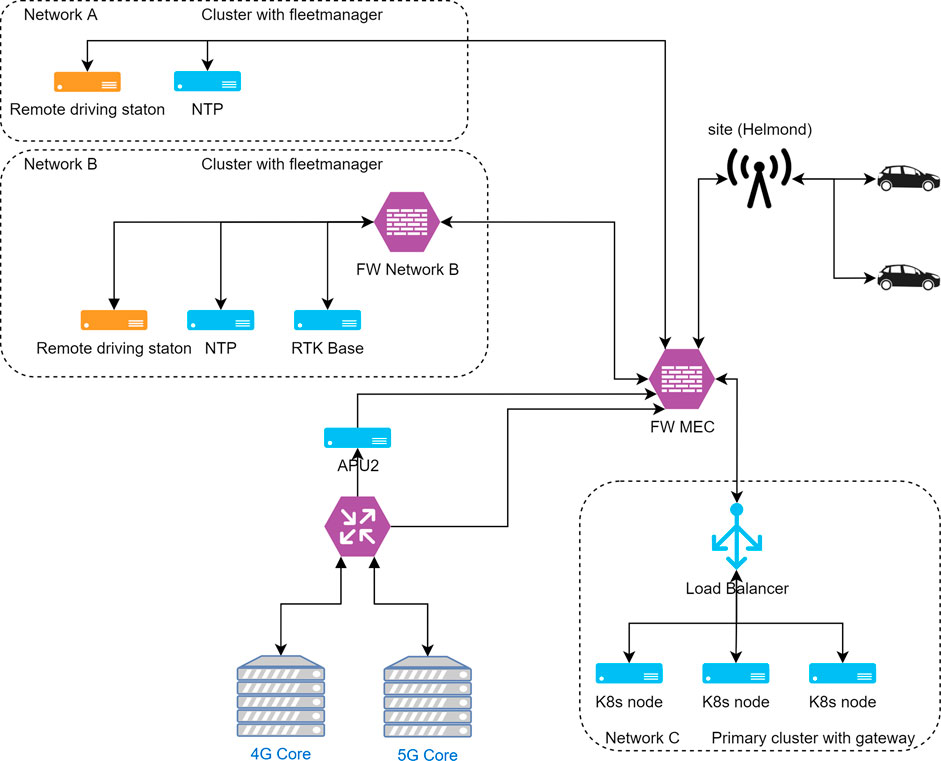
FIGURE 2. Network architecture used in the complete remote driving test setup. The remote driving applications have been implemented in two vehicles connected to one 5G network. Two regional local breakouts in the mobile network connect the two remote stations covering these regions. A gateway is used to interconnect the vehicles with the remote driving stations, running on a separate cluster connected to the remote driving. Each remote station has its own fleet manager, to enable easy switching between the two vehicles.
Figure 3 provides a simplified sequence diagram of the interaction between the various components. There is a split in a registration phase, when vehicles and remote stations come online (on the gateway); a selection phase, when vehicles and remote stations are paired (using the fleet manager); and an operational phase, when vehicles are actually under full remote control from a remote station and have a secure direct connection between each other.
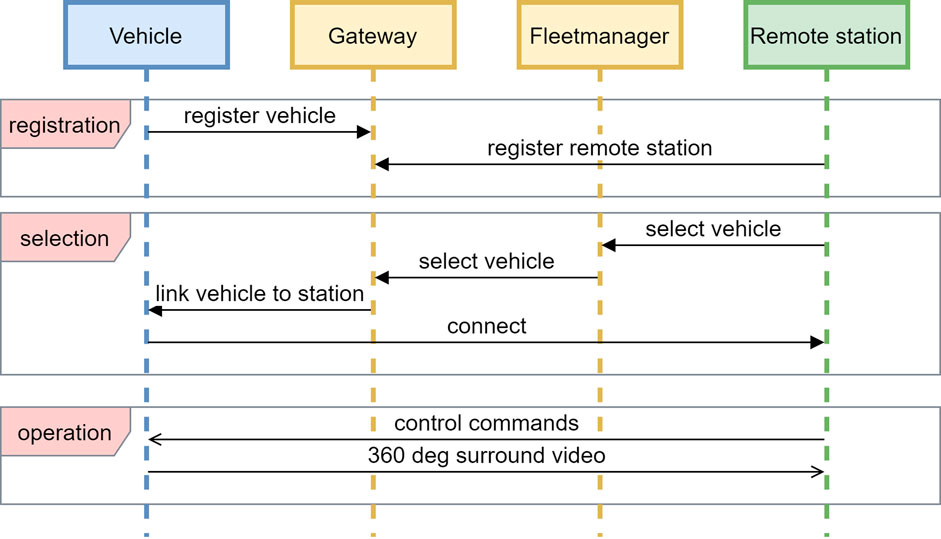
FIGURE 3. Simplified sequence diagram of the communication between vehicles, gateway, fleet manager, and remote stations. Multiple vehicles and remote stations can be deployed simultaneously, where the fleet manager is responsible for the management of the system and the gateway for actually a specific remote station to a specific vehicle.
The described setup has been implemented in two vehicles, a Toyota Prius III (2010 model) and a Toyota Prius IV (2018 model), and onto two remote stations, each situated at locations approximately 10 km apart from each other (Figures 2, 4). Both vehicles have similar setups, using the same on-board unit (OBU), consisting of a DrivePX for processing the camera stream and connected to a modem for the mobile connection, running the remote driving application; and each vehicle has a proprietary vehicle interface in order to send and receive vehicle commands, such as steering angle and acceleration. Each of the vehicles is equipped with four 120° field of view (FoV) cameras showing the front, left, right, and rear of the vehicle and thus capturing the whole 360° view of the vehicle’s surroundings. This video is encoded using the H264 codec and streamed over the mobile network to the remote stations if they are successfully connected (in the previously mentioned “operational phase”). Each remote station consists of three monitors, with the view of the front camera being displayed on the middle monitor, the view of the left and right cameras on the monitors on their respective sides, and the view of the rear camera being displayed as a picture in picture resembling a rearview mirror on the middle monitor. The remote operator uses pedals and a steering wheel as their input to mimic driving in an actual vehicle (Figure 4, top right picture).

FIGURE 4. Overview of the setup during testing of straight-line braking and slalom maneuvers showing both vehicles and one of the remote stations in action: (A) trunk of AIIM-TU/e Prius IV with computing systems and 5G-modem in the middle; (B) TU/e remote station setup performing slalom with Siemens Prius III (note the similar remote station setup as at Siemens in Helmond); (C) AIIM-TU/e Prius IV performing slalom; (D) Siemens Prius III performing remote-driven slalom.
2.2 Connectivity
In the test setup, the vehicle can be connected to both an existing 4G cellular network and a 5G cellular network. The 5G cellular network consists of a 5G NR access network, a stand-alone (SA) core network, and a local edge. With this setup, several 5G technologies can be tested like edge computing, slicing, and service continuity. The network needs to offer a reliable connection to transmit the video—and control the signals. The video signal (depending on the required quality) consumes between 25 and 50 Mbit/s in the uplink of the cellular network per vehicle, a significant portion of the available capacity. Priority mechanisms are needed to guarantee a certain bandwidth. With slicing technology, priority can be given to both the video stream and control signal. Depending on the required speed of the vehicle, a certain maximum latency must be guaranteed by the network. By implementing remote driving stations close to an edge of the mobile network, the latency can be reduced. The maximum latency, and with that also the maximum distance, is determined with the different trials. When different remote driving stations are needed to operate a vehicle driving long distances, a service continuity mechanism needs to ensure the vehicle is always connected to a remote driving station and that handovers between stations are possible. For the 4G network, the production network was used with RAN sharing, with a core very close to the test site (15 km). For the 5G network, dedicated antennas were used, connected to a 5G SA Core, which is located further (±200 km away from the test site), causing the higher transmission latency as indicated in Table 1. In both cases (4G and 5G), the position of the base station was the same, so the distance to the test track and the vehicle is the same in both situations.

TABLE 1. 4G and 5G network settings.
2.3 Performance Optimization and Assessment Methodology
In the 5G-MOBIX project, multiple test cases are being set up. In this work, we focus only on two test cases, which focus on determining the accuracy of vehicle positioning and delay on the driving function of the system while driving remotely, of which the results function as both the benchmark for later planned handover testing and slicing tests and performance metrics for normal remote driving behavior. In both these test cases, we take into account a human-in-the-loop approach, to evaluate remote driving in its most natural situation, in part due to the fact that this is a field test. The goal of this project is to use a pre-deployment 5G network in an as close as possible normal environment rather than test entirely on closed tracks under controlled conditions.
In the first of these two test cases, the vehicles are driven in a straight line, and the (remote) driver needs to stop at a specific location, identified by a visual marker (pylon). The objective of this test is to measure the position accuracy and stopping accuracy of a remote driver and the influence of a remote connection (both on possible communication delay and on the use of a different user interface, since the latter cannot be ignored). The same test was executed with a normal driver in the vehicle, as a benchmark measurement.
In the second test case, the (remote) driver drives the vehicle on a predefined slalom trajectory set out with pylons. The objective of this test is to measure the longitudinal and lateral position accuracy along a trajectory. Also, in this case, the test was also performed with a normal driver, as a benchmark. Both tests consider the possible introduced latency, packet dropouts, and other communication-related parameters that are different with respect to a normal manual-driven vehicle. Additionally, both tests were conducted at different driving speeds, to also determine a possible speed dependency and allowed to determine subjective, boundary conditions for safe remote operation of the vehicles. An overview of the test setup is presented in Figure 5. The first test case uses an identical setup, and only the trajectory driven is different.
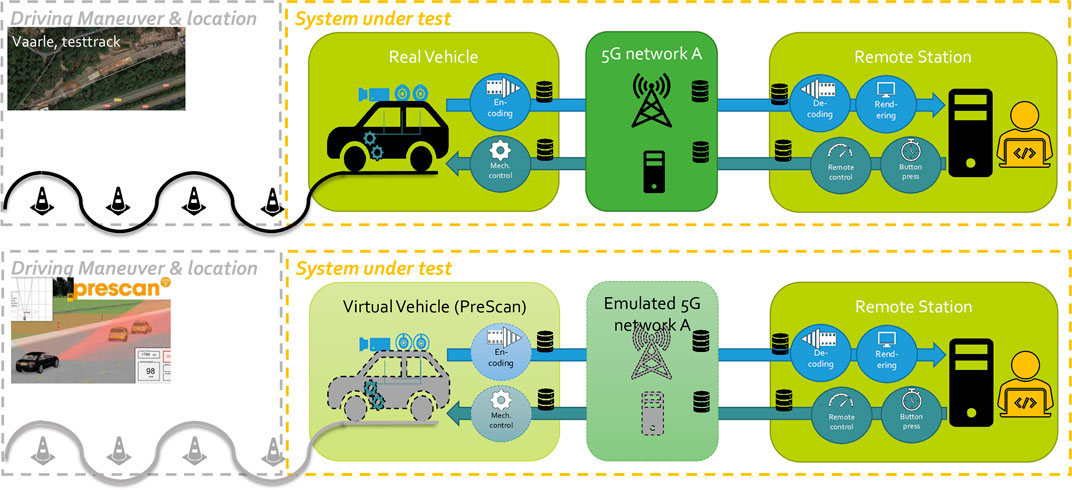
FIGURE 5. System under test for position accuracy/relative reaction time (top: real remote driver with real remote station controlling a real vehicle on test track over a real deployment 5G network vs. bottom: Hardware-in-the-Loop (virtual), with a real remote station and remote driver, but an emulated virtual network and virtual vehicle (in PreScan)) test (only showing slalom in this figure; straight-line braking was in virtual setup as well).
2.3.1 Hardware-in-the-Loop Simulation and Network Emulation
Additionally, to simulate the influence of network behavior on the remote driving setup, a virtual test setup was implemented that mimics the test cases for straight-line driving and slalom described in the previous section, with the same remote station in a HiL setting. This setup provides additional freedom compared with the physical test setup since it provides the ability to emulate both the network and the vehicle. On the emulated network, statistical models can be applied for both packet delay and packet loss to emulate the realistic network performance of mobile networks. This allows making a comparison between Wi-Fi, 4G, and 5G wireless networks. In the physical test setup, it is difficult to change network effects, e.g., the distance between test location and network antennas, and the amount of background traffic. These effects can be emulated easily and reproducibly in the emulated network. The network emulation has been implemented onto a dedicated hardware device. The emulator can be configured with theoretical models for delay and packet loss or can be configured based on field measurements of actual mobile networks.
Table 2 shows the parameter list for both straight-line driving/braking and the slalom test cases, with Latency (mu) as the artificially injected central value of latency distribution, Latency (sigma) the width of the latency distribution, Packet loss the percentage of packets dropped, and Direction the up-link or down-link in which the latency/packet loss is applied. For 1-way direction, the injection is only the video stream uplink, while 2-way direction means both video stream uplink and control commands up- and downlink are affected by the artificial latency/packet loss.

TABLE 2. Parameter list for the virtual test setup.
In the virtual test setup, the real vehicle is replaced by a simulated vehicle and simulated environment. The high-fidelity simulation platform Simcenter Prescan is used to simulate the vehicle and the scenarios for the test cases. The test location of the physical test setup is reconstructed in the simulation environment, and a vehicle model of the Toyota Prius is used as the basis for the simulated vehicle. Multiple video streams are generated from the simulation and fed to the remote station by the same software stack as used in real vehicles. Similarly, the control commands from the remote station are transported to the simulator and converted into control commands for the simulated vehicle.
In addition to having a completely controllable network, the virtualization of the vehicle allows to also test potentially unsafe situations. Lastly, as the entire setup allows for complete repeatability of the tests, it is also possible to determine the reproducibility of the test results and investigate potential human learning effects.
2.3.2 Physical Test Setup
The real physical tests have been performed near the motorway A270 on a closed-off parking lot between Helmond and Eindhoven in order to be able to use the KPN deployment 5G network, as described in Figure 2. Figure 4 gives an overview of the actual track with the two vehicles and one of the remote stations with the three monitors. The position of the cones is measured using real-time kinematic–global navigation satellite system (RTK-GNSS) positioning, to be used in further evaluation, and for reproducibility, the existing white lines were used as the reference, to ensure consistency over multiple days and months of testing. In all cases, a safety driver was in both vehicles in order to take over in case of any emergency.
In both the straight-line drive test case and the slalom test case, tests were conducted at speeds of 10, 20, 30, and 40 km/h. Both test cases were conducted with a total of four different drivers: one driver at each remote station and a safety driver in each of the vehicles, who also conducted the benchmark manual driving tests. In the final evaluation in Section 3.2.2, however, only data from three drivers were used, due to issues with internal communication delays in one of the vehicles. For the benchmark tests (manual driving), a minimum of five test runs per speed set were done. In order to evaluate any influence of driving behavior on the outcome of the test results, one safety driver who conducted the manual tests in one of the vehicles also switched with one remote station driver. The each remote driver conducted at least ten test runs per speed set in order to get a broader sample size.
Since test drivers are not professional test drivers, each driver performed a few practice runs for each of the tests speeds in order to filter out any errors due to learning the maneuvers, before each test case.
For each of the tests, RTK-GNSS has been used for logging the vehicles’ location with centimeter accuracy, time synchronization using Network Time Protocol (NTP) combined with GNSS–Precise Point Positioning (PPP) on sub-millisecond accuracy to sync time with both remote stations and base station; vehicle parameters, such as yaw, steering angle, acceleration (x and y), speed, and pcap logs (of the data streams); and steering commands, acceleration commands from the remote station, and possible interventions by the safety driver.
3 Results
This section describes the results of the HiL tests, the physical drive tests, and the network performance during the physical driver tests.
3.1 Hardware-in-the-Loop Simulation Results
In the virtual test setup, a total of 110 simulation runs were performed in a variety of settings listed in Table 2. Eleven parameter sets were executed with every 10 runs driven by the remote station operator. For the results from the straight-line driving/braking test cases, an analysis was performed on the relative position of the host vehicle with respect to the stop location (pylons) as described in Section 2.3 and also the acceleration request from the remote station driver. Figure 6 shows the results for each parameter set by averaging the multiple runs per set.
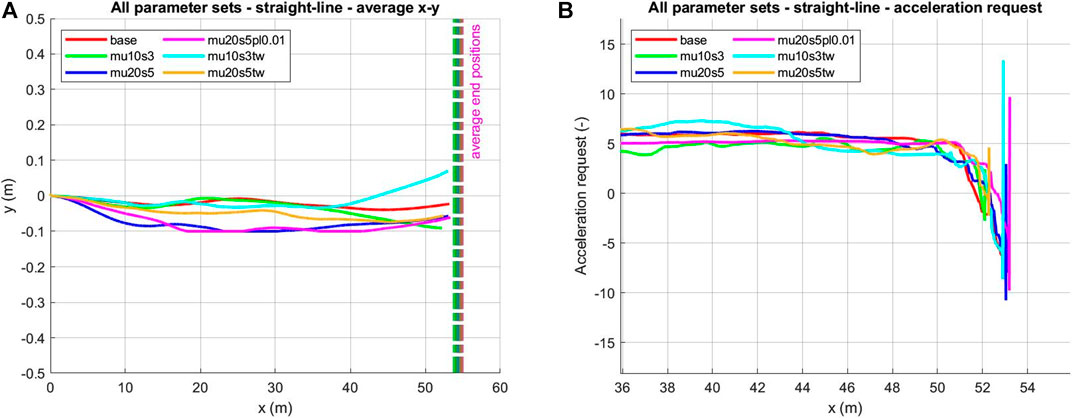
FIGURE 6. Straight-line brake test (HiL). (A) Average position x–y. (B) Average acceleration request.
For these figures, the different parameters sets are defined by separate colors: base mu 0, sigma 0, packet loss 0%; mu10s3 mu 10, sigma 3, packet loss 0%, 1-way; mu20s5 mu 20, sigma 5, packet loss 0%, 1-way; mu20s5pl0.01 mu 20, sigma 5, packet loss 1%, 1-way; mu10s3tw mu 10, sigma 3, packet loss 0%, 2-way; mu20s5tw mu 20, sigma 5, packet loss 0%, 2-way. In Figure 6, the average stopping distance (end positions) for the different parameter sets are shown with the horizontal dashed lines. The target stopping distance for the remote station driver was at 50 m, and from the graph, it can be seen that for all parameter sets, the averages are very close together at between 53 and 55 m. The same holds for the acceleration request behavior, and the results show the same braking pattern after passing the 50-m mark.
The results from the slalom test case do show some deviations between the parameter sets as shown in Figure 7. In the average position graph, there is an additional reference line added to showcase the path that should have been followed by the driver. The parameter set with packet loss, mu20s5pl0.01, was not driven in the slalom test case, as no runs were successfully completed by the operators due to driving difficulty with frame losses. It can be observed that both parameter sets with two-way delay have lower values at the turning points (amplitude peaks). The same accounts for the steering request. There is one outlier in these graphs, which is the base parameter set at 120-m x-position. This was caused by the learning effect from driving the slalom test case, as the base parameter set was always driven first.
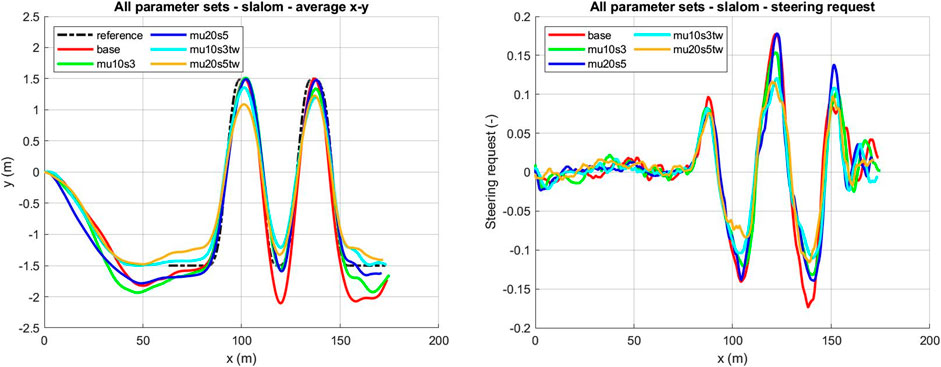
FIGURE 7. Slalom (HiL). (A) Average position x–y. (B) Average steering request.
3.2 Physical Drive Test Results
In total, 2 weeks of testing divided over March/April 2021 and September 2021 was conducted on this track, adding up to over approximately 100 runs of manual driving (as the benchmark), approximately 180 runs using a 4G network, and approximately 300 runs using the developed 5G network including MEC. Each vehicle was driven one at the time for safety reasons, but almost all test runs had both connections online, with live video streams ongoing in both vehicles. Tests were executed between 0900h and 1800h at fairly good weather conditions (no rain or other precipitation). The criteria for disregarding test runs were as follows: bad network reception, indicated by video frame drops at the remote station; unintentionally hitting cones (either by driving too close to them or missing the slalom due to being too late with steering in); and bad lighting conditions/weather conditions, mainly low light conditions in the morning in September tests, where early morning sun from the east was directly in the front camera.
For comparison, we evaluate here only on the results of the slalom tests, since from the virtual testing it became apparent that these proved most challenging, and the possible delays had a higher effect on the driving tasks and therefore are better suited for evaluation in physical testing.
First, we evaluate the outcomes of the network performance after which the use case test results are evaluated.
3.2.1 Network Latency Measurements
Latency measures have focused mainly on the video stream since this required the highest bandwidth. Of the four cameras in the setup, the main front camera has been used for the connectivity measurements.
The latency has been measured as “One Trip Latency.” Every unit was time synchronized with a GPS-PPP source. For this, Chrony was used. At every unit (remote station, base station, and vehicle), the packets were logged using tcpdump. This program logged every packed and timestamped it while it was received or sent via the network interface. A matching tool was used, written for this purpose to match the sent and received packets. This evaluation tool is available on Github: https://github.com/geerdkakes/pcap-analysis. Result of video uplink, control downlink and control uplink signal latencies are shown in Figure 8.

FIGURE 8. Histogram of measured latencies [in (ms)] on 4G vs. 5G network for (A) video uplink, (B) control downlink, and (C) control uplink.
When determining the latency of the complete system, the following parts (similar to Al-N’awashi and Al-Hazaimeh (2014)) should be taken into consideration.
The network latency is relatively small compared with the total latency of the chain (image → driver → control → actuator).
However, looking at the variations in latency (Table 3), the network can have a very large impact on the latency. The maximum latency can be close to 500 ms. Since an absolute low latency is almost impossible to get over the mobile network, we should consider a certain level of confidence. For example, 95% of all packets should be below a certain value (Table 3).
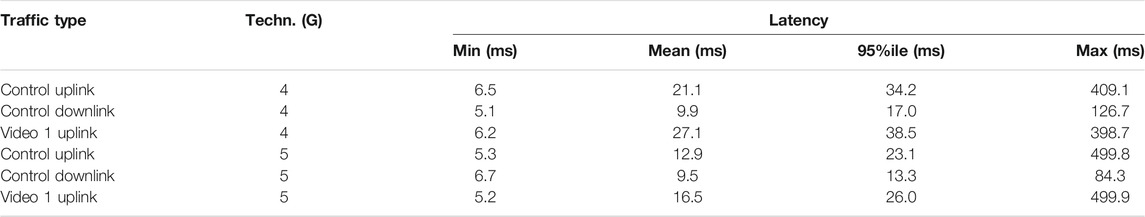
TABLE 3. Connectivity results for the different traffic types and networks/technologies.
The average bandwidth of the data streams (mainly the video) was around 25 Mbit/s. Only very little packet loss was experienced on the video streams, which is handled properly by the application. In case any packet loss was encountered, this was mainly due to a lack of line of sight between the base station and the vehicle. Since these tests were done using a connection to one base station, this problem was encountered more in times of the year with foliage blocking the signal. We performed tests to check the coverage separately.
3.2.2 Slalom Test Results
The slalom test has been designed to test the stability of the system from a vehicle dynamics point of view. By driving at a predefined constant speed in a predefined route around cones, the driver is required to keep the vehicle as stable as possible in order to complete the track. Since this test is designed to compare real use case situations, the remote drivers and manual drivers in the vehicle are requested to stay on speed. Therefore, we use a significant ramp-up of 80 (m) in order to get to the required speed, after which the slalom starts, and the drivers have to keep the speed constant. Since a slalom mimics a typical sine wave, similar evaluation metrics can be applied to evaluate the differences between multiple slalom tests. In our case, we are not considering a time-invariant sine wave but a position invariant sine wave. Any constant time delay will show a sort of phase shift in the vehicle position, where the sine wave (slalom in this case) is shifted in the x-direction. Additionally, an unstable system will show an increase in both x- and y-directions. Since this is a comparison based on vehicle position, the RTK-GNSS signal is converted to Universal Transverse Mercator (UTM) in order to evaluate the x–y coordinate system. Since the slalom tracks are not an ideal sine wave, we compare mainly the x-position of the peaks of each of the runs with the benchmark (manual drive) and their shift with respect to the original cone positions. By taking the median over 10 runs each (Figure 9) and measuring the distance in the offset of the peaks in each slalom with respect to the cone, we can evaluate the influence of the delay caused by the entire pipeline (including communication delay, processing delay, and also reaction time of the remote driver). For the slalom evaluation, in total, 20 manual-driven runs (one driver), 50 runs on 4G (only two remote drivers), and 82 runs on 5G (three remote drivers) have been used for the evaluation.
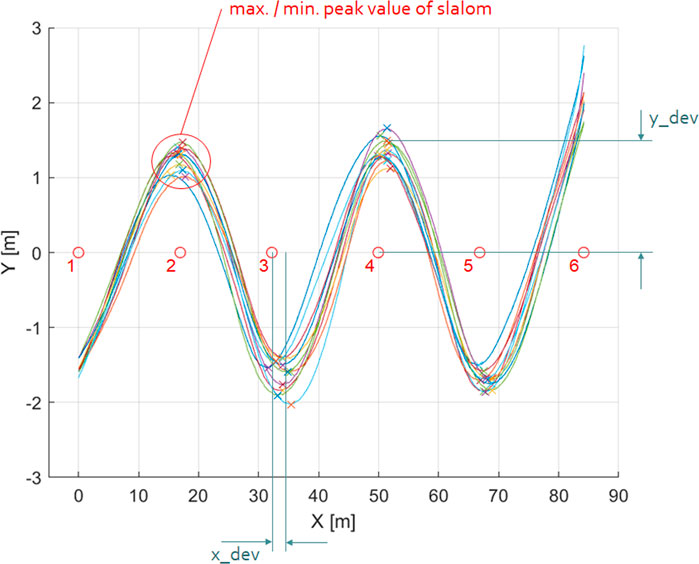
FIGURE 9. Example of 10 runs of slalom at 10 km/h using remote station A and vehicle 2. Global navigation satellite system (GNSS) has been converted into Universal Transverse Mercator (UTM) coordinate system to make a comparison in the x–y frame.
Quantitatively, we evaluate these differences in peaks between manual drivers and remote drivers in Figure 10 showing the deviations in the x- and y-directions, for all the runs and for 3 different drivers for all tested speeds. For evaluation purposes, we show here the normalized distance to the benchmark (manual drive) to indicate the difference, instead of the absolute distance to the cones. Note that at 40 km/h, driver 3 was unable to perform these tests successfully on both 4G and 5G, without deviating from the track before cone 6 was passed. Similarly, driver 2 was not able to do so as well on 4G but managed to perform the tests on 5G instead. And driver 3 was also not able to perform the tests on 4G at 30 km/h. When comparing the absolute distance to the cones, the manual-driven vehicle (red x-marks) almost always starts turning in before the vehicle is passing the cone (GNSS location of the vehicles is at the rear axle), indicated by the negative x-value, whereas almost all remote-driven actions are after the cone has been passed (indicated by positive x-values) (not shown in Figure 10 but evaluated separately).
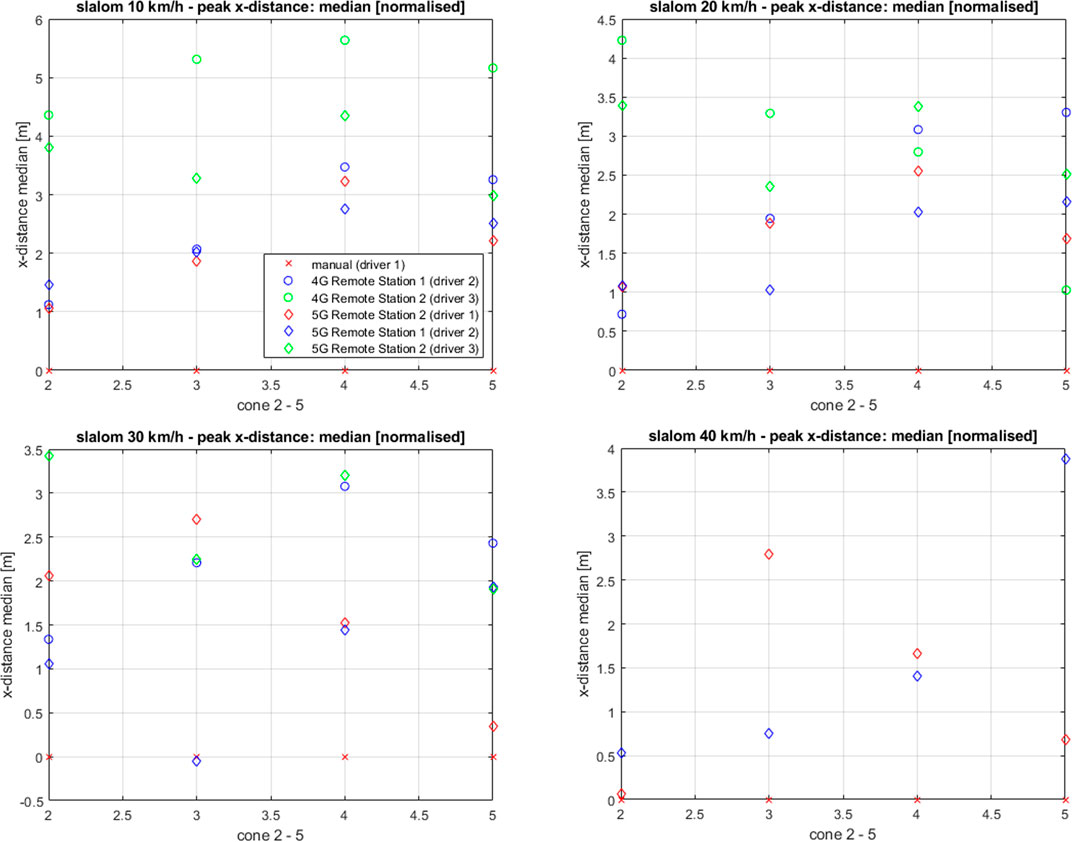
FIGURE 10. Deviation in x-distance from remote drivers with respect to the manual driver at 10, 20, 30, and 40 km/h (normalized to the x-position of the manual driver). Driver 1 has driven the vehicle manually as well as remotely to provide a benchmark.
From Figure 10, it is clear to see that all (except one outlier: driver 2 at 30 km/h at cone 3) remote-driven vehicles had a significant position delay with respect to the benchmark. Also, the difference between 4G and 5G can be seen; however, it is unclear if this is caused by the minimized communication delay or by the increased experience of the drivers. Additionally, there is an important difference between drivers, where drivers 1 and 2 have a relatively similar driving style [reflected in their deviations with respect to the manual driver are within 1 (m) of each other], whereas driver 3 keeps much more distance from the cones [for example, 1.4(m) ≤ y-distance ≤ 2.7(m)]. Note here that the manual driver typically already starts turning in before the cone, whereas in almost all cases, the remote drivers are actually turning after having passed the cones.
As an example, at 10 km/h with driver 3 on 4G, these deviations in x-distance indicate a possible time delay between seeing the cone and actual steering of approximately ranging between (4.3[m] and 5.7[m]), which would account at a speed of 10[km/h] = 2.78[m/s] for a time delay ranging from 1.55 to 2.05[s] with respect to manual driving the vehicle in case of driver 3 (worst case). Interestingly, however, this deviation seems to decrease at higher speeds, indicating that the reaction time of the remote driver seems to be shorter at higher speeds, indicating a more focused drive style. The cause of this delay needs to be further evaluated.
Qualitatively, the remote drivers mentioned they did notice a small delay compared with normal driving, but they could perform the maneuvers without actual real problems. It is noted that the remote drivers had a learning curve to get familiar with the driving of the vehicles remotely, especially when switching between the two vehicles using the fleet management system. All tests were executed with safety drivers on board. The safety drivers also noticed a delay in the reaction from the remote driver, confirming the above results.
4 Discussion
4.1 Measured Latency
The current implementation of the 5G test network does show an improvement in latency. However, considering the complete closed-loop delay of the system, this improvement is of only minor influence. Since these drive tests were also conducted under safety-critical conditions, any visible packet drops (by frame dropping at the remote station side) were considered a safety-critical situation and reason to abort the tests and therefore not taken into consideration for the results of Section 3.2. Therefore, the results of the drive tests show only situations, in which little to no bandwidth limitations were encountered and can therefore be possibly biased towards ideal network conditions. The latency measurements also show a certain baseline in performance. Further testing and research should lead to an indication to the following:
• the needed level of robustness of the network (how much of all traffic should be received below a certain latency threshold)
• how the network performance can be guaranteed (essential 5G technologies)
The other latencies caused by the processing, decoding, and encoding of data (Figure 1) are currently a larger bottleneck. There is however a balance between improving the processing, decoding, and encoding and improving the network communication bandwidth (by, for example, applying slicing for safety-critical applications such as remote driving). If, for example, the bandwidth on the network side can be improved or at least ensured, by, for example, use of slicing, the processing delay can be lowered, by not having to encode and decode the video stream. Further testing is planned to evaluate the increase of resolution on the bandwidth restrictions, and parallel testing using slicing to counteract this phenomenon will be performed as well.
4.2 Driving Behavior and User Interface
Since remote driving is per definition adding delay into the entire driving experience (Figure 1, with additional video encoding/decoding, network delay, etc., with respect to normal driving), it is difficult to evaluate any performance on the entire system without taking out of the loop the actual driver [who accounts for already 500–1,000 (ms) in this pipeline]. The delay in vehicle maneuvering can be caused by total processing delay, but also by the limitations in the user interface, making it more difficult for the remote driver to actually maneuver the vehicle as a normal driver would. Further research is needed to evaluate any correlation between camera positions, video resolutions, and the influence of lack of tactile and audible feedback to the remote driver (the current setup is limited to mainly visual feedback). The correlations between outliers in the network latency, where measurements showed incidental peaks of almost 500 (ms), having influence on the driver behavior is unlikely since the vehicle dynamical bandwidth of the vehicle system is far lower than these very incidental (and therefore very low frequent) peaks. Of course, this becomes a larger issue when the network is flooded with many of these applications, so research should be done on this. Further evaluation on its effect is required to conclude any influence.
Data Availability Statement
The raw data supporting the conclusion of this article will be made available by the authors, without undue reservation.
Ethics Statement
Written informed consent was obtained from the individual(s) for the publication of any potentially identifiable images or data included in this article.
Author Contributions
JO, VH, TS, IP, JJ, SR, and GK contributed to the conception and design of the study, set up of the tests, and execution of the tests and its evaluation. VH evaluated the HiL setup and simulations. GK evaluated the 4G/5G network performance. JJ developed the remote driving application, GK and IP implemented the network, and VH and JO with SR implemented the remote driving stations. JO/IP wrote the first draft of the manuscript. JO, VH, TS, IP, JJ, SR, and GK wrote sections of the manuscript. JO and TS evaluated the slalom test. All authors contributed to manuscript revision and read and approved the submitted version.
Funding
This work has been executed as part of the European Union’s Horizon 2020 project 5G-MOBIX under grant agreement no. 825496.
Conflict of Interest
VH and IP were employed by the company Siemens Industry Software Netherlands. TS was employed by the company AI in Motion. GK was employed by the company KPN. JJ was employed by the company Roboauto.
The remaining authors declare that the research was conducted in the absence of any commercial or financial relationships that could be construed as a potential conflict of interest.
Publisher’s Note
All claims expressed in this article are solely those of the authors and do not necessarily represent those of their affiliated organizations, or those of the publisher, the editors, and the reviewers. Any product that may be evaluated in this article, or claim that may be made by its manufacturer, is not guaranteed or endorsed by the publisher.
References
5 GAA (2020). C-V2X Use Cases Volume II: Examples and Service Level Requirements – 5G Automotive Association. Tech. Rep. München, Germany: 5GAA Automotive Association.
BSI (2020). PAS 1883:2020 Operational Design Domain (ODD) Taxonomy for an Automated Driving System (ADS) – Specification. Tech. rep. London, United Kingdom: The British Standards Institution.
Chan, C.-Y. (2017). Advancements, Prospects, and Impacts of Automated Driving Systems. Int. J. Transportation Sci. Tech. 6, 208–216. doi:10.1016/j.ijtst.2017.07.008
Chandramouli, D., Liebhart, R., and Pirskanen, J. (2019). 5G for the Connected World –| Wiley (Wiley)
Czarnecki, K. (2018). Operational Design Domain for Automated Driving Systems - Taxonomy of Basic Terms. Tech. Rep. doi:10.13140/RG.2.2.18037.88803
Dadhich, S., Bodin, U., and Andersson, U. (2016). Key Challenges in Automation of Earth-Moving Machines. Automation in Construction 68, 212–222. doi:10.1016/j.autcon.2016.05.009
Georg, J.-M., Feiler, J., Hoffmann, S., and Diermeyer, F. (2020). “Sensor and Actuator Latency during Teleoperation of Automated Vehicles,” in 2020 IEEE Intelligent Vehicles Symposium (IV) (IEEE), 760–766. doi:10.1109/iv47402.2020.9304802
Gnatzig, S., Chucholowski, F., Tang, T., and Lienkamp, M. (2013). A System Design for Teleoperated Road Vehicles. ICINCO (2), 231–238. doi:10.5220/0004475802310238
Lane, J. C., Carignan, C. R., Sullivan, B. R., Akin, D. L., Hunt, T., and Cohen, R. (2002). “Effects of Time Delay on Telerobotic Control of Neutral Buoyancy Vehicles,” in Proceedings 2002 IEEE International Conference on Robotics and Automation (Cat. No. 02CH37292) (IEEE) (IEEE) 3, 2874–2879.
Neumeier, S., Wintersberger, P., Frison, A.-K., Becher, A., Facchi, C., and Riener, A. (2019). “Teleoperation: The Holy Grail to Solve Problems of Automated Driving? Sure, but Latency Matters,” in Proceedings of the 11th International Conference on Automotive User Interfaces and Interactive Vehicular Applications, 186–197.
Passchier, I., Ho, V., den Ouden, J., van der Smagt, T., Kakes, G., and Juza, J. (2021). “Remote Operation of Automated Vehicles via 5G Networks,” in 27th ITS World Congress (Hamburg, Germany, 11–15. October 2021.
Ploeg, J., Scheepers, B. T. M., van Nunen, E., van de Wouw, N., and Nijmeijer, H. (2011). “Design and Experimental Evaluation of Cooperative Adaptive Cruise Control,” in 2011 14th International IEEE Conference on Intelligent Transportation Systems (ITSC) (Washington, DC, USA: IEEE), 260–265. doi:10.1109/ITSC.2011.6082981
SAE (2021). Taxonomy and Definitions for Terms Related to Driving Automation Systems for On-Road Motor Vehicles - J3016_202104. Tech. Rep. Society of Automotive Engineers. doi:10.4271/J3016202104
Keywords: remote driving, teleoperation, field trials and test results, connected and automated vehicles, network performance and architecture, application performance analysis, 5G, connected, cooperative and automated mobility
Citation: den Ouden J, Ho V, van der Smagt T, Kakes G, Rommel S, Passchier I, Juza J and Tafur Monroy I (2022) Design and Evaluation of Remote Driving Architecture on 4G and 5G Mobile Networks. Front. Future Transp. 2:801567. doi: 10.3389/ffutr.2021.801567
Received: 25 October 2021; Accepted: 24 November 2021;
Published: 11 January 2022.
Edited by:
Ignacio Soto, Universidad Politécnica de Madrid, SpainReviewed by:
Thomas Deinlein, University of Erlangen Nuremberg, GermanyOscar Amador Molina, Halmstad University, Sweden, Sweden
Copyright © 2022 den Ouden, Ho, van der Smagt, Kakes, Rommel, Passchier, Juza and Tafur Monroy. This is an open-access article distributed under the terms of the Creative Commons Attribution License (CC BY). The use, distribution or reproduction in other forums is permitted, provided the original author(s) and the copyright owner(s) are credited and that the original publication in this journal is cited, in accordance with accepted academic practice. No use, distribution or reproduction is permitted which does not comply with these terms.
*Correspondence: Jos den Ouden, ai5oLnYuZC5vdWRlbkB0dWUubmw=