 Felix Ressi
 Christoph Leo
 Corina Klug
 Wolfgang Sinz
- Vehicle Safety Institute, Graz University of Technology, Graz, Austria
Novel seat positions enabled by self-driving cars have been investigated in various studies in recent years. However, there is little research on the effect of increased rearward seat adjustments. To predict challenges associated with the possibility to move the seat further backwards in the car than currently possible as driver, appropriate methods have to be defined. A detailed human body model, a THUMS v4.1 in particular, tissue-based injury risk evaluation methods, a generic vehicle interior and a Latin hypercube design of experiments taking the variability of real-world crashes into account was established. In a first step, 200 simulations at current representative seat positions and a driving occupant posture were performed. The results were then compared to field data from an accident database to evaluate the accuracy of the method. The predictions exceeded the injury risks for the abdomen, head, and upper extremities, while underestimating the risk for thoracic and lower extremity injuries. A good match was observed for injuries of the neck and spine. In a second step, the 200 simulations were run again, but with the seat adjusted rearwards significantly. In this seat configuration, with the exception of the head and the upper extremities, increased injury risks were predicted for all body regions. The highest increases affected the lower extremities (+28%)—predominantly pelvic fractures—and the neck (+9%). In addition, (partial) submarining occurred in almost 50% of cases with the rearward adjusted seat—as opposed to none in the conventional seat position. The established method could be used in future studies to design safety measures addressing these identified potential safety risks.
1 Introduction
Car occupants still account for 64% of road traffic fatalities in the United States (US) and 48% in Europe respectively (WHO, 2018). Not having met the previous goal of halving road traffic fatalities between 2010 and 2020 (European Commission, 2021), the European Union (EU) has set an even more ambitious goal for 2050: “Vision Zero,” i.e., zero road fatalities and no serious injuries (European Commission, 2018). Likewise, the US have recently adopted a road safety vision striving to eliminate crashes which result in death or serious injury (US DOT, 2022). While such considerable reductions will not be achieved with measures in a single area, institutions in Europe and the United States have emphasized the important role automated vehicles could play in increasing road safety (UNECE, 2018; NSTC and US DOT, 2020). While ideally, they should avoid all accidents, in reality, accidents will still occur (Milakis et al., 2017). Therefore, they need to provide a high degree of passive safety for their occupants—at least equivalent to that of conventional, modern passenger cars (NHTSA, 2022). This can be seen as a kind of fallback in case a crash occurs. However, automated vehicles potentially pose a particular challenge to the same passive restraint systems, which are designed to provide the occupant safety fallback. Aside from the expected safety benefits, automated vehicles also enable drivers to take novel seat positions when there is no need for them to control the vehicle (Poulard et al., 2020). Examples for such positions include seats rotated about the z-axis, more reclined backrests or seats which are moved rearwards, away from the vehicle controls. Some of these possible configurations are already available to passengers in conventional vehicles. In a recent study, which analyzed in-car videos, passengers were found to position their seat “full-rear on the seat track 23% of the time and rearward of the mid-track position in 92% of frames” (Reed et al., 2020). Assuming that occupants on the driver’s side, who are not engaged in driving the vehicle, behave similar to passengers in conventional vehicles, this highlights the relevance of the large rearward adjustments for occupants in automated vehicles. While it is believed that this change in occupant position could affect restraint system performance in frontal collisions (Ressi et al., 2019; Reed et al., 2020), the effects of this seat adjustment on occupant injury risk are currently not fully understood.
In a simulation study, Laakmann et al. (2019) demonstrated increased injury measures in what they refer to as “working position.” Here, the seat was put in its rearmost position and the backrest was reclined by an additional 15° from its 25° standard configuration. Therefore, the effect of the longitudinal adjustment cannot be isolated from these results. An anthropomorphic test device (ATD) was used to model the occupant and assess injury metrics. Compared to the standard driving position, the injury assessment metrics for the head, neck, acetabulum, and the tibia increased the most. By updating the restraint systems (most notably the seat design and airbag geometry), the authors showed that with the exception of the tibia bending moment all considered injury measures could be lowered below their respective upper performance limits as proposed for the updated US NCAP tests (NHTSA, 2015). In the study, the occupant is modelled using a THOR ATD. Studies have shown limitations when using crash test dummies for evaluations in novel seat configurations, even when using this state-of-the-art device (Poulard et al., 2020).
In a study focusing on kinematics and the occurrence of submarining, Gepner et al. (2019) investigated the influence of various combinations of backrest recline angle and knee bolster (KB) position. The different KB positions can also be thought to represent different longitudinal seat adjustment relative to a fixed KB. To model the occupant, a human body model was used. Specifically, three anthropometries (female 5th, male 50th, and male 95th percentile) of the Global Human Body Model Consortium’s occupant simplified (GHBMC-OS) model. With the backrest in the upright position, no submarining occurred for any of the three anthropometries in any KB configuration (near, standard, far, and no KB). Due to the chosen modeling approach, which detaches the knee bolster from the interior to represent different seat configurations by means of altered KB positions, the feet are always in the same position relative to the footwell. In reality, if different distances to the KB are the result of longitudinal seat adjustments, they are also going to lead to different distances between the feet and the footwell. This in turn would influence the loading of the lower extremities and subsequently the whole occupant. The driver side was not investigated in the study, as focus was set on the passenger side.
At least in the United States, vehicles are currently exclusively occupied by a driver 58% of the time (Reed et al., 2020). The self-driving mode offered in the first self-driving vehicles on the market is only going to be available in certain conditions, meaning the driver’s seat is still going to be occupied in any case. This underlines the importance of addressing the driver’s side too—particularly in case the vehicle’s controls are not retracted when it is in self-driving mode.
In previous studies, mainly crash pulses from rigid wall crash tests were applied. While it can be argued that this kind of load case is well understood and widely used to represent a kind of worst case, it also only represents a single scenario (a full overlap high severity collision). Since they are the basis for occupant safety assessments, the restraint system parameters are usually optimized for these load cases. Investigating a broader range of possible scenarios in such simulation studies could improve the understanding of injury risks in load cases which are not a core part of the vehicle performance specifications. Also, robust occupant protection in these non-standard scenarios could be essential when considering the goal of eliminating road traffic fatalities and serious injuries, i.e., “Vision Zero” (European Commission, 2021; US DOT, 2022).
A previous study, aiming to replicate the injury frequencies found in a dataset from the Initiative for Harmonization of Global In-depth Traffic Accident Data (IGLAD) with a human body model (HBM), included a range of frontal crash pulses (Ressi et al., 2020). A Total Human Model for Safety (THUMS) v4.02 adult male 50th percentile (AM50) HBM was positioned in a generalized vehicle interior with varied restraint system parameters and subjected to various crash pulses. While the relative frequencies of injuries to the spine and the lower extremities predicted by the HBM (strain-based assessment of cortical bone fracture) matched the injury prevalence in the real-world accident sample well, this was not the case for all body regions. Particularly for the brain and the internal organs, the strain-based criteria used in the HBM (strain thresholds of 0.3 and 0.4 were used) overestimated the injury frequency found in the real-world data. Although the vehicle interior model used in the study was generalized, it was a proprietary model provided by an OEM. A number of model input parameters were varied to account for differences in the vehicle fleet. Nevertheless, a more generic average vehicle interior would be an ideal basis in this context. Furthermore, while a range of crash pulses was used, they were based on rigid wall crash tests. In their discussion, the authors acknowledged that using crash loads from real-world collisions is likely to represent an improvement (Ressi et al., 2020).
In conclusion, there are several studies (even beyond the ones cited above) addressing specific issues related to the effects of large rearward seat adjustments on occupant safety. What is lacking though, is a more generic perspective, enabling a broader understanding of the occupant safety related challenges, which novel seat configurations like increased rearward adjustments could imply. The present study introduces an approach which aims to estimate these challenges by addressing the following key points:
• Utilization of a generic vehicle interior (GVI) representing a driver’s side, combined with a
• Detailed human body model, enabling tissue-based injury prediction, subjected to a
• Broad range of real-world loading conditions instead of crash test load cases, facilitating the
• Investigation of the effects of various generic seat adjustments with
• Comparisons to injury rates derived from real-world accidents.
2 Materials and methods
An overview of the methods used in the present study is shown in Figure 1.
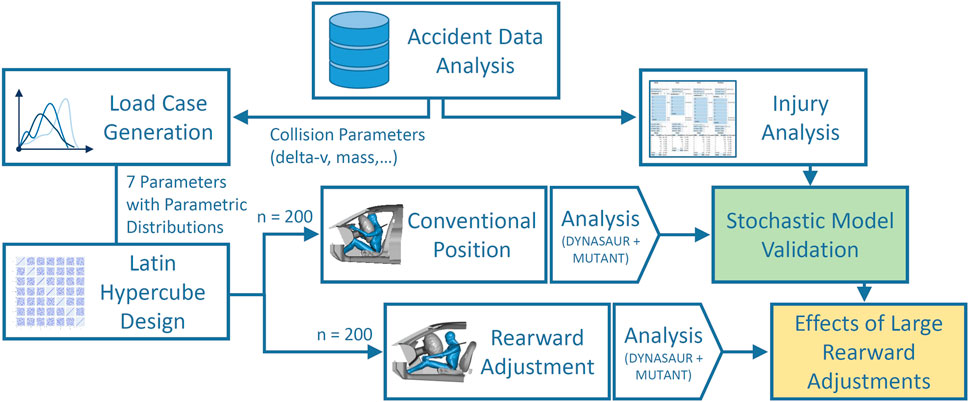
FIGURE 1. Graphical representation of the approach of the present study.
Initially, data from the Initiative for Harmonization of Global In-depth Traffic Accident Data (IGLAD) accident database were analyzed. Filters were applied and the remaining cases were analyzed with respect to the most severe injuries occurring in each body region. In a separate analysis, parametric distributions were fitted to the collision parameters (e.g., delta-v, mass) of these cases. Additional parameters, representing the variability in the restraint systems (e.g., the airbag trigger time), with their respective distributions were derived from literature. In total, seven parameters were then combined in a Latin hypercube design resulting in 200 individual parameter combinations. In the first simulation phase, these 200 cases were run with the human body model (HBM) in a generic interior model (GVI) in a conventional seat configuration. The results of these stochastic simulations were then analyzed and the HBM injury predictions were compared to the injury analysis based on the IGLAD sample. Hence, the accuracy of the HBM-based injury prediction for different body areas was evaluated. Subsequently, in the second simulation phase, the simulations were run again. The same parameters were re-used, apart from the seat position. The latter was varied between 150 and 250 mm rearwards of the conventional position, representing a novel seat configuration enabled by self-driving cars. In the final step, the results from the HBM injury predictions of the two sets of simulations were compared. Based on this analysis, the protection challenges in seat positions with large rearward adjustment in frontal collisions were estimated. The following sections describe the individual steps in more detail.
2.1 Accident data analysis
IGLAD data from 2007 until 2019 were used as the basis for the accident data analysis. The sample was filtered similarly to the previous study (Ressi et al., 2020). Specifically, only cases with two participants, at least one of them being a passenger car were included. Only frontal collisions (main deformed vehicle area: front) with other passenger cars, SUVs, vans or light trucks were considered. Filters were also applied to only include cases with a principal direction of force (PDOF) between 11 and 1 o’clock and exclude cases with small-overlap (i.e., cases without engagement of the longitudinal beams), unknown change in velocity due to the collision (delta-v) or unknown vehicle mass. Collisions where rollover occurred were not considered. The cases were then filtered for belted male drivers. This resulted in 694 cases, 52 of which were dropped because no information of the maximum injury severity according to the abbreviated injury scale (MAIS) (Association for the Advancement of Automotive Medicine, 1998) per body region was available. A Weibull distribution was fitted to the delta-v values of the remaining cases using python (v3.9, library “Reliability Engineering toolkit for Python” v0.8.1). Figures and parameters are provided in Supplementary Material. Subsequent to the parameter identification for the delta-v distribution, the sample was filtered further, to only include cases within a certain delta-v range for the injury assessment. Specifically, only cases with delta-v between 26 and 68 km/h were considered. The reason behind setting a lower threshold was to create a consistent dataset, to which the finite element simulations (described in Section 2.2) could be compared to. The median delta-v value in the IGLAD sample was found to be 26 km/h. However, based on other studies, injury risks for delta-v below this value are expected to be only minor. For instance, Weaver et al. (2015) reported a maximum of 4% AIS2+ risk at this delta-v. Therefore, our focus was on the upper half of the data and 26 km/h was selected as the lower boundary for the simulations. The upper limit was chosen to exclude cases in which delta-v was above the values typically found in crash test data. To get an estimate for a suitable limit, data from moderate overlap crash tests from the Insurance Institute for Highway Safety (IIHS) were analyzed. In these tests, the vehicle impacts a deformable barrier at 64.4 km/h with an overlap of 40% (IIHS, 2021), representing a vehicle to vehicle collision (IIHS, 2022). The mean delta-v observed in the 43 analyzed tests was 68 km/h, which was subsequently chosen as an upper threshold for the further analysis. Additionally to setting the upper delta-v threshold, cases with large intrusions were omitted as this was out of scope for the current study focusing on potential risks for rearward adjusted seat positions. Specifically, this was based on the value of the maximum extent of penetration, as defined by the Collision Deformation Classification (CDC) and cases above extent 5 were excluded.
The remaining 290 cases were then used to derive the two other distributions needed for the stochastic simulations. A Weibull distribution was fitted to the vehicle mass and a normal distribution was fitted to the PDOF (figures and parameters provided in Supplementary Material). All cases were assessed with respect to the struck side of the collision partner. The collisions were divided into three groups, depending on whether the front of the striking passenger car struck the opponent in the front (F2F), the side (F2S) or the back (F2B). With 50.9%, the majority of collisions were in the F2F configuration, followed by F2S (38.6%) and F2B (10.5%) collisions.
With all filters applied, the MAIS injuries of the 290 drivers in the sample were analyzed at body region level. In order to obtain relative MAIS + injury frequencies for each body region, the number of MAIS injuries at each level (MAIS6 up to MAIS1) was cumulated and divided by the total number of cases.
Finally, the age distribution in the sample was determined in order to aid age-based injury assessment. A majority of 60% of drivers in the real-world sample was between 17 and 41 years old, 26% between 41 and 65 and 14% were between 65 and 89 years of age. A histogram illustrating this distribution is provided in the Supplementary Material.
2.2 Stochastic finite element simulations
2.2.1 Generic vehicle interior
To model the vehicle, an available open-source generic vehicle interior (GVI) model (Iraeus and Lindquist, 2016) obtained from the openVT platform was used. The model was originally derived from laser scans of 14 cars and validated with their respective crash test data to analyze driver rib fractures in nearside oblique frontal accidents (Iraeus, 2015; Iraeus and Lindquist, 2016). Variants of the model have since been used to analyze the influence of crash pulse parameters on rib fractures (Iraeus and Lindquist, 2020) and study rib fracture risk as a function of age and rib strain (Larsson et al., 2021). For use in the present study, a number of modifications were made to the model. As only (oblique) frontal collisions were modelled in the present study, the parts used to model lateral collisions and lateral intrusions into the occupant compartment were removed. This resulted in a run time reduction of about 50%, which lead to an approximate total run time between 6:45 and 7:15 h on 32 cores for a simulation duration of 150 ms. Details on the hard- and software used in the present study are provided in the Supplementary Material. While the model can simulate intrusions into the passenger compartment by moving the end of the footwell towards the occupant, no cases with intrusions were considered in this study. Therefore, the open section on the inboard side of the footwell, which could accommodate for the deformations of the footwell material, was closed with elements of the same material as the footwell part. This was a precautionary measure to avoid contact instabilities in case the HBM feet were to slip into the crevice in simulated far-side oblique collisions.
2.2.2 Crash pulse generation
The application of crash loads in the GVI was modelled as a prescribed motion of the body in white. This means the model is accelerated in positive X direction (against the driving direction) as determined by the crash pulse from a standstill, similar to an inverse sled test.
A crash pulse can be calculated within the GVI model, based on a regression model derived from real-world crash data (Iraeus and Lindquist, 2015). The calculation uses an average crash pulse, to which five individually scaled eigenvectors are added. The resulting pulse is then scaled to the delta-v and crash pulse duration used for the current crash configuration. In their study, they also detail the regression models for each of the five eigenvalues which are used to scale the eigenvectors (Iraeus and Lindquist, 2015).
In the present study, only the normal distribution (which is a result of the regression model) for the pulse duration was considered (Table 1). For the eigenvalues, the means of the normal distributions from Iraeus and Lindquist (2015), calculated based on their respective regression models, were used. Only car-to-car collisions were considered in the present study, hence the IGLAD sample was filtered accordingly. Since no information on crash pulse duration was available in the IGLAD data, this parameter was estimated based on the regression model published by Iraeus and Lindquist (2015). For the vehicle mass, the parametric distribution derived from IGLAD was used.
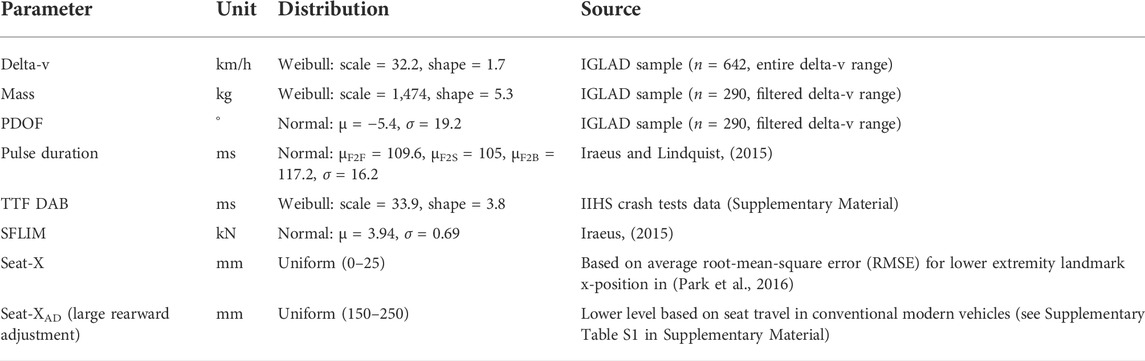
TABLE 1. Stochastically varied input parameters in the FE simulations.
2.2.3 Stochastic variation of input parameters
To approximate the average behavior of the vehicles in the IGLAD sample, seven input parameters for the model were varied stochastically. These were selected because they were found to have the highest practical significance in the original model (Iraeus, 2015) or were necessary as input for the pulse generation (mass). Table 1 lists these input parameters for the model and their respective properties.
Parametric distributions were used to specify the individual parameters. As described in Section 2.1, parametric distributions for delta-v, mass, and PDOF were derived from the filtered IGLAD sample. The parameters for the crash-pulse are described in the previous section.
No information on shoulder belt force limits (SFLIM) or airbag trigger times (time to fire driver airbag, TTF DAB) is included in the IGLAD data. Hence, the distribution for the shoulder belt force limit was adopted from the original GVI publication (Iraeus, 2015) and the trigger time distribution was approximated based on a set of moderate overlap crash tests (see Supplementary Material for details). Hence, the airbag deployment times for each simulated collision were selected without considering collision parameters (e.g., delta-v, time-history curves of acceleration, etc.). This does obviously not reflect how real-world airbag control units (ACUs) work. The algorithms determining whether (and when) to deploy airbags are proprietary and to the best knowledge of the authors, no generic ACU algorithm validated with real-world collisions is available in literature. While in a previous study, a simple algorithm derived from rigid wall crash test data was presented (Ressi et al., 2020), it did not produce satisfactory results with the moderate overlap crash test data and was therefore rejected for the present paper. In a recent study using the GVI, the airbag TTD was estimated using the median value derived from event data recorders (Iraeus and Lindquist, 2020). Since the TTD values observed in the 43 moderate overlap crash tests varied between 16 and 52 ms for the same well-defined collision scenario (i.e., identical initial velocity, overlap, and barrier configuration), a random TTD selection was deemed more realistic for the present study than a single median value for all cases.
The final input parameter was the longitudinal seat position (Seat-X). For the initial set of simulations, to account for variation in the exact seat position, the seat (with the HBM) was moved rearwards up to 25 mm from the initial position. This maximum value was based on the regression model used for the posture prediction. The model specifies a root-mean-square error (RMSE) in X direction for each landmark. The RMSE values for the lower extremity landmarks (ankle, knee, and hip) are 21.8, 23.4, and 31.5 mm respectively. On average, this amounts to about 25.6 mm, which was rounded down to 25 mm. The seat adjustment was not modelled as a pure X displacement, but rather along the direction of the floor, which rises from the rear towards the front at an angle of approx. 2.8°. This angle can clearly be seen in Figure 2B. By applying the seat adjustment this way, intersections between the shoes and the floor can be avoided without the need to reposition the HBM. To avoid having to create a new belt fit for each of these seat positions, a simplification was made in moving the entire seat belt assembly with the seat and the occupant. While in reality, the shoulder belt routing would change slightly in each of the seat positions behind the initial position, the influence at a maximum seat movement of 25 mm was regarded to be negligible.
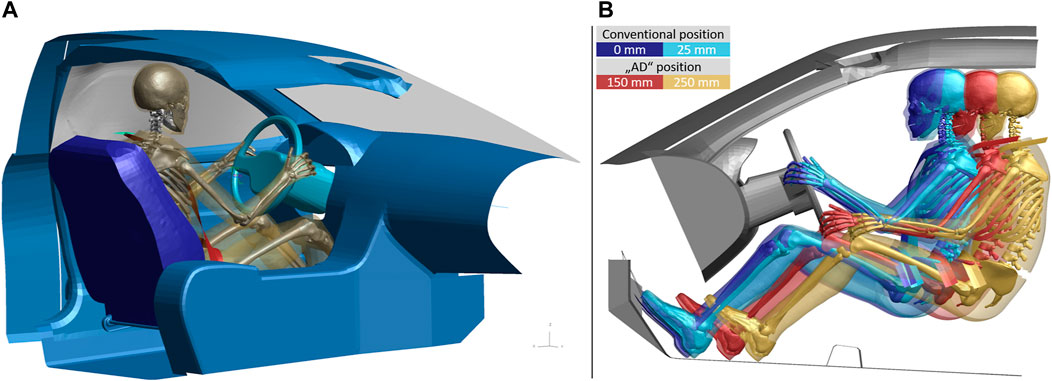
FIGURE 2. (A) Complete GVI model with the positioned HBM. (B) Visualization of posture differences and possible adjustment ranges for the simulations of the conventional seat position (blue and cyan HBMs on the left) and the large rearward adjustments (red and orange HBMs on the right). All distances given relative to the conventional position. Note that only the HBM’s bony structures and parts of the skin are visualized for illustrative purposes.
To create the population of stochastic simulations, a maximum projection Latin hypercube design (LHD) (Joseph et al., 2015) was created based on the seven parameters listed in Table 1. A matrix size of 200 combinations was chosen, which corresponds to almost three times the recommended minimum number of at least ten characteristic values per variable (Peduzzi et al., 1995). It was created using the MaxProLHD function (Joseph and Ba, 2018) implemented in R (R software, version 4.0.3; MaxPro package version 4.1–2). This function aims to achieve a uniform space filling (i.e., distribution of parameters) in the multi-dimensional design space (Joseph et al., 2015). The resulting design matrix contains 200 combinations of the seven specified continuous input factors, with the individual values for the factors taking values between zero and one. To use this design as input in the FE simulations and account for the respective parametric distributions, the factors had to be mapped to the values of the input parameters based on their respective cumulative distribution functions (CDFs) with the exception of the seat position. For the latter, the factor was scaled uniformly within the boundaries of the seat adjustment (conventional/self-driving), to obtain the desired position range. Since the normal distribution for the pulse duration depends on the collision type, the simulation matrix was randomly divided into three sub designs before the mapping—one for each collision type (F2F, F2S, and F2B). To map the results of the IGLAD sample to the simulations, the number of cases for each collision type was based on the respective share observed in the 290 real-world accidents (50.9%, 38.6%, and 10.5%). To take the filter range for the delta-v values into account, the respective mapping was preceded by an additional step. Prior to the mapping based on the CDF, the CDF probabilities for the lower and upper limits were determined. These were then used to scale the delta-v factors in the LHD from values between [0, 1] and [0.49, 0.96]. A plot illustrating this procedure as well as scatter plot matrices of the simulation parameters are provided in the Supplementary Material.
2.2.4 Simulations with large rearward adjustment in self-driving cars
For the simulations with large rearward adjustments of the seat, the exact same parameter combinations for the collision and the restraint systems as for the initial simulation set were used again—except for the seat adjustment. This can be thought of as the same collisions re-occurring with the novel seat configuration. To determine reasonable values for the seat rearward adjustment (Seat-XAD in Table 1), for a self-driving car the fore-aft travel of the driver seat of 16 vehicles, tested by the NTHSA in 2021, were evaluated (details provided in Supplementary Material). In these vehicles, the mean fore-aft travel for the driver seat was about 300 mm. This means that in these conventional vehicles, the driver could—on average—move their seat rearwards by 150 mm from the mid position before reaching the end of the seat tracks. Therefore, 150 mm was used as a lower limit for the seat adjustment, as this represents an amount of adjustment which is already available today. An additional 100 mm of rearward adjustment were chosen to define the maximum value of 250 mm. To make the setup more realistic, changes were introduced to the belt mounting and the occupant posture. The seat belt slip ring at the D-ring was positioned from the b-pillar to a position just above and behind the seat back to replicate the D-ring position of a belt integrated seat. While the D-ring was positioned realistically, it was still mounted rigidly to the vehicle structure rather than the seat back. This simplification was made to avoid re-modelling the seat back joint stiffness. In addition to the changes to the GVI, the occupant posture was adapted to reflect these changes. The arm position was changed from the standard driving posture to a relaxed posture. Also, the legs and feet were positioned symmetrically, as opposed to the footrest/accelerator configuration used in the initial set of simulations. Figure 2B illustrates the differences between the two postures and possible adjustment ranges. Note that in this image some parts of the model (including the seat) are hidden to aid the comparison of HBM postures and positions.
2.3 Occupant model
To model the occupant, a detailed finite element HBM was used. The selected model was version 4.1 of the Total Human Model for Safety (THUMS, Toyota Central R&D Labs., Nagakutes) 50th percentile adult male, which is freely available since June 2020 (Toyota Motor Corporation, 2020). According to the manual, the model was developed with LS-DYNA (Ansys LST, Livermore, CA) mpp s R9.2.0 (Toyota Motor Corporation and Toyota Central R&D Labs., 2021). The validation load cases were performed with LS-DYNA mpp s R7.1.3. Since we aimed to perform the simulations using LS-DYNA mpp s R12, the THUMS component validation set was re-run in this environment. Graphs comparing the simulation results of the two solver versions to the experimental data are provided in the Supplementary Material. In most body regions, the results were indistinguishable. The only case showing appreciable deviations from results with the earlier LS-DYNA release was the lateral ball impact to the pelvis (Guillemot et al., 1997). In this test, neither the original simulation results with R7.1.3 nor the simulation results with R12 fit the underlying experimental data perfectly. The loading condition modelled in this test is mostly relevant in side crashes. Since lateral collisions were not considered in the present study, the use of the more recent LS-DYNA release was deemed acceptable. All simulations evaluated for this study were subsequently run on the same hardware on a single computing node utilizing 32 CPUs. This should ensure consistent results with limited numerical noise (Östh et al., 2021). Before including the HBM in the GVI, it was scaled from the original unit system (s-mm-t-N) to the desired unit system (ms-mm-kg-kN) using Oasys PRIMER (pre-processing software PRIMER v18, Oasys Limited).
The HBM position and posture were determined based on a regression model derived from volunteer tests (Park et al., 2016). The seat position was adjusted slightly to match configuration 6 (seat height 270 mm) of the model setups from Park et al. (2016). The anthropometry of the HBM and the median age of the drivers in the IGLAD sample, where age was known (n = 282, 36 years), together with the measurements of relative seat and steering wheel position (which were taken from the GVI) were then fed into the regression model. It consists of two formulas for X and Z position of eight landmarks. Park et al. (2016) also specify the RMSE for each landmark coordinate. A simulation was then set up using the dummy tree file for the THUMS v4.1 model for Oasys PRIMER. The target position for this marionette method positioning simulation (Mohamed and Newlands, 2021) was defined as closely as possible to the regression model landmark positions. The arms were positioned to a standard driving posture. The resulting landmark positions on top of the final HBM posture in the GVI are provided in the Supplementary Material.
Generic shoes from a pedestrian model (Feist, 2018) were added to the HBM feet to achieve a more realistic interaction with the footwell and pedals. For the initial set of simulations, which were aimed at modelling a standard driving posture, the left foot was placed on the foot support and the right foot was placed on the accelerator pedal, which had to be pressed down to avoid intersecting the shoe. Subsequently, the seat was deformed by moving a rigidified version of the HBM in the final posture into the target position, determined by the regression model, and finally the seat belt was fitted. The complete resulting model, ready to be run, is shown in Figure 2A.
2.4 Human body model injury metrics
With the exception of the face, which was not evaluated due to a lack of injury metrics, injury metrics for each AIS body region were used to predict moderate or worse injuries (AIS2, AIS2+). Table 2 lists the used injury metrics, the strain threshold (if applicable) and the respective literature sources.
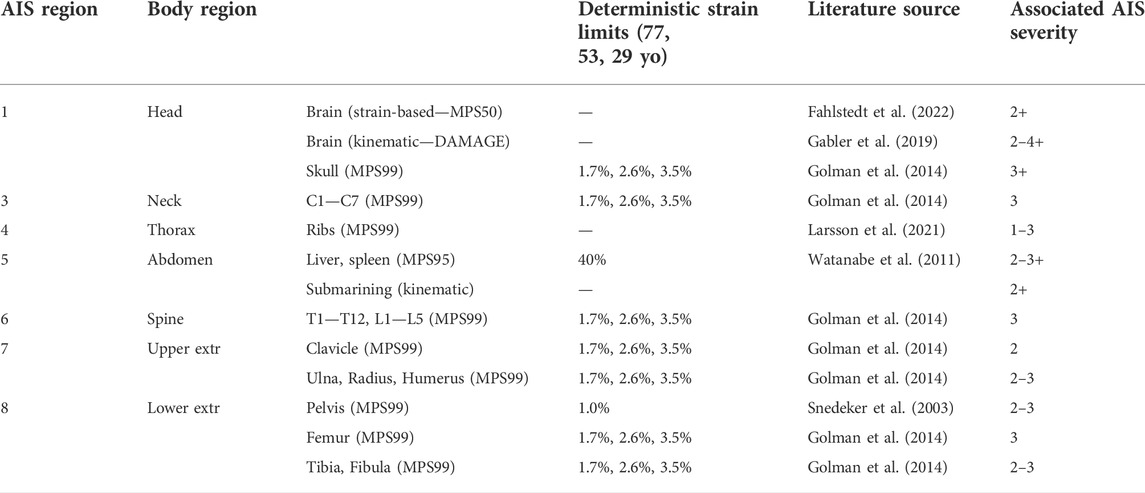
TABLE 2. Injury metrics for the HBM simulations. Strain limits for cortical bones are provided for the ages of 77, 53, and 29 years.
While ideally, all injuries in all body regions would be evaluated using injury risk curves (IRCs), most body regions lack model specific IRCs. As a result, the injury metrics listed in Table 2 are a combination of probabilistic (brain, ribs) and deterministic (other body regions) criteria. In the latter case, a strain limit was used to distinguish between cases with and without injury. In some cases, multiple metrics were defined for one body region (i.e., skull fracture and brain injury for the head or fractures in any cortical long bone of the upper extremities). To ensure consistency with the IGLAD data, which only features data on MAIS per body region, multiple injuries in one body region were summarized to one risk, by using the maximum risk for each parameter configuration. Mostly, strain-based criteria were used, utilizing one of the main advantages of a detailed HBM such as THUMS v4.1. While enabling detailed analyses on tissue level, this also facilitates omnidirectional assessment.
The brain was assessed using the 50th percentile principal strains (MPS50) of the whole brain with the injury risk function (IRF) for mild traumatic brain injury (mTBI) validated for the THUMS (Fahlstedt et al., 2022). Additionally, brain injury was assessed using the kinematics-based diffuse axonal multi-axial general evaluation (DAMAGE) criterion (Gabler et al., 2019). These two criteria were assessed independently, facilitating comparisons of their results.
Cortical bone fractures in the long bones (clavicle, humerus, radius, ulna, femur, tibia, and fibula), vertebrae, pelvis and skull were evaluated using 99th percentile principal strains (MPS99) (Ressi et al., 2020). Three age-dependent strain limits (3.5%, 2.6%, and 1.7%) were derived (Golman et al., 2014) based on the age distribution in the IGLAD sample. The sample was divided into three age groups (17–41, 41–65, and 65–89) and the strain limits were calculated based on the mean ages of these groups (29, 53, and 77).
For pelvic fractures, a 1% strain limit was used; independently of the age group (Snedeker et al., 2003).
For the thorax, only rib fractures were considered. The risk of a specific number of fractured ribs (NFR) was calculated using the probabilistic approach from Forman et al. (2012). The strains used in this evaluation were the maximum tensile principal strains based on the maximum integration point per rib. These were subsequeently converted into an injury risk per rib using an age dependent log-normal distribution (Larsson et al., 2021) and combined to an overall risk of 2 + rib fractures using the binomial function from Forman et al. (2012).
Abdominal injuries were assessed based on strains in liver and spleen using a strain limit of 40% (Watanabe et al., 2011) for the 95th percentile strains (Ressi et al., 2020). Additionally, each simulation was checked visually whether the lap belt moved upwards on the pelvis and slid off the iliac crests. For load cases without intrusions into the passenger compartment, abdominal injuries are mainly attributed to this phenomenon, commonly referred to as submarining (Nakane et al., 2015). Cases in which submarining occurred (even if only on one side), were then associated with abdominal injury. As with the two metrics for brain injury, these two metrics for abdominal injury were assessed independently from each other.
To calculate a relative injury frequency with the deterministic criteria, the number of cases above the strain limit was cumulated and divided by the total number of simulations. For the cortical bones, in order to account for the age dependent strain limits, the number of cases above the strain limit was initially evaluated for each age group separately. Subsequently, a weighted sum (using the respective share of the age group from the field data) was calculated. This sum was then divided by the total number of simulations. To evaluate the injury frequency for the brain, the individual injury risks determined for each case were summed up and then divided by the total number of simulations. The rib fracture evaluation was performed similarly. First, the NFR2+ risk (i.e., the risk for two or more fractured ribs) for each case was determined using the age-adjusted risk for each age group. The sum of the age specific NFR2+ risks, weighted by the respective share of the age group was then calculated. This resulting predicted number of cases with two or more fractured ribs was then divided by the total number of simulations, resulting in a relative (with respect to the sample) risk for two or more fractured ribs.
Cases in which the added mass due to mass scaling exceeded 5% of the model mass or which terminated prematurely were dropped from the further analysis. For the remaining simulations, all injury metrics were calculated in the open-source post-processing tool DYNASAUR (Klug et al., 2018). The tool MUTANT (Luttenberger et al., 2019) was used to create combined tables of all simulations and all their criteria.
3 Results
The MAIS2+ body region level injury frequencies observed in the IGLAD sample, as well as the MAIS2+ injury prediction obtained with the HBM from the two simulation setups are listed in Table 2. For the head and the abdomen, the results for the two independent metrics described in Section 2.4 are provided in the table (with the respective strain-based criterion in the left column, kinematic in the right column). A table showing the IGLAD evaluation for all MAIS levels is provided in the Supplemental Material. The next sections briefly describe the results.
3.1 Accident data injury analysis
After applying all filter criteria, 290 cases involving drivers in frontal oblique collisions remained for further analysis. Of these, 27% were not injured (MAIS0), 24% sustained moderate or worse (MAIS2+), and 11% sustained serious or worse (MAIS3+) injuries. More severe injuries occurred in 7% of all cases. The first row in Table 3 lists the MAIS2+ body region level injury frequencies from the IGLAD sample. This shows that the most frequently injured body region was the thorax (11.6%). It is followed by the lower extremities (9.5%) and the head (6.5%). It has to be noted though, that the upper extremities and abdomen also exhibit very similar injury frequencies (6.3% and 5.6% respectively).
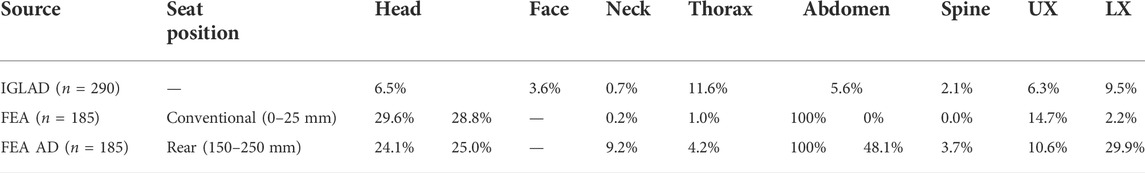
TABLE 3. MAIS2+ body region level injury frequencies from the IGLAD sample and the two sets of FE simulations with conventional and automated driving (AD) seat positions. To ensure consistency, only the 185 simulations which terminated normally in both sets were considered.
3.2 Stochastic model validation
The second line in Table 3 presents the results from the stochastic simulations with the conventional driving position. Starting the comparison with the head, the two individual injury metrics (50th percentile principal strains in the brain and DAMAGE) both result in predictions of approximately 30%. This means that compared to the head injury risk observed in the IGLAD sample of 6.5%, both predictions are considerably higher. The bar chart in Figure 3A illustrates these differences between the injury rates in the IGLAD data and the predicted injury rates from the HBM simulations. Similar to the head, also the two individual metrics for the abdomen (95th percentile principal strains in the liver/spleen and the presence of submarining) yield different results. While the strain-based metric predict abdominal injuries in all cases, a review of all simulations showed that in none of the cases submarining occurred. Figure 3A illustrates the resulting overprediction of 94.4% and resulting underprediction of 5.6% for the two metrics. The injury frequencies of the thorax and the lower extremities are lower in the simulations than those observed in the real-world accidents, while the injury frequencies of the upper extremities are overpredicted by the HBM. For the neck and the spine, the injury frequency observed in the real-world cases and the prediction based on the simulations is closely matched.
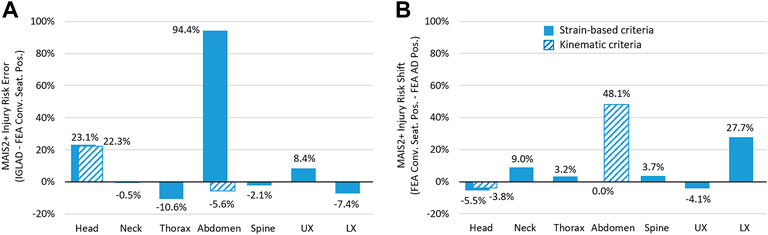
FIGURE 3. (A) Error between injury prediction from HBM and real-world accident data. (B) Shift in injury frequency as a consequence of the large rearward adjustments of the seat (using the criteria listed in Table 2).
3.3 Effects of large rearward seat adjustments
The third line in Table 3 presents the results from the stochastic simulations with the seat in the rearward adjusted positions. Facilitating comparisons to the results in the conventional seat position, Figure 3B illustrates the shift in injury risk for each body region, based on the criteria listed in Table 3. The only body regions with reduced injury risk are the head and the upper extremities. In particular, the injury risk for the lower extremities is almost 28% higher in the simulations with the rearward adjusted seat. The risk for abdominal injuries is increased by almost 50% when using the presence of submarining as a metric, since in 89 of the 185 cases which were evaluated, the lap belt slid off the right iliac crest. With the strain-based criterion for abdominal organ injury predicting injuries in all cases—regardless of seat configuration—there is no difference between the two variants when evaluating this metric. Figure 4 shows still frames at four points in time from an exemplary simulation to facilitate the comparison of kinematics.
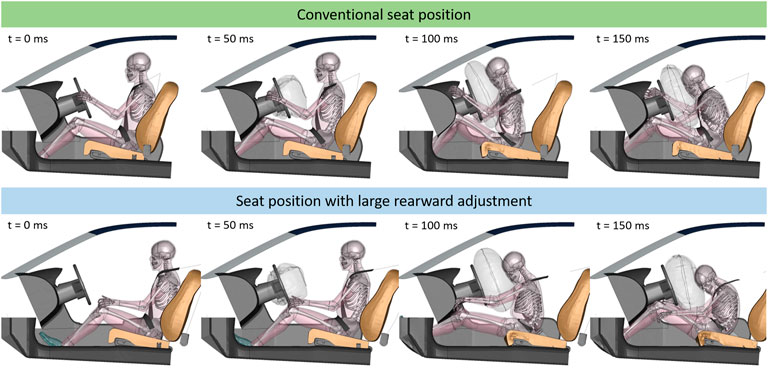
FIGURE 4. Still frames of case 557 (delta-v: 47 km/h). Top row shows kinematics for conventional seat position (21.8 mm behind max. forward position), lower row shows kinematics for seat adjusted 237.3 mm towards the rear. For visualization purposes, parts of the interior and HBM have been blanked.
There are some noteworthy differences in terms of kinematics when comparing the two seat configurations. Due to the increased initial distance between the knees and the knee bolster, there is no load path into the femur. Therefore, the pelvis is only restrained by the lap belt. This leads to the legs extending and the feet impacting the footwell. Furthermore, in the rearward adjusted seat configuration, the thorax is restrained by the seat belt almost exclusively and not by the airbag. Also, the steering column does not collapse and therefore does not absorb energy in this case. Another difference in kinematics concerns the upper extremities. In the conventional seat configuration, the hands are initially placed on the steering wheels. During the crash, the hands contact the instrument panel (IP) at an acute angle and slide up towards the windscreen. Due to the changed initial arm and seat position in the configurations with large rearward adjustments, the hands impact the IP at a more obtuse angle.
4 Discussion
4.1 Accident data injury analysis
The injury frequencies derived from the real-world accident database analysis are very similar to previously published data (Ressi et al., 2020). While the inclusion criteria differed slightly (most notably only cases with a PDOF of 0° were included in the previous study) both studies identified the thorax as the key injury region. With an injury rate of almost 10%, the present study identified the lower extremities as the second most injured body region. This notable difference to the 4% injury rate observed in the previous study can most likely be attributed to the lack of oblique crashes included due to the filter criteria. When filtering the current data set to only include head-on collisions, a lower extremity injury rate of less than 6% was observed, supporting this hypothesis (table showing IGLAD sample filtered for PDOF of 0° provided in the Supplemental Material). With 5.6%, abdominal injuries were considerably more prevalent in the present sample than previously (2%). Since limiting the analysis to head-on collisions also reduced the abdominal injury rate to 2.5%, this difference seems to be consistent with the different filter criteria. The remaining injury rates for the head, neck, spine and upper extremities were very similar.
4.2 Stochastic model validation
At an overall completion rate of 92.5%, the model robustness was deemed satisfactory. The premature terminations and excessive mass scaling (more than 5% of model mass) are mainly caused by unfavorable combinations of restraint system parameters in high severity crash pulses. At 96.5% (conventional seat position) and 93.5% (large rearward adjustments), the completion rates of the two individual sets of simulations were even higher. The study cited in the introduction, studying the effects of reclined seatbacks on kinematics and submarining, experienced completion rates as low as 67% for the GHMBC-OS 50th percentile model (Gepner et al., 2019). By excluding the results of simulations which did not meet the quality criteria in one of the configurations (conventional or rearward adjusted seat position) from both data sets, consistency was ensured.
When comparing the real-world data to the results from the simulations with the conventional seat position, mixed results were observed. While the absolute error with respect to injury risk for most body regions, as presented in Figure 3B, is below 10%, larger errors for the strain-based prediction for the abdomen (94%) and the head (23%) were observed. A similar overprediction of abdominal injuries was also observed in a previous study (Ressi et al., 2020) when using strain-based metrics. Abdominal MAIS2+ injuries were predicted for 100% of cases—for both seat configurations when applying the strain-based assessment. Considering that abdominal injuries only occurred in 5.6% of the real-world cases, this result does not seem plausible. However, when evaluating the simulations for submarining, none was observed in the conventional seat position. As a result, even though this represents an underprediction of 5.6%, it was deemed more plausible that no AIS2+ abdominal injuries (based on zero cases with submarining) should be predicted in these HBM simulations.
For the head, the injury risk error based on the strain-based criterion was 23%. Interestingly, at 22%, the error based on the kinematic criterion DAMAGE was almost identical. Using a different approach, Wu et al. (2022) found very similar differences in brain injury risk when comparing strain-based injury criteria calculated from crash test results to real-world accident data. There, for frontal collisions, the criteria based on principal strains in the GHBMC model overpredicted the real world injury rate by about 34% (Wu et al., 2022). As an additional comparison, the risk for mTBI, using the IRC presented by Wu et al. (2022) was also assessed in the present study. This risk curve was developed with a GHBMC 50th percentile male and non-human primate brain models. Direct comparisons using IRFs developed for and from different models can be difficult (Wu et al., 2022). In the present study, the consideration of this brain injury metric represents an effort to check the strain-based results for plausibility. A plot illustrating the correlation between the two strain-based brain injury criteria is provided in the Supplemental Material. Figure 5 shows boxplots comparing brain injury risk evaluated with these three criteria: the mTBI risk based on 50th percentile strains (Fahlstedt et al., 2022), the mTBI risk based on the kinematic DAMAGE criterion (Gabler et al., 2019; Wu et al., 2022)—both listed among the metrics in —and the mTBI risk based on 95th percentile strains (Wu et al., 2022). As a reference, the 6.5% head injury risk observed in the IGLAD sample is represented in Figure 5 as a gray dashed line overlaid on the boxplots for the conventional seat position. A table listing the brain injury rates with the criteria mentioned above and additional boxplots for the risk of severe TBI are provided in the Supplemental Material.
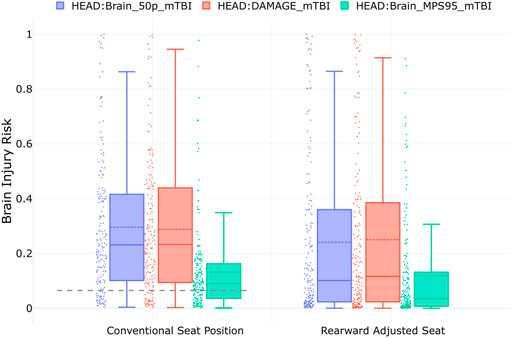
FIGURE 5. Boxplots for risk of mTBI based on three different brain IRFs. The three boxplots on the left show the results of the simulations with the conventional (n = 185), and the three on the right the results with the rearward adjusted seat position (n = 185). The gray dashed line represents the head injury risk observed in the IGLAD sample.
The plots in Figure 5 show that for the conventional seat position, the mean brain injury risk (dashed lines in the boxplots) based on the 50th percentile principal strains is 29.6%. Notably, although it is based solely on the kinematics of the center of gravity of the HBM’s head, the injury risk prediction based on DAMAGE is almost identical (mean of 28.8%). Compared to these two metrics, the IRF using 95th percentile strains predicts a considerably lower risk for mTBI (mean of 13.2%). The similarity between the results based on the IRF using MPS50 and DAMAGE is also remarkable when considering that they are based on very different data sources. While Fahlstedt et al. (2022) used lower-severity American football helmet measurements to derive the injury risk curves, Wu et al. (2022) created their risk curves from a combination of non-injurious tests with volunteers and tests with non-human primates. Even though DAMAGE is a kinematics-based criterion, it estimates the maximum principal strain in the brain. The criterion was assessed with 1747 head impacts, including volunteer, sports and automotive tests (Gabler et al., 2019). While the IRF using MPS95 is based on the same data as DAMAGE, the predicted risk is considerably lower. This can probably be attributed to the fact that the IRF was not tuned to the HBM used in the present study (THUMS v4.1) but to the GHBMC. The head injury criterion (HIC) was not used in the current study, as the poor correlation for brain injury risk prediction was shown in previous studies (Gabler et al., 2018).
In an earlier study with a THUMS v4.02 in a generalized interior, it was found that strain-based brain injury metrics overestimated the expected brain injury risk significantly (Ressi et al., 2020). In this study, AIS2+ brain injuries were predicted to occur in 95% of cases. Likewise, in the initial analysis in the present study, unrealistic brain injury risks in the range of 90% were observed. It was later discovered that these high strains were caused by a problem which occurs when scaling the unit system of THUMS v4.1 using the LS-Dyna keyword *INCLUDE_TRANSFORM. After changing the way in which the HBM was scaled to the same unit system as the GVI (Section 2.3), lower strains were obtained, which are presented in the current paper. This indicates that the transformation integrated into LS-Dyna does not scale all necessary model parameters correctly, resulting in an excessively soft behavior of the brain. As the validation load cases, which were performed using LS-Dyna R12 for the present study, are provided in the THUMS base unit system, they were not affected by this issue. However, irrespective of these considerations, the injury risk observed in the IGLAD sample is still overpredicted by the simulations by 6.7%, 22.3% and 23.1% (based on MPS95, DAMAGE and MPS50 respectively). One important aspect in this could be the expected under-reporting of mTBI in accident databases (Wu et al., 2022), resulting in lower MAIS2+ head injury rates in the IGLAD sample. On the other hand, while the GVI was validated with crash test data from 14 vehicles using crash test dummies, the model was subsequently utilized primarily for strain-based rib fracture prediction (Iraeus, 2015; Iraeus and Lindquist, 2016; Iraeus and Lindquist, 2020; Larsson et al., 2021). Additional GVI model validation focusing on the head-airbag-interaction could potentially improve the results.
The HBM predicted AIS2+ thorax injuries (based on rib fractures) in only 1% of the cases. This is considerable lower than the 11.6% thoracic injury frequency observed in the IGLAD sample (listed in Table 2). To check these results for plausibility, the “Forman smoothed” IRF (Iraeus and Lindquist, 2020) was also implemented. While at 1.32%, this function predicted a slightly higher rate of AIS2+ thorax injuries, this rate is still considerably smaller than the real-world observation. Figure 6 shows a combination of plots. In the background, two Weibull distributions are shown. They were fitted to the thoracic AIS2+ injuries observed in the IGLAD sample as a function of delta-v. The two distributions are based on two age groups (mean of 29, and mean of 77 years). Additionally, the risk for NFR1+ and NFR2+ for a 77-year-old occupant, evaluated for each parameter combination in the stochastic simulation study, and a NFR2+ risk curve based on data from the United States’ National Automotive Sampling System Crashworthiness Data System (NASS-CDS) (Larsson et al., 2021) are shown.
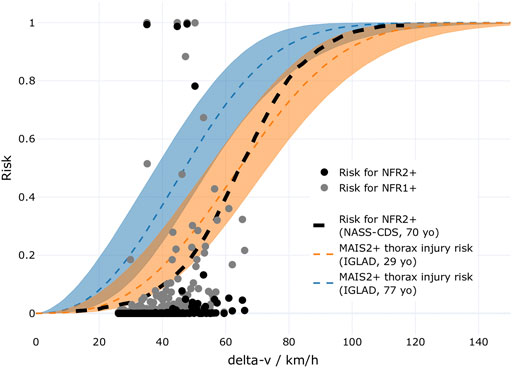
FIGURE 6. Comparison of MAIS2+ injury risk for the thorax based on the IGLAD sample (Weibull distributions for two age groups) and risks of NFR1+ and NFR2+ as a function of delta-v. The opaque areas around the curves indicate the 95th confidence intervals. Additionally, a risk curve for NFR2+ based on NASS-CDS data is shown.
When visually comparing the MAIS2+ injury risk curve based on the IGLAD sample to the risks for NFR2+ predicted in the individual simulations, a lower risk prediction in the simulations is observed. This might be caused by the fact that MAIS2+ injury risk in IGLAD does not originate from rib fractures alone. Using data from NASS-CDS, rib fracture specific risk curves for delta-v have been published (Larsson et al., 2021). The NASS-CDS-based risk curve for a 70-year-old occupant for NFR2+ is also shown in Figure 6. This risk is at the lower confidence interval of the MAIS2+ thoracic injury risk curve for the 29-year-old occupant until approximately 50 km/h. Hence, at 50 km/h, a 55% risk for MAIS2+ thorax injuries (including rib fractures) for 77-year-old drivers can be estimated based on IGLAD, while the risk for NFR2+ for a 70-year-old according to NASS-CDS is estimated at about 18%. While the filter criteria are not identical, this underlines that there is a considerable amount of thoracic MAIS2+ injuries which cannot be attributed to fractured ribs. This might be one reason for the underestimation of thoracic injuries in the present study. Additionally, while the GVI has been used extensively in studies investigating rib fractures (Iraeus, 2015; Iraeus and Lindquist, 2016; Iraeus and Lindquist, 2020; Larsson et al., 2021), to the best knowledge of the authors, the present study is the first one using it with a THUMS v4.1. Also, the strain-based rib fracture risk function used in the present study was so far only validated for the SAFER HBM version 9 (Larsson et al., 2021). Using a rib fracture risk function specifically tuned for THUMS v4.1 could also help to further improve the results. Strain-based criteria were used instead of chest deflection, as PDOFs between -30° and +30° were investigated, which complicates finding a robust definition for chest deflection. Using chest deflection or other criteria for thoracic injury known from crash test dummies, as the viscous criterion (V*C), were developed for well-defined loading directions.
The injury metric for the neck, based on cortical bone fracture prediction, predicted an injury rate pretty much identical to the one observed in the IGLAD sample (0.2% and 0.7% respectively). Based on the same metric, no injuries to the thoracic or lumbar spine were predicted in the HBM simulations. While this represents an underprediction, at 2.1%, MAIS2+ injuries to the thoracic or lumbar spine were only observed in very few of the cases in the real-world sample anyway.
At 6.3%, upper extremity injuries were more common in the IGLAD data, but the simulations predicted an even higher injury rate of 14.7%. Part of the explanation for the overprediction might be related to the simplified representation of the instrument panel, which is modelled as rigid in most areas (Iraeus and Lindquist, 2016). However, closer inspection of the simulation results revealed that the majority of fractures in the cortical bones of the upper extremities are predicted in the left clavicle. Fractures to other bones in the upper extremities (mainly the right radius and ulna) only account for 0.9% of the simulations. This highlights the importance of belt routing, which is discussed further when comparing the results between the two seat configurations in Section 4.3. The lower extremities represent the second most frequently injured body region with 9.5% of the real-world cases. In the simulations, fractures are only predicted in 2.2% of configurations, all affecting the pelvis. While the argument that was made for thoracic injuries—that by only looking at fractures, an underestimation is to be expected—could be made for the lower extremities too, this claim cannot be backed by previous research. According to Forman et al. (2019), the majority of AIS2+ injuries for the upper and lower extremities in frontal collisions are fractures. The difference could be caused by the simplified modeling of the interaction of the legs with the GVI. This might on the one hand be related to the fact that the footwell does not feature a structure confining upward motion of the feet (cf. Figure 2B). On the other hand, different initial positions of the legs or other heterogeneities in the real-world like different shoes could be possible causes for the observed deviations. Particularly, the adequate modelling and the potential effects of shoes on lower extremity injury risk in occupant simulations is not well understood.
4.3 Effects of large rearward seat adjustments
The bar charts for the shift in injury risk between the two sets of simulations in Figure 3B shows that the injury risk for the head and the upper extremities is reduced. In contrast, all other injury risks are increased.
Most notably, the risk for abdominal injury, based on the occurrence of submarining (+48.1%) is increased substantially. In all cases with submarining, it occurred on the right (i.e., inboard) side. Mostly, the belt slipped off the right iliac crest shortly before the occupant motion reversed, i.e., before entering the rebound phase. Submarining with an earlier onset occurred in 16.8% of the cases. The issue of submarining of HBMs has been studied in a number of research publications, particularly with respect to seatback recline angles. Rawska et al. (2020) found that in some cases increased seat pan inclination could prevent submarining. While they did not investigate increased rearward adjustments directly, they discovered that in the cases with no knee bolster also increased seat pan inclination could not prevent submarining (Rawska et al., 2020). In the present study, only a single seat back recline angle and a single seat pan inclination angle were used. Potentially, other combinations of these seat adjustments could have prevented submarining for some configurations. However, considering the findings of Rawska et al. (2020), it seems unreasonable that in absence of a load path through the femur (via a knee bolster for instance) submarining could be eliminated completely, without additional remedial measures. In any case, it is not completely understood if even state-of-the-art HBMs can adequately predict the occurrence of submarining. This can primarily be attributed to modelling simplifications (mainly for robustness reasons) of the adipose tissues between the skin and the pelvic bones. These tissues have found to be vital to adequately replicate the behavior observed in post mortem human subject (PMHS) tests investigating submarining (Gepner et al., 2018).
At 27.7%, the second highest increase in injury risk between the two seat configurations affected the lower extremities. In all of these cases, pelvic fractures occurred. In only two cases, also tibia fractures were predicted for a 77-year-old occupant. Overall, when weighting for the respective share of this age group in the IGLAD data, these two amount to about 0.3% of cases—but in both cases, pelvic fractures are predicted anyway. The low prevalence of non-pelvic lower extremity fractures in the simulations with the rearward adjusted seat further indicate that improvements to the footwell modelling in the GVI (in particular adding a roof to the footwell) could prove meaningful. Fractures in the pelvis were predicted by assessing the MPS99 in the cortical pelvis using a 1% threshold (Snedeker et al., 2003). Figure 7 shows the MPS99 for each simulation of the present study as a function of PDOF. For each of the two seat configurations (driving/AD), a locally weighted scatterplot smoothing line is shown. These lines illustrate that the pelvic strains tend to increase with increasing PDOF regardless of seat configuration. The reason for this is that with increasing PDOF, the pelvis started to impact the rigid center console in addition to the load introduced into the pelvis by the lap belt. The graph also highlights that the strains in the pelvis were always higher in the AD configuration than in the driving position.
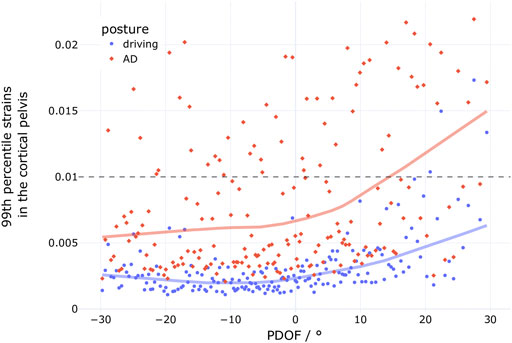
FIGURE 7. 99th percentile strains of the cortical pelvis for the simulations with the conventional driving position (blue dots, n = 185) and the simulations with the rearward adjusted seat (AD, red diamonds, n = 185).
Using THUMS v4.02, Peres et al. (2016), derived injury risk curves for pelvic fractures in lateral load cases. In their study, at 1% MPS99, the 95% confidence interval for AIS2+ injury risk is estimated between 23% and 65% for a 45-year-old and between 46% and 72% for a 65-year-old (Peres et al., 2016). While these risks are considerably lower than the 100% risk assumed in the present study, the highest strains observed in non-fracture cases in the study by Peres et al. (2016) were below 1.5% in both age groups. The MPS99 plot in Figure 7 illustrates that while only one case is above 1.5% with the conventional seat configuration, 30 cases exceed this value in the AD configuration. With this in mind, the substantial increase in predicted pelvic injuries seems plausible. In particular, when considering that the lap belt is the only significant load path to decelerate the pelvis directly, since the femurs are not being loaded through the knee bolster in the rearward adjusted seat positions because they are too far away (c.f. Figure 4).
The 9% increase in neck injury risk is considerable, especially when taking into account that in the simulations with the conventional seat configuration, the risk for neck injuries was close to zero. Likewise, the risks for the thorax (rib fractures) and the spine, which were underestimated in the standard driving position, are increased by 3.2% and 3.7% respectively. When taking into account the reduced effectiveness of the airbag in decelerating the torso and the changed loading of the spine (also visible in Figure 4) as a result of the increased distance to the airbag, this does not seem unreasonable. In this respect, it seems likely that potential countermeasures, designed to reduce spinal loads in (semi-) reclined seat positions (e.g., load limiting in the lap belt and seat track), could benefit occupants in interior configurations with increased rearward seat adjustments as well (Mroz et al., 2020).
For the head, the relative shift for all three criteria is well aligned. Based on MPS50 and DAMAGE, a decrease of 5.5% and 3.8% is predicted. For the metric using MPS95, a head injury risk reduction of 1.4% is predicted for the large rearward seat adjustments. When comparing the boxplots in Figure 5, they look similar for the driving position and the AD configuration in terms of their upper fences. At the same time, the lower fences are reduced in the AD configuration. Focusing on the individual injury risks in the plot, indicated by the dots next to the boxplots, it is obvious that the distribution changes considerably. While there are many cases with injury risk below 10%, reducing the median risks (solid horizontal line in each boxplot) accordingly, there are more cases above 60% injury risk for all three criteria, resulting in comparable mean risks (dashed horizontal line in each boxplot). One reason explaining the larger number of cases with lower risk could be that the brain injury risk was increased in the conventional seat position due to a slightly aggressive airbag setup, such that increasing the distance to the airbag and steering wheel actually improved the head-airbag-interaction in some cases. However, the larger number of cases with elevated risk also indicates that increased rearward seat adjustments can lead to problematic loads in the brain.
While some studies have underlined the importance of the upper extremities as a highly relevant body region not receiving adequate attention, it did not stand out in the present study. Compared to the conventional position, upper extremity injuries were even reduced by about 4% in the rearward adjusted seat positions. One potential reason behind this could be the fact that no contact is defined between the hands and the steering wheel rim, while in reality, this interaction might be an important source for upper extremity injuries. Just like in the conventional seat position, the bone most affected with fractures in the upper extremities was the left clavicle. Considering the reduced effect of the airbag in restraining the occupant’s torso due to the increased distance, it seems counterintuitive that the probability for clavicle fracture would decrease. On closer inspection, it became obvious that this phenomenon can be attributed to the differences in the belt system between the two seat configurations. In the conventional driving position, the D-ring is mounted on the B-pillar. To replicate a belt-integrated seat, the D-ring was mounted generically behind and above the seat back on the outboard side (side view available in Figure 4). This lead to a belt routing with a slightly higher belt path, crossing the clavicle in the initial position. Figure 8 shows a comparison of the kinematics in a case with a PDOF of −16°.
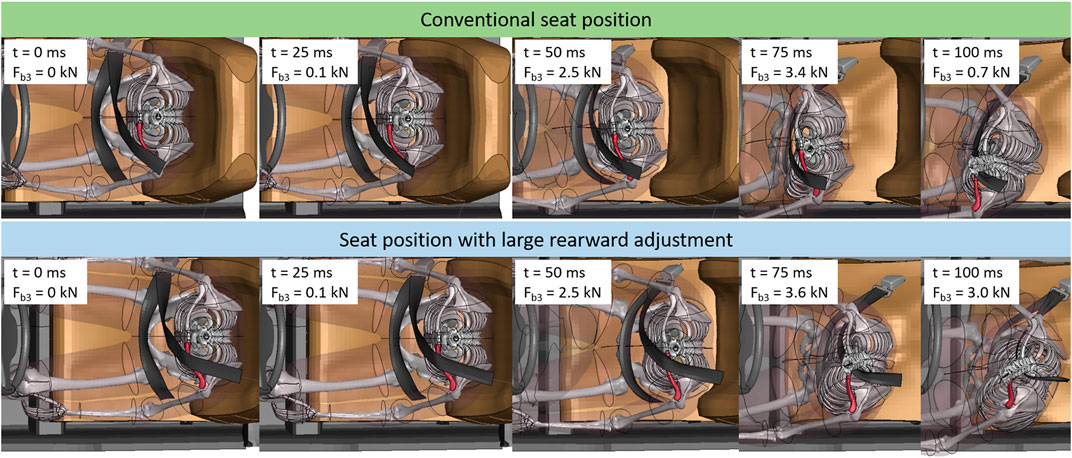
FIGURE 8. Still frames of case 513 (delta-v: 51 km/h, PDOF −16°). Top row shows kinematics for conventional seat position, lower row shows kinematics for rearwards adjusted seat. Time stamps and current shoulder belt force (Fb3) are provided. For visualization purposes, parts of the interior and HBM (most notably the head) are blanked and the left clavicle is highlighted in red.
In general, the belt kinematics are similar, with the belt slipping along the direction of the clavicle towards the neck of the occupant. The important difference is timing and the according load transferred through the shoulder belt. For the conventional seat position, the seat belt slides across the clavicle in the time between 25 and 100 ms after t0, when there is considerable force transferred via the shoulder belt (the maximum Fb3 of 3.6 kN is reached at 81 ms). In contrast, in the configuration with the rearward adjusted seat, the belt is already at the proximal side of the clavicle when the belt is loaded. This explains why, even though the maximum belt force is higher (4.1 kN), the MPS99 in the left clavicle is considerably lower (AD position: 0.008, driving position: 0.035). Figure 9 further illustrates this relationship between the strains in the left clavicle and the PDOF for both seat configurations. The blue dots indicate the strains for each configuration with the standard driving position, the red diamonds the strains for the rearward adjusted seat, representing an automated driving (AD) position. For both groups, a locally weighted scatterplot smoothing line is shown. These lines illustrate the different behavior. For the conventional position, the strains increase with decreasing PDOFs, while for the AD position, the strains—on average—slightly increase with increasing PDOFs. The three dashed lines in green, blue and red in Figure 9 indicate the underlying fracture thresholds used for the respective age group (29, 53, and 77-year-old).
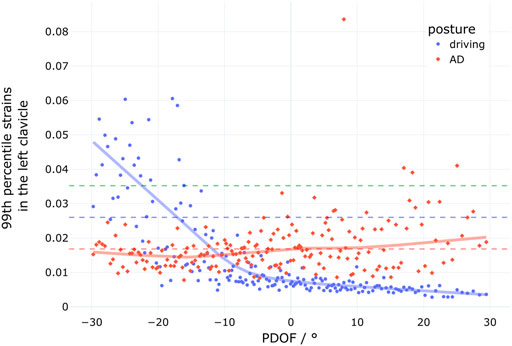
FIGURE 9. 99th percentile strains of the cortical clavicle for the simulations with the conventional driving position (blue dots, n = 185) and the simulations with the rearward adjusted seat (AD, red diamonds, n = 185). The three dashed lines indicate the fracture thresholds for the three age groups.
Although rarely life-threatening, injuries to the upper extremities can seriously affect the long term quality of life and lead to permanent medical impairment (Forman et al., 2019; Björklund et al., 2020). In the present study, in only 1.2% of cases upper extremity fractures not affecting the left clavicle were predicted (mostly affecting the radius and ulna). While the rigid material properties for the instrument panel in the GVI might exacerbate the effect of the rearward adjusted seat, a change in kinematics can be observed. When comparing the impact angle for the arms in the animations in Figure 4, it becomes clear that the design of the instrument panel needs to take potential collisions with the hands into account, ideally in terms of geometry and stiffness. Even though a reduction in upper extremity injuries was predicted in the present study, the results indicate that their mitigation might become more relevant in self-driving cars and the novel seat positions they enable.
4.4 Limitations
The presented approach has several limitations. Many of the inherent limitations have been discussed in the previous study using IGLAD data (Ressi et al., 2020). While using data from IGLAD offers the advantage of a more international perspective on vehicle safety by combining accident data from multiple countries, the injury data is only provided at MAIS level for each body region. For instance, this does not enable the distinction between skeletal and organ injuries.
While state-of-the-art FE HBMs, like the THUMS v4.1 used in the present study, provide detailed insights into strains in individual bones and soft tissues, they cannot be used to generate the level of detail needed to assign precise AIS codes. For example, the AIS injury severity can depend on whether a fracture is open or closed, the severity of rib fractures depends on potential complications (e.g., a hemo- or pneumothorax), and the severity of some injuries is determined by the estimated blood loss they caused or the surface area of organs affected by hematoma (Association for the Advancement of Automotive Medicine, 1998). Since this level of detail cannot be achieved with currently available HBMs, in case of ambiguities, a moderate injury (AIS2) or worse (AIS2+)—if applicable—was assumed.
Even if all injuries were known though, not all HBM body regions are yet covered by injury metrics with risk functions.
For the strain-based fracture assessment considering multiple age groups, no fracture was modelled in the HBM simulations. Rather than deleting elements exceeding a threshold, the strains were evaluated in post-processing and fractures assumed depending on the strain threshold (or rib fracture risk) for the age group in question. While this is a robust and commonly used method, it could be argued that in some circumstances, it might lead to unrealistic results. For instance, multiple fractured ribs could lead to reduced stability of the thorax, changing the loads on the internal organs, or a fractured clavicle could lead to changed thorax kinematics. However, this is not very likely in current state-of-the are restraint systems. Also, aside from the strain thresholds (and respective parameters for rib fracture risk curves), other age related changes (e.g., material properties, geometry, posture) were not taken into account.
In addition, only one anthropometry was considered. While using a wide range of occupants with different statures and masses would be a more realistic representation of the real-world collisions, the present study used the average male anthropometry, which has been the baseline for ATD testing for decades. Therefore, by not varying the anthropometry, the applicability of this model for a range of real-world occupants could be analyzed. To check whether the 50th percentile HBM adequately matched the anthropometries in the sample, its height and weight were combined in a plot with the height and weight of all drivers from the cases in the filtered IGLAD sample were this data were available. The plot, shown in Figure 10, illustrates that the height of the HBM (178.6 cm) was practically identical to the median height observed in the IGLAD sample (178 cm) while the HBM’s mass (77.6 kg) was about 8% lower than the median mass from the real-world data (84 kg).
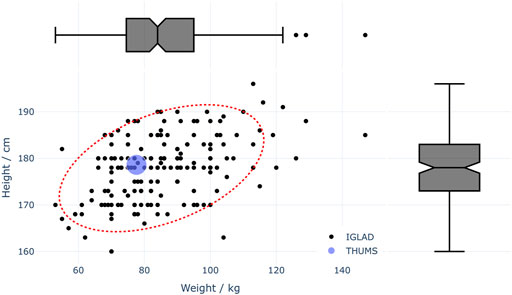
FIGURE 10. Available anthropometrical data of drivers in the filtered IGLAD sample (n = 172) and the 50th percentile THUMS HBM. The red dotted line illustrates the 95% confidence ellipse for IGLAD data.
Aside from using only one occupant model, also only a single interior model was used. While the GVI was validated against crash test data in previous studies by the developers of the model (Iraeus and Lindquist, 2016), no additional validation was performed in the present study after introducing the modifications to model a generic belt integrated seat. Since only the belt routing was changed (the belt was not structurally integrated into the seat), a re-validation of the model was not deemed necessary. Nevertheless, as discussed in the previous section, the influence of the belt routing on clavicle fracture risk was found to be considerable. A systematic analysis, investigating the influence of belt routing on HBM kinematics and injury risk with respect to large rearward seat adjustments, could improve the understanding of the underlying phenomena and guide future interior and restraint system design.
To represent the variation in the vehicle fleet, the longitudinal seat position, restraint system parameters and crash pulse parameters were varied stochastically. In total, seven parameters were varied. Even though their selection was well motivated, more parameters and larger parameter ranges might be considered. For instance, depending on the vehicle, larger adjustments might be feasible in the future, but 100 mm were considered to be a reasonable starting point.
Furthermore, with a limit of 68 km/h, cases in which delta-v was much higher than in typical crash tests were excluded. While of course cases with higher delta-v are highly relevant to the goal of eliminating fatalities and serious injuries in road traffic accidents, they are very challenging with respect to occupant safety. The main concern with increased delta-v is the integrity of the safety cell. In a recent study, Kim et al. (2021) investigated the effects of increased impact speed based on an offset deformable barrier test. An average age vehicle model (model year 2010) was tested at the baseline impact speed of 64.4 km/h as well as at 80 km/h and 90 km/h, equivalent to an increase in kinetic energy of 54% and 95% respectively. While in the baseline test minimal occupant compartment intrusion was observed, the 54% increased kinetic energy resulted in some deformation (door opening, instrument panel, and brake pedal). The test with almost doubled kinetic energy lead to interior intrusions which were increased between 127 and 406 mm (5–16 inches) compared to the baseline test (Kim et al., 2021). Even though intrusions can be accounted for in the GVI model used in the finite element simulations, a relationship between crash loads and intrusions (location and extent) would be necessary for a meaningful representation. Lacking such a relationship, no intrusions were considered in the simulations, since no increased risk for rearward adjusted seat positions was expected.
While based on real-world data, the airbag trigger time was varied randomly. For future publications using a similar approach, a generic algorithm estimating realistic trigger times would be desirable. It is possible though, that to derive realistic yet generic trigger times, more information on the crash pulse is necessary than currently available from typical crash test or event data recorders.
Also, the chosen size of the design matrix could be considered a limitation. The robustness of the presented approach could be investigated by comparing results from different design matrices with varying sizes and see if they converge with increasing sample size.
To ensure consistency in presenting the results, 15 cases were dropped from the further analysis. These did not meet simulation quality criteria in at least one of the two simulation sets. While ensuring consistency, this also introduces bias. This is expected to lead to a degree of underprediction of injuries, since excessive mass scaling and error terminations often affect simulations with higher collision severities.
4.5 Outlook
Since the HBM theoretically enables omnidirectional injury prediction, this approach could potentially be used for any loading direction or seat configuration. In this respect, the present study can be seen as a starting point. The presented approach can aid the prioritization of new injury risk functions, which subsequently further improve future HBM-based injury prediction. By adjusting the loading conditions and seat configuration in the generic vehicle interior, the challenges with respect to occupant safety of countless potential future interior designs could be evaluated.
5 Conclusion
The results of stochastic simulations with an HBM in a conventional seat position were compared with injury rates observed in a sample taken from a real-world accident database showing different accuracies in the injury prediction capabilities of the applied method. While injury frequencies for the abdominal organs and head were overpredicted considerably, predicted injury rates were reasonable for the other body regions.
For simulations with the rearward adjusted seat, increased injury risk was observed for most body regions. The highest injury risk increases were predicted for the abdomen (+48%), the lower extremities (+28%) and the neck (+9%). These increases in injury risk highlight that even small changes compared to conventional configurations require a reconsideration of conventional restraint systems.
Although there are limitations with respect to the injury prediction—particularly for the abdomen—with the used HBM, the potential of HBMs as useful tools for estimating future protection challenges is shown. The presented approach enables the identification of potential future protection challenges, before they are observable in accident databases, which can take decades. As a result, in ideal circumstances, by identifying and mitigating them before they arise, they will be never observed in real-world crashes.
Data availability statement
The raw data supporting the conclusion of this article will be made available by the authors, without undue reservation.
Author contributions
FR: Conceptualization, methodology, combined model development, stochastic parameter variation, setup and analysis of the finite element simulations, visualization, writing (original draft), reviewing, and editing. CL: Stochastic parameter variation and visualization. CK: Conceptualization, supervision, methodology, writing, reviewing, and editing. WS: Conceptualization, reviewing and editing. All authors contributed to the article and approved the submitted version.
Funding
This research received no specific grant from any funding agency. The publishing fees were supported by TU Graz Open Access Publishing Fund.
Acknowledgments
The authors thank Johan Iraeus for developing the generic interior model and granting the authors access to the model. The authors acknowledge the use of high performance computing resources provided by the IT Services (ZID) of Graz University of Technology. Furthermore, the authors acknowledge Toyota Motor Corporation for making the THUMS publicly available. The authors extend their thanks to Desiree Kofler for her support with the finite element simulations, to Gunther Konrad for his assistance in preprocessing the IIHS crash test data and to Bernd Schneider for his support with creating a space-filling simulation design which takes given parameter distributions into account.
Conflict of interest
The authors declare that the research was conducted in the absence of any commercial or financial relationships that could be construed as a potential conflict of interest.
Publisher’s note
All claims expressed in this article are solely those of the authors and do not necessarily represent those of their affiliated organizations, or those of the publisher, the editors and the reviewers. Any product that may be evaluated in this article, or claim that may be made by its manufacturer, is not guaranteed or endorsed by the publisher.
Supplementary material
The Supplementary Material for this article can be found online at: https://www.frontiersin.org/articles/10.3389/ffutr.2022.914481/full#supplementary-material
References
Association for the Advancement of Automotive Medicine, (1998). Abbreviated injury scale 1990 update 1998. Barrington, IL: AAAM.
Björklund, M., Risberg, J., Laudon, O., and Jakobsson, L. (2020). “Development of a hand and forearm impact test method and a study on influencing factors,” in Proceedings of the IRCOBI conference. Munich, Germany: IRCOBI, 693–706.
European Commission (2018). COM(2018) 298 Europe on the move: Sustainable mobility for Europe: Safe, connected, and clean. Brussels: European Commission.
European Commission (2021). Road safety: 4000 fewer people lost their lives on EU roads in 2020 as death rate falls to all time low. Press release. https://ec.europa.eu/commission/presscorner/detail/en/IP_21_1767 (Accessed April 04, 2022).
Fahlstedt, M., Meng, S., and Kleiven, S. (2022). Influence of strain post-processing on brain injury prediction. J. Biomech. 132, 110940. (online first). doi:10.1016/j.jbiomech.2021.110940
Forman, J. L., Kent, R. W., Mroz, K., Pipkorn, B., Bostrom, O., and Segui-Gomez, M. (2012). Predicting rib fracture risk with whole-body finite element models: Development and preliminary evaluation of a probabilistic analytical framework. Ann. Adv. Automot. Med. 56, 109–124. PMCID: PMC3503420.
Forman, J. L., Poplin, G. S., Shaw, C. G., McMurry, T. L., Schmidt, K., Ash, J., et al. (2019). Automobile injury trends in the contemporary fleet: Belted occupants in frontal collisions. Traffic Inj. Prev. 20, 607–612. doi:10.1080/15389588.2019.1630825
Gabler, L. F., Crandall, J. R., and Panzer, M. B. (2018). Development of a metric for predicting brain strain responses using head kinematics. Ann. Biomed. Eng. 46, 972–985. doi:10.1007/s10439-018-2015-9
Gabler, L. F., Crandall, J. R., and Panzer, M. B. (2019). Development of a second-order system for rapid estimation of maximum brain strain. Ann. Biomed. Eng. 47, 1971–1981. doi:10.1007/s10439-018-02179-9
Gepner, B., Joodaki, H., Sun, Z., Jayathirtha, M., Kim, T., Forman, J., et al. (2018). “Performance of the obese GHBMC models in the sled and belt pull test conditions,” in Proceedings of the IRCOBI conference, 355–368.
Gepner, B., Rawska, K., Richardson, R., Kulkarni, S., Chastain, K., Zhu, J., et al. (2019). “Challenges for occupant safety in highly automated vehicles across various anthropometries,” in Proceedings of the 26th international technical conference on the enhanced safety of vehicles (Washington DC: NHTSA).
Golman, A. J., Danelson, K. A., Miller, L. E., and Stitzel, J. D. (2014). Injury prediction in a side impact crash using human body model simulation. Accid. Analysis Prev. 64, 1–8. doi:10.1016/j.aap.2013.10.026
Guillemot, H., Besnault, B., Robin, S., Got, C., Le Coz, J. Y., Lavaste, F., et al. (1997). Pelvic injuries in side impact collisions: A field accident analysis and dynamic tests on isolated pelvic bones. SAE Trans. 106, 3624–3633.
IIHS (2022). About our tests: Frontal crash tests. Available at: https://www.iihs.org/ratings/about-our-tests#frontal-crash-tests (Accessed March 29, 2022).
IIHS (2021). Moderate overlap frontal crashworthiness evaluation — crash test protocol. Ruckersville, VA, USA: Insurance Institute for Highway Safety.
Iraeus, J., and Lindquist, M. (2020). Analysis of minimum pulse shape information needed for accurate chest injury prediction in real life frontal crashes. Int. J. Crashworthiness 1, 684–691. doi:10.1080/13588265.2020.1769004
Iraeus, J., and Lindquist, M. (2016). Development and validation of a generic finite element vehicle buck model for the analysis of driver rib fractures in real life nearside oblique frontal crashes. Accid. Analysis Prev. 95, 42–56. doi:10.1016/j.aap.2016.06.020
Iraeus, J., and Lindquist, M. (2015). Pulse shape analysis and data reduction of real-life frontal crashes with modern passenger cars. Int. J. Crashworthiness 20, 535–546. doi:10.1080/13588265.2015.1057005
Iraeus, J. (2015). Stochastic finite element simulations of real life frontal crashes: With emphasis on chest injury mechanisms in near-side oblique loading conditions ([Umeå, SWE]: University of Umeå). [dissertation].
Joseph, V. R., Gul, E., and Ba, S. (2015). Maximum projection designs for computer experiments. Biometrika 102, 371–380. doi:10.1093/biomet/asv002
Kim, W., Kelley-Baker, T., Arbelaez, R., O'Malley, S., and Jensen, J. (2021). Impact of speeds on drivers and vehicles – results from crash tests (technical report). Washington, DC, USA: AAA Foundation for Traffic Safety.
Klug, C., Luttenberger, P., Schachner, M., Micorek, J., Greimel, R., and Sinz, W. (2018). “Postprocessing of human body model results – introduction of the open source tool DYNASAUR,” in Proceedings of the 7th International Symposium on Human Modeling and Simulation in Automotive Engineering, Berlin, Germany, October 18–19, 2018.
Laakmann, F., Zink, L., and Seyffert, M. (2019). New interior concepts for occupant protection in highly automated vehicles. ATZ Worldw. 4, 48–53. doi:10.1007/s38311-019-0012-8
Larsson, K.-J., Blennow, A., Iraeus, J., Pipkorn, B., and Lubbe, N. (2021). Rib cortical bone fracture risk as a function of age and rib strain: Updated injury prediction using finite element human body models. Front. Bioeng. Biotechnol. 9, 677768. doi:10.3389/fbioe.2021.677768
Luttenberger, P., Schachner, M., Rajinovic, S., Moser, J., Leo, C., and Sinz, W. (2019). MUTANT functionality report. Graz: University of Technology Graz.
Milakis, D., van Arem, B., and van Wee, B. (2017). Policy and society related implications of automated driving: A review of literature and directions for future research. J. Intelligent Transp. Syst. 21, 324–348. doi:10.1080/15472450.2017.1291351
Mohamed, G., and Newlands, G. (2021). “Human body model positioning using Oasys PRIMER,” in Proceedings of the 13th European LS-DYNA Conference, Ulm, Germany, October 5–7, 2021.
Mroz, K., Östling, M., Richardson, R., Kerrigan, J., Forman, J., Gepner, B., et al. (2020). “Effect of seat and seat belt characteristics on the lumbar spine and pelvis loading of the SAFER human body model in reclined postures,” in Proceedings of the IRCOBI conference, 470–486.
Nakane, K., Nojiri, M., Maekawa, R., Esaki, M., Suzuki, S., Masuda, Y., et al. (2015). “Analysis of abdominal injuries caused by the submarining phenomenon in the rear seat occupants,” in Proceedings of the 24th international technical conference on the enhanced safety of vehicles (Gothenburg: NHTSA).
NHTSA (2015). New car assessment program: Request for comments. Washington DC: National Highway Traffic Safety Administration. Docket No. NHTSA-2015-0119.
NHTSA (2022). Occupant protection for vehicles with automated driving systems. Washington DC: National Highway Traffic Safety Administration. Docket No. NHTSA-2021-0003.
NSTC, and US DOT (2020). Ensuring American leadership in automated vehicle technologies: Automated vehicles 4.0. Washington DC: National Science & Technology Council and US Department of Transportation.
Östh, J., Pipkorn, B., Forsberg, J., and Iraeus, J. (2021). “Numerical reproducibility of human body model crash simulations,” in Proceedings of the IRCOBI conference, 431–443. (Online).
Park, J., Ebert, S. M., Reed, M. P., and Hallman, J. J. (2016). Statistical models for predicting automobile driving postures for men and women including effects of age. Hum. Factors 58, 261–278. doi:10.1177/0018720815610249
Peduzzi, P., Concato, J., Feinstein, A. R., and Holford, T. R. (1995). Importance of events per independent variable in proportional hazards regression analysis II. Accuracy and precision of regression estimates. J. Clin. Epidemiol. 48, 1503–1510. doi:10.1016/0895-4356(95)00048-8
Peres, J., Auer, S., and Praxl, N. (2016). “Development and comparison of different injury risk functions predicting pelvic fractures in side impact for a Human Body Model,” in Proceedings of the IRCOBI conference, 661–678.
Poulard, D., Lin, H., and Panzer, M. B. (2020). Occupant safety in vehicles equipped with automated driving systems, Part 3: Biofidelity evaluation of GHBMC M50-OS against laboratory sled tests. Washington DC: National Highway Traffic Safety Administration. Report DOT HS 812 905.
Rawska, K., Gepner, B., Moreau, D., and Kerrigan, J. (2020). Submarining sensitivity across varied seat configurations in autonomous driving system environment. Traffic Inj. Prev. 21, 1–6. doi:10.1080/15389588.2020.1791324
Reed, M. P., Ebert, S. M., Jones, M. L. H., and Hallman, J. J. (2020). Prevalence of non-nominal seat positions and postures among front-seat passengers. Traffic Inj. Prev. 21, 7–12. doi:10.1080/15389588.2020.1793971
Ressi, F., Kofler, D., Sinz, W., Tomasch, E., and Klug, C. (2020). “Key injury regions for passenger car drivers in frontal crashes: A comparison of results from IGLAD and finite element simulations using a human body model,” in Proceedings of the IRCOBI conference, 137–155.
Ressi, F., Sinz, W., Geisler, C., Öztürk, A., D'Addetta, G. A., and Freienstein, H. (2019). “Estimating preliminary occupant injury risk distributions for highly automated vehicles with respect to future seat configurations and load directions,” in Proceedings of the 26th ESV Conference, Eindhoven, Netherlands, June 10–13, 2019, 125–141.
Snedeker, J. G., Muser, M. H., and Walz, F. H. (2003). Assessment of pelvis and upper leg injury risk in car-pedestrian collisions: Comparison of accident statistics, impactor tests and a human body finite element model. Stapp Car Crash J. 47, 437–457. doi:10.4271/2003-22-0019
Toyota Motor Corporation (2020). Toyota offers free access to THUMS virtual human body model software. Available at: https://global.toyota/en/newsroom/corporate/32665896.html (Accessed March 02, 2022).
Toyota Motor Corporation, and Toyota Central R&D Labs (2021). Total human model for safety (THUMS): AM50 occupant model version 4.1.
UNECE (2018). Resolution on the deployment of highly and fully automated vehicles in road traffic. Geneve: United Nations Economic Commission for Europe.
Watanabe, R., Miyazaki, H., Kitagawa, Y., and Yasuki, T. (2011). “Research of the relationship of pedestrian injury to collision speed, car-type, impact location and pedestrian sizes using human FE Model (THUMS v 4),” in SAE technical papers. doi:10.4271/2012-22-0007
Weaver, A. A., Talton, J. W., Barnard, R. T., Schoell, S. L., Swett, K. R., and Stitzel, J. D. (2015). Estimated injury risk for specific injuries and body regions in frontal motor vehicle crashes. Traffic Inj. Prev. 16, 108–116. doi:10.1080/15389588.2015.1012664
Keywords: occupant safety, novel seat configurations, accident data analysis, human body models, stochastic analysis and modelling, injury prediction
Citation: Ressi F, Leo C, Klug C and Sinz W (2022) Protection challenges in seat positions with large rearward adjustment in frontal collisions: An approach using stochastic human body model simulations. Front. Future Transp. 3:914481. doi: 10.3389/ffutr.2022.914481
Received: 06 April 2022; Accepted: 19 July 2022;
Published: 22 August 2022.
Edited by:
Yong Han, Xiamen University of Technology, ChinaReviewed by:
Guibing Li, Hunan University of Science and Technology, ChinaXiaowei Li, Xi’an University of Architecture and Technology, China
Copyright © 2022 Ressi, Leo, Klug and Sinz. This is an open-access article distributed under the terms of the Creative Commons Attribution License (CC BY). The use, distribution or reproduction in other forums is permitted, provided the original author(s) and the copyright owner(s) are credited and that the original publication in this journal is cited, in accordance with accepted academic practice. No use, distribution or reproduction is permitted which does not comply with these terms.
*Correspondence: Felix Ressi, ZmVsaXgucmVzc2lAdHVncmF6LmF0