 L. R. Rasmussen
 N. Agerholm3
- 1Department of the Built Environment, Aalborg University, Aalborg, Denmark
- 2NIRAS A/S, Aarhus, Denmark
- 3Danish Road Directorate, Aalborg, Denmark
Governments advocate for a modal shift from motorized transport modes to active modes. Various political approaches can be adopted to affect travel behavior and patterns. However, interventions spread across the entire population offer limited opportunities to achieve behavioral change. Furthermore, attitude has been shown to cut across demographic characteristics and strongly influence the conducted travel behavior. Therefore, a latent class analysis including significant sociodemographic variables and value-based attitudes concerning factors influencing transport, settlement, and additional priorities was performed. The study objectively identified five classes of Danish commuters with the same preconditions in terms of commuting distance but with clear differences in attitude and transport modes. Each latent class represents a unique combination of characteristics, which indicates the need to design target group-specific interventions to optimize the chances of influencing travel behavior. In particular, a group of malcontented motorists demonstrating a high intention to change exhibit negative feelings toward car travel and thus appear to act in contravention of their attitudes. In contrast, a class of immovable motorists was found, a class of beneficial commuters and finally two cycling dominated classes of passionate cyclists and environmentalist cyclists. Finally, this study has emphasized that similar attitudes can lead to dissimilar behaviors and that the same behavior can be exhibited for various reasons. We deduced how transport mode choice is influenced by various factors, with habit as one of the strongest, as those with strong habits seem disinclined to information about alternatives and call for “harder” policy interventions. The findings emphasize the importance of targeted interventions tailored to specific commuter groups to encourage modal shifts towards sustainable transportation.
1 Introduction
Active travel by walking and cycling for transport is widely acknowledged to have multiple benefits individually in terms of people’s health and lower costs, is cost saving for the community, and reduces environmental pollution and global externalities. Nevertheless, Christensen and Baescu (2021) showed that 29% of all trips made by car in Denmark in 2020 were shorter than 10 km, from which we can assume that a fair share could have been made with transport modes with a lower average emission per individual than the use of a car. Overall, we experience an increased number of car-driven kilometers, causing road transport today to account for 32% of the total emissions in Denmark (European Environment Agency, 2020). Furthermore, with additional external costs, such as congestion, noise, and traffic accidents, it is crucial to develop targeted efforts to decrease car use. However, the prospect of traveling by any mode other than a private car challenges a series of deeply embedded notions for the majority in car-based cities and rural areas. As Kent (2014) expressed, there is a long-held cultural belief that “one has the right to be as comfortable as one can afford to be.”
One of the often discussed essential measures to enable the transition to sustainable mobility is through the promotion of modal shift (Banister, 2008), where the focus is traditionally on a shift away from single-occupancy vehicles. However, influencing a shift and increasing the share of active transport requires an understanding of the motives and barriers of individual travelers. This will test whether subgroups of motorists, who will be affected by softer interventions, can be identified, and it will be able to design target group-specific interventions. According to Haustein and Nielsen (2016), interventions spread across the entire population will only have limited chances of achieving behavioral change and thus may be seen as ineffective or wasteful from a policy perspective. Therefore, an improved understanding of factors influencing the decision-making process of travel behavior and distributing commuters into meaningful groups is essential, as this will provide valuable information about how various measures should be designed to attract various groups (Haustein and Hunecke, 2013). This approach is well known in studies of consumer behavior, as there is little point in addressing the average consumer (or commuter). Instead, people must be treated in different ways, as they are motivated and affected by different factors and policy strategies (Anable, 2005). Consequently, more and more complex segmentations have been developed in the field of transport research in recent years, using four basic classes of variables to segment travelers: travel behavior, spatial variables, socio-demographic variables, and attitudinal variables. Although none of the different approaches can claim absolute superiority, Haustein and Hunecke (2013) found that with regard to the reduction of car use, attitudinal segmentation of the population into groups sharing similar attitudes and preferences seems to be the most promising approach. Thus, how do attitudinal values show in how the Danish population commutes? What are the barriers, and who will be willing to perform a modal shift?
The research summarized in this paper aims to provide a deeper understanding of commuting behavior among Danish travelers and explore how they can be grouped into meaningful clusters. Using a latent class analysis (LCA) the goal is to define the distinctions between car and bicycle commuters who have similar commuting distances but differ in their transportation choices. By incorporating distance as a criterion, the study focuses on a specific subset of commuters who face similar spatial constraints and commuting conditions. Furthermore, our analysis incorporates socio-demographic variables and value-based attitudes related to transportation, settlement, and other relevant factors.
With increasing concerns about environmental sustainability and the need to reduce carbon emissions, the motivation behind this study is to uncover valuable insights that can inform targeted policy interventions aimed at increasing the share of active transportation modes, such as cycling. By exploring the nuances of commuting behavior within the context of shared commuting distances, this study offers valuable insights into the complexities of mode choice and lays the groundwork for designing targeted interventions that can effectively encourage a higher adoption of active transportation modes.
2 Previous research
General trip characteristics, such as trip purpose and complexity, influence the choice of transportation mode (Neves and Brand, 2019), alongside available infrastructures, such as built environment and personal and household characteristics (Beckx et al., 2013; Song et al., 2017). Furthermore, modal choice is driven by observable variables, such as travel time and fare, and non-observable variables, such as perceived security or quality of rip (Ashmore et al., 2018). Steg (2005) also isolated symbolism, referring to what people believe their transport mode communicates about them in a social context to third parties. Furthermore, from a theoretical framework, the theory of planned behavior by Ajzen (1991) is often applied to explain this travel behavior. The theory assumes that people will aim at maximizing their personal benefits, which will result in reasoned choice making.
From a micro perspective, modal shifts take place when the decisions of individuals, known as behavior, change. Addressed by Gehlert et al. (2013), behavioral change options are chosen based on a psychological cost/benefit ratio, where psychological costs include increased planning efforts, activity suppression, and increased time pressure. Making the same trip every day with repetition in an invariant context may lead to a habitual and largely unconscious choice of transport mode (Sivasubramaniyam et al., 2020). In line with this, Verplanken et al. (1998) demonstrated that habit is an important factor when trying to change people’s travel behavior, given that those with strong habits are disinclined to gain information about alternative transport modes. Neves and Brand (2019) found that the main reasons given by participants to drive over short distances were related to habits, time constraints, convenience, the need to carry goods, the need to escort children, and the lack of any suitable alternatives. These findings support those of Beckx et al. (2013), who examined trip-related factors that affect the potential of active transport modes. Meinherz and Binder (2020) took a more critical approach to previous modal shift studies and excluded studies exploring intentions or attitudes toward shifts and, in their qualitative study, only included studies with actual modal shifts. The study advocated for dynamic transport policies that are adaptive with regard to the process of modal shifts and comprised measures targeting various stages of the process (Meinherz and Binder, 2020).
However, promoting modal shifts by targeted policies requires an understanding of individual travelers’ motives as preconditions for fulfilling needs and avoiding barriers. Anable (2005) was one of the first researchers to perform cluster analyses of travel behavior studies with the intention of advocating for target group-specific interventions. The study included 666 respondents, and six distinct psychographic groups were extracted, each with varying degrees of potential modal shifts for leisure trips. From the data, four car-owning and two non-car-owning groups were formed. Overall, there were few statistically significant differences with respect to sociodemographic indicators between the four regular car access segments. This demonstrated that attitudes and opinions largely cut across demographic characteristics, given that education appeared to be the only demographic variable used to distinguish the groups. Finally, the study demonstrated the method’s utility in providing meaningful groups useful in designing targeted transport policies. Nevertheless, a part of the conclusion by Anable (2005) was that the same behavior can take place for various reasons and that the same attitudes can lead to different behaviors.
A similar methodology was shared by Ton et al. (2020), who used LCA to investigate the relationship between daily mobility travel patterns and attitudes toward (alternative) modes. They used data from the Netherlands Mobility Panel and a final dataset consisting of 2,425 individuals. The explicit goal was to identify the potential for increasing active mode shares across the population. In summary, the study identified five classes with different daily mobility patterns and found that the classes differed in sociodemographics, ownership of modes, distance traveled per mode, household size, and urban density. The study concluded that familiarity with active transport was important to further increase the use of active transport in the future, and that when the goal is to achieve a higher active mode share, it is important to design targeted transport policies for the identified target group. Furthermore, when wanting to advocate for a certain behavior, it is crucial to first learn about the existing and potential “customers” and collect information about their attitudes and motives (Risser and Sucha, 2020). Rérat (2019) gained insights into the motives and barriers for existing Swiss cyclists (n = 12,031). They conducted cluster analysis to elaborate on four types of cyclists according to the components summarizing their motivations: active, civic, independent, or enthusiast. Whereas the active cyclists are the ones most interested in elements of wellbeing, such as physical activity and the pleasure of riding a bike, the civic cyclists carry a more political meaning, as their motivations are extrinsic, such as environmental issues and social activism. Individualist cyclists highlight the personal benefits of cycling in terms of both wellbeing and independence. For them, the bike is enjoyable, pleasant, practical, and efficient. Finally, enthusiast cyclists differ from the other categories by giving more importance to all three components: independence, civic engagement, and wellbeing. This implies that their modal choice is strongly embedded in their everyday lives (Rérat, 2019).
Finally, the bicycle, as a transport mode, cannot be appropriate for all trips, as this comes with a natural threshold value that differs from commuter to commuter and is, among others, determined by the physical capabilities the commuter holds, not to mention various physical barriers, such as missing bike lanes and challenging terrain. In their modal shift study, Meinherz and Binder (2020) focused on people with a commuting distance of less than 17 km, as this corresponds to a commuting distance that can reasonably be accomplished by electric bicycles, given the average commuting time of 30 min. In contrast, Beckx et al. (2013) and Neves and Brand (2019) defined a “short trip” as up to 8 km. Another approach was used by Bagheri et al. (2020), who discussed and tested potentially acceptable travel times for mode shifts, assuming various maximum threshold values of increased travel time. In summary, there does not seem to be one specific definition of what can be classified as a feasible and fair distance in the research field of potential modal shift toward active transport modes. Ultimately, studies should be able to include the importance of perceived travel time, as it can often be underestimated for driving or overestimated for using public transport and cycling (Pedersen et al., 2011; Bagheri et al., 2020).
3 Methodology
3.1 Survey and sample definition
The data used in this study came from an online survey of commuters conducted by the Centre of Mobility and Urban Studies at Aalborg University in 2015. The market research institute Gallup handled the data collection by sending the survey to a random sample consisting of 2,500 potential respondents aged between 18 and 65 years and who were employed. To express the representativeness of the Danish population, we stratified the sample according to gender, age (categorical), region, and educational level.
Besides demographic information, the survey consisted of questions regarding the respondents’ daily commute, their disposal of various transport modes, their use of these modes, and their attitudes concerning various matters related to transport, settlement, environment, and additional priorities. In the end, they were requested to provide their home and working addresses. From a total of 2,236 completed surveys, 1,509 (68%) provided information about their addresses, which were used to calculate the objective travel time on bike, in car or with public transport using Google Maps’ distance matrix (Google Maps, 2016). Unfortunately, the software could not recognize all the stated addresses, and nearly 5% of the respondents who provided their addresses turned out to be working from home and were hence excluded from the study. Ultimately, 1,387 respondents were included.
Afterward, the 1,387 remaining respondents were grouped based on their use of different transport modes, as stated in the survey on a frequency scale. The respondents were grouped into categories based on their mean transport mode and represented current cyclists, car drivers, public transport users, pedestrians, or those using an equal daily mix of transport modes. Commuters that would preferably use public transport or a daily mix were omitted from the LCA, considering that the given opportunities for using proper public transport differed too much based on the geographical residence of the commuter, not leaving a fair frame of reference. Finally, 1,164 respondents primarily commuting by bike (n = 294) or car (n = 870) were included. A flowchart illustrating the sample definition is presented in Figure 1.

FIGURE 1. Flowchart of the sample definition.
3.1.1 Criteria for potential modal shift
Distance is a fundamental factor that significantly impacts the feasibility and practicality of various transportation modes. Commuters residing within a certain proximity to their workplaces are more likely to consider active modes such as cycling or walking, while those living farther away often rely on motorized modes such as cars or public transport. Using distance as a criterion for participant inclusion ensures that the analysis captures meaningful variations in commuting behavior within a specific spatial context and ensures that the study can control for potential confounding variables that may arise from comparing individuals with significantly different travel distances.
First, the current 294 cyclists were examined to gain an understanding of the appropriate criteria for commuting distance and travel time, as shown in Table 1. This was used to specify the sample of car drivers of interest in this study—the ones who presumably have a regular potential to perform a modal shift toward cycling.

TABLE 1. Travel information for current cyclists (n = 294).
This shows that an average Danish cyclist travels 4.6 km each way. A complete scatterplot of their traveled distances indicates that this decreases significantly around 6 km. In addition, previous studies have commonly agreed that trips up to 8 km can be defined as short (Beckx et al., 2013; Neves and Brand, 2019). In line with these studies and to ensure a buffer to the calculated average commuted distance by bike of 4.6 km in this study, we adopted 8 km as the threshold value for a potential substitution in this study. Establishing the criteria of a threshold cycling distance of up to 8 km left us with a sample of 221 current car drivers who would be able to cycle to work based on the Google Maps’ distance matrix calculations. Figure 2 illustrates the potential changes in travel time based on Google Maps Matrix calculations if the motorists performed a modal shift toward bicycle. A potential modal shift will for a distance of up to 8 km in most parts leads to a travel time increase of up to 15 min. Yet, eight motorists will experience a reduced travel time and a further 103 motorists will experience an increased travel time of up to 5 min.
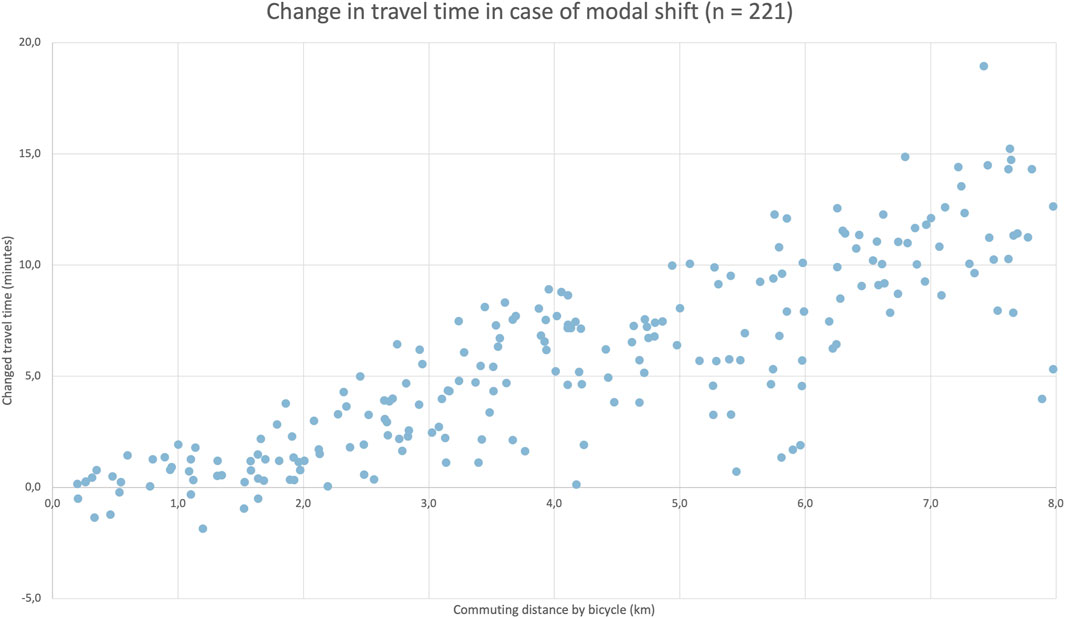
FIGURE 2. Change in travel time in the case of a potential modal shift from car to bicycle.
3.2 Analysis and data processing
We addressed the interplay of various questions on opinions and behaviors regarding transport mode, settlement, environment, and additional priorities through a largescale LCA. A generalized structural equation modeling procedure was used (StataCorp, 2021). There are several advantages to LCA over other standard clustering techniques, the most important being that LCA is a so-called “finite mixture model,” indicating that it is a model-based clustering approach that assumes that data are generated by a mixture of underlying probability distributions. Parameter estimation is performed through proper maximation of a log-likelihood function, which is a less arbitrary choice of cluster criterion, such as in standard clustering approaches. Among other convenient features, latent class clustering does not vary depending on whether the variables have been standardized, and it handles various scale types (numerical, nominal, or combinations of both) (Vermunt and Magidson, 2002).
3.3 Variable inclusion in LCA
Based on the sample criteria described in Section 3.1, the total sample consisted of 515 commuters. Table 2 presents an overview of background variables for the two groups of commuters, and the table serves as an insightful contribution for selecting the variables to include in the forthcoming LCA. From the overview, we derive that there is no statistically significant difference between motorists and cyclists according to gender, income, children living at home, or whether they must escort children or go grocery shopping while commuting. In contrast, there is a statistically significant difference when it comes to age, region, level of education, and car availability in the household.
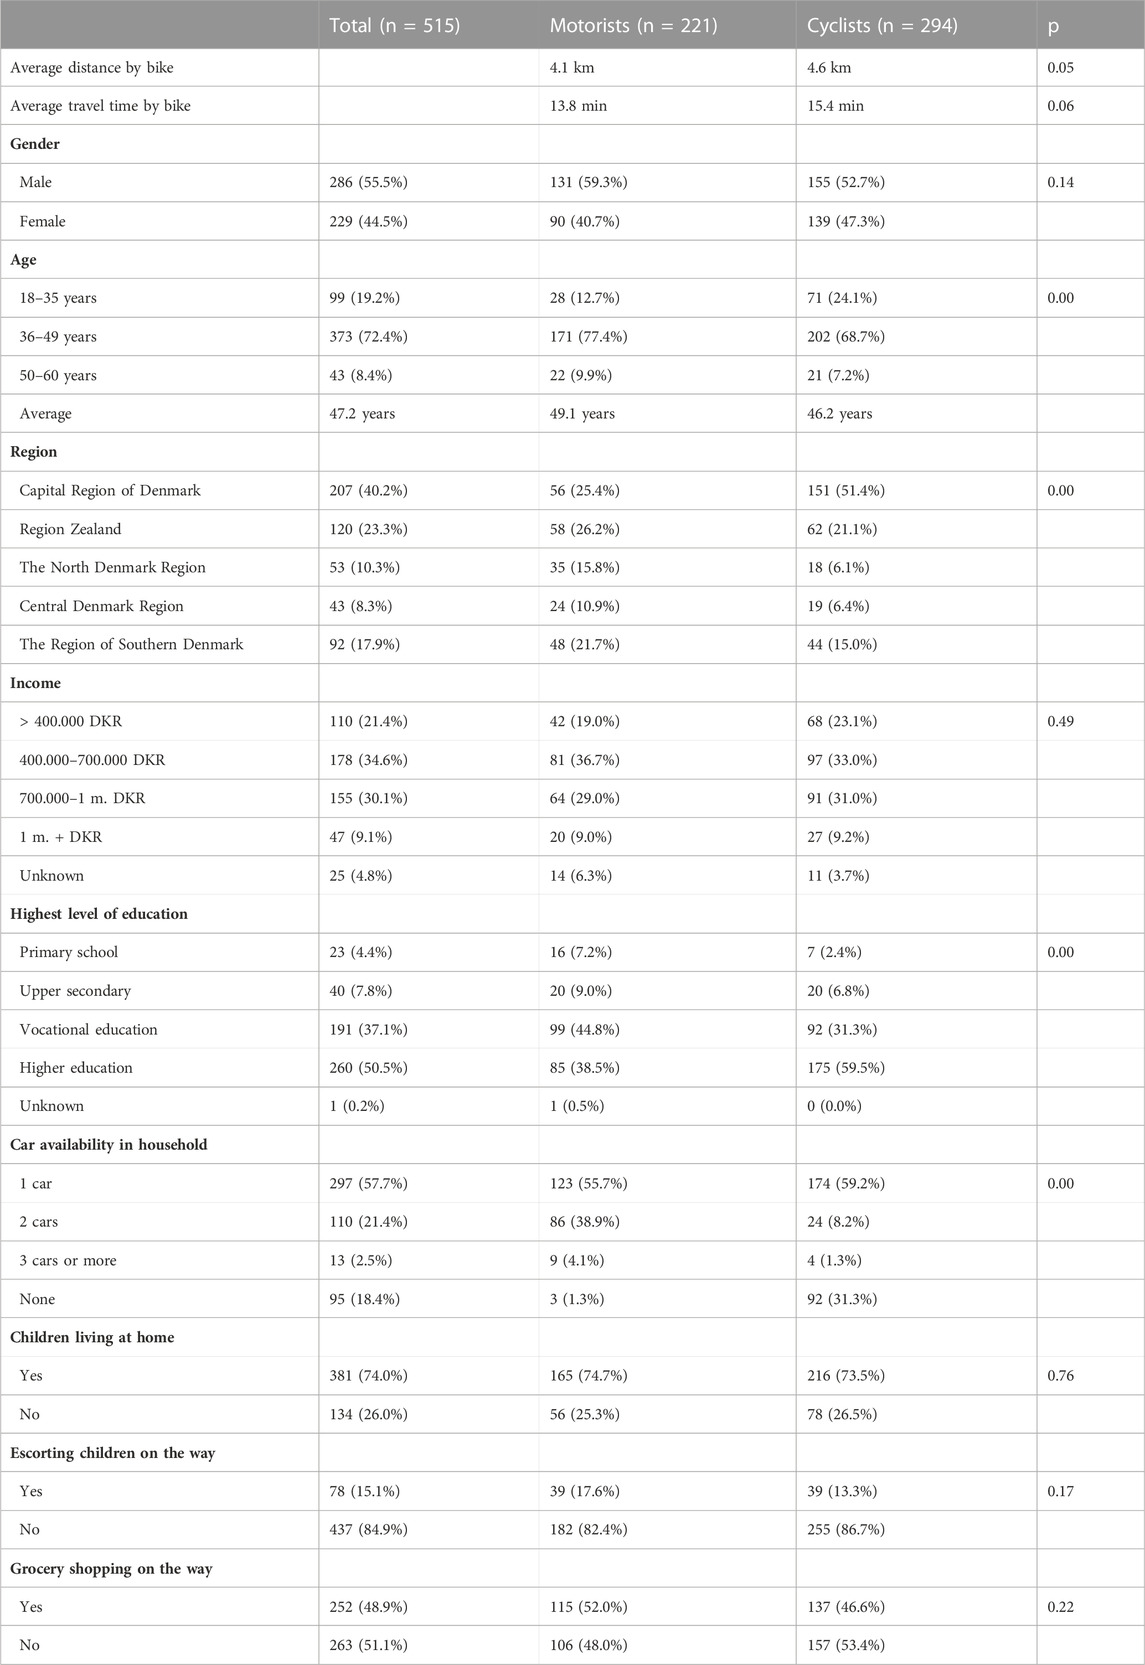
TABLE 2. Demographic overview of current cyclists and motorists.
The registered statistically significant differences were used as an interpretation of which background variables to include in the LCA. On this basis, the variables of current transport mode, gender, age, highest level of education, and whether the commuters had errands during their commute were included in the LCA. In addition, their attitudes toward a list of 19 statements concerning factors influencing their transport, settlement, and additional priorities were included. The attitude was expressed on a five-point Likert scale ranging from 1 (being of no importance at all or strongly disagreeing with the statement) to 5 (being of high importance or strongly agreeing with the statement). A list of the complete statement selection is presented in Table 3.
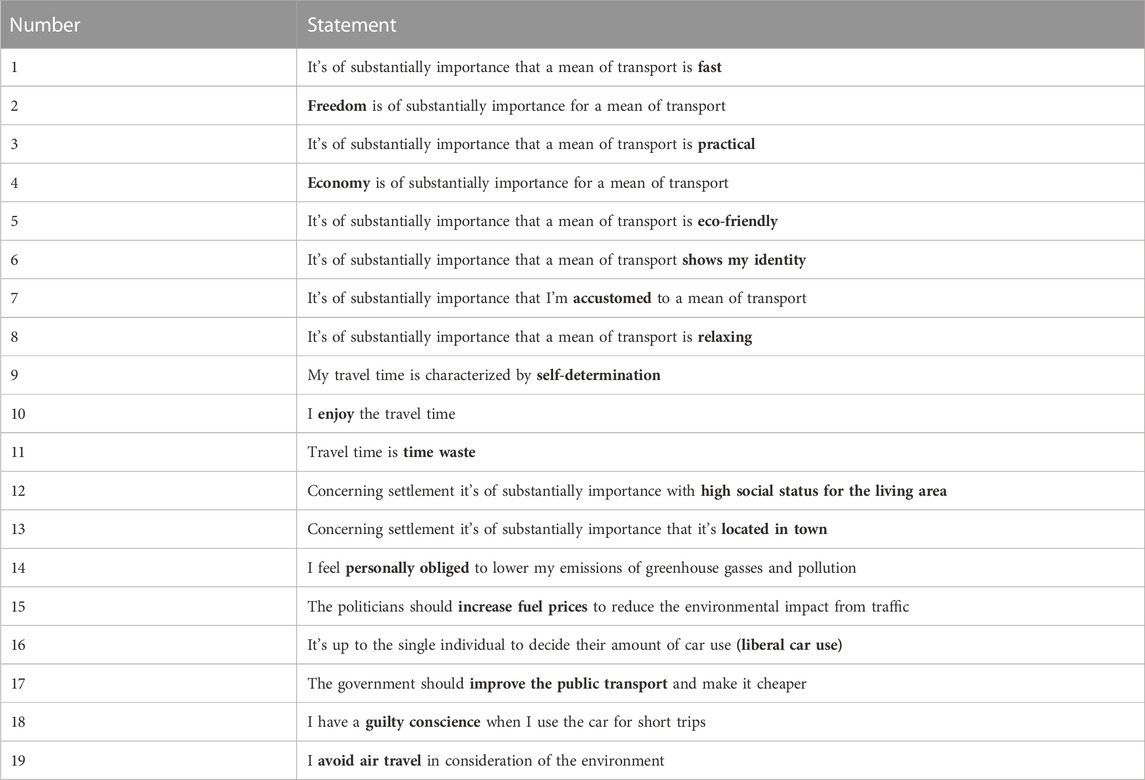
TABLE 3. Selection of statements included in the LCA.
4 Results
4.1 Classifying the commuters
We tested a total of 6 different LCA models (1–6 classes) for the data on cyclists and car drivers with less than 8 km between home and workplace. Table 4 displays the results of the estimations. We chose the LCA model with five classes for a couple of reasons. Firstly, the Bayesian Information Criterion (BIC) was lowest for five classes. Secondly, the log-likelihood-value increased with less than 1 per thousand from five to six classes and thirdly, we assessed that the minimum class size should be higher than 10% in order to be interpretable.
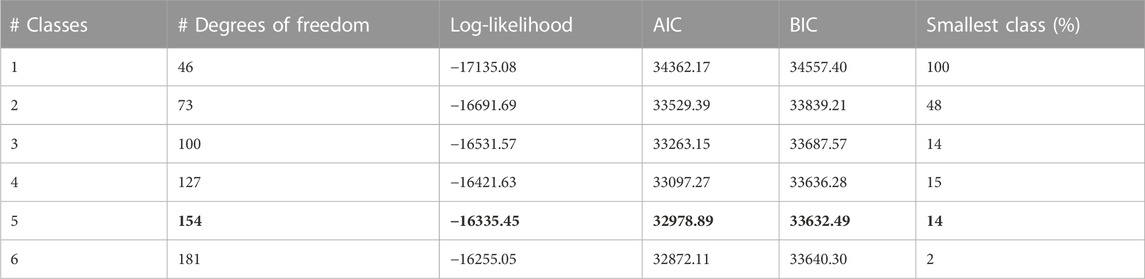
TABLE 4. Results of estimations.
We also tested a LCA model with seven classes, but the estimation did not converge because of non-concavity of the log-likelihood-function, which possibly was flat and lacked information for estimation of that many classes.
4.2 Sociodemographic characteristics
The LCA concluded that five classes could be identified. Two classes of predominantly existing car drivers, two classes of existing cyclists, and the last class being a mix. After profiling the classes, each class was given a name to represent its characteristics. In Table 5, the relative sizes of the classes and the demographic variables included in the LCA appear. Class 1 represents the “immovable motorists,” predominantly consisting of men with a vocational education having no obligations of escorting children or to go grocery shopping while commuting. Class 2 represents the “malcontent motorists,” predominantly consisting of women with a higher education and with a greater share having to escort children or go grocery shopping during their commute. Class 3 represents the segment of “beneficial commuters”, who do not tend to have strong attitudes toward the statements listed in Table 3 but distinguish themselves by being the class with the oldest commuters on average. Class 4 represents the “passionate cyclists” and is the largest class consisting of 33% of the total sample and is furthermore the class with the youngest commuters on average. Finally, Class 5 represents the “environmentalist cyclists” predominantly consisting of respondents with a higher education and with a greater share of commuters having to escort children or go grocery shopping during their commute.
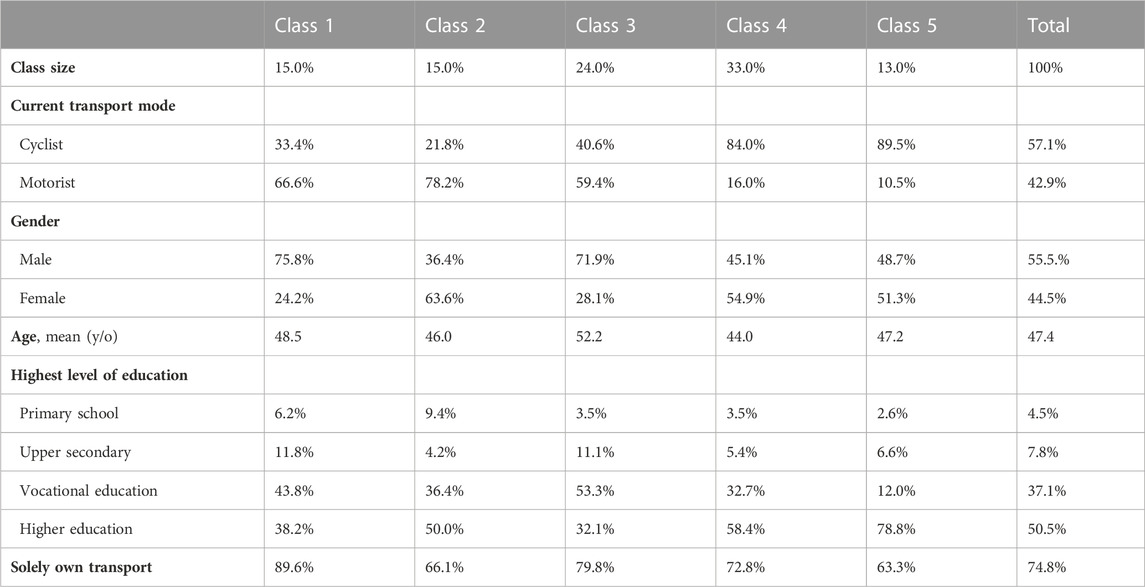
TABLE 5. Demographic overview and distribution for the five latent classes (n = 515).
4.3 Attitudinal variable
The mean scores observed for the five classes are presented in Table 6. The data clearly show that the five classes differ according to the 19 included statements and from which the naming of the classes occurs. Class 1, with the immovable motorists, is particularly characterized by a large share of the highest or the lowest mean scores in several statements and clearly represents commuters with strong attitudes. Class 1 is characterized by being the class giving environmental commute the lowest priority but states that their commute is characterized by self-determination and freedom. Furthermore, they strongly agree with liberal car use letting the single individual decide their private amount of car use. Furthermore, the class scores lowest in feeling obliged to reduce their emissions and whether they have a guilty conscience when using the car for short trips.
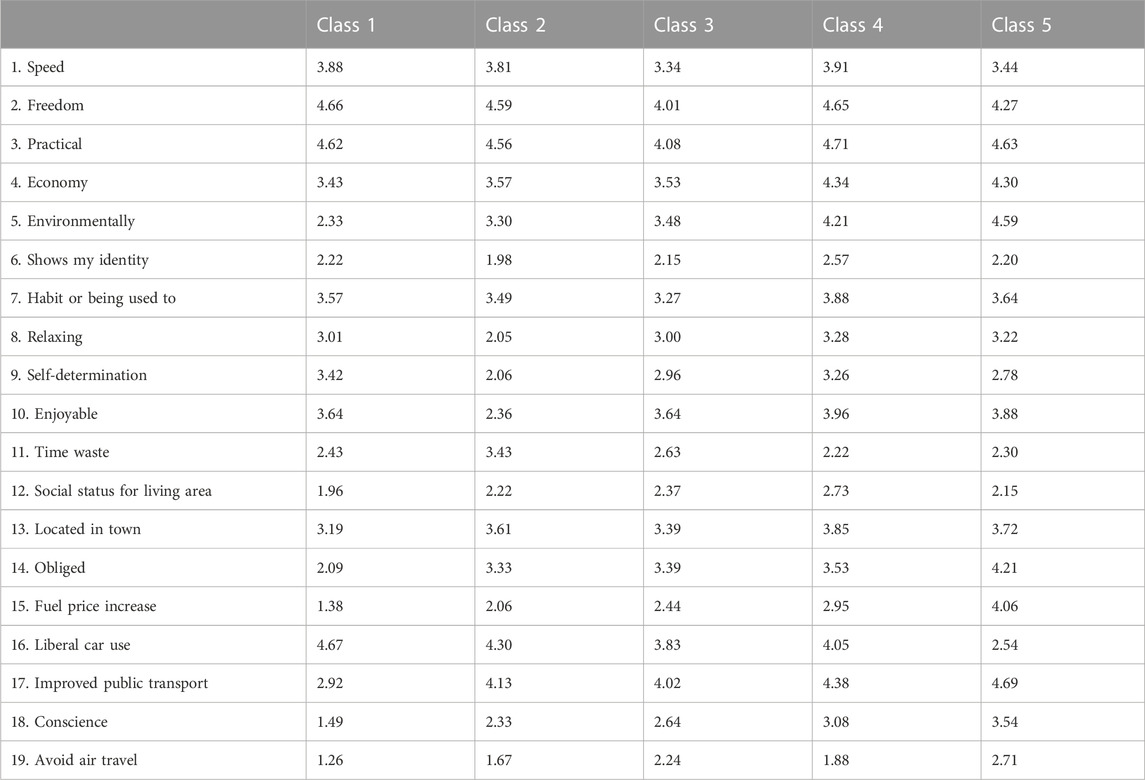
TABLE 6. Mean scores for the five classes.
From the point of view of mobility management and influencing current trends, the malcontented motorists also known as Class 2 are of big interest. This class currently exhibits high car use but also demonstrates a relatively high intention to change. Malcontented motorists exhibit negative feelings toward car travel and thus appear to act in contravention of their attitudes. These motorists do not agree on the term that their means of transport show their identities, implicitly indicating that car travel is not an irreplaceable part of their self-understanding. This is further emphasized by the class scoring the lowest in statements 8, 9, and 10, saying they do not associate their mean of transport as “relaxing” or “enjoyable” nor characterize their travel time by self-determination. Finally, this class by far scores the highest in statement 11, saying they value their travel time as time wasted. This is well illustrated in the radar diagram in Figure 3.
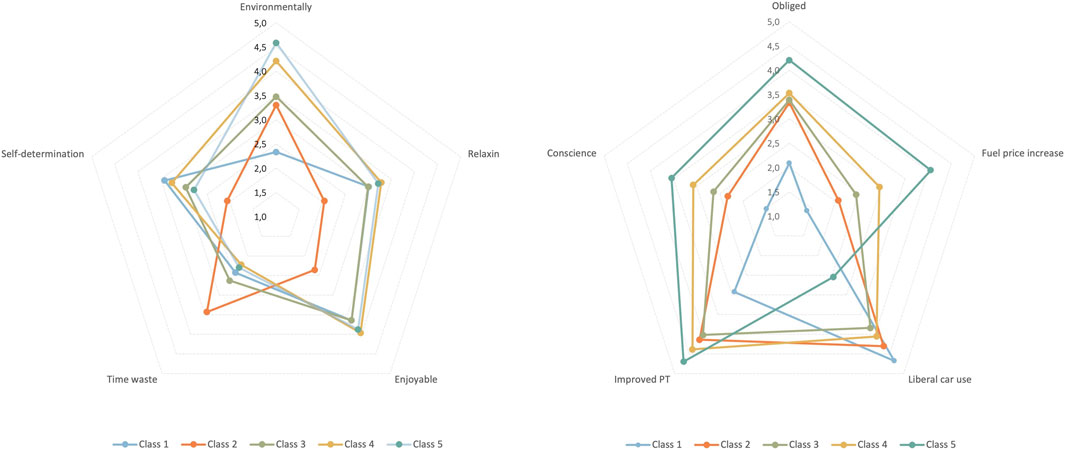
FIGURE 3. Radar diagrams showing how the five classes value different factors influencing transport mode.
In Class 3, we find a segment of beneficial commuters. The class only gained distinction by having four statements where they scored the lowest and by having the oldest commuters on average. Otherwise, commuters in this class do not tend to have strong attitudes, as they mostly score average. The class has a high share of commuters with a vocational education, and 4 out of 5 only have to escort themselves during their commute. Class 4 has quite a different distribution, as 84% are cyclists and tend to truly enjoy their commute, as shown by their low score on statement 11, saying that travel time is time wasted. Furthermore, this class average scores the highest in nine statements, particularly stating that they find their commute enjoyable, practical, relaxing, and that it shows their identity. Class 4 simply represents a group of cyclists being passionate about their commute, but with an attitude less radical compared to Class 5 of environmental cyclists. With 13% of the total sample in the class, this is the smallest class, though representing strong attitudes regarding environmental issues related to transport. This appears from the high scores in statements 14, 15, 18, and 19 illustrated in Figure 4, as the class truly stands out.
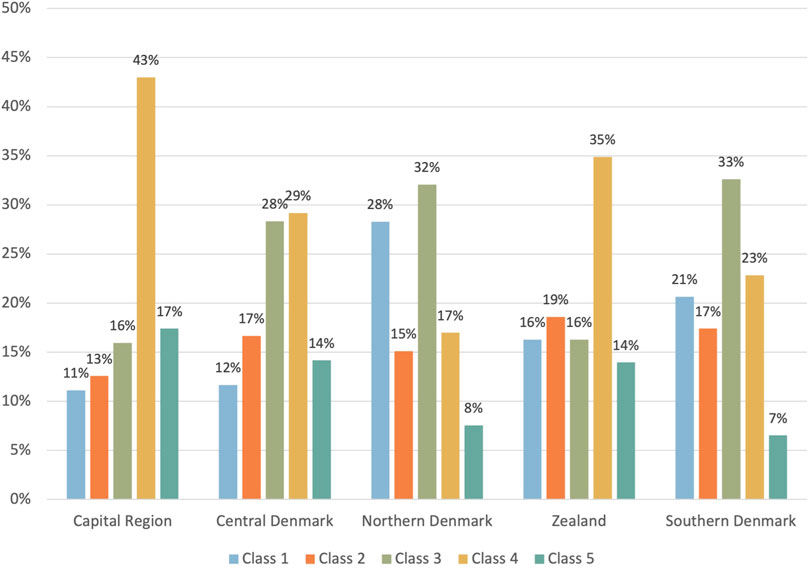
FIGURE 4. Regional distribution in the five latent classes.
A crosswise evaluation of the five classes showed no statistically significant differences regarding whether they have children living at home (p = 0.92), their marital status (p = 0.08), and household income (p = 0.34). In contrast, there is a statistically significant difference between the classes regarding gender (p = 0.00), as Classes 1 and 3 have a strong domination of male commuters. Another observation of importance was the statistically significant difference between the geographical regions represented in the classes (p = 0.00). This is expressed by the Capital Region deviating from the rest, with a particularly high share of commuters in Class 4, even though Region Zealand tends to share nearly the same distribution. Central Denmark is widely represented in Classes 3 and 4, whereas Northern Denmark stands out as the region with the greatest share of immovable motorists in Class 1. Furthermore, all five regions are represented, with 13%–19% of their commuters in Class 2, being malcontented motorists. This indicates that this class has the lowest impact from geographical residence.
5 Discussion
The performed LCA showed how Danish commuters can be grouped into meaningful classes regarding attitude, travel preferences and environmental concerns. With the primary objective to explore attitudinal factors influencing modal shift it is particularly interesting to consider the differences between Class 2 and 3 on one hand, and Class 4 and 5 on the other. Class 2 and 3 stand out by predominantly consisting of existing car drivers who, however, express attitudes indicating that their choice of transportation goes against their desires and general perception of sustainability.
Class 2 demonstrates a high intention to change, as they generally score the lowest in statements stating a favorable attitude of their present transport mode. Nevertheless, the class experiences some obstacles preventing their modal shift or has not experienced sufficient reasons to change. The two classes, and especially Class 2, tend to be in the “contemplation stage” according to Bamberg (2013), saying that a reduction of car use is being considered, but that commuters do not have a concrete strategy on how to reduce their car use yet. At this point, commuters are responsive to means of policy interventions, which could be of different character. Rasmussen et al. (2022) showed how motorists were more strongly influenced toward a modal shift when different political measures were combined and that solely improvements in public transport had little effect when not combined with interventions directly targeted to motorists. From this, we must expect Class 2, and to a certain extent Class 3, to presumably perform a modal shift if specific driving charges were placed on the motorists, as they intend to miss the small “push” that will change their current behavior. Road pricing is, compared to congestion charges, considered the best way to regulate traffic, as road pricing more fairly price externalities as car drivers pay the costs they inflict on their surroundings (Noordegraaf, 2016). As Class 2 express dislike of their current transport mode, there might also be some who are affected by soft policies and so-called “low-hanging fruits”. This could be targeted campaigns to raise awareness and demonstrate negative aspects of the car (congestion, stress) or promotional messages reinforcing their moral obligation and promoting the positive aspects of alternatives (improved health, reduced congestion, economy and environmental sustainability). Finally, commuters in Class 2 will have a greater tendency to perform a modal shift when alternative means are prioritized and if they are given the opportunity to gain individual experiences, such as renting an electric bike for a trial period. Also, it is recommended to enhance connectivity between residential areas, workplaces, and key destinations to create a more cycling-friendly environment. Policymakers are recommended to consider collaborations with local authorities, transportation agencies, and community organizations to ensure that interventions align with regional needs and capabilities.
Classes 4 and 5 on the other hand are especially dominated by cyclists, accounting for 84%–90%, with mean scores (Table 6) showing that they highly favor the two-wheeled, active transport mode. In addition, the two classes strongly substantiate the findings of Rérat (2019), with a strong link for Class 4, passionate cyclists, to Rérat’s individualist cyclists, as both groups highlight the personal benefits of cycling in terms of wellbeing and independence. Furthermore, the civic cyclists found by Rérat can be rediscovered in Class 5, the environmentalist cyclists. These groups carry extrinsic motivations, such as environmental issues and social activism, giving their mode of choice a more political meaning. From this, we can derive some general findings about motivation and characteristics for cyclists, stating that basic motivation largely cuts across geographical origin and cultural differences.
Class 5 is also distinguished as being the most radical cyclists, whereas Class 1 is the most radical motorists. The two classes experienced their mode choice as being embedded in their self-understanding and beliefs. Class 5 is already practicing the intended transport mode; we may realize that Class 1 cannot be swayed, as they fully live the cultural belief that “one has the right to be as comfortable as one can afford to be” (Kent, 2014) and strongly dominated by subjective norms not feeling personally obliged to lower their emissions of greenhouse gasses and pollution.
Anable (2005) showed some similar overall findings, although they focused on leisure trips, which are commonly known to have different trip characteristics. Nevertheless, both studies have showed few statistically significant differences with respect to sociodemographic indicators. As such, household income, marital status, and whether they have children living at home do not vary significantly among the groups in either study. This suggests that personal characteristics are not an important determinant of attitudes in the event of equivalent vehicle availability and, for our case, commuting distance. Nevertheless, both studies highlighted segments particularly open to policy measures and likely to change, suggesting smaller interventions, such as soft initiatives, as campaigns promoting positive aspects of alternatives. In line with Anable (2005), we also found that the same behavior can take place for different reasons and that the same attitudes can lead to different behaviors. Unfortunately, the present questionnaire was developed for a slightly different scope than this study carried out. Hence, the research did not further investigate what the respondents personally think could change their behavior, meaning what barriers they experience today, as this might include a great part of the explanation.
Similarly, Ton et al. (2020) used LCA to segment Dutch commuters, although the study had a quite different scope, as Ton et al. wanted to test participants’ attitudes toward various transport modes. Instead, the present study has only focused on clarifying the underlying variables and priorities that determine the current mode choice. Nevertheless, we can still draw some insightful results from the Dutch study, as Ton et al. found that individuals are generally more positive toward already-used modes compared to unused modes. The results also showed that the majority of the users exhibited a multimodal daily mobility pattern. This finding may also apply to Danish commuters, but the present study erred by making a fixed decision to separate commuters into being either cyclists or motorists based on the frequency of the given transport mode, as argued in Section 3.1. This split seems rather harsh, and there is a fair risk that the study might have missed out on some minor details caused by this.
Our study also revealed statistically significant regional differences among the identified classes of commuters. Specifically, the Capital Region exhibited a notably high representation of Class 4, the passionate cyclists, while Region Zealand displayed a similar distribution. Central Denmark, on the other hand, was widely represented in Classes 3 and 4. Northern Denmark stood out with the highest share of immovable motorists in Class 1. These regional variations suggest that commuting behaviors and attitudes are influenced by local factors, such as infrastructure, transportation options, and geographical characteristics. From this it is important to note that our study did not extensively account for the diverse range of infrastructure and opportunities available in different regions. However, it is essential to recognize the regional differences in commuting patterns and infrastructure availability to be able to tailor interventions to address specific challenges and opportunities in different regions. This will make it easier to prioritize investments in cycling infrastructure such as dedicated bike lanes, secure bike parking facilities, and bike-sharing systems, where these are absent. Future research should delve deeper into these regional disparities to better understand the interplay between commuting behavior, infrastructure availability, and policy interventions tailored to specific geographical contexts.
Nevertheless, the present study succeeded in making an attitudinal segmentation of the relevant commuters, as Haustein and Hunecke (2013) advocated. The method managed to include essential sociodemographic variables, important attitude variables, and information regarding current mode choice. There will always be a risk of biases, as the researcher initially selects which variables to include in the analysis. To accommodate this challenge in the best way, the latent classes are determined solely by data and the number of classes and their relative size. One could advocate for another threshold cycling distance, as some commuters will experience 8 km as being too long, whereas others will travel more than 30 km by bike each way. By comparison, Meinherz and Binder (2020) focused on people with a commuting distance of less than 17 km, as this corresponds to a commuting distance that can reasonably be accomplished by electric bicycles, given the average commuting time of 30 min. This also seems reasonable, given the improved opportunities electric bicycles have led to. At the same time, the possibilities for multimodal travel have increased, leading to a higher share, who will potentially be able to perform a modal shift, as public transport and bicycles in combination can be a relevant alternative to the car alone and for commuting distances longer than included in the present study.
6 Conclusion
Based on attitude-based variables, travel preferences, and environmental concerns, we divided the sample of Danish commuters into five classes using LCA. The segmentation provided insights into notable attitudinal differences among commuters, who objectively have the same preconditions. Furthermore, we found few statistically significant differences with respect to sociodemographic indicators between the five classes. From this, education and geographical residences, and to a certain extent gender, appear to be the only demographic variables to distinguish the groups, demonstrating that sociodemographic factors had a minor impact on the travel profiles for the segments. A determined attitude seems to influence the mode choice, or attitude is largely influenced by the current transport mode.
From this study, we localized five latent classes–two car-dominating classes, two classes of existing cyclists, and a class of beneficial commuters, which more widely represent a mix of motorists and cyclists. Class 2 was found to be the group of biggest interest, as they daily drive their car with discontent. The class is clearly distinguished from the others, as they do not associate their means of transport as “relaxing” or “enjoyable” and consider their travel time as time wasted. As the class expresses dislike of their current transport mode, a fair share is expected to be influenced by soft factor interventions, which will influence the individuals’ perceptions of the benefits from traveling and reinforce favorable attitudes already held. Furthermore, harder policy measures are expected to influence modal shifts among Class 2, as well as commuters from Class 3, as they represent a group of mixed commuters with no strong attitudes. This calls for a wide range of political instruments and incentives to implement them, as the segmentation has demonstrated classes of commuters who distinguish by their low commitment and self-perception, which contradicts their chosen mode of transportation. Further research should investigate the specific policy interventions that are most appropriate for targeting these specific populations of interest.
In conclusion, our study highlights the importance of understanding commuters’ attitudes and preferences in promoting modal shifts. By identifying distinct groups and their unique characteristics, policymakers can tailor interventions that effectively target and encourage mode shift towards more sustainable transportation options.
Data availability statement
The raw data supporting the conclusions of this article will be made available by the authors, without undue reservation.
Author contributions
LR, NA, and AO contributed to conception and design of the study. LR organized the database. AO performed the latent class analysis. LR interpreted the results and wrote the first draft of the manuscript. All authors contributed to the article and approved the submitted version.
Acknowledgments
We thank the Centre of Mobility and Urban Studies at Aalborg University for providing the data and we thank Erik Kjems (Aalborg University and NIRAS A/S) for the Google Maps Distance Matrix calculations.
Conflict of interest
Author LR was employed by NIRAS A/S.
The remaining authors declare that the research was conducted in the absence of any commercial or financial relationships that could be construed as a potential conflict of interest.
Publisher’s note
All claims expressed in this article are solely those of the authors and do not necessarily represent those of their affiliated organizations, or those of the publisher, the editors and the reviewers. Any product that may be evaluated in this article, or claim that may be made by its manufacturer, is not guaranteed or endorsed by the publisher.
References
Ajzen, I. (1991). The theory of planned behavior. Organ. Behav. Hum. Decis. Process. 50, 179–211. doi:10.1016/0749-5978(91)90020-T
Anable, J. (2005). ’Complacent car addicts’; or ’aspiring environmentalists’? Identifying travel behaviour segments using attitude theory. Transp. Policy 12, 65–78. doi:10.1016/j.tranpol.2004.11.004
Ashmore, D. P., Thoreau, R., Kwami, C., Christie, N., and Tyler, N. A., Using thematic analysis to explore symbolism in transport choice across national cultures. Transportation 2018 47:247, 607–640. doi:10.1007/s11116-018-9902-7
Bagheri, M., Mladenovic, M. N., Kosonen, I., and Nurminen, J. K. (2020). Analysis of potential shift to low-carbon urban travel modes: A computational framework based on high-resolution smartphone data url. http://www.mdpi.com/journal/sustainability.
Bamberg, S. (2013). Applying the stage model of self-regulated behavioral change in a car use reduction intervention. J. Environ. Psychol. 33, 68–75. doi:10.1016/j.jenvp.2012.10.001
Banister, D. (2008). The sustainable mobility paradigm. Transp. Policy 15, 73–80. doi:10.1016/j.tranpol.2007.10.005
Beckx, C., Broekx, S., Degraeuwe, B., Beusen, B., and Int Panis, L., 2013. Limits to active transport substitution of short car trips. Transp. Res. Part D Transp. Environ. 22, 10–13. doi:10.1016/j.trd.2013.03.001
Christensen, H., and Baescu, O. (2021). Technical Report. DTU - Center for Transport Analytics. Denmark. TU årsrapport for denmark 2020.
European Environment Agency, (2020). EEA greenhouse gas - data viewer. https://www.eea.europa.eu/data-and-maps/data/data-viewers/greenhouse-gases-viewer.
Gehlert, T., Dziekan, K., and Gärling, T. (2013). Psychology of sustainable travel behavior. Transp. Res. Part A Policy Pract. 48, 19–24. doi:10.1016/j.tra.2012.10.001
Haustein, S., and Hunecke, M. (2013). Identifying target groups for environmentally sustainable transport: Assessment of different segmentation approaches. Assess. Differ. segmentation approaches 5, 197–204. doi:10.1016/j.cosust.2013.04.009
Haustein, S., and Nielsen, T. A. (2016). European mobility cultures: A survey-based cluster analysis across 28 European countries. J. Transp. Geogr. 54, 173–180. doi:10.1016/j.jtrangeo.2016.05.014
Kent, J. L. (2014). Still feeling the car-the role of comfort in sustaining private car use. https://www.tandfonline.com/action/journalInformation?journalCode=rmob20.
Meinherz, F., and Binder, C. R. (2020). The dynamics of modal shifts in (sub)urban commuting: An empirical analysis based on practice theories. J. Transp. Geogr. 86, 102763. doi:10.1016/j.jtrangeo.2020.102763
Neves, A., and Brand, C. (2019). Assessing the potential for carbon emissions savings from replacing short car trips with walking and cycling using a mixed GPS-travel diary approach. Transp. Res. Part A Policy Pract. 123, 130–146. doi:10.1016/j.tra.2018.08.022
Noordegraaf, D. M. V. (2016). Ph.D. thesis. Delft University of Technology.Road pricing policy implementation, Delft, Netherlands.
Pedersen, T., Friman, M., and Kristensson, P. (2011). Affective forecasting: Predicting and experiencing satisfaction with public transportation. J. Appl. Soc. Psychol. 41, 1926–1946. doi:10.1111/J.1559-1816.2011.00789.X
Rasmussen, L. R., Agerholm, N., Olesen, A. V., and Lahrmann, H. (2022). Carrot or stick? –Traffic policy instruments to influence sustainable transport behaviour. Dan. J. Transp. Res. – Dansk Tidsskrift Transp. 4, 16–30. doi:10.5278/OJS.DJTR.V4I.6659
Rérat, P. (2019). Cycling to work: Meanings and experiences of a sustainable practice. Transp. Res. Part A Policy Pract. 123, 91–104. doi:10.1016/j.tra.2018.10.017
Risser, R., and Sucha, M., 2020. Start walking! How to boost sustainable mode choice—psychological measures to support a shift from individual car use to more sustainable traffic modes. Sustainability, Vol. 12, 12, 554. doi:10.3390/su12020554.3390/SU12020554
Sivasubramaniyam, R. D., Charlton, S. G., and Sargisson, R. J. (2020). Mode choice and mode commitment in commuters. Travel Behav. Soc. 19, 20–32. doi:10.1016/j.tbs.2019.10.007
Song, Y., Preston, J., and Ogilvie, D. (2017). New walking and cycling infrastructure and modal shift in the UK: A quasi-experimental panel study. Transp. Res. Part A Policy Pract. 95, 320–333. doi:10.1016/j.tra.2016.11.017
Steg, L. (2005). Car use: Lust and must. Instrumental, symbolic and affective motives for car use. Transp. Res. Part A 39, 147–162. doi:10.1016/j.tra.2004.07.001
Ton, D., Zomer, L. B., Schneider, F., Hoogendoorn-Lanser, S., Duives, D., and Cats, O., 2020. Latent classes of daily mobility patterns: The relationship with attitudes towards modes. Transportation 47, 1843–1866. doi:10.1007/s11116-019-09975-9
Vermunt, J. K., and Magidson, J. (2002). Latent class cluster analysis. Appl. Latent Cl. Anal. 89. doi:10.1017/CBO9780511499531.004
Keywords: modal shift, latent class analysis, sustainable transport, active transport, travel behavior
Citation: Rasmussen LR, Agerholm N, Lahrmann H and Olesen AV (2023) Exploring attitudinal factors influencing modal shift: a latent class analysis of Danish commuters. Front. Future Transp. 4:1140572. doi: 10.3389/ffutr.2023.1140572
Received: 09 January 2023; Accepted: 22 May 2023;
Published: 06 June 2023.
Edited by:
Sonja Forward, Swedish National Road and Transport Research Institute, SwedenReviewed by:
Feixiong Liao, Eindhoven University of Technology, NetherlandsRalf Risser, Palacký University, Olomouc, Czechia
Copyright © 2023 Rasmussen, Agerholm, Lahrmann and Olesen. This is an open-access article distributed under the terms of the Creative Commons Attribution License (CC BY). The use, distribution or reproduction in other forums is permitted, provided the original author(s) and the copyright owner(s) are credited and that the original publication in this journal is cited, in accordance with accepted academic practice. No use, distribution or reproduction is permitted which does not comply with these terms.
*Correspondence: L. R. Rasmussen, bGluckBuaXJhcy5kaw==