 Ebtehal T. Alotaibi
 Thaqal M. Alhuzaymi3
 J. Michael Herrmann
- 1Institute of Perception, Action and Behaviour, School of Informatics, University of Edinburgh, Edinburgh, United Kingdom
- 2Department of Computer Science, College of Computer and Information Sciences, Imam Muhammad Ibn Saud Islamic University, Riyadh, Saudi Arabia
- 3King Abdulaziz City for Science and Technology (KACST), Riyadh, Saudi Arabia
We present an overview of ten case studies of Autonomous Mobility on Demand (AMoD) transportation systems, which are based on realistic data from different urban contexts. Comparing AMoD systems with Conventionally Driven Vehicles (CDV), the limits of reduction of vehicles, the cutting-back of parking spaces, and the increase of empty miles are investigated. As a result of introducing a shared fleet of autonomous vehicles (AV), the analysis demonstrated that 88%–93% of CDV are not required to meet realistic requirements. Parking spaces can be reduced by 83%–97%, while empty miles could be increased by 6%–15%. Nonetheless, fleet dispatching techniques that use the advanced optimization algorithms can reduce the ratio of empty miles by as much as 40%. Consequently, we propose a standard procedure for conducting intelligent transportation system studies (ITS) that can assist in the planning of traffic on urban environments at operational, tactical, and strategic levels. Furthermore, the case studies enabled us to design an Intelligent Transportation System Readiness Level (ITS-RL) scale to assess the realism of case studies, facilitate risk assessment, and provide guidance on how to incorporate AMoD system within a local context.
1 Introduction
Industrialization and urbanization have resulted in a rapid development of the global economy. Currently, there are more than 500 urban areas that contain more than one million people. In addition, a United Nations report (Pishue, 2020) notes that the level of urbanization in 2008 surpassed the 50% mark, up from the 30% of the population that lived in cities 50 years ago, Furthermore, it is estimated that by 2050, 66% of humans will live in urban area. Recently, it has surfaced that due to the rapid growth of the urban population, the infrastructure will not scale appropriately with the increased requirements and, as a result, will deteriorate. Likewise, also public services will tend to become inadequate, and energy supply may not maintain the required levels. This development results in urban challenges such as traffic congestion, lack of housing, insufficient infrastructure development, and environmental pollution. In order to meet the enormous transportation demands of metropolitan areas in particular, increasingly innovative solutions are required.
Although, in particular transportation issues are important here, it must also be noted that nearly 1.35 million people die on roads worldwide in every year which is an unacceptably high number. It is estimated that today road traffic accidents represent the leading cause of death among children and young adults aged 5–29 years (Organization, 2015). In addition, approximately 3% of the international gross domestic product is attributed to road accidents from 2015 to 2030, accounting for US$ 1.8 trillion (Goniewicz et al., 2016). According to a recent study that analyzed the causes of car accidents, at least 90% of them were caused by driver error (Penumaka et al., 2014).
There is evidence that the transport sector is responsible for almost 30% of all energy consumption globally, with 94% of that energy coming from liquid fuels such as oil, while overall emissions from this sector are about 21% (du Can and Price, 2008). The transportation industry on a global scale is a significant contributor to environmental pollution, with the emission of over seven billion metric tons of carbon dioxide (GtCO2) in 2021. Among the various modes of transportation, passenger cars emerged as the largest emitter, responsible for approximately 39 percent of the total emissions generated by the global transportation sector during that year (Tiseo, 2023).
On the other hand, private cars are a major contributor to traffic congestion, pollution, although vehicles are typically underutilized. Every year, drivers waste an average of 118 h per year on the Cross Bronx Expressway, which is ranked as the worst road in the US for the third consecutive year. As for the United Kingdom cities, London was deemed to be the most congested in 2019 with 149 h lost by drivers, followed by Belfast (111 h), Bristol (103 h), Edinburgh (98 h) and Manchester (92 h) (Pishue, 2020). In addition, numerous studies have demonstrated that traditional transportation systems, and especially private vehicles with combustion engines, have an unsustainable environmental impact (International Transport Forum, 2017). A potential solution of the aforementioned problems is the advancement of the autonomous vehicles (AVs), which enable all users to access goods and services through an innovative transportation concept known as the Autonomous Mobility on Demand (AMoD) transportation system. Introducing shareable AVs might have a positive impact on reducing the overall number of private cars on the road. In this way, oil dependency, pollution, low utilization rates, and parking lot sprawl issues can be directly addressed (Zhang et al., 2015). It is essential to effectively manage the distribution of the AVs to ensure the efficiency and effectiveness of any AMoD transportation system under changing spatial and temporal conditions.
AMoD transportation systems have been subject to a number of critical reviews, and some of the most important studies will be presented below. For example, a survey of Singaporean transport modes was conducted in order to explore existing modes affect the adoption of an AMoD transportation system (Mo et al., 2021). Although AV were previously considered only in the context of AMoD, it is crucial to examine the impact of autonomous public transit systems together with that of private AVs. In this context, the acceptance of ride sharing is explored in depth in (König and Grippenkoven, 2020). A survey has found that 90% of respondents would prefer to share a 10-min ride with a discount of 50% or more compared to a private ride. Insecurity is another factor which determines travelers’ willingness to share rides in autonomous public transport systems.
AMoD transportation system acceptability analysis before and after first-use is provided in (Distler et al., 2018), participants expressed feeling reassured about safety concerns as a result of the analysis. On the other hand, perceived usefulness and performance expectancy were significantly reduced as a result of inadequately effective AMoD system design.
In addition to the consumer perceptions of AMoD, an effective management of information regarding demand is crucial in AMoD transportation system. In Wen et al. (2019), researchers classify, measure, and evaluate information collected in order to develop an AMoD system. They report that demand effectiveness is strongly influenced by assumptions about AMoD market structure, fare schemes, and hail and sharing policies. An in-depth analysis of methods and tools for modeling and solving problems associated with AMoD transportation system can be found in Zardini et al. (2021). Particularly, they identify problematic settings for AMoD systems analysis and control, both from a planning and operational perspective. Modeling issues such as transportation networks, traffic demand, congestion, operational constraints, and interactions with existing infrastructure are discussed. They then provide a systematic analysis of existing solutions and performance metrics, identifying trends and outlining trade-offs.
A number of review articles comprehensively analyze various aspects of AMoD systems, such as problem settings, modeling, solutions, and performance metrics (Zardini et al., 2021; Zardini et al., 2022). They emphasize the need for new mobility paradigms due to urbanization and increasing travel needs (Zardini et al., 2021; Zardini et al., 2022). Furthermore, the potential benefits of AMoD systems, including increased convenience, safety, and mobility for non-drivers, have garnered significant interest (Zhang et al., 2015). In Soteropoulos et al. (2019), several studies investigating the impacts of AVs on land use and travel behavior are reviewed. The work in Lavieri et al. (2017) provided a model of AV adoption and use by users based on their age and educational background. The study identified an attitudinal factor that might influence behavioral intentions to ride AMoD system (Gkartzonikas and Gkritza, 2019).
Jing et al. (2019) examine the impact of AV technology on mode choice intention and the factors influencing travelers’ intentions to use AVs and SAVs. Their study identifies knowledge about AV technology and perceived risk as potential obstacles to the adoption of AVs and SAVs. They find that attitude and subjective norm significantly affect travelers’ intentions to use AVs, while perceived behavioral control plays a role in influencing intentions to use SAVs. This research provides insights into the factors shaping individuals’ intentions towards AV and SAV usage, highlighting the importance of addressing knowledge gaps and addressing perceived risks to promote adoption in the future. Othman, K. (2022) highlights the lagging legal framework and regulations surrounding AVs. It covers the implications of AVs on safety, public behavior, land use, economy, society, environment, and public health. This comprehensive review serves as a valuable resource, providing insights into the potential advantages and challenges of widespread AV adoption. In another comprehensive review by Narayanan et al. (2020), the focus is on SAV services, categorizing the anticipated impacts into various groups such as traffic and safety, travel behavior, economy, and environment. Moreover, Iglesias et al. (2017) have conducted studies exploring the potential of AMoD systems in reducing passenger cost-per-mile traveled and analyzing coordination algorithms for these systems. The modeling and assessment of AMoD services have been carried out using simulation-based approaches and analytical methods, as observed in studies by Azevedo et al. (2016) and Twumasi-Boakye et al. (2021). However, despite the increasing number of published papers in this area, there remain research gaps that necessitate further investigation (Twumasi-Boakye et al., 2021; Zardini et al., 2021).
Based on our knowledge, the review conducted in (Narayanan et al., 2020) is the only comprehensive review that looks at many of the envisioned impacts of AMoD transportation systems in seven broad categories, including traffic and safety, travel behavior, economics, transportation supply, land use, and governance. Various Shared Autonomous Vehicles (SAV) services are presented as a typology, along with an explanation of their components. An explicit focus is given to issues relating to the expected demand patterns and possible policy framework requirements.
Our study discusses these aspects through ten case studies and offer a framework for the analysis of their results. Our main contributions are.
• Review methods and data sources for the case studies, quantify their results by aggregating common measures, highlight and discuss the boundaries of common results in light of theoretical arguments and possible reasons.
• Propose a standard procedure for conducting intelligent transportation system studies that can assist in the planning of traffic on urban roads at operational, tactical, and strategic
• The concept of a Technology Readiness Level an Intelligent Transportation System Readiness Level (ITS-RL) scale to assess the realism of case studies, to assist with risk assessment, and to provide guidance on how to implement AMoD transportation systems within a given local context.
The remainder of this paper is structured as follows; in Section 2 we describe the selected case studies. In Section 3, we analyze and present the results of the AMoD system case studies for each city. We present in Section 4 the standard intelligent transportation system studies (ITS) procedure, and a realistic scale for evaluating ITS. Finally, in Section 5, we discuss the insights gained through this study, and we offer suggestions for future studies.
2 Case studies
The objective of this section is to provide a comprehensive summary and assessment of the existing models for autonomous Autonomous Mobility on Demand (AMoD) systems, with a focus on comparing them to Conventionally Driven Vehicles (CDV). The case studies have been carefully selected based on the following criteria.
• Geographical Diversity
The chosen case studies represent various continents. Melbourne (Australia) represents the continent of Australia, while Lisbon (Portugal), Stockholm (Sweden), and Zurich (Switzerland) represent Europe. Singapore represents Asia, and Austin, San Francisco, Ann Arbor, BABCOCK RANCH, and Manhattan represent North America. By including cities from different regions, a global perspective on AMoD systems is achieved, allowing for a comprehensive examination of their impacts, challenges, and diverse implementation approaches.
• Varied Urban Characteristics
These cities showcase diverse urban characteristics encompassing factors such as population density, infrastructure development, urban planning strategies, and transportation systems. The classifications include high-density metropolises such as Singapore and Manhattan, tech hubs including San Francisco, Austin, Zurich, and Stockholm, and diverse urban areas like Melbourne, Lisbon, and BABCOCK RANCH.
• Range of Implementation Scales
The selected case studies cover a wide range of implementation scales, encompassing cities of different sizes and population densities. This inclusivity ensures that the analysis captures the diverse challenges and opportunities associated with AMoD systems across various urban contexts.
• Availability of Comprehensive Data
The case studies were chosen based on the availability of comprehensive and relevant data necessary for conducting a thorough analysis. These cities have well-documented AMoD initiatives, enabling detailed examination and meaningful comparisons.
By considering these factors, the selected case studies provide a solid foundation for the analysis, facilitating a comprehensive evaluation of AMoD systems in comparison to CDVs.
A majority of the reviewed models evaluated AMoD system performance by minimizing vehicles and empty miles, maximizing Quality of service (QoS) in term of reducing waiting times, and assessing operational policies used to control the fleet (Table 1).
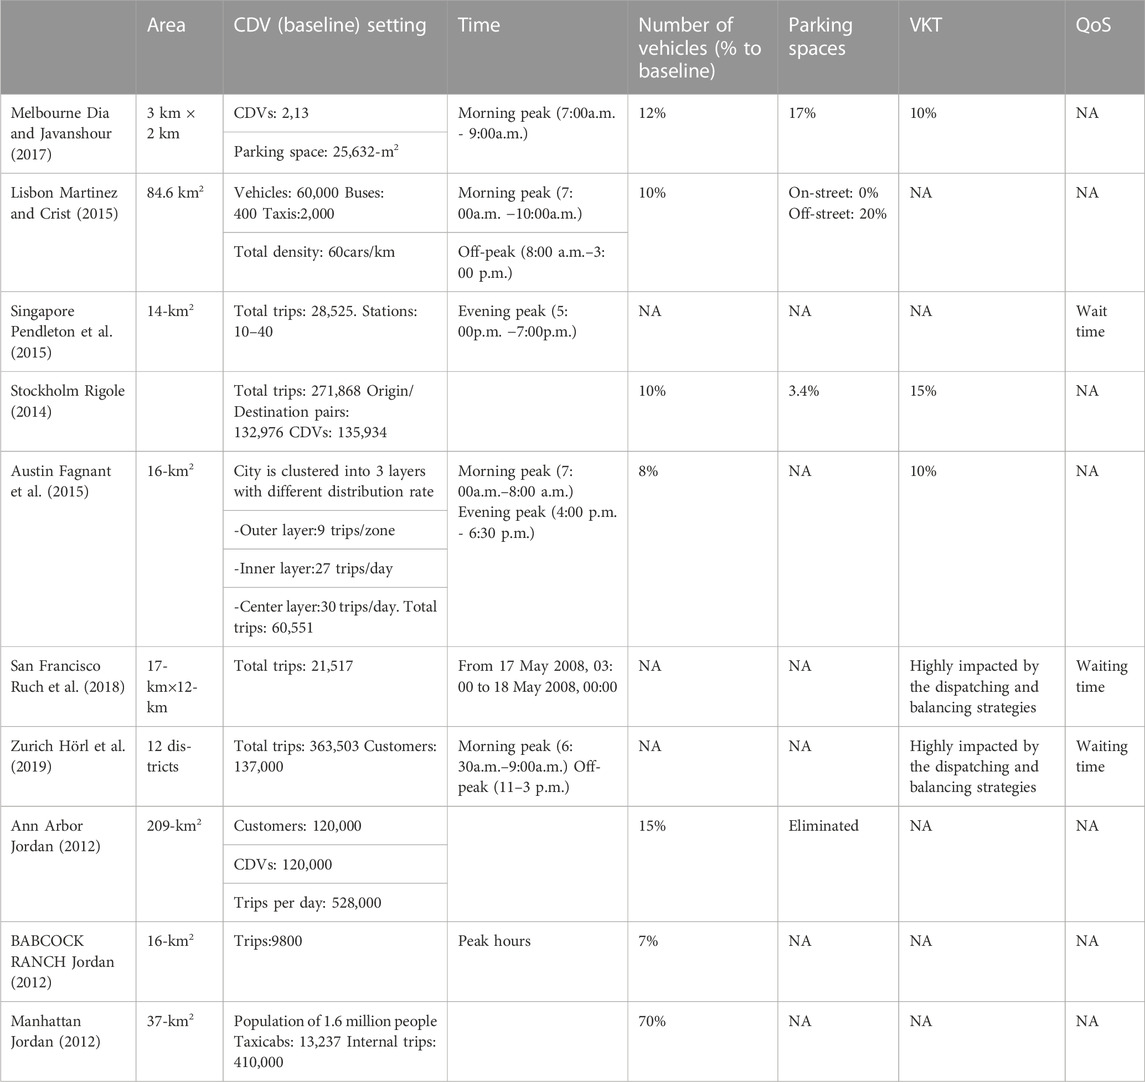
TABLE 1. Case studies characteristics.
2.1 Melbourne
A study conducted in Melbourne (Dia and Javanshour, 2017) explored the possibility of using computational tools to simulate and assess the implications of the AMoD system. The study is conducted on a real-world, small-scale pilot area. On the basis of the distribution of trips during the morning peak (Transport, 2009), the origins and destinations are categorized into nine broad regions. A table presents a count of trips between each of the two regions, as well as the median travel time and length. Two alternative scenarios were presented and compared with the scenario of CDV. In the first scenario, AV was assumed to be privately owned. Accordingly, AVs were assumed to be equal to the CDVs, and no waiting period was considered. When compared with the CDV scenario, the number of necessary cars decreased by 40% and the number of parking spaces by 58%. The number of Vehicle Kilometers Traveled (VKT) increased by 29% due to the need to relocate vehicles. In the second scenario, the number of AVs was not specified. Consequently, the problem of determining the number of launch vehicles while maintaining a 5-min waiting period became a challenge. The number of AV is set to the number of incoming trips for each region if the number of incoming trips is higher than the number of departing trips. Whenever a client waits longer than 5 min, this total amount will be adopted until 20 iterations. As compared to CDV, the number of cars and the number of spaces needed to satisfy demand decreased by 88% and 83%, respectively, but the volume of vehicle kilometers traveled increased by 10%.
2.2 Lisbon
The Lisbon case (Martinez and Crist, 2015) evaluated an AMoD system for a large area. The road network model is combined with a distribution of trips derived from the Lisbon Travel Survey (DA et al., 2005). The slow mode (walking, bicycling) is applied to trips that are under 1 km, while the AV and public transit modes (Metro) are assumed for other trips. Two types of AVs exist: the TaxiBot, a self-driving vehicle that can carry a number of passengers simultaneously, and the AutoBot, which will pick up and drop off one passenger at a time. A variety of scenarios are included based on different mobility modes (cars, ride-sharing), accessibility of public transportation, penetration rate, and simulation time. In the basic scenario, the AMoD system meets the precise transportation demand in Lisbon with only 10% of the vehicles and 6% more VKT. Parking on the street is not necessary when using the AMoD system. Additionally, 80% of off-street parking can be eliminated, which amounts to approximately 20% of the city area. Because the number of AVs was set to a fixed number, the model cannot be generalized.
2.3 Singapore
An investigation AMoD system performance in the moderately sized Central Business District in Singapore (Pendleton et al., 2015), assessed the increase in the number of vehicles and the location of charging stations. Home interviews and a travel survey with origins, destinations, and travel times were used to create the CDV (Singapore, 2008). The fleet arrangement will be tested with two configurations. A dropped-off vehicle tries to find the closest charging station when station-based configured. When a vehicle drops off a consumer, a float-free vehicle expected to stop and charge. For the study, AV together with public transport were assumed to provide 100% of the transportation within the Central Business District. Increasing fleet size would increase served customers by 3.7% in free-floating configurations and 2.2% in station-based configurations. The decrease in service quality in later configurations is a result of empty miles and congestion. The study showed that charging facilities can be located in such a way as to reduce the congestion on the roads.
2.4 Stockholm
In the Stockholm case study (Rigole, 2014), researchers examined the potential benefits of operating a fleet of Shared Autonomous Vehicles (SAVs). The sample was assembled using a representative sample of trips gathered from an analysis of travel and passenger behavior in Stockholm (Jonsson et al., 2011). The start time distributions are assumed to be Gaussian during morning and evening peaks. In this study, the CDV scenario was compared to simulation results for self-driven vehicles. The SAV system would take into account the same rate of demand as in the case of CDVs with 10% fleet sizing. Moreover, SAV parking has decreased dramatically to 3.4% of CDV parking spaces with better utilization of vehicles. As a result of an increase in empty miles in SAV, VKT increased by 15% in SAVs.
2.5 Austin, Texas
For the Austin case (Fagnant et al., 2015), researchers developed an agent-based model for Shared Autonomous Vehicles (SAVs). Based on NHTS (trip-distance) data (Santos et al., 2011), start of trip and distance distributions are generated, and in 5-min intervals, destinations are assigned to each trip, and the durations are sampled over a 24-h period from a Poisson distributions. In order to generate the sampling, an approximation method is used to sample the route and destination of directed trips. Grid-based metropolises have three levels, with constant demand in the outer layer, intermediate in the middle layer (2.5 miles away from the centre), and high in the core. Rebalancing the fleet at the start of the day and finding the optimal number of cars was the challenge they solved. The simulation of an AV fleet of 9% of CDVs served the same number of customers as CDVs. Therefore, each AV would replace about eleven CDVs and add 10% more VKT. The trip data in this study is affected by multiple factors, such as the peak area and time of day. It would be beneficial to examine the demand variations between workdays and weekends in order to obtain more realistic results.
2.6 San Francisco, California
The case study of San Francisco served as a first test case for AMoDeus (Ruch et al., 2018), a non-commercial software package that provides quantitative and precise AMoD systems. Four new dispatching and rebalancing policies were proposed. The Load Balancing heuristic (LBH) analyzes the number of requests and the number of available cars for determining the optimal balance. Whenever the number of vehicles available exceeds the number of requests, the policy assigns each request to the closest vehicle, otherwise it assigns each vehicle to the nearest request. The Global Bipartite matching (GBM) policy uses a periodic method of distributing requests to vehicles in order to decrease the total distance between the two vehicles Bischoff and Maciejewski (2016). By using the Feedforward Fluidic Rebalancing Policy (FF), the city is divided into regions in a preprocessing step. Then, using a linear programming formulation, it reduces the overall rebalancing distance towards equilibrium per step, thereby decreasing energy consumption. The Adaptive Real-Time Rebalancing Policy (AU) is shown to be an enhancement to the preceding policy. The number of rebalancing vehicles between any two areas can be calculated using a linear program with an unimodular constraint matrix (Pavone et al., 2012). Based on taxi traces (Kotz and Henderson, 2005) collected in a moderately-sized San Francisco area, the simulation model was developed. All policies have a maximum wait time of 15 min, and the wait time decreased as the fleet size increased. The policy selected can have a significant effect on the empty distance traveled in addition to the overall distance traveled. In contrast to the previous studies, the results for San Francisco are based only on taxi data, and they do not represent CDVs.
2.7 Zurich
In a case study of Zurich (Hörl et al., 2019), four operational strategies were observed in the management of the AMoD system simulating twelve districts of the city. From the Microcensus on Mobility and Transport (Federal Statistical Office, 2012), researchers can estimate the demand of AVs based on daily travel patterns. If both destination and origin are in the service area, the system replaces every trip by public transportation. By sketching all potential trips inside the service area, trips by CDVs were assumed then replaced by AV. The trips that were taken by slower modes of transportation (by bike and by foot) were not replaced. An in-depth assessment is conducted for each of the dispatching and rebalancing policies proposed in (Ruch et al., 2018).
It has been found that AMoD systems are six times more likely cover the demand than CDVs. Furthermore, the policy chosen has a significant impact on the overall distance and empty spaces traveled. Based on the AMoD systems costs in Switzerland, the operating costs are calculated by using occupancy, share of empty miles, operating time, average speed, and service duration per passenger. Due to the fact that the size of the fleet directly affects the occupancy factor, the results of the study show that the operating cost increases linearly with the size of the fleet. In addition, the results indicate a decrease in the price when waiting time increased, which can be achieved by a decrease in fleet size. In order to provide a full understanding of the financial impact, the AMoD system price is compared with different mobility options in Switzerland. According to AMoD prices, the range derives from short- and long-term car price projections. Also, the AMoD price in all cases would be less than the taxi service’s base price. Even after taking into account transportation waiting time, the costs were higher than public transportation. In spite of using real data in this work, only public transport trips are replaced by AVs, whereas CDVs are generated randomly and automatically assigned to AVs. As a result, the variation between peak and off-peak results can be explained by public transportation trips only.
2.8 Ann Arbor, Michigan
The city of Ann Arbor (Jordan, 2012) evaluated a system of CDVs in a very large area in comparison to AMoD transportation system. In compiling this report, data from the National Household Travel Survey (Transport, 2009) were used, which included the overall number of trips that are made per day, the duration of those trips, the distance and speed of those trips, as well as the average number of riders. In comparison with CDVs, the simulation indicates that a fleet of 18,000 vehicles (15% of CDVs) will be used 75% of the time to service 100% of request within 1 min. Ownership costs are expected to be reduced by 84% with a slight rise in operating costs due to repositioning AV. Moreover, the operating costs could be minimized by implementing an AV system developed specifically for the purpose. In comparison with a general-purpose AV, the mass and energy of a purpose-built AV are reduced by one-tenth. For purpose-built AV, operating costs are reduced by 40%. Definitions of extra costs are discussed in more detail. Since the fleet will be used 75% of the time, it is expected that parking costs will drop by 75%. Moreover, the most significant and least significant incomes of individuals are considered in determining the cost of time. According to the AMoD system, clients can save from 6.25% to 12.5% of their annual income based on the specified time value.
2.9 Babcock Ranch, Florida
For Babcock Ranch town, Authors (Jordan, 2012) seek to compare the advantages of an AMoD transportation system with those of the CDVs in a relatively small area with only half the land accessible to transportation. The AMoD system is supposed to be used by customers traveling within the city. In addition to the number of trips made each day, speed and distance traveled are the only trip-related statistics shown (David Plummer & Associates, Inc., 2011). Based on the distances between the two points, beginnings and ends of trips are assumed at random. It was found that with an AV fleet of just 6%–8% of CDVs, all trips could be served in under a minute, and that the fleet would be utilized 70% of the time.
2.10 Manhattan, New York
An assessment of the expenses and advantages of replacing Yellow Taxicabs with AMoD transportation system was conducted on the island of Manhattan (Jordan, 2012). Throughout the study, they considered the statistics from Fare Share NYC as well as the Taxi and Limousine Commission (TLC) (Lagos, 2003). As compared to Yellow Taxicabs, AMoD system operated a fleet of cars that served the same number of request with 70% of the number of cars used by Yellow Taxicabs. Additionally, waiting times for AV can exceed 5 min when hailing AV from the street, while waiting times for preordered AVs can be as short as less than a minute. As part of the cost analysis, the fares include the overall ownership cost, the total operating cost, the pay of the driver, and the total revenue of the business. Therefore, AV would charge 8% of Yellow Taxicabs’ prices. The decline is due to fewer cars being needed, removing driver pay, and reducing operation costs. In the Yellow Taxi system, empty miles have a significant impact on operating costs. The excessive amount of empty kilometers in taxis is the result of weak coordination between vehicles and clients. Therefore, a professionally coordinating agents of AV systems can minimize this issue. For Manhattan, no CDVs are included because the data is only based on taxis as opposed to the previous studies.
3 Aggregated results and discussion
Through the case studies, we quantify the size of each AV fleet as well as parking spaces, Vehicle Kilometers Traveled (VKT) and pricing scheme compared to Conventionally Driven Vehicles (CDV) in the dataset description. Using two case studies on control of operational policies, we describe their optimized QoS in light of the improvement of AMoD transportation system.
3.1 Significant decrease in vehicle number and parking spaces
In six cities across three continents, across the performance of AMoD system and CDVs system, all results in Figure 1 demonstrated that a shared fleet of fleets can significantly reduce the number of vehicles required to meet the same realistic traveling demand as conventional transportation. There was a large scale study carried out for Ann Arbor, whereas only a pilot area was considered for Melbourne. However, regardless of the size of a city, the number of AVs that are required to meet the real demand is between 5% and 15% of those CDVs in the city. As Yellow Taxicabs were replaced by AVs in the study, the weaker outcome for Manhattan did not result in a different conclusion. Taxis run in a shared mode, which means that they already run on demand and are more efficient than the CDVs.
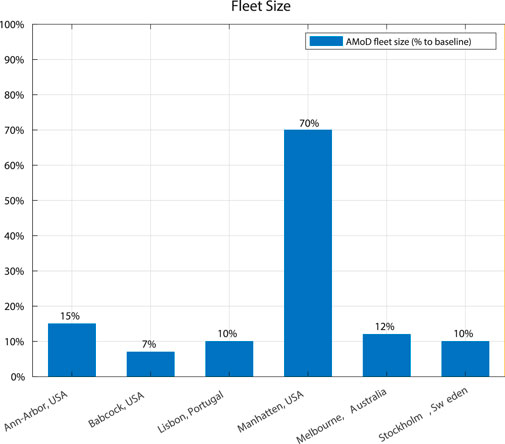
FIGURE 1. AMoD system fleet size as proportion to the CDVs system in case-studies.
As shown in Figure 2, the majority of parking spaces are ineffective as most of the vehicles are effectively utilized.
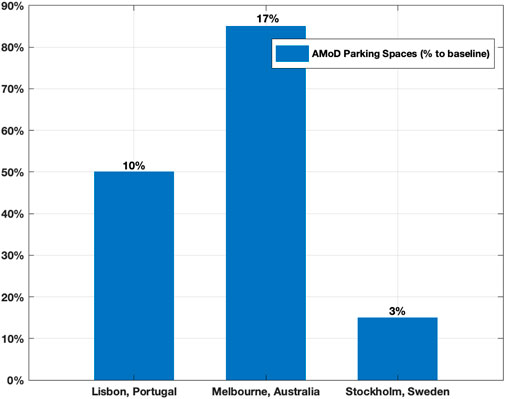
FIGURE 2. Parking spaces of AMoD systems proportion to the CDVs system in case-studies.
Parking in the United Kingdom occupies a significant amount of land, comparable in size to Birmingham (policy.friendsoftheearth.uk. 2019). Similarly, in Lisbon, a moderately sized area, a simulation model indicates that the introduction of an AMoD system will result in the elimination of all on-street parking spaces. Furthermore, due to the increasing utilization of vehicles, off-street parking in Lisbon will decrease by 20%. Consequently, a larger portion of the city’s land will become accessible for various purposes. This transition is expected to have a beneficial impact by reducing traffic congestion in heavily congested areas of the city. The Melbourne study also considered a very small, crowded area, and its results indicated that parking spaces have been significantly reduced.
The quantitative results discussed above are not surprising, and many publications mention that people only drive their CDVs for a small amount of the time. More precisely, U.S. Nationwide Personal Transportation Survey (NPTS) data show that drivers spend 1.2 h (or 5%) per day on average behind the wheel (Barter, 2013). UITP Millennium Cities data shows that in 84 cities during the day 95.8% of cars are parked, meaning that for 4.2% of the time cars are actively moving (Rodrigues, 2018).
According to a study conducted in London, cars in the United Kingdom spend 96% of the time parked [Bates and Leibling (2012)]. The RAC Foundation in the United Kingdom determined that on average, a car is parked in its home for 80% of the time, parked somewhere else for 16% of the time, and is only mobile for 4% of the time.
In most case studies, the AMoD fleet capacity was measured during peak time and in cities, so the reduction percentage happened more away from peak time and areas. In addition, a larger class of improvements could be introduced considering effective rebalancing techniques. Dispatching and rebalancing policies have a significant impact on the quality of AMoD system services, as shown in studies in San Francisco (Ruch et al., 2018) and Zurich (Hörl et al., 2019).
3.2 Increase in vehicle kilometers traveled
In this section, we discuss the findings of our study regarding the potential negative impacts that cannot be entirely avoided at present. The study highlights a significant increase in the total number of kilometers traveled when comparing AMoD systems to Conventionally Driven Vehicles (CDV), which serves as a primary contributing factor to these impacts. This increase can be attributed to various factors.
Firstly, the implementation of the AMoD system involves serving multiple customers across different locations, leading to empty miles between successive customer trips. Additionally, the repositioning of vehicles and driving towards charging stations contribute to the overall increase in kilometers traveled. Moreover, since the AMoD system operates as a cooperative fleet, the relocation of vehicles to different areas also results in increased empty miles.
According to Figure 3, the study demonstrates that while the percentage increase in Vehicle Kilometers Traveled (VKT) ranges from 6% to 15%, it is not as substantial as the reduction in the number of vehicles operating in the system.
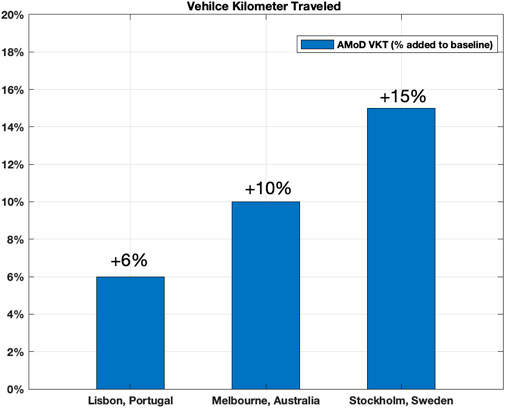
FIGURE 3. Vehicle Kilometer Traveled as proportion to the baseline (CDV).
3.3 Competitive cost scheme
The pricing scheme of AMoD system is discussed extensively in three studies, see Figure 4. Public transportation fees in Zurich are considerably lower than those charged in the other cases. Possibly, this could be attributed to the high use of buses as well as the high sharing factor for bus trips between stations. In the short run, CDVs are cheaper than an AMoD system, but AMoD offers a cheaper service in the long run. Taxis are the transport system closest to AMoD, because they provide also on-demand, public, and point-to-point service. However, due to driver wages, fuel cost, and the total cost of a trip is more expensive for taxis. For Manhattan and Ann Arbor, the comparison was based on the ownership and operation costs. As compared to CDVs, the cost of trips would be much lower for the customers. Taking parking and time prices into account, the Ann Arbor study shows the efficiency of AMoD. Parking prices are calculated based on the percentage of AMoD vehicles parked, while time-related costs are calculated based on people’s hourly income.
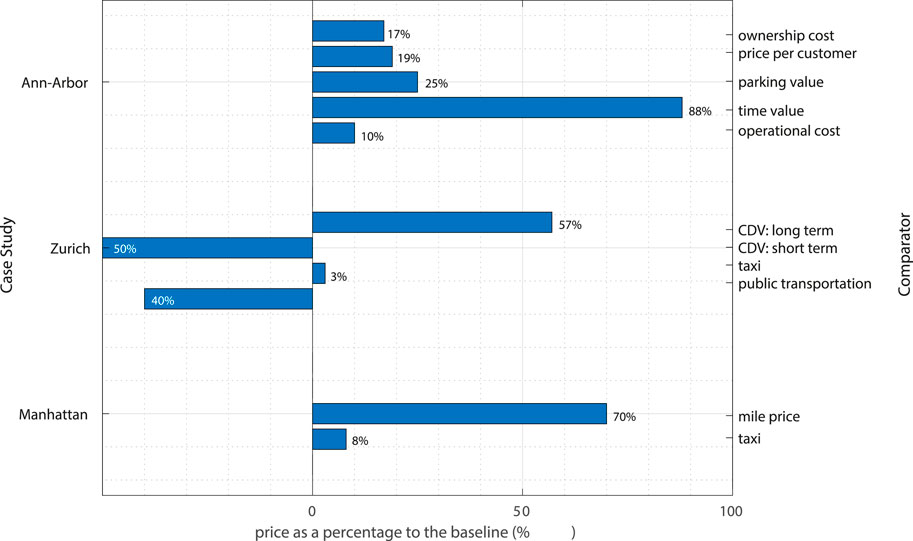
FIGURE 4. Cost analysis of AMoD system as proportion to the privately-owned cars.
3.4 Amenable results
An AMoD transportation system does also have negative impacts, but we will see in the following that these are more manageable than similar issues with CDVs and taxis. In Figure 5, dispatching policies in two cities are compared on their effect on the amount of empty miles (Section 3.2). There is almost no difference in the effect of the dispatching policies in the two cities, even though the scenarios are totally identical1. As a consequence of rebalancing, the respective algorithms (AU and FF) have the least steep slopes (See Figure 5), meaning they benefit less by increasing fleet sizes than the others. In the non-rebalancing algorithms (GBM and LBH), an increase in vehicle number will result in the availability of more vehicles when a request comes in. Thus, the empty distance ratio decreases strongly. Because it focuses on minimizing vehicle kilometers travelled, GBM produces the least empty distance. Independently of the fleet size, a uniform distribution of vehicles took more time to respond and to rebalance in the AU algorithm. However, in both cases, one note that when choosing GBM over AU, empty miles could be reduced by 40% on average.
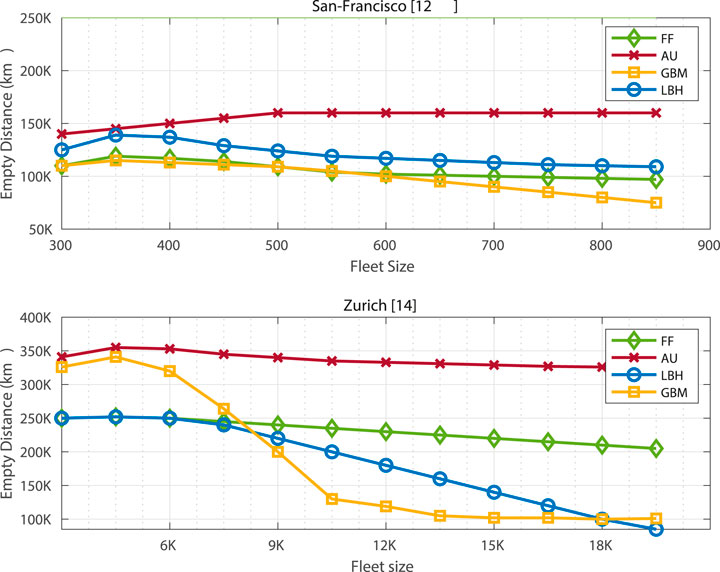
FIGURE 5. Empty miles produced by different dispatching policies. The descriptions of policies are detailed in Section 2.6.
4 Modeling and evaluating intelligent transportation systems
In this section, we present the process of creating a realistic case study for evaluating the performance of Intelligent Transportation Systems (ITS) in the context of our study on AMoD systems. While the focus of our evaluation is on AMoDs, we illustrate the initial steps of creating a travel demand model for an ITS case study, as depicted in Figure 6. This serves as a foundation for understanding the subsequent evaluation of AMoDs.
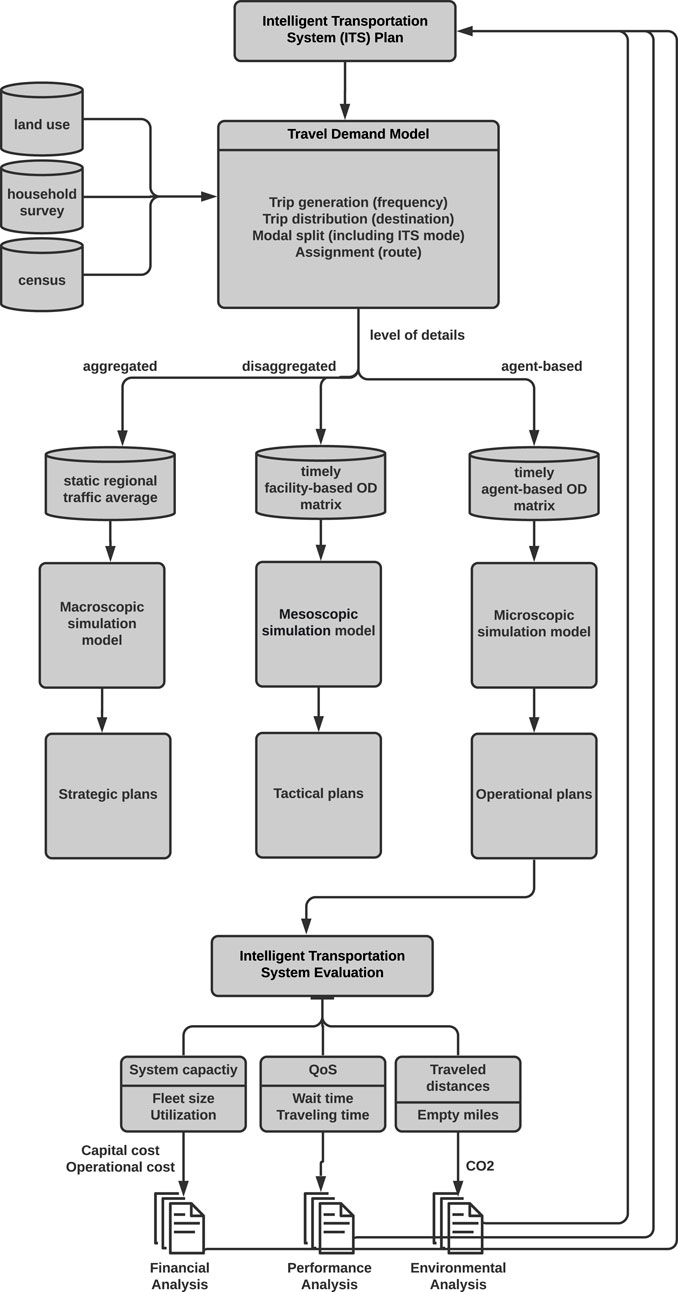
FIGURE 6. Standard procedure for designing Intelligent Transportation System (ITS).
To begin, the development of travel demand models involves dividing the area into traffic analysis zones, taking into account land use patterns, traffic flow on freeways, highways, railroads, and rural highways. These steps align with the four traditional approaches to modeling travel demand, as outlined by McNally (2007).
• Trip generation represents the frequency of trips in each traffic analysis zone, by trip purpose, based on household demographic, and socioeconomic factors. Additionally, car ownership census and land-use data (retail and commercial floor space by zone) could improve the accuracy of the data. Additional data about vehicle operating costs, occupants, and time savings provide a financial dimension to the generated trips.
• In the Trip Distribution step, origins and destinations of trips are matched to develop an Ori-gin/Destination matrix (OD matrix) which displays the number of trips going to each destination from each origin. Data could come from household travel surveys, statistics of trip lengths, car ownership censuses, or household expenditure surveys averaged across zones, or be estimated from other socioeconomic data sources.
• The Mode Choice step computes the percentage of trips that use a particular mode of transportation between each origin and destination. These calculations can be derived from household surveys, car-ownership statistics, local household travel surveys, car availability surveys, license-holding censuses, and vehicle operating costs and occupancy statistics.
• The Trip Assignment process involves determining the shortest path between an origin and destination by calculating the minimum time from one origin to every destination. The results of the Travel Demand Model can be aggregated into static averaged traffic conditions, segregated into time-based regional OD matrix or detailed agent-based OD matrix, depending on the simulation level and input data.
Given general traffic conditions, macrosimulation models translate regional land use in a transportation network, such as freeways, corridors, and surface streets, into travel patterns represented by path flows and link flows during modeled peak periods. This model helped to develop better transport policies and planning from a strategic standpoint (Okraszewska et al., 2018). Mesoscopic models use time-based regional OD matrices to describe traffic entities at a high level, while their behaviors and interactions are described at a detailed level. With the model’s tactical view, decision-makers can use data to evaluate the effectiveness of planning and traffic management strategies, propose traffic layouts and traffic control strategies, and make policy decisions. The microscopic model examines interactions between two vehicles and how they move by using agent-based OD matrices. The operational level of the model provides data for new transportation system implementations, new street network proposals, traffic layouts, traffic control programs, traffic control logic to give priority to pedestrians and cyclists, and visualization of proposed improvements. As opposed to simulations, analytical approaches for traffic modeling can include fluid dynamics, queuing, and network models.
Three main characteristics of intelligent transportation system (ITS) models must be analyzed. 1) The level of service offered to customers, which is determined mainly by the statistical distribution of waiting times. A larger ITS fleets will usually have more vehicles closer to the areas of upcoming requests. This results in better service from a service level perspective, but results obviously in higher capital expenditures. Accordingly, 2) the fleet size that affects the utilization of the system also needs to be factored into the analysis of performance. Finally, 3) the vehicles that travel for some distance without passengers also contribute to operational costs. Rebalancing strategies are employed in order to increase service level by addressing empty distance as well including the entailed CO2 emissions. These characteristics facilitate the estimation of ITS services, financial impacts, and environmental impacts, for instance, parking usage and CO2 emissions can be derived from given driving distances, and costs can be calculated from fleet size and utilization. ITS impacts from operational levels should be fed back into a city’s overall ITS plan for greater impacts on tactical and strategic planning.
Since many inputs and simulations are involved in the earlier ITS modeling steps, we conclude a general and unifying scale to help in decision-making concerning the development and ITS (Figure 7A). The Intelligent Transportation System Readiness Level (ITS-RL) offers a common scheme for ITS status, helps with risk assessment, and can be used to make decisions to plan traffic on urban roads at operational, tactical, and strategic levels.
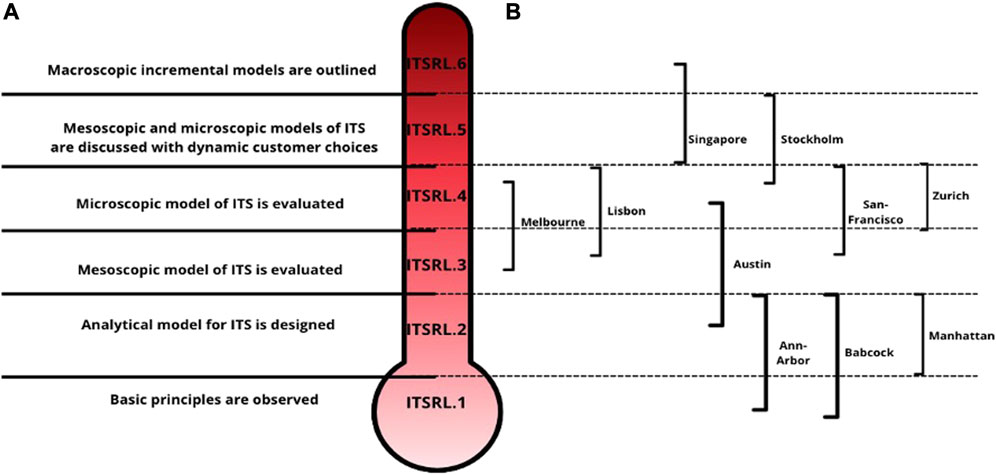
FIGURE 7. Intelligent Transportation System Readiness Level (ITS-RL) scale (A), evaluation of case studies on the scale (B).
When an ITS model observes and reports basic principles around the new ITS according to general statistics and censuses, the model reaches level 1 of the ITS-RL. Simulation of road traffic for the new ITS using analytical models, such as fluid dynamics, queuing, and network models, is required for level 2. Although mesoscopic modeling gives a general evaluation of congestion caused by traffic entities with the implementation of ITS, starting from mesoscopic modeling does not reflect a realistic model, and therefore meets the conditions of level 3. Hence, starting to simulate a new ITS as a microscopic model could reach level 4 since they can represent moving vehicles, roads, and intersections in great detail. Furthermore, modeling ITS at mesoscopic scale after having a microscopic model when considering customer choices modeling (dynamic demand), will enable both an operational and tactical evaluation of the introduced ITS. This will improve transportation planners’ understanding by allowing them to analyze and quantify the impacts of upstream traffic congestion, while also increasing the realism of the model to level 5. At level 6, a macro-scoped model of ITS discusses additional impacts of ITS at a strategic level after evaluating the system on a macro- and micro-scale. This incremental model will enable cities’ planners to evaluate the need for new infrastructures to engage the new ITS. The highest levels of this scale involve the deployment of ITS technology in the real world. If the ITS prototype is launched in an operational environment, the model reaches level 7. The ITS then goes to level 8 if it has proved to be qualified. Level 9 is achieved after a long period of time when a system is tested in an operational environment. The case studies that have been reviewed are rated according to their realism by the ITS-RL (Figure 7B). Singapore is the only case where a micro-, meso- and macro-level simulation is used, Stockholm uses combined meso- and microscopic models, but they do not evaluate the quality of service delivered by the system, therefore reducing its realism. Although the case studies for Melbourne, Lisbon, San Francisco, and Zurich analyzed the AMoD system from a microscopic point of view, only for San Francisco and Zurich the essential performance metrics was discussed in depth. As taxi data were used in the San-Francisco case to represent the demands, the model lost some of its realism. The microscopic analysis in the Austin case is the least realistic model among microscopical ones as the demand is derived from Poisson distributions based on trip-distance and trip-start distributions. Ann-Arbor, Babcock Ranch, and Manhattan were modeled using queuing and networking. Moreover, the Ann-Arbor and Babcock Ranch cases have the least realistic models, because they estimate demand from population statistics, area statistics, and the average number of trips.
Finally, it should be mentioned that some case studies discussed additional characteristics that were not considered essential in the ranking. The cases of Melbourne, Lisbon, and Stockholm discussed parking space reduction. For Stockholm and Austin cases, the CO2 emissions were discussed. For Zurich, Ann-Arbor, Babcock, and Manhattan, the cost of service was analyzed.
5 Conclusion
In this paper, we offer a unifying model to support the comparison of AMoD transportation systems with Conventionally Driven Vehicles (CDV) system based on real case studies. A description of ten case studies is provided, followed by an in-depth analysis of the common results and the possibility of their generalization. By quantifying the results of AMoD system with respect to traditional mobility modes, we determined the parameters for reducing the number of vehicles, eliminating parking spaces, and introducing empty miles. An analysis of the results indicates that a substantial cut between 85% and 93% in number of vehicles is possible while still answering the real demand. This would reduce the number of parking spaces needed by 83%–97%, with the side effect of increasing the number of empty miles by 6%–15%. We consider also dispatching policies and find that they have the potential to reduce additional empty miles by as much as 40%. Reasons that are most commonly cited for these results are.
• When the optimal number of AVs is set, they primarily serve one demand before going to the next. In other words, vehicles are utilized more efficiently.
• The AV generates more empty miles when it moves from one customer to another when compared to traditional transportation vehicles. When a rebalancing policy is applied for efficient quality of service, extra empty miles would be the outcome.
• Thus, reducing empty miles is achieved by choosing the dispatching and rebalancing techniques. Accordingly, now we propose a standard procedure to conduct intelligent transportation systems studies which can assist with the planning of traffic on urban roads from an operational, tactical, and strategic point of view.
Based on the observation in the case studies, we have developed a framework similar to the well-known technological readiness level scale. This Intelligent Transportation System Readiness Level (ITS-RL) scale assesses the realism of case studies and can assist with risk assessment, and provide guidance on how AMoD systems can be implemented in local environments. Because of the level of simulation approach and accuracy of data, we find that the majority of case studies realism degree tend to lie between levels 3 and 4. The current scale is limited by ITS-RL 6, as higher readiness levels can be considered only for systems that include real traffic and in more or less realistic environments (Miller et al., 2016). Extending ITS-RL scale in order to cover the realism of a variety of practical AMoD projects and investigating the case studies results in light of particular city shape and statistics related to its roads will be considered in future work. This should not divert from the fact that also at lower ITS-RLs more work is needed as shown for the individual case studies in particular, but also more generally for aspects such as a better understanding of the interaction of different modes of transportation, the effect of flexible pricing schemes, and the net effect of AMoD systems for a greener cityscape.
Author contributions
EA and JH contributed to conception and design of the study. EA conducted data collection and performed data analysis and interpretation. JH provided critical revisions and intellectual input, supervised the study and provided overall guidance. TA participated in the ITS standard procedure, reviewed and proofread the manuscript, revised the overlapped concepts. All authors contributed to the article and approved the submitted version.
Acknowledgments
This work was supported in part by the Engineering and Physical Sciences Research Council (EPSRC) through the EPSRC Centre for Doctoral Training in Robotics and Autonomous Systems (CDT-RAS) [grant number EP/S023208/1].
Conflict of interest
The authors declare that the research was conducted in the absence of any commercial or financial relationships that could be construed as a potential conflict of interest.
Publisher’s note
All claims expressed in this article are solely those of the authors and do not necessarily represent those of their affiliated organizations, or those of the publisher, the editors and the reviewers. Any product that may be evaluated in this article, or claim that may be made by its manufacturer, is not guaranteed or endorsed by the publisher.
Footnotes
1The algorithms are described in Section.2.6.
References
Azevedo, C., Anna Marczuk, K., Raveau, S., Soh, H., Adnan, M., Basak, K., et al. (2016). Microsimulation of demand and supply of autonomous mobility on demand. Transp. Res. Rec. 2564 (1), 21–30. doi:10.3141/2564-03
Barter, P. (2013). Cars are parked 95% of the time’. Let’s check. [online] Available at: https://www.reinventingparking.org/2013/02/cars-are-parked-95-of-time-lets-check.html#:∼:text=He%20cites%20the%201995%20Nationwide (Accessed July 11, 2023).
Bischoff, J., and Maciejewski, M. (2016). Simulation of city-wide replacement of private cars with autonomous taxis in berlin. Procedia Comput. Sci. 83, 237–244. doi:10.1016/j.procs.2016.04.121
David Plummer & Associates, Inc. (2011). Babcock Ranch Community Development of Regional Impact Question 21. Transportation Master Traffic Study Update
Dia, H., and Javanshour, F. (2017). Autonomous shared mobility-on-demand: melbourne pilot simulation study. Transp. Res. Procedia 22, 285–296. doi:10.1016/j.trpro.2017.03.035
Distler, V., Lallemand, C., and Bellet, T. (2018). “Acceptability and acceptance of autonomous mobility on demand: the impact of an immersive experience,” in Proceedings of the 2018 CHI conference on human factors in computing systems, 1–10.
du Can, S. d. I. R., and Price, L. (2008). Sectoral trends in global energy use and greenhouse gas emissions. Energy policy 36, 1386–1403. doi:10.1016/j.enpol.2007.12.017
Fagnant, D. J., Kockelman, K. M., and Bansal, P. (2015). Operations of shared autonomous vehicle fleet for austin, Texas, market. Transp. Res. Rec. 2563, 98–106. doi:10.3141/2536-12
Federal Statistical Office, F. O. f. S. D. (2012). Mobility in Switzerland: Results from the microcensus mobility and transport 2010.
Gkartzonikas, C., and Gkritza, K. (2019). What have we learned? A review of stated preference and choice studies on autonomous vehicles. Transp. Res. Part C Emerg. Technol. 98, 323–337. doi:10.1016/j.trc.2018.12.003
Goniewicz, K., Goniewicz, M., Pawłowski, W., and Fiedor, P. (2016). Road accident rates: strategies and programmes for improving road traffic safety. Eur. J. trauma Emerg. Surg. 42, 433–438. doi:10.1007/s00068-015-0544-6
Hörl, S., Ruch, C., Becker, F., Frazzoli, E., and Axhausen, K. W. (2019). Fleet operational policies for automated mobility: A simulation assessment for zurich. Transp. Res. Part C Emerg. Technol. 102, 20–31. doi:10.1016/j.trc.2019.02.020
Iglesias, R., Rossi, F., Zhang, R., and Pavone, M. (2017). A BCMP network approach to modeling and controlling autonomous mobility-on-demand systems. [online] arXiv.org. doi:10.48550/arXiv.1607.04357
International Transport Forum (2017). ITF transport outlook 2017. URL: Available at: https://www.oecd-ilibrary.org/content/publication/9789282108000-en.
Jing, P., Huang, H., Ran, B., Zhan, F., and Shi, Y. (2019). Exploring the factors affecting mode choice intention of autonomous vehicle based on an extended theory of planned behavior—a case study in China. Sustainability 11 (4), 1155. doi:10.3390/su11041155
Jonsson, D., Berglund, S., Almström, P., and Algers, S. (2011). The usefulness of transport models in Swedish planning practice. Transp. Rev. 31, 251–265. doi:10.1080/01441647.2010.537100
Jordan, W. C. (2012). Transforming personal mobility: Technical report. The Earth Institute, Columbia University.
König, A., and Grippenkoven, J. (2020). Travellers’ willingness to share rides in autonomous mobility on demand systems depending on travel distance and detour. Travel Behav. Soc. 21, 188–202. doi:10.1016/j.tbs.2020.06.010
Kotz, D., and Henderson, T. (2005). Crawdad: A community resource for archiving wireless data at dartmouth. IEEE Pervasive Comput. 4, 12–14. doi:10.1109/mprv.2005.75
Lagos, R. (2003). An analysis of the market for taxicab rides in new york city. Int. Econ. Rev. 44, 423–434. doi:10.1111/1468-2354.t01-2-00075
Lavieri, P. S., Garikapati, V. M., Bhat, C. R., Pendyala, R. M., Astroza, S., and Dias, F. F. (2017). Modeling individual preferences for ownership and sharing of autonomous vehicle technologies. Transp. Res. Rec. 2665, 1–10. doi:10.3141/2665-01
Martinez, L., and Crist, P. (2015). Urban mobility system upgrade–how shared self-driving cars could change city traffic. paris: International transport forum.
Miller, J., Hasfura, A., and Liu, S.-Y. (2016). Autonomy for mobility on demand. aerospace controls laboratory. URL: Available at: http://acl.mit.edu/projects/autonomy-for-mobility-on-demand.
Mo, B., Wang, Q. Y., Moody, J., Shen, Y., and Zhao, J. (2021). Impacts of subjective evaluations and inertia from existing travel modes on adoption of autonomous mobility-on-demand. Transp. Res. Part C Emerg. Technol. 130, 103281. doi:10.1016/j.trc.2021.103281
Narayanan, S., Chaniotakis, E., and Antoniou, C. (2020). Shared autonomous vehicle services: A comprehensive review. Transp. Res. Part C Emerg. Technol. 111, 255–293. doi:10.1016/j.trc.2019.12.008
Okraszewska, R., Romanowska, A., Wołek, M., Oskarbski, J., Birr, K., and Jamroz, K. (2018). Integration of a multilevel transport system model into sustainable urban mobility planning. Sustainability 10, 479. doi:10.3390/su10020479
Othman, K. (2022). Exploring the implications of autonomous vehicles: A comprehensive review. Innov. Infrastruct. Solutions 7 (2), 165. doi:10.1007/s41062-022-00763-6
Pavone, M., Smith, S. L., Frazzoli, E., and Rus, D. (2012). Robotic load balancing for mobility-on-demand systems. Int. J. Robotics Res. 31, 839–854. doi:10.1177/0278364912444766
Pendleton, S., Uthaicharoenpong, T., Chong, Z. J., Fu, G. M. J., Qin, B., Liu, W., et al. (2015). “Autonomous golf cars for public trial of mobility-on-demand service,” in 2015 IEEE/RSJ international conference on intelligent robots and systems (IROS) (IEEE, 1164–1171.
Penumaka, A. P., Savino, G., Baldanzini, N., and Pierini, M. (2014). In-depth investigations of ptw-car accidents caused by human errors. Saf. Sci. 68, 212–221. doi:10.1016/j.ssci.2014.04.004
policy.friendsoftheearth.uk. (2019). Planning for less car use | Policy and insight. [online] Available at: https://policy.friendsoftheearth.uk/insight/planning-less-car-use.
Rigole, P. J. (2014). Study of a shared autonomous vehicles based mobility solution in stockholm. Dissertation.
Rodrigues, J. (2018). “Autonomous cars, from “ownership” to “usage”: how autonomous vehicles might corrupt automotive industry’s business model,” in Gerpisa colloquium, são paulo-brasil. GERPISA-the international network of automobile. École normal supérieure paris-saclay.
Ruch, C., Hörl, S., and Frazzoli, E. (2018). “Amodeus, a simulation-based testbed for autonomous mobility-on-demand systems,” in 2018 21st international conference on intelligent transportation systems (ITSC) (IEEE), 3639–3644.
Santos, A., McGuckin, N., Nakamoto, H. Y., Gray, D., Liss, S., et al. (2011). Summary of travel trends: 2009 national household travel survey. Technical report. United States: Federal Highway Administration.
Soteropoulos, A., Berger, M., and Ciari, F. (2019). Impacts of automated vehicles on travel behaviour and land use: an international review of modelling studies. Transp. Rev. 39, 29–49. doi:10.1080/01441647.2018.1523253
Tiseo, I. (2023). Power sector carbon intensity outlook 2050. Available at: https://www.statista.com/statistics/1189677/carbon-intensity-outlook-of-great-britain/#:∼:text=The_carbon_intensity_of_Great,kilowatt-hour_of_electricity_generated (Accessed April 24, 2023).
Transport, D. (2009). Victorian integrated survey of travel and activity of Transportation, U.D., 2009. National household travel survey: Data for detroit-ann arbor-flint area.
Twumasi-Boakye, R., Cai, X., Fishelson, J., and Broaddus, A. (2021). Simulation of potential use cases for shared mobility services in the city of Ann arbor. Transportation Research Record: Journal of the Transportation Research Board, 036119812110045. doi:10.1177/03611981211004588
Wen, J., Nassir, N., and Zhao, J. (2019). Value of demand information in autonomous mobility-on-demand systems. Transp. Res. Part A Policy Pract. 121, 346–359. doi:10.1016/j.tra.2019.01.018
Zardini, G., Lanzetti, N., Pavone, M., and Frazzoli, E. (2022). Analysis and control of autonomous mobility-on-demand systems. Annu. Rev. Control, Robotics, Aut. Syst. 5 (1), 633–658. doi:10.1146/annurev-control-042920-012811
Zardini, G., Lanzetti, N., Pavone, M., and Frazzoli, E. (2021). Analysis and control of autonomous mobility-on-demand systems: A review. arXiv preprint arXiv:2106.14827.
Keywords: autonomous vehicles, autonomous shared mobility-on-demand, smart cities, smart mobility, urban traffic, simulation TRL, ITS-RL
Citation: Alotaibi ET, Alhuzaymi TM and Herrmann JM (2023) Autonomous mobility on demand: from case studies to standardized evaluation. Front. Future Transp. 4:1224322. doi: 10.3389/ffutr.2023.1224322
Received: 17 May 2023; Accepted: 11 August 2023;
Published: 02 October 2023.
Edited by:
Ovidiu Vermesan, SINTEF Digital, NorwayReviewed by:
Valerio Frascolla, Intel, GermanyTai-Yu Ma, Luxembourg Institute of Socio-Economic Research, Luxembourg
Yueshuai Brian He, University of California, Los Angeles, United States
Copyright © 2023 Alotaibi, Alhuzaymi and Herrmann. This is an open-access article distributed under the terms of the Creative Commons Attribution License (CC BY). The use, distribution or reproduction in other forums is permitted, provided the original author(s) and the copyright owner(s) are credited and that the original publication in this journal is cited, in accordance with accepted academic practice. No use, distribution or reproduction is permitted which does not comply with these terms.
*Correspondence: Ebtehal T. Alotaibi, ZS50Lm90YWliaUBnbWFpbC5jb20=