 Michael R. Lowe
 Aaron K. Jubar
 Jessica M. Barber3
 Christopher M. Holbrook
- 1United States Geological Survey, Great Lakes Science Center, Hammond Bay Biological Station, Millersburg, MI, United States
- 2United States Fish and Wildlife Service, Ludington Biological Station, Ludington, MI, United States
- 3United States Fish and Wildlife Service, Marquette Biological Station, Marquette, MI, United States
- 4United States Geological Survey, Great Lakes Science Center, Ann Arbor, MI, United States
Introduction: Despite the success of the Sea Lamprey Control Program (SLCP) in reducing Sea Lamprey (Petromyzon marinus) abundance throughout the Laurentian Great Lakes, control remains a significant challenge in the Saint Clair-Detroit River System (SCDRS) due to the system's size, flow dynamics, and amount of potentially suitable spawning habitat.
Methods: We used acoustic telemetry to identify repeated patterns in habitat use, presumed spawning areas, and migratory routes for 271 acoustic-tagged Sea Lamprey in the SCDRS during the 2016 and 2017 spawning seasons.
Results: Sixty-nine percent of tagged Sea Lamprey appeared to spawn in the Saint Clair River with many individuals displaying commonly shared movement histories in terms of timing and channel use. Probable spawning locations were associated with the main river channel upstream of major bifurcations (e.g., Stag and Fawn Islands) in the Saint Clair River and overlapped with areas of high bottom flow.
Discussion: Selection for low flow refugia during migration appears water temperature dependent. Traditional control methods are likely to be inefficient in the SCDRS, highlighting the need for novel supplemental strategies tailored to large river systems.
Introduction
Invasive species can have profound impacts on the environment that vary in scope (positive to negative), scale (population to ecosystem), and severity (minor to extreme) once the invader becomes established (Pyšek et al., 2020). The long-standing threat, particularly in aquatic environments, has generated a wealth of information demonstrating the generally strong negative pressures invasive species exert on ecosystem structure and function (Cucherousset and Olden, 2011) and the economies that depend on these resources (Cuthbert et al., 2021; Fantle-Lepczyk et al., 2022). It is estimated that in 2020 alone Invasive Aquatic Species (IAS) cost the global economy $23 billion (USD) (Cuthbert et al., 2021), so there has been a tremendous global effort to not only limit the spread of invasive species (Pyšek et al., 2020) but also mitigate the ecological impacts of established populations (Fetterolf, 1980; Green and Grosholz, 2021; Jones et al., 2021).
The establishment of invasive Sea Lamprey (Petromyzon marinus) in the Laurentian Great Lakes directly or indirectly contributed to the collapse of many native fish stocks and severely damaged fishery-related economies in both the United States and Canada (Coble et al., 1990). This prompted the formation of the binational Great Lakes Fishery Commission and the Sea Lamprey Control Program (SLCP) and the implementation of an integrated pest management strategy to reduce Sea Lamprey populations and aid native fish restoration in the Great Lakes. This integrated strategy uses a suite of suppression methods, including barriers to prevent upstream migration in spawning tributaries (Zielinski et al., 2019), trapping (Miehls et al., 2021), selective pesticides (i.e., lampricides; Symbal et al., 2021), and other supplemental methods (Siefkes et al., 2021). The program successfully reduced Sea Lamprey abundance by 90% relative to peak levels observed in the 1960s (Robinson et al., 2021), which has allowed for large-scale native fish restoration and the rebuilding of regional fisheries.
Despite the program's success, Sea Lamprey control in the Saint Clair-Detroit River System (SCDRS) remains a major challenge. The SCDRS, also known as the Huron-Erie Corridor, is a ~135 km long oligotrophic waterway that connects Lakes Huron and Erie (Figure 1). The system comprises the Saint Clair River, Lake Saint Clair, and Detroit River and has ample habitat for Sea Lamprey to complete their life-cycle (Bennion and Manny, 2014). Indeed, larval Sea Lamprey have been detected in the Saint Clair River since 1975 (Grunder et al., 2021), and spawning has been documented in tributaries to the Saint Clair (Shetter, 1949). Commonly used control methods, such as barriers, trapping, and lampricides (i.e., granular Bayluscide) are either non-existent, ineffectual, or economically unfeasible in the SCDRS (Grunder et al., 2021) due to the size and high flow of the system (mean discharge ~ 5,200 m3 s−1) that far exceeds that of any other tributary in the Great Lakes basin. As a result, the larval Sea Lamprey population in the SCDRS has been estimated at ~920,000 individuals and is widely recognized as the largest uncontrolled Sea Lamprey population in the Lake Erie basin (Grunder et al., 2021). The adult Sea Lamprey index in Lake Erie has exceeded target levels annually since 1995, by as much as an order of magnitude (2017) and only recently fell below target levels (Barber and Van Kempen, 2024).
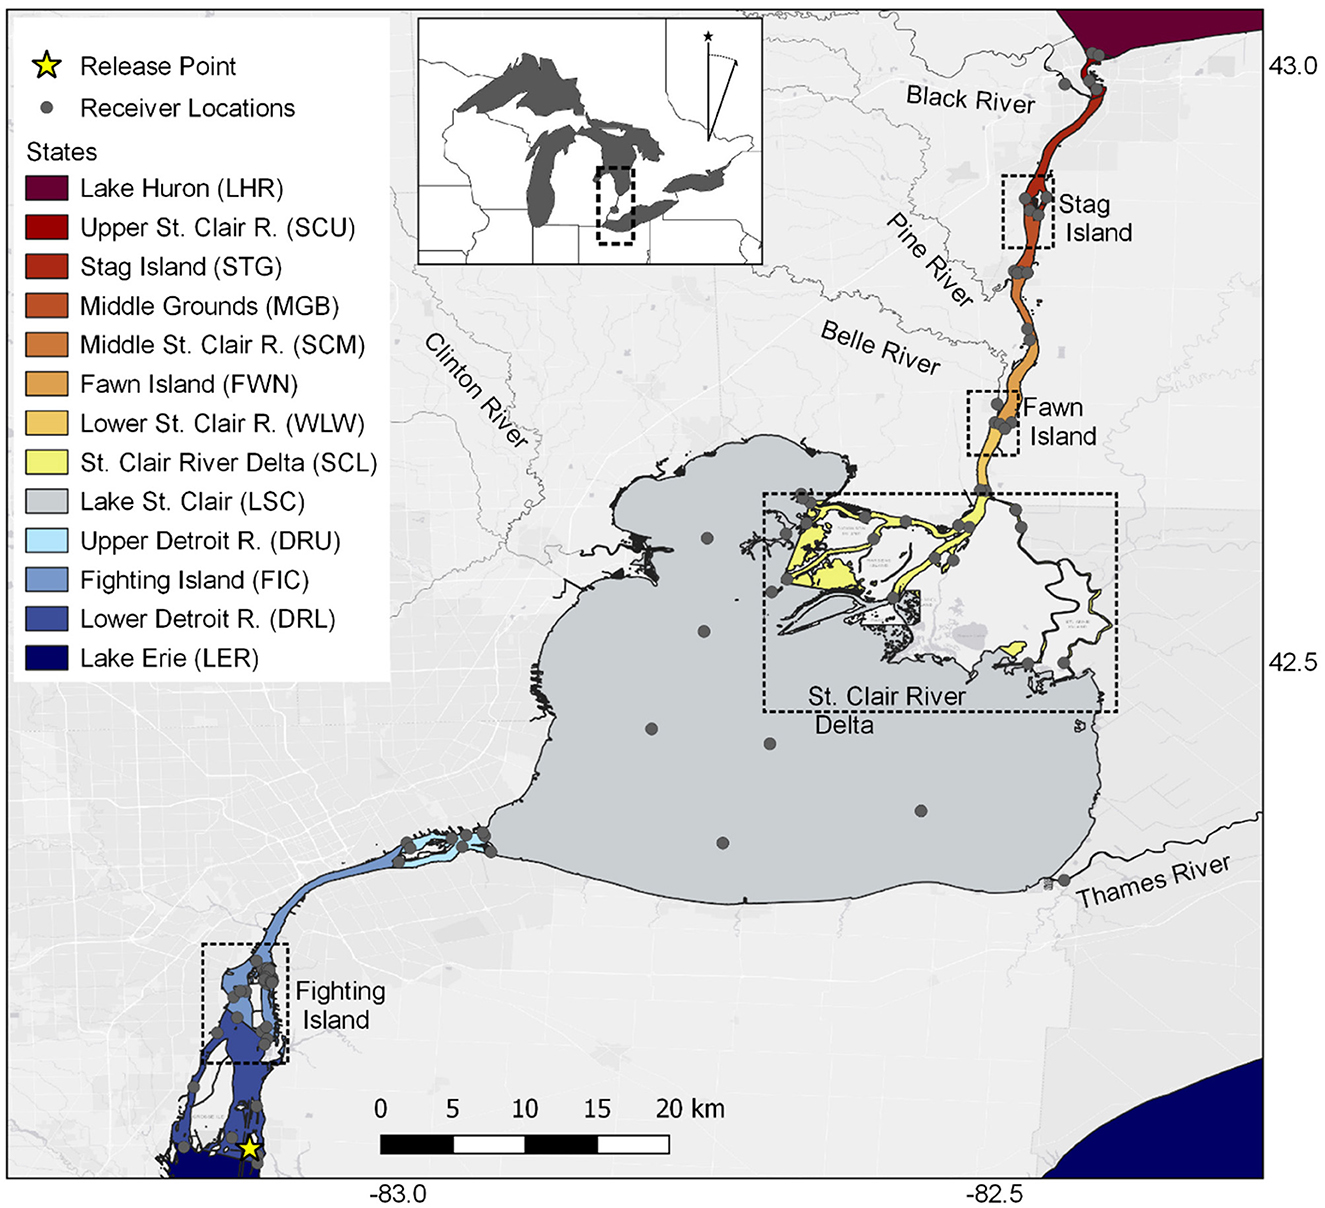
Figure 1. Map of the Saint Clair and Detroit Rivers System (SCDRS) with locations of acoustic receivers (gray circles) and release locations of acoustic-tagged adult Sea Lamprey (Petromyzon marinus; yellow star) during 2016 and 2017. Color-coded sections of the two rivers and Lake Saint Clair correspond to arrays used to represent the spatiotemporal location of individual fish in the sequence analysis. Inset map shows the location of the study system within the Great Lakes region. Dashed boxes highlight areas where acoustic-tagged Sea Lamprey encountered two or more channels during their upstream migration.
A previous acoustic-telemetry project in the SCDRS demonstrated that the majority (22 of 27) adult Sea Lamprey ceased their upstream migration (i.e., furthest upstream detection) in the Saint Clair River (Holbrook et al., 2016; Lowe et al., 2020). The furthest upstream detection (i.e., where the individual ceased upstream migration), opposed to the final detection that was likely influenced by a fallback behavior, was used to infer the most likely spawning areas in the SCDRS. While this reduces the potential treatment area in the SDRS by approximately 67%, the Saint Clair River is roughly an order of magnitude larger than any river (other than the Saint Marys River) where Sea Lamprey assessment or control have been considered cost effective—and in the Saint Marys River, assessment and control are heavily dependent on an extensive lock and dam complex.
A great deal of research has consistently identified both water temperature and bulk flow characteristics (e.g., current velocity and discharge) as important drivers of Sea Lamprey spawning activity in the Great Lakes tributaries. While water temperature is relatively stable in the SCDRS and tracks seasonal patterns throughout the region, bottom flow velocity is spatially complex but falls within the preferred range (0.5–1.5 m s-1: Manion and Hanson, 1980) throughout much the SCDRS. Notable areas that are outside of that range include the head of the Saint Clair River (Czuba et al., 2011), Saint Clair Delta (Anderson et al., 2010), Lake Saint Clair, and the lower Detroit River (Bennion and Manny, 2014). Extended upstream migration into the high velocity and discharge conditions of the SCDRS is likely to be energetically costly (Quintella et al., 2004) and might impede upstream migration by Sea Lamprey (Almeida et al., 2002; Johnson et al., 2012). Sea Lamprey are thought to use low flow refugia (e.g., embankments, shoals, brush piles, side channels) to conserve energy during the spawning migration and may show even stronger selection for slower moving side channels at large river bifurcations in the SCDRS (Czuba et al., 2011; Liu et al., 2012). Further, the extreme energetic requirements of long-distance upstream migration from Lake Erie may result in the random distribution of spawning sites throughout the SCDRS rather than a predictable pattern based on the best available science from comparatively smaller river systems (Griffin et al., 2025; Holbrook et al., 2015; Kerr et al., 2023).
This work builds on the (Holbrook et al. 2016) acoustic telemetry study by incorporating more acoustic-tagged Sea Lamprey and a larger network of acoustic receivers to provide better spatial coverage of the SCDRS, particularly the Saint Clair River. The primary objective of this study was to identify repeated patterns in habitat use among tagged Sea Lamprey and determine if the proportion of furthest upstream detections differed among regions of the SCDRS (e.g., Detroit River, Saint Clair River, Lake Saint Clair, and five tributaries), particularly within the Saint Clair River. Secondarily, we assessed the spatial relationship between furthest upstream detections and (1) the distribution of Sea Lamprey larvae and (2) modeled bottom water velocity and discharge throughout the SCDRS during the presumed spawning window. Lastly, we determine if route selection during the spawning migration was related to bulk flow characteristics (e.g., bottom flow velocity or channel-specific discharge) or other environmental predictors at major river bifurcations. An improved understanding of Sea Lamprey behavioral responses to hydrodynamics in the SCDRS or how they use side channels could direct assessment and control efforts toward areas disproportionately used during spawning.
Methods
Fish collection and acoustic telemetry design
Adult Sea Lamprey (Table 1) were surgically implanted with acoustic transmitters (245 model V8-4H tags and 26 V9A-2H accelerometer tags; Innovasea; Halifax, Nova Scotia, Canada) and released in staggered groups in the spring of 2016 and 2017 (Table 1). Based on the configuration, acoustic transmitters had a 117 d battery life and were transmitting through the end of August in each year. All tagged Sea Lamprey were collected from adult Sea Lamprey traps operated at barriers in the Cheboygan, Ocqueoc (tributaries to Lake Huron), and Manistique (tributary to Lake Michigan) rivers in northern Michigan, USA. Surgical procedures were performed under controlled anesthesia (100 mg·L−1Aqui-S 20E; AQUI-S New Zealand Ltd.) on 6 May 2016 and 22 May 2017 and all fish were monitored in holding tanks until release in the Amherstburg Channel of the Detroit River (Figure 1). Release groups were comprised of a nearly equal sex ratio (Table 1) and the relative difference in release timing between years was due to interannual differences in water temperature that determined when the spawning migration began in each respective collection river.
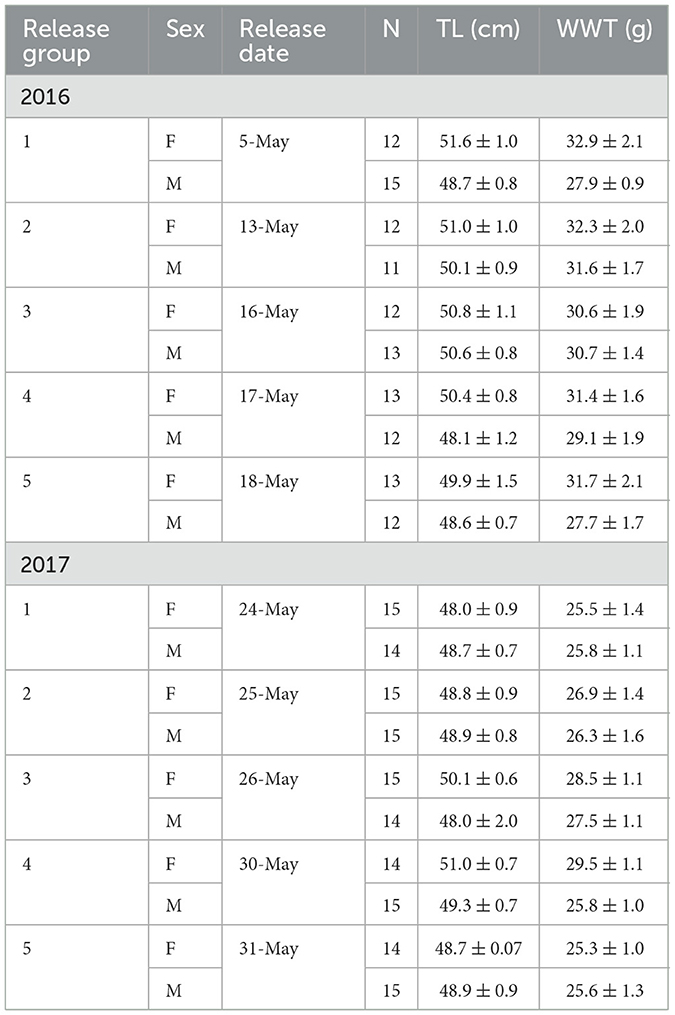
Table 1. Summary of biological information, including sex (M = male; F = female), total length (TL; ± 1 SE), and body mass (WWT; ± 1 SE), for acoustic-tagged Sea Lamprey (Petromyzon marinus) released in staggered groups in the Saint Clair-Detroit River System in 2016 and 2017.
Each transmitter emitted a burst of acoustic pulses corresponding to a unique identification code every 60–180 s (120 s nominal delay) and time-stamped detections were recorded as individual fish moved through a network of 97 acoustic receivers (model VR2W; Innovasea, Halifax, Nova Scotia, Canada) that comprised 18 smaller arrays within the SCDRS (Figure 1). Additional detections from receivers located outside of the SCDRS were accessed via the Great Lakes Acoustic Telemetry Observation System (Krueger et al., 2018). Each receiver location was assigned to one of the following discrete arrays (“states” in sequence analysis nomenclature) in the SCDRS from downstream to upstream (Figure 1; Supplementary Table S1); Lake Erie (LER), lower Detroit River (DRL), Fighting Island (FIC), upper Detroit River (DRU), Lake Saint Clair (LSC), Saint Clair River Delta (SCL; hereafter, “Delta”), lower Saint Clair River (WLW), Fawn Island (FWN), middle Saint Clair River (SCM), Middle Grounds (MGR), Stag Island (STG), upper Saint Clair River (SCU), and Lake Huron (LHR). The spatial extent of each array was arbitrarily defined as beginning at the receiver locations on the downstream end and ending at the next group of upstream receivers. Additional receivers were also placed in five tributaries within the SCDRS (e.g., Belle, Black, Clinton, Pine, and Thames Rivers; Figure 1) and were assigned to the array that contained the tributary mouth.
Pre-processing of acoustic telemetry data
Potentially false detections resulting from signal code collisions were removed (< 1% of all detection data; Beeman and Perry, 2012; Simpfendorfer et al., 2015) by filtering out all detections that were not within 3,600 s (i.e., 30 times the nominal delay) of another detection of the same tag code on the same receiver (Pincock, 2012). Filtered detection data were further distilled into 62,228 detection events that contained only the uninterrupted time intervals in which each fish was detected in a single array. Interruptions occurred when an individual was not detected in any array and, thus, events were separated by periods of transition between detections when the position of the fish was unknown.
Filtered detection events were converted to a chronologically ordered series of array detections at 1-h intervals for each individual fish (hereafter, “movement histories”). Movement histories were initialized at the release date and time for each release group (Table 1) and were terminated 1 week after water temperatures in the SCDRS exceeded 18.0°C (Figure 2); the temperature at which adult Sea Lamprey cease spawning (Morman et al., 1980). This threshold was exceeded in mid- to late-June (Figure 2) during both years and, as a result, the study was terminated on 3 July in 2016 and on 15 July in 2017 to allow time for observing “fallback” behaviors in late spawning individuals. Sea Lamprey were allowed to occupy only a single array during each 1-h interval. Maximum residency time was used to identify that array in cases where individuals were detected on multiple arrays during a given 1-h time bin. During periods when fish were not detected (i.e., in portions of the SCDRS between arrays not covered by receivers), the last observed array was carried forward (LOCF) until the next detection and transitions into a new array were never imputed. Given that observed detection efficiencies ranged from 82%−100% (median: 0.97; Appendix Table 1), the LOCF method was a robust approach for inferring arrays when the fish were not detected. This resulted in a matrix of uninterrupted movement histories for each individual fish (i.e., one row for each fish and one column for each time interval) that is well suited for sequence analysis (De Groeve et al., 2016).
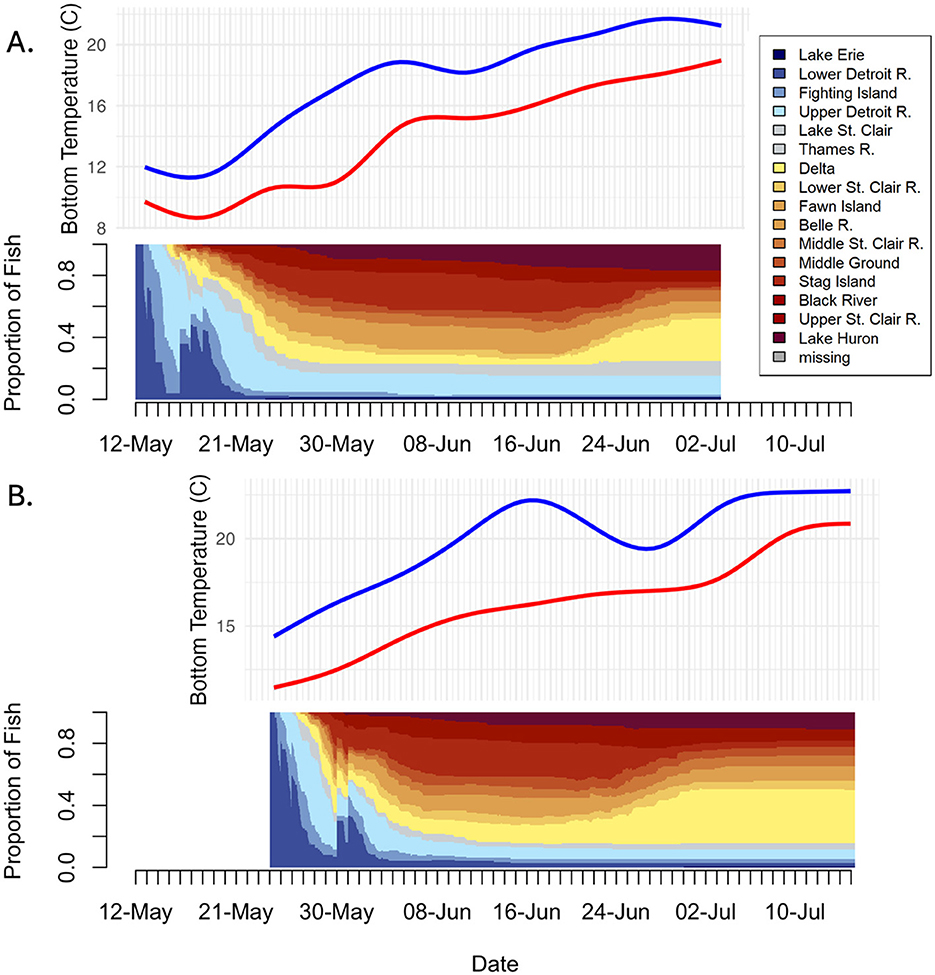
Figure 2. Bottom temperature profiles (from HECWFS model) and relative frequency of acoustic-tagged adult Sea Lamprey (Petromyzon marinus) in each region (state) of the Saint Clair and Detroit Rivers System during (A) 2016 and (B) 2017. Blue and red lines in temperature plots correspond to the Detroit and Saint Clair rivers, respectively.
Movement history commonalities
The sequence analysis framework described by (Lowe et al. 2020) was used to identify commonly shared patterns in Sea Lamprey movement histories and potentially important spawning areas. Sequence analysis is a two-step process that involves (1) construction of a dissimilarity matrix for every pairwise comparison of movement histories and (2) statistical clustering to identify groupings of movement histories with similar patterns. Sequence dissimilarities were calculated using the optimal matching algorithm which works iteratively through every possible pair of movement histories to calculate the lowest cost (i.e., fewest operations) necessary to produce identical movement histories with matching arrays at each 1-h time interval. There are two operations used in optimal matching and each is associated with a unique cost structure. Substitutions are defined as the cost of converting the observed array in one sequence so that it matches the observed array at the same position in the other sequence. Though (Lowe et al. 2020) used a custom cost structure based on array adjacency, such an approach in this study violated the triangle inequality assumption (i.e., coherence among all possible dissimilarity values; Studer and Ritschard, 2016). Thus, substitution costs (SC) were calculated using the equation,
where cval is set to 2 (default value) and Pi|j is the observed transition probability from array i to array j. Insertions/deletions (“indels”) align sequences by inserting gaps or deleting sections of movement histories so that the remaining sequences are aligned. Individual indel operations had a cost of 0.9999. However, any indel operation performed within a sequence was necessarily accompanied by another indel to maintain equal lengths among the movement histories; thus the cumulative cost of an indel operation was 1.9998. This cost structure met the triangle inequality assumptions and prioritized: (1) substitutions corresponding to first-order movements (transitions between adjacent arrays) over all other operations and (2) indels over substitutions corresponding to second-order movements (transitions between non-adjacent arrays). The latter was necessary because second-order transitions only occurred if there was a missed detection and were, otherwise, physically impossible.
Preliminary sequence analysis indicated that movement histories did not significantly cluster between sex or year or among release groups. As a result, movement histories were pooled and treated as a single dataset for sequence analysis. Ward's hierarchical agglomerative clustering method was used to identify significant clusters of common movement histories based on the minimum within-cluster dispersion (Murtagh and Legendre, 2014). Average silhouette width was used to identify the optimal number of clusters in the resulting dendrogram. In addition, bulk movement patterns were further examined by plotting the relative proportion of tagged Sea Lamprey in each state at each 1-h time step and those distributions were qualitatively compared with bottom water temperature in the Detroit and Saint Clair Rivers.
Furthest upstream detection, bottom flow velocity, and larval Sea Lamprey distribution
Following (Holbrook et al. 2016), the location of furthest upstream detection was assumed to be an indicator of spawning and directionality was assigned to that detection to further refine where spawning may have occurred. Vector headings (in degrees) were calculated between consecutive detections for each individual and combined with manual interpretation of the detection events to characterize movement directionality as either upstream, downstream, fallback, or staging. Given the relative orientation of the SCDRS, a movement was considered upstream if (1) the vector heading was between 310° (northwest) and 50° (northeast), or 50° and 110° in the upper Detroit River and North Channel of the Delta, and (2) there was an obvious transition between a downstream detection and the furthest upstream detection over a short time interval (< 48 h) that was not followed by further detections (i.e., a tagged Sea Lamprey moved into an adjacent upstream area with no receiver coverage). A movement was classified as downstream if, following the furthest upstream detection, the fish was detected on a downstream receiver or had a vector heading between 130° and 230° (230° and 290° in the upper Detroit River and the North Channel of the Delta) and was followed by an upstream movement later in the detection events. A fallback occurred when a downstream movement was not followed by an upstream movement and is thought to indicate post-spawning mortality (Frank et al., 2009). Lastly, staging consisted of consecutive detections on a set of nearby receivers lasting >48 h; vector headings either could not be calculated or were highly variable between detections for this group. No determination (Nd) was made for ambiguous detections which consisted mostly of fish with a long interval (>3 days) between the furthest upstream detection and the previous detection followed by no detections.
The number of furthest upstream detections within each array during each study year was qualitatively compared with the mean bottom velocity and the proportion of larvae during the survey year that occurred in each array to provide additional insights into the most probable spawning areas in the SCDRS. Bottom current velocity (m sec−1) throughout the SCDRS was interpolated from the Huron Erie Connecting Waters Forecasting System (HECWFS). HECWFS is a three-dimensional hydrostatic free circulation model comprised of a flexible unstructured grid that provides accurate real-time estimates of flow direction, velocity, and temperature across seven depth layers in the SCDRS (Anderson et al., 2010). Mean bottom velocity was calculated for 11,000 randomly selected model elements (1,100 points per array in the sequence analysis) and partitioned into two data sets. Ninety percent of the data were used to interpolate bottom velocity across the SCDRS using inverse distance weighting (IDW; distance coefficient = 3.0, cell size = 25 m2). Leave one out cross-validation with the remaining data was used to calculate the root mean square error (RMSE) and evaluate interpolation accuracy. Additionally, daily mean bottom velocity was calculated for the same subset of elements at the beginning (i.e., date of the final release group; Table 2), median date (07 June 2016 and 22 June 2017), and end (i.e., the study termination date) of the study duration in each year. These data were used to examine the temporal stability of bottom flow conditions between years during the Sea Lamprey spawning season.
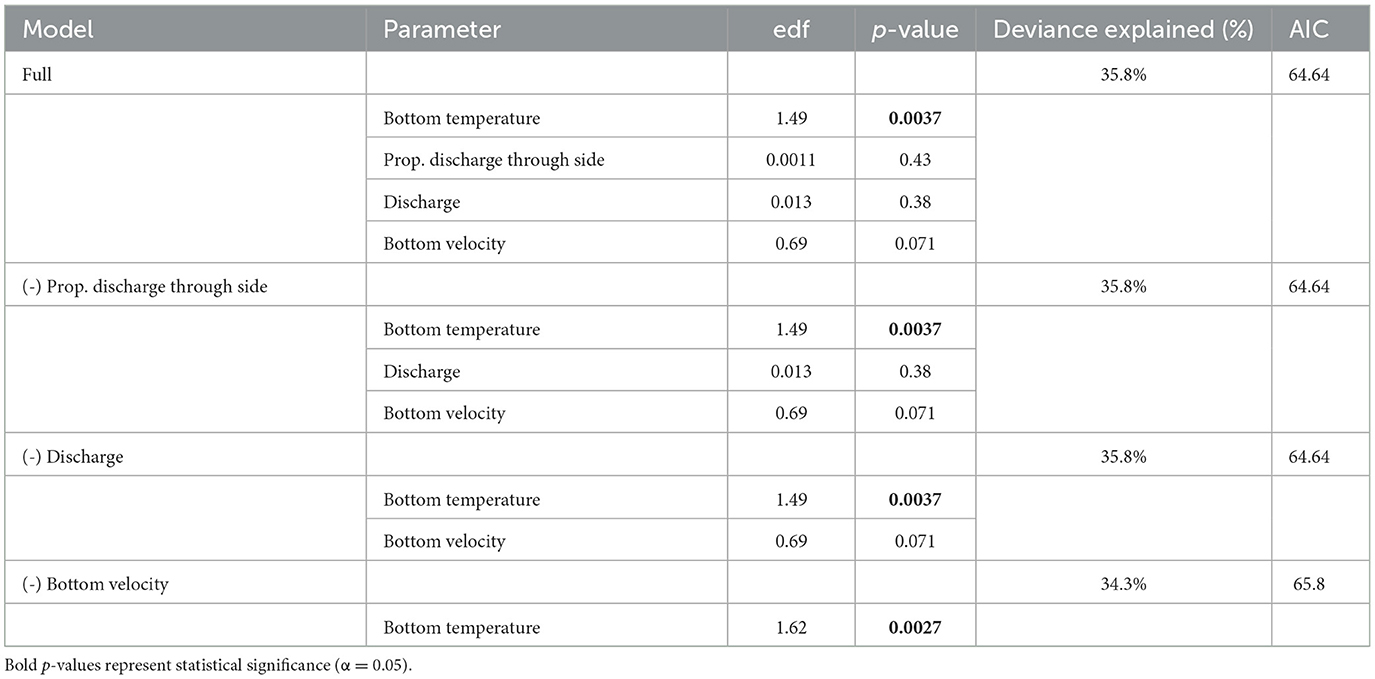
Table 2. Generalized additive modeling results describing the relationship between the proportion of acoustic-tagged Sea Lamprey (Petromyzon marinus) and environmental drivers derived from the Huron Erie Connecting Waters Forecasting System model.
Second, we examined the spatial relationship between the furthest upstream detection and larval Sea Lamprey distribution data collected by the SLCP. It is important to note that larvae were assessed only in the wadable portions of the SCDRS (Sullivan and Mullett, 2018, 2017) and do not include information from the deeper portions of the system. Despite this limitation, the data are the best available indicator of larval distribution and abundance in the SCDRS.
Channel use and bulk flow characteristics
Detections on receivers located at the downstream end of four conspicuous bifurcations (i.e., Fighting Island, the Delta, Fawn Island, and Stag Island) were used to determine if routes used by tagged Sea Lamprey were related to bulk flow characteristics. At Fighting, Fawn, and Stag islands, the channels with slower moving water to the east of each island were treated as the “side” channel. Sea Lamprey used three channels in the Delta; the South Channel was treated as the main channel, the North Channel as the side channel, and Chenail Ecarté as the east channel. Receivers that could provide ambiguous detections (i.e., receivers not fully in the channel or with detection ranges that overlapped with receivers in the adjacent channel) were omitted from this analysis and only the first detection on the remaining receivers were used to determine channel use for individuals classified as moving upstream at the time of detection.
The best predictors of the proportion of acoustic-tagged Sea Lamprey using the side channel at each bifurcation were identified using Stepwise Variable Selection General Additive Modeling (GAM). Specifically, we compared the daily proportion of fish using the “side” channel (channel with the lowest discharge) vs. the main channel (channel with highest discharge) to a suite of potential environmental predictors that included bottom water temperature and current velocity from the HECWFS model, degrees above peak migration temperature [>15°C; the temperature associated with the cessation of Sea Lamprey migration and activity (Binder et al., 2010)], observed discharge at Port Huron (USGS station: 04159130) and Fort Wayne (USGS station: 04165710) on the Saint Clair and Detroit Rivers, respectively, (U.S. Geological Survey, 2021) and the proportion of derived discharge through the side channel at each bifurcation (Supplementary material 1). Prior to GAM analyses, an ANOVA for circular data and Watson-Williams two sample test for post-hoc examination of significant main factors was used to assess the time of day that first detections occurred at each bifurcation (Cremers and Klugkist, 2018). Predominately nocturnal movements were considered reasonable validation of the assumption that “first detections” represented pathway selection during active upstream migration (Applegate, 1950).
All analyses were conducted in the R-environment (version 3.4.3; R Core Team, 2013). Detection data were processed using the “glatos” package in R (Holbrook et al., 2024). The state sequence objects were constructed using the “seqdef” function (Gabadinho et al., 2011a), dissimilarity measures were calculated with the “seqdist” function (Studer and Ritschard, 2016) and representative sequence identification using the “seqrep.grp” (Gabadinho et al., 2011b) function in the R package “TraMineR” (Gabadinho et al., 2011a). Cluster analysis was done using the “hclust” function in the base “stats” package in R and the average silhouette width was calculated using the “fviz_nbclust” function in the “factoextra” package (Kassambara and Mundt, 2020). Circular statistics were performed using the “circular” package (Agostinelli and Lund, 2022). Stepwise General Additive Modeling was carried out using the “mgcv” package (Wood, 2011).
Results
Acoustic-tagged Sea Lamprey were detected at 144 receiver stations operated within the SCDRS and throughout lakes Erie and Huron (Figure 3). The furthest upstream detection for Sea Lamprey movements ranged from the Niagara River (n = 2) at the eastern end of Lake Erie to the Straits of Mackinac (n = 2) where Lake Huron connects to Lake Michigan (Figure 3). Thirty-four Sea Lamprey entered Lake Huron and most of those (n = 18) entered Saginaw Bay. In the Detroit River, three furthest upstream detections occurred in the lower Detroit River, three occurred near Fighting Island, and 27 occurred where the upper Detroit River transitions into Lake Saint Clair. Fifteen individuals were last detected in Lake Saint Clair. One hundred and eighty-seven (2016 = 78; 2017 =109) furthest upstream detections were distributed throughout the Saint Clair River, primarily at Fawn and Stag islands (Figure 3).
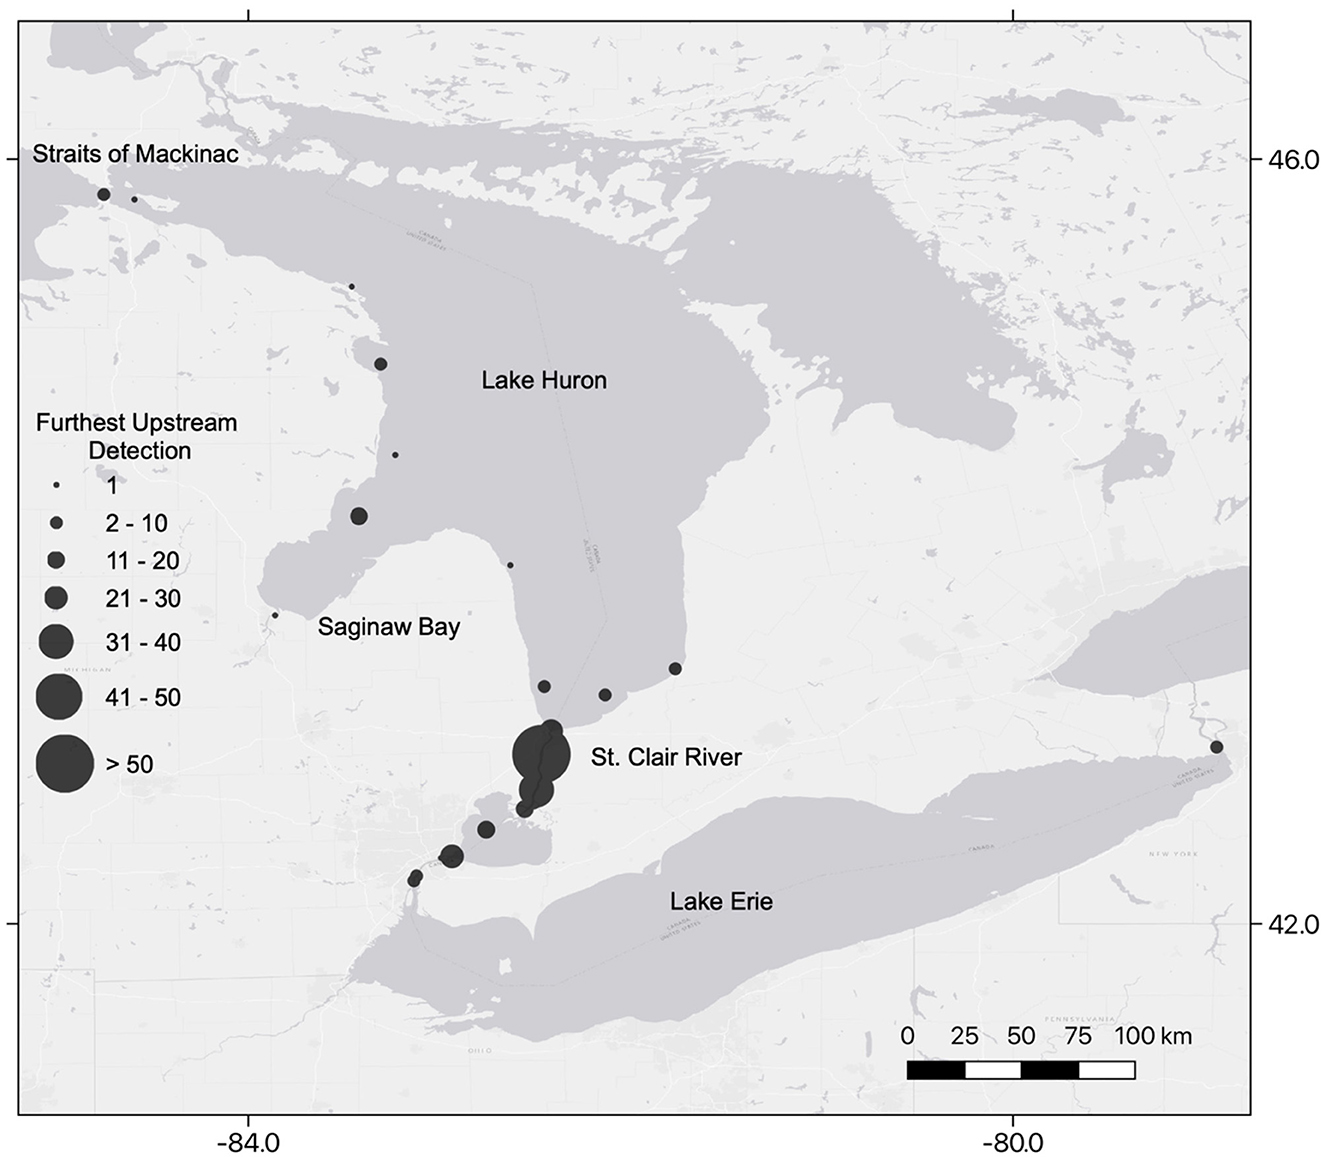
Figure 3. Location of furthest upstream detection of each acoustic-tagged adult Sea Lamprey (Petromyzon marinus) released into the lower Detroit River during 2016 and 2017.
Commonly shared movement histories
Detection efficiency (calculated as the number of fish detected/number of expected fish x 100; following false detection filtering) was >95% at all but two arrays and ranged from 82% in Lake Saint Clair to 100% in the lower Detroit River (Supplementary Table S1). The relative proportion of acoustic-tagged Sea Lamprey in each state was consistent between 2016 and 2017 and appeared to track bottom water temperature in the Saint Clair River (Figure 2).
Individual movement histories were highly variable in both 2016 and 2017 (Supplementary Figure S1). Nineteen of the 125 and 16 of the 146 Sea Lampreys released in 2016 and 2017, respectively, were not detected outside of the Detroit River (Supplementary Figure S1). The final detection for 21 of these fish occurred at the transition between the upper Detroit River and Lake Saint Clair suggesting movement into Lake Saint Clair. Among the Sea Lamprey that did not enter Lake Saint Clair, four individuals (two in each year) moved downstream into Lake Erie after release and 10 individuals ceased upstream migration at receivers not associated with the upper Detroit River. Two hundred thirty-six Sea Lamprey were detected in Lake Saint Clair, 14 of which did not move into the Saint Clair River though detection probabilities were markedly lower in Lake Saint Clair than in other arrays (Supplementary Table S1; Supplementary Figure S1). A single fish was detected in the Thames River in 2017 (Supplementary Table S2); no fish were detected in the Clinton River. Sixty-nine percent of the tagged Sea Lamprey (187 of 271) ceased their upstream migration in various portions of the Saint Clair River, nine individuals were detected in the Belle (n = 4) and Black rivers (n = 5; Supplementary Table S2), and 30 (11.00%) Sea Lamprey rapidly migrated through the Saint Clair River and continued to various parts of Lake Huron.
The optimal matching algorithm resulted in a 271 × 271 matrix with scores ranging from 0 (identical movement histories) to 2,767.64 (most dissimilar). Seven significant clusters were identified among the 271 Sea Lamprey movement histories using agglomerative hierarchical clustering (Figure 4). Average silhouette width (ASW) reached an asymptote at five clusters and remained steady through the 10-cluster solution (range 0.326 to 0.340). Though any of those six cluster combinations are likely valid, the resulting seven-cluster solution had the largest average silhouette width (ASW = 0.340) and centered on the extent to which Sea Lamprey used the Saint Clair River while displaying both inter- and intra-variation among clusters (Figure 4).
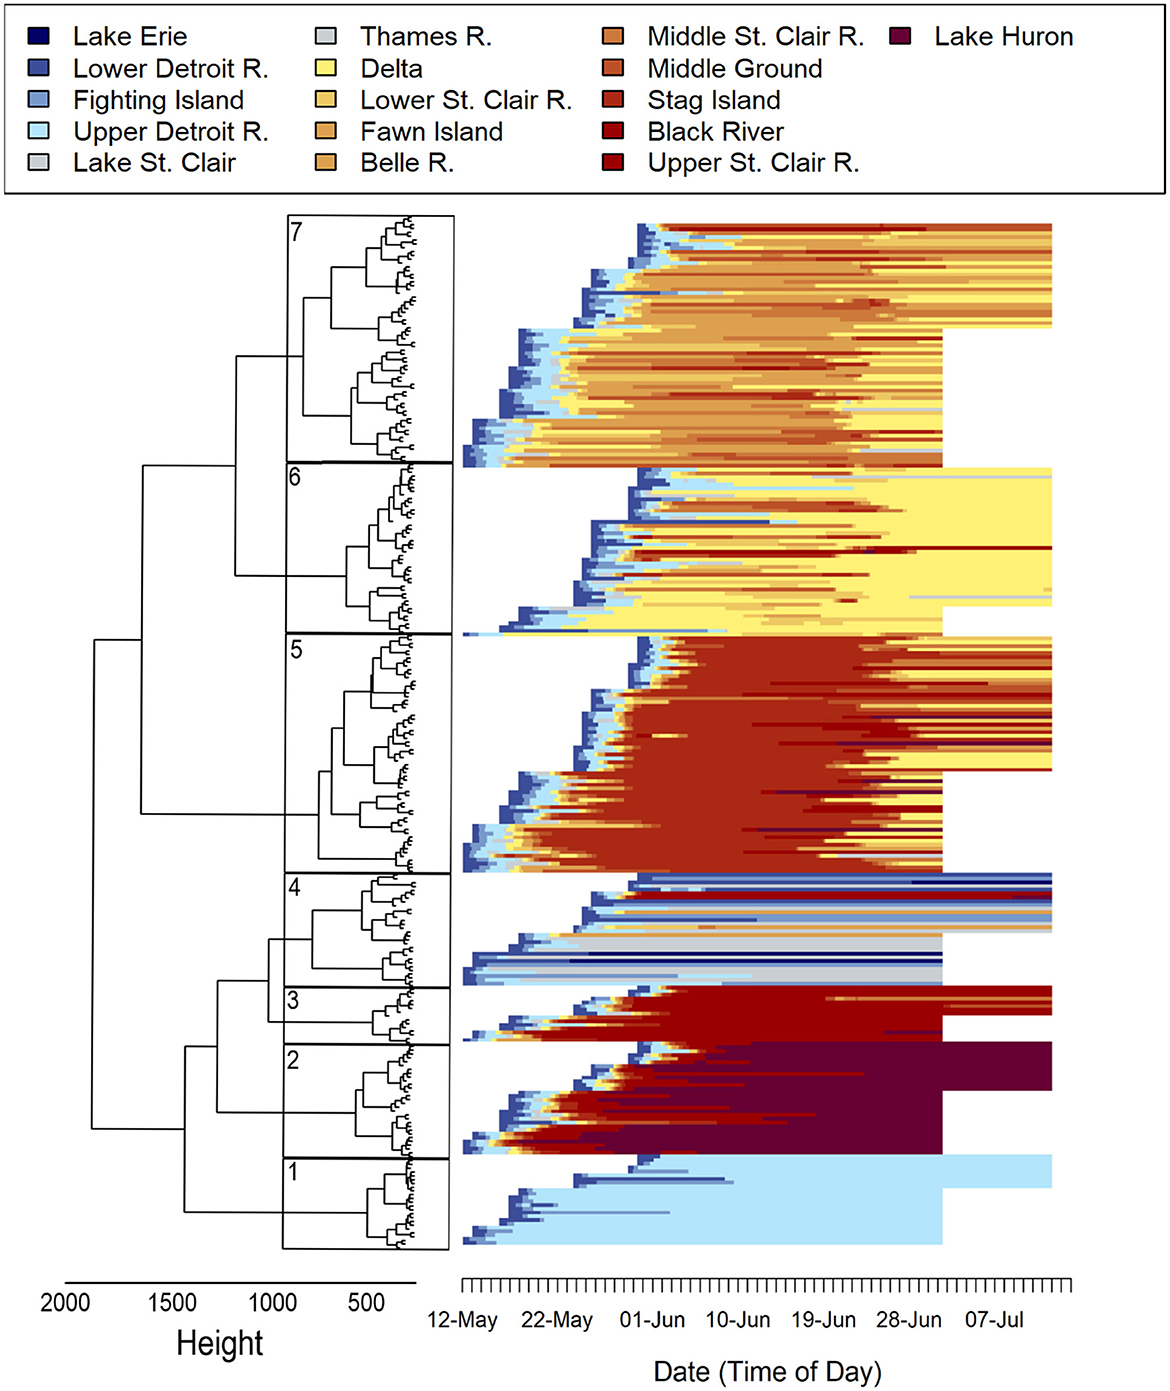
Figure 4. Cluster dendrogram with seven significant groups (boxes) of acoustic-tagged adult Sea Lamprey (Petromyzon marinus) movement histories based on sequence dissimilarities that were calculated using Ward's (squared) criterion. Individual movement histories showing the hourly location of 271 acoustic-tagged adult Sea Lamprey released into the lower Detroit River in 2016 and 2017. The order of movement histories is based on the corresponding cluster assignment and aligns with the significant clusters identified in the dendrogram.
Clusters 1 and 2 captured the small proportion of tagged Sea Lamprey that either did not use the Saint Clair River (n = 24) or those that made a made a full transit of the SCDRS and moved to various locations throughout Lake Huron (n = 34), respectively. Cluster 3 contained the 15 individuals that rapidly transited through the SCDRS in less than a week, were last detected in the upper Saint Clair River and were not detected in Lake Saint Clair before moving into the Saint Clair River (i.e., missed detections). Cluster 4 was the least resolved grouping in the analysis (Figure 4) and had the most spread among representative movement histories. This cluster contained numerous movement histories, including: (1) 11 of the 14 individuals that were not detected after moving into Lake Saint Clair, (2) four fish that moved downstream into Lake Erie, (3) 10 individuals that never left the lower reaches of the Detroit River, and (4) three individuals that had a missed detection in the Lake Saint Clair and were never detected above Fawn Island.
Cluster 5 can be characterized as the Stag Island cluster (Figure 4). This cluster contained 58 Sea Lamprey that were continuously detected in the Stag Island array for >1 week. There was a moderate amount of variation within the cluster but most of the movement histories can be characterized as cessation of upstream movement at Stag Island and subsequent fallback to a downstream array. Cluster 6 consisted of 30 Sea Lamprey that ceased upstream migration in either the Delta or the lower Saint Clair River and 15 Sea Lamprey that displayed fallback behavior to the Delta after moving upstream to an area between Fawn and Stag islands (Figure 3). Cluster 7 consisted of 65 Sea Lamprey that ceased upstream migration between Fawn Island and the Middle Ground arrays (Figure 4) and, like Cluster 5, showed multiple forms of fallback behavior.
Furthest upstream detection, bottom velocity, and larval sea lamprey distribution
Within the SCDRS, all furthest upstream detections in the Detroit River were classified as moving upstream at the time of detection (n = 25) or were undetermined (n = 3; Figure 5). Of the 187 furthest upstream detections in the Saint Clair River, no determination was made for 24 detections (Figure 5). There were 63 detections classified as upstream movements in the Saint Clair River with the greatest concentrations at Fawn Island (n = 12), Stag Island (n = 17), and the transition between the Saint Clair River and Lake Huron (n = 14; Figure 5). Similarly, 64 detections in the Saint Clair River were classified as fallback. However, only four fallbacks each were detected in the Delta and upper Saint Clair River, with the remainder observed between Fawn and Stag islands (Figure 5). Staging was observed throughout the Saint Clair River (n = 34) but was largely constrained to Stag Island (n = 22). Further, there was a temporal component to the directionally of furthest upstream detections. The majority of furthest upstream detections were classified as either moving upstream or staging prior to 13 June 2016 and 19 June 2017; after those dates most detections were classified as fallback (Figure 5).
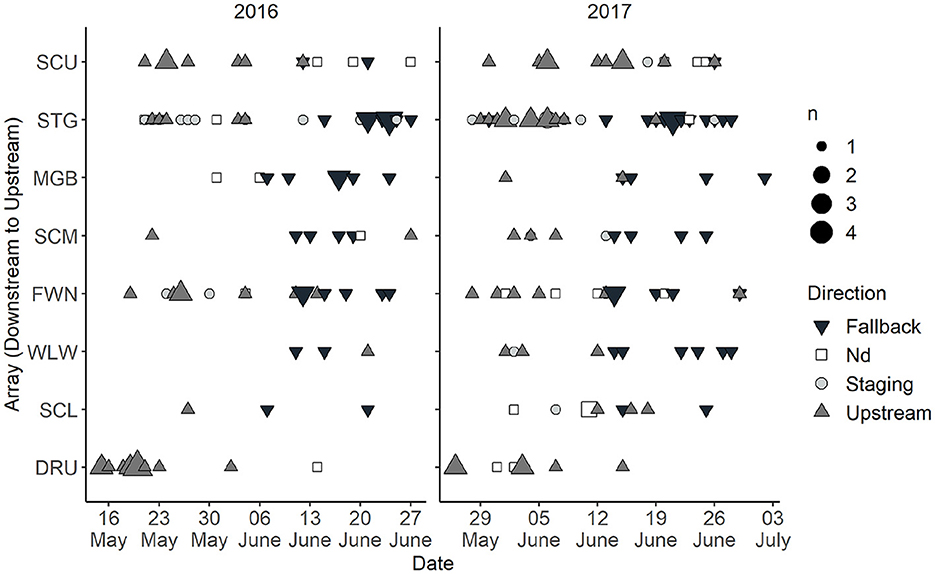
Figure 5. Number of acoustic-tagged adult Sea Lamprey (Petromyzon marinus) inferred to be moving upstream, downstream (fallback), staging, or undetermined (Nd) at the time of the furthest upstream detection in the Saint Clair River and Detroit Rivers System during 2016 and 2017. The color and shape of the symbol represents the direction and the relative size reflects the number of tagged fish that were detected on that date. See Figure 1 for array locations.
In order to characterize the relationship between bottom current velocity in the SCDRS and the spatial distribution of furthest upstream detections, we had to first compile flow data into a relatable spatial framework (see Appendix 1). Bottom current velocity was spatially variable but temporally stable in both the Detroit and Saint Clair rivers (Figure 6B and Supplementary Figure S2). The interpolated bottom water velocity (averaged for the study duration) was spatially accurate (Cross-validation RMSE: 2016 = 0.095; 2017 = 0.052) and temporally stable between years (RMSE: beginning dates = 0.126, median dates = 0.201, ending dates = 0.113). Except for the plumes associated with the Delta channels and tributaries, interpolated bottom current velocity was < 0.5 m s−1 throughout Lake Saint Clair in both 2016 (mean = 0.05, s.e. = 0.002, range 0.017–0.64 m s−1) and 2017 (mean = 0.06, s.e. = 0.003, range 0.016–0.62 m s−1). In the Detroit River, mean bottom velocity (2016: mean = 0.32, s.e. = 0.08, range 0.011–0.99 m s−1, 2017: mean = 0.30, s.e. = 0.08, range 0.010–0.94 m s−1) exceeded 0.5 m s−1 in 81 % of the interpolated cells upstream of Fighting Island and only 57% of cells below Fighting Island (Supplementary Figure S2). Indeed, the largest stretch (~5.5 km) of elevated bottom current velocities (0.5–0.7 m s−1) occurred in the Upper Detroit River approximately 6.8 km upstream and 13.2 km downstream of the furthest upstream detections at the Fighting Island and Upper Detroit River arrays, respectively (Supplementary Figure S2).
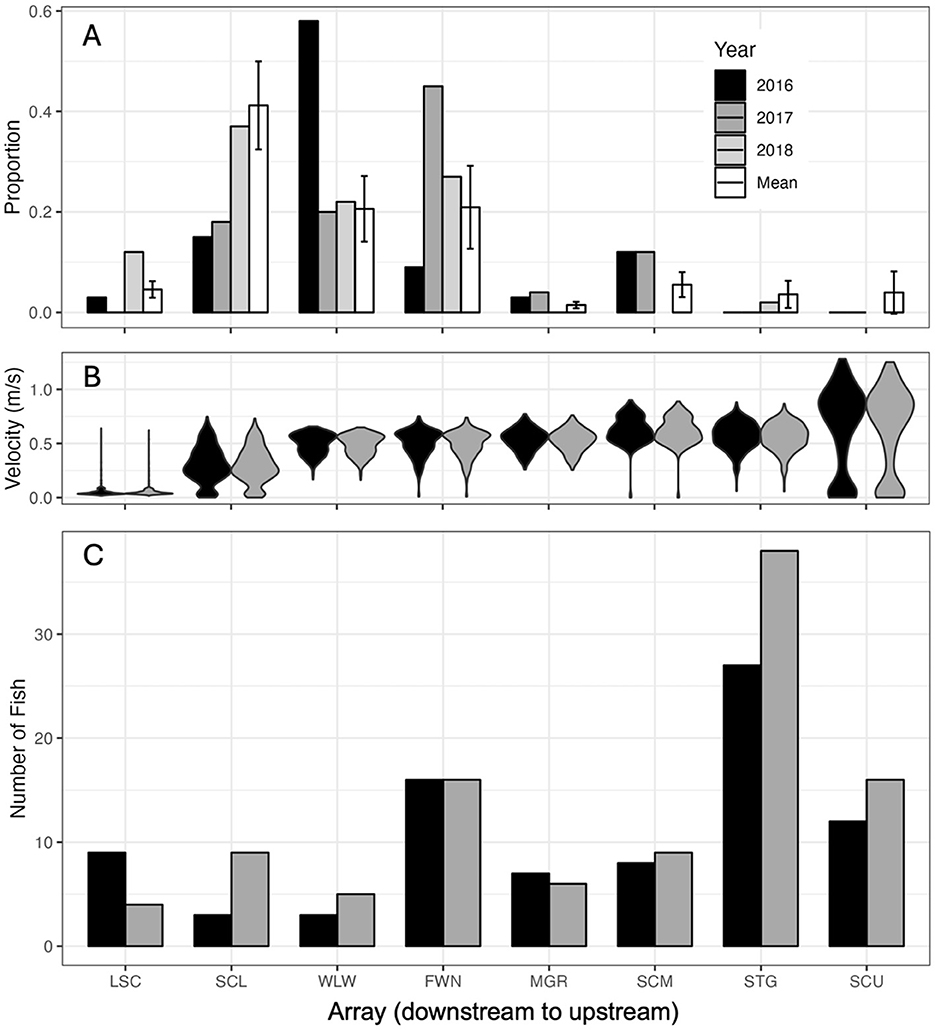
Figure 6. (A) Proportion of Sea Lamprey (Petromyzon marinus) larvae collected in each array during 2016, 2017, and 2018, and the long-term mean (2008–2018). (B) Distribution of bottom velocity values in each array. (C) The number of furthest upstream detections that occurred in each array. Arrays in the Detroit River are not shown because most furthest upstream detections occurred in the Saint Clair River.
By comparison, 93% of interpolated cells were above 0.5 m s−1 in the Saint Clair River with values ranging from 0.06–1.08 (mean = 0.50, s.e. = 0.09) m s−1 in 2016 and 0.06–1.22 (mean = 0.50, s.e. = 0.09) m s−1 in 2017 (Supplementary Figure S2). Low bottom current velocity areas were patchily distributed throughout the Saint Clair River but were associated with the side channels at bifurcations and the Delta. Bottom current velocities >0.5 m s−1 were found throughout the mainstem of the Saint Clair River above the Delta. As a result, furthest upstream detections in the Saint Clair River were invariably < 1 km from areas with relatively higher flow conditions, particularly above Fawn Island (Figure 6B and Supplementary Figure S2). Likewise, Stag Island, where furthest upstream detections were most frequent, is situated between a 4.6 km stretch downstream and a 7.6 km stretch upstream where bottom current velocities ranged from 0.7–1.1 m s−1 (Figure 6B and Supplementary Figure S2). The spatial distribution of furthest upstream detections generally occurred upstream of where larval Sea Lamprey were distributed in the Saint Clair River and in areas where bottom flow velocity was consistently >0.5 m s−1 (Figure 6).
Discharge and channel use
The proportion of acoustic-tagged Sea Lamprey using side channels varied markedly among the four bifurcations and between years (Appendix Figure 3). At Fighting Island, more Sea Lamprey were detected in the main channel (n = 85) than the side channel (n = 38) in 2016 but were more evenly distributed in 2017 (main: n = 72; side: n = 74). Sea Lamprey entered the Saint Clair River predominately through the north (side) channel of the Delta in 2016 (main: n = 27; side: n = 60) and the south (main) channel in 2017 (main: n = 60; side: n = 50); few tagged individuals used the smaller, slower flowing channels on the east side of the Delta (2016 = 5, 2017 = 2). Fawn Island is the only bifurcation where Sea Lamprey consistently used the side channel in 2016 (main: n = 10; side: n = 42) and 2017 (main: n = 29; side: n = 54). Conversely, the main channel at Stag Island was consistently used by Sea Lamprey in both 2016 (main: n = 33; side: n = 12) and 2017 (main: n = 39; side: n = 20).
The time of day that Sea Lamprey moved into the channels differed among the four bifurcations (ANOVA; df = 3, F = 14.46, p < 0.0001) but not between years (df = 1, F = 0.52, p = 0.47). The difference among bifurcations was attributable to first detections that were more broadly distributed at Fighting Island (i.e., more activity between 0500 and 1,200 EST) compared to the Delta, Fawn Island, and Stag Island where most activity occurred between 0000 and 0500 (Figure 7). Sea Lamprey are most active at night during the spawning migration and, as a result, the bifurcation at Fighting Island was removed from further analysis of environmental drivers of channel usage.
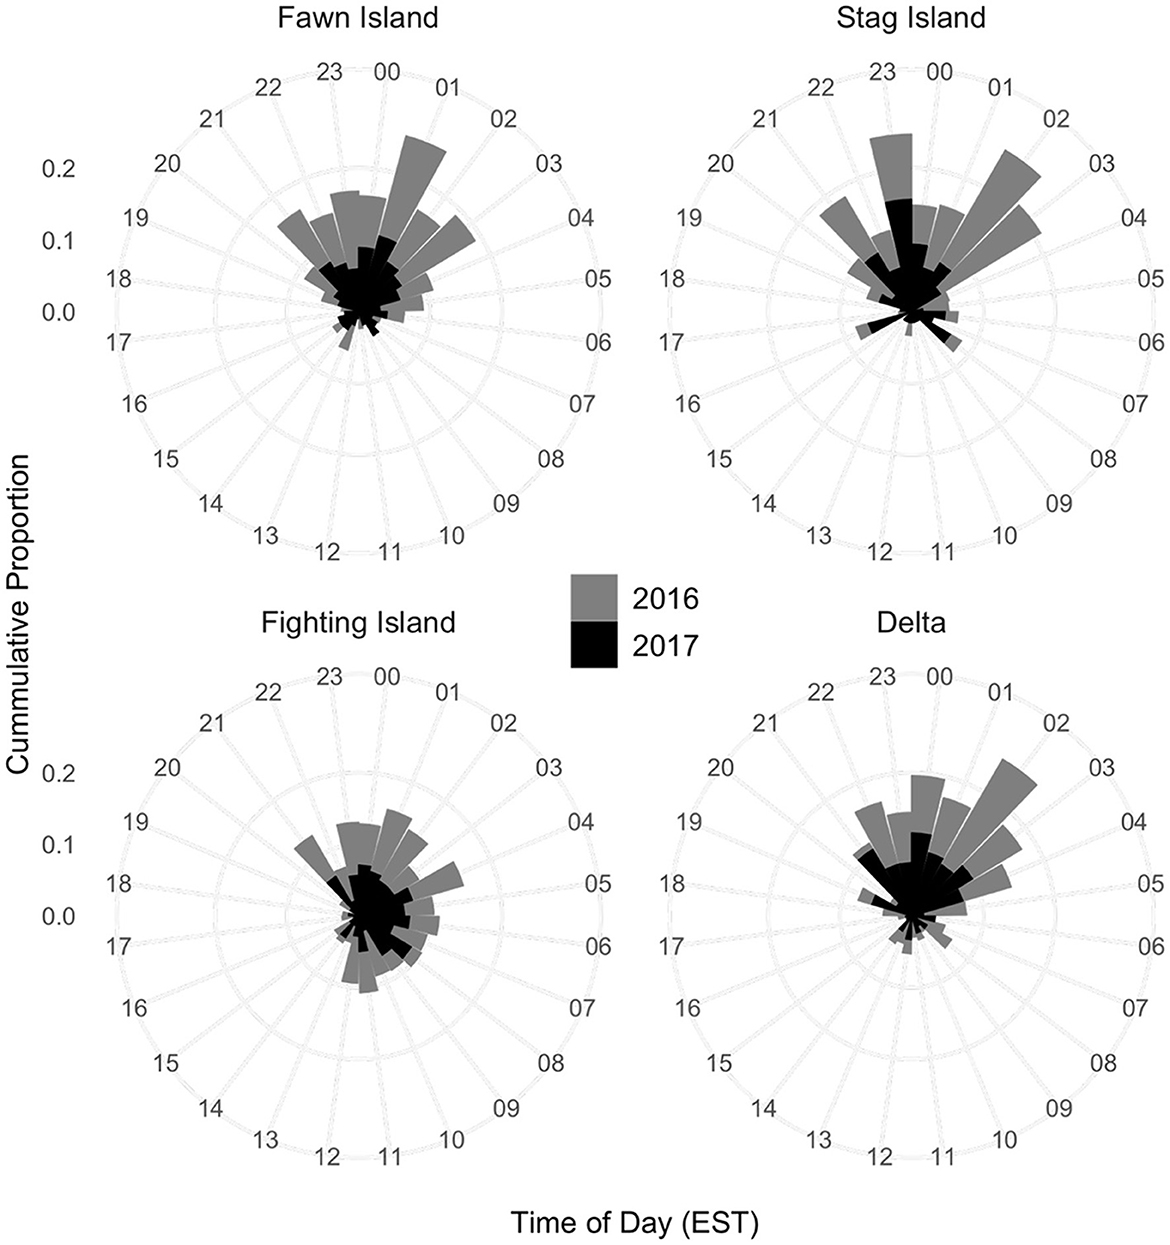
Figure 7. Time of day when acoustic-tagged adult Sea Lamprey (Petromyzon marinus) were first detected moving upstream through the river channels at Stag Island, Fawn Island, the Saint Clair River Delta, and Fighting Island.
The proportion of acoustic-tagged Sea Lamprey using the side channel was highly variable in response to bulk flow characteristics at each bifurcation (Appendix Figure 3). The backwards selection GAM model eliminated these metrics in each model step (Table 2) and the final model included only bottom temperature as a predictor that explained ~34% of the deviance in channel use. Ultimately, side channel usage increased as the spawning season progressed in both years and appears to be driven by increasing bottom water temperature (Figure 8).
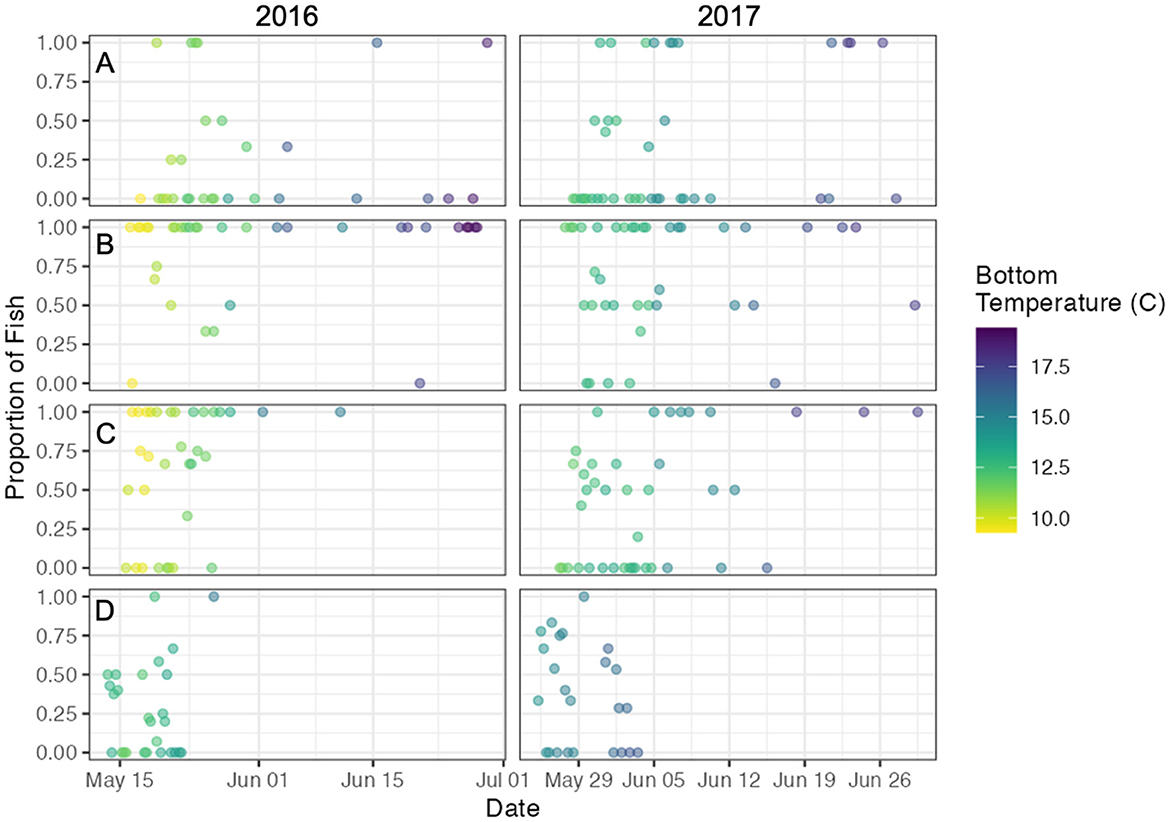
Figure 8. Time-series of the proportion of acoustic-tagged Sea Lamprey (Petromyzon marinus) using the side channel at (A) Stag Island, (B) Fawn Island, (C) the Delta, and (D) Fighting Island in 2016 and 2017. Bottom temperature in the side channel was derived from the Huron Erie Connecting Waters Forecasting System model.
Discussion
Results from this study reinforce the fact that assessing and controlling Sea Lamprey populations that are broadly distributed throughout large river systems is a significant challenge. Understanding reproductive ecology, including the temporal and spatial distribution of adults during the spawning migration, is imperative to efficient application of assessment and control strategies in any targeted system (Siefkes, 2017). Rapid passage of adult Sea Lamprey through the Detroit River and Lake Saint Clair, avoidance of tributaries, and widespread use of the Saint Clair River were consistent with previous observations (Holbrook et al., 2016). Within the Saint Clair River, behavioral changes consistent with spawning behavior (e.g., transition from predominately upstream movement or staging to fallback around 13 June 2016 and 19 June 2017) coincided with bottom water temperatures exceeding the thermal threshold for peak spawning (Beamish, 1980; Morman et al., 1980). The distribution of presumed spawners (e.g., most concentrated in the upper half of the Saint Clair River, particularly near Stag Island) was also consistent with knowledge of physical habitat (i.e., substrate and flow) and larval surveys. Had our results suggested consistent side channel use or significant spawning in the tributaries, standard control methods might have been a suitable option. Instead, these insights contribute to an emerging picture of a physical and biological system that does not favor contemporary Sea Lamprey assessment or control methods (i.e., lampricides, barriers, traps) and highlight the importance of developing and refining strategies that are better suited to large river habitats.
Preference for main stem habitats and broad distribution likely reflects availability of habitat (e.g., substrate, flow, and temperature suitable for spawning) in the SCDRS. By virtue of its primary water source, Lake Huron, the Saint Clair River proper is generally much cleaner and colder than any of its tributaries, which are primarily low-gradient, warmwater streams. Indeed, the areas used by Sea Lampreys for spawning in this system overlaps with known spawning areas of Lake Sturgeon Acipenser fulvescens (Bennion and Manny, 2014), which have similar habitat requirements. Prevalence of gravel and cobble substrates in high velocity regions provide ample spawning habitat and may have been further enhanced by extensive restoration and rehabilitation efforts for other fishes in recent decades (Hartig et al., 2020; Hartig and Bennion, 2017). Not only does the upper Saint Clair River offers ample spawning habitat, its proximity to the lower Saint Clair River and its delta, which are depositional zones of predominantly soft substrates, provides suitable habitat for larval Sea Lamprey production. Continued restoration and remediation efforts in the SCDRS coupled with future climate projections may favor additional larval production (Hinderer et al., 2016; Lennox et al., 2020).
Broad distribution of Sea Lampreys throughout the system requires “broad band” treatment and assessment strategies. Traditional Sea Lamprey treatment and assessment methods are not well suited to the large areas, habitat depths, or high flows like those present in the Saint Clair River. With only one exception (the Saint Marys River), the Saint Clair River is roughly an order of magnitude larger than any river where Sea Lamprey assessment or control have been considered cost effective—and in the Saint Marys River, assessment and control are heavily dependent on an extensive lock and dam complex. In lieu of migration barriers that create spatial bottlenecks and restrict distributions of both adult and larval Sea Lampreys to areas where they can be targeted, strategies currently considered to be “supplemental” to conventional methods, such as the release of sterilized males, may be most effective. The Sterile Male Release Technique (SMRT) was used in the Saint Marys River to introduce chemically sterilized male Sea Lamprey in such high numbers that they competed with fertile males and reduced the effective population of spawning females (Knipling, 1959). Despite moderate success in reducing the production of viable embryos (Bravener and Twohey, 2016), the SMRT program was discontinued in the Saint Marys River due, in part, to uncertainty about the adult population size and the number of sterile males needed to achieve target ratios of sterile-to-fertile males in the wild. However, that decision was supported by an enhanced trapping program and specialized larval assessment (deepwater electrofisher) and control (granular Bayluscide treatment) strategies that are considered effective in the Saint Marys River. These methods are not effective in the Saint Clair River due to its size and that diminishes our ability to inform the number of sterile males needed for release in the SCDRS. Like control strategies, population assessments in such large river systems may require broad-band genetic strategies such as pedigree analyses (Sard et al., 2020; Weise et al., 2023, 2022) or environmental DNA (Bracken et al., 2019; Gingera et al., 2016; Schloesser, 2018).
“Narrow band” treatment and assessment strategies might require manipulation of migration pathways to create spatial bottlenecks or ecological traps. Although few (3.7%) tagged adult Sea Lamprey were detected in tributaries connected to the SCDRS, Sea Lamprey have been documented in all five tributaries included in this study, from as early as the 1930s (Clinton River; Shetter, 1949) to 2015, when larval populations in the Clinton and Thames rivers warranted lampricide treatments (Grunder et al., 2021). Recent progress on identification and synthesis of Sea Lamprey pheromones that play important roles in stream or habitat identification (Li et al., 2018; Sorensen and Vrieze, 2003) and mate localization (Buchinger et al., 2015; Johnson et al., 2009; Li et al., 2002) offer hope that pheromones might be used to increase attraction into tributaries. Similarly, chemical “alarm” cues may 1 day be used to “push” adult Sea Lampreys away from habitats that are currently favored (Bals and Wagner, 2012; Hume et al., 2020). Unfortunately, the small size of tributaries compared to the Saint Clair River may render these approaches ineffective. Similarly, the volume of water in the Saint Clair River likely exceeds anything that could be practically implemented with alarm cues. In lieu of push-pull strategies involving tributaries, perhaps other environmental changes could be used to more efficiently alter the distribution of Sea Lampreys in the Saint Clair River. For example, among all channel bifurcations in this study, 83% of tagged Sea Lamprey used the smaller, slower flowing side channel at least once during their upstream migration. Although side channel use was not related to bulk flow dynamics (proportion of tagged fish vs. proportion of discharge passing through the side channel), consistent disproportionate use of the side channel around Fawn Island suggests that certain environmental features (e.g., geomorphology) influence migration pathways and if mechanisms can be understood (Zielinski et al., 2021; Kerr et al., 2023), those features might be beneficial to future control efforts.
Large river systems require new strategies for Sea Lamprey assessment and control. It is perhaps no coincidence that the most effective control and assessment tools are restricted to areas where Sea Lamprey life history is best understood—and where Sea Lampreys are most easily observed. While the Saint Clair River may be an anomaly with its size and proximity to a large oligotrophic lake, the number of unimpounded rivers is expected to grow as pressure mounts to remove dams and restore connectivity to fragmented ecosystems (Walter et al., 2021). Moreover, as one of the largest rivers in the Great Lakes (by discharge), any new ecological insights (e.g., navigation strategies) or successful new tools or techniques (e.g., eDNA assessment, sterile male releases) are not only likely to benefit the fish community of Lake Erie but are also expected to generate insights that are relevant and transferrable to other systems.
Data availability statement
The raw data supporting the conclusions of this article will be made available by the authors, without undue reservation.
Ethics statement
The requirement of ethical approval was waived by the United States Geological Survey Great Lakes Science Center for the studies involving animals because Animal Ethics Committee was not established at the time of the study. The studies were conducted in accordance with the local legislation and institutional requirements.
Author contributions
ML: Data curation, Formal analysis, Investigation, Visualization, Writing – original draft, Writing – review & editing. AJ: Conceptualization, Funding acquisition, Methodology, Writing – review & editing. JB: Conceptualization, Formal analysis, Funding acquisition, Methodology, Writing – review & editing. DH: Conceptualization, Formal analysis, Funding acquisition, Investigation, Methodology, Writing – review & editing. CH: Conceptualization, Data curation, Formal analysis, Funding acquisition, Investigation, Methodology, Project administration, Writing – original draft, Writing – review & editing.
Funding
The author(s) declare that financial support was received for the research and/or publication of this article. This work was funded by the Great Lakes Fishery Commission (Project 2016_HOL_54048) through Great Lakes Restoration Initiative appropriations (GL-00E23010-3).
Acknowledgments
The Great Lakes Acoustic Telemetry Observation System (http://www.glatos.glos.us) assisted with project coordination. We thank technical staff from the U.S. Geological Survey, US Fish and Wildlife Service, and Walpole Island First Nation for assistance with fish tagging and maintaining acoustic receivers in the SCDRS during the study period. Additional thanks are extended to personnel at National Oceanic and Atmospheric Administration - Great Lakes Environmental Research Laboratory for assisting with the processing of the Huron Erie Connecting Waters Forecasting System data. Any use of trade, firm, or product names is for descriptive purposes only and does not imply endorsement by the U.S. Government. The findings and conclusions in this article are those of the authors and do not necessarily represent the views of the U. S. Fish and Wildlife Service. This article is contribution number 147 of the Great Lakes Acoustic Telemetry Observation System.
Conflict of interest
The authors declare that the research was conducted in the absence of any commercial or financial relationships that could be construed as a potential conflict of interest.
Generative AI statement
The author(s) declare that no Gen AI was used in the creation of this manuscript.
Publisher's note
All claims expressed in this article are solely those of the authors and do not necessarily represent those of their affiliated organizations, or those of the publisher, the editors and the reviewers. Any product that may be evaluated in this article, or claim that may be made by its manufacturer, is not guaranteed or endorsed by the publisher.
Supplementary material
The Supplementary Material for this article can be found online at: https://www.frontiersin.org/articles/10.3389/ffwsc.2025.1584751/full#supplementary-material
References
Almeida, P. R., Quintella, B. R., and Dias, N. M. (2002). “Movement of radio-tagged anadromous sea lamprey during the spawning migration in the River Mondego (Portugal),” in Aquatic Telemetry, eds. E. B. Thorstad, I. A. Fleming, T. F. Næsje (Dordrecht: Springer Netherlands), 1–8. doi: 10.1007/978-94-017-0771-8_1
Anderson, E., Schwab, D., and Lang, G. (2010). Real-time hydraulic and hydrodynamic model of the st. clair river, lake st. clair, detroit river system. J. Hydraul. Eng.-Asce. 136. doi: 10.1061/(ASCE)HY.1943-7900.0000203
Applegate, V. C. (1950). Natural History of the Sea Lamprey, Petromyzon Marinus. Michigan: University of Michigan.
Bals, J. D., and Wagner, C. M. (2012). Behavioral responses of sea lamprey (Petromyzon marinus) to a putative alarm cue derived from conspecific and heterospecific sources. Behaviour 149, 901–923. doi: 10.1163/1568539X-00003009
Barber, J., and Van Kempen, T. (2024). Sea Lamprey Control in the Great Lakes 2023. Annual Report to the Great Lakes Fishery Commission. Ann Arbor, MI, 103.
Beamish, R. J. (1980). Adult biology of the river lamprey (Lampetra ayresi ) and the pacific lamprey (Lampetra tridentate ) from the pacific coast of Canada. Can. J. Fish. Aquat. Sci. 37, 1906–1923. doi: 10.1139/f80-232
Beeman, J. W., and Perry, R. W. (2012). “Bias from false-positive detections and strategies for their removal in studies using telemetry,” in Telemetry techniques: A user guide for fisheries research, American Fisheries Society, Western Fisheries Research Center.
Bennion, D. H., and Manny, B. A. (2014). A model to locate potential areas for lake sturgeon spawning habitat construction in the St. Clair–Detroit River System. J. Gt. Lakes Res. 40, 43–51. doi: 10.1016/j.jglr.2014.02.002
Binder, T. R., McLaughlin, R. L., and McDonald, D. G. (2010). Relative importance of water temperature, water level, and lunar cycle to migratory activity in spawning-phase sea lampreys in Lake Ontario. Trans. Am. Fish. Soc. 139, 700–712. doi: 10.1577/T09-042.1
Bracken, F. S. A., Rooney, S. M., Kelly-Quinn, M., King, J. J., and Carlsson, J. (2019). Identifying spawning sites and other critical habitat in lotic systems using eDNA “snapshots”: A case study using the sea lamprey Petromyzon marinus L. Ecol. Evol. 9, 553–567. doi: 10.1002/ece3.4777
Bravener, G., and Twohey, M. (2016). Evaluation of a sterile-male release technique: a case study of invasive sea lamprey control in a tributary of the laurentian great lakes. North Am. J. Fish. Manag. 36, 1125–1138. doi: 10.1080/02755947.2016.1204389
Buchinger, T. J., Siefkes, M. J., Zielinski, B. S., Brant, C. O., and Li, W. (2015). Chemical cues and pheromones in the sea lamprey (Petromyzon marinus). Front. Zool. 12:32. doi: 10.1186/s12983-015-0126-9
Coble, D. W., Bruesewitz, R. E., Fratt, T. W., and Scheirer, J. W. (1990). Lake trout, sea lampreys, and overfishing in the upper great lakes: a review and reanalysis. Trans. Am. Fish. Soc. 119, 985–995. doi: 10.1577/1548-8659(1990)119<0985:LTSLAO>2.3.CO;2
Cremers, J., and Klugkist, I. (2018). One direction? A tutorial for circular data analysis using r with examples in cognitive psychology. Front. Psychol. 9:2040. doi: 10.3389/fpsyg.2018.02040
Cucherousset, J., and Olden, J. D. (2011). Ecological impacts of nonnative freshwater fishes. Fisheries 36, 215–230. doi: 10.1080/03632415.2011.574578
Cuthbert, R. N., Pattison, Z., Taylor, N. G., Verbrugge, L., Diagne, C., Ahmed, D. A., et al. (2021). Global economic costs of aquatic invasive alien species. Sci. Total Environ. 775:145238. doi: 10.1016/j.scitotenv.2021.145238
Czuba, J. A., Best, J. L., Oberg, K. A., Parsons, D. R., Jackson, P. R., Garcia, M. H., et al. (2011). Bed morphology, flow structure, and sediment transport at the outlet of Lake Huron and in the upper St. Clair River. J. Gt. Lakes Res. 37, 480–493. doi: 10.1016/j.jglr.2011.05.011
De Groeve, J., Van de Weghe, N., Ranc, N., Neutens, T., Ometto, L., Rota-Stabelli, O., et al. (2016). Extracting spatio-temporal patterns in animal trajectories: an ecological application of sequence analysis methods. Methods Ecol. Evol. 7, 369–379. doi: 10.1111/2041-210X.12453
Fantle-Lepczyk, J. E., Haubrock, P. J., Kramer, A. M., Cuthbert, R. N., Turbelin, A. J., Crystal-Ornelas, R., et al. (2022). Economic costs of biological invasions in the United States. Sci. Total Environ. 806:151318. doi: 10.1016/j.scitotenv.2021.151318
Fetterolf Jr C. M. (1980). Why a great lakes fishery commission and why a sea lamprey international symposium. Can. J. Fish. Aquat. Sci. 37, 1588–1593. doi: 10.1139/f80-206
Frank, H. J., Mather, M. E., Smith, J. M., Muth, R. M., Finn, J. T., and McCormick, S. D. (2009). What is “fallback”?: Metrics needed to assess telemetry tag effects on anadromous fish behavior. Hydrobiologia 635, 237–249. doi: 10.1007/s10750-009-9917-3
Gabadinho, A., Ritschard, G., Mueller, N. S., and Studer, M. (2011a). Analyzing and visualizing state sequences in R with TraMineR. J. Stat. Softw. 40, 1–37. doi: 10.18637/jss.v040.i04
Gabadinho, A., Ritschard, G., Studer, M., and Müller, N. S. (2011b). “Extracting and rendering representative sequences,” in Knowledge Discovery, Knowledge Engineering and Knowledge Management, Communications in Computer and Information Science, eds. A. Fred, J. L. G. Dietz, K. Liu, J. Filipe (Berlin Heidelberg: Springer), 94–106. doi: 10.1007/978-3-642-19032-2_7
Gingera, T. D., Steeves, T. B., Boguski, D. A., Whyard, S., Li, W., and Docker, M. F. (2016). Detection and identification of lampreys in Great Lakes streams using environmental DNA. J. Gt. Lakes Res. 42, 649–659. doi: 10.1016/j.jglr.2016.02.017
Green, S. J., and Grosholz, E. D. (2021). Functional eradication as a framework for invasive species control. Front. Ecol. Environ. 19, 98–107. doi: 10.1002/fee.2277
Griffin, K. R., Holbrook, C. M., Zielinski, D. P., Cahill, C. L., and Wagner, C. M. (2025). Not all who meander are lost: migrating sea lamprey follow river thalwegs to facilitate safe and efficient passage upstream. J. Exp. Biol. 228:JEB249539. doi: 10.1242/jeb.249539
Grunder, S. A., Markham, J. L., Sullivan, W. P., Eilers, C., Tallon, K., and McGarry, D. (2021). A review of sea lamprey control in Lake Erie, 2000–2019. J. Gt. Lakes Res. 47, S506–S522. doi: 10.1016/j.jglr.2021.03.019
Hartig, J. H., and Bennion, D. (2017). Historical loss and current rehabilitation of shoreline habitat along an urban-industrial river—Detroit River, Michigan, USA. Sustainability 9:828. doi: 10.3390/su9050828
Hartig, J. H., Krantzberg, G., and Alsip, P. (2020). Thirty-five years of restoring Great Lakes Areas of Concern: gradual progress, hopeful future. J. Gt. Lakes Res. 46, 429–442. doi: 10.1016/j.jglr.2020.04.004
Hinderer, J. L. M., Adams, J., Bennion, D., Jubar, A., Neave, F., Faust, M., et al. (2016). Have water quality changes in the Huron-Erie Corridor contributed to increases in Lake Erie sea lamprey populations? Great Lakes Fishery Commission Completion Report, July 2016. Ann Arbor Mich. USA.
Holbrook, C., Hayden, T., Binder, T., and Pye, J. (2024). glatos: A Package for the Great Lakes Acoustic Telemetry Observation System. R package version 0.8.0. Available online at: https://github.com/ocean-tracking-network/glatos
Holbrook, C. M., Bergstedt, R., Adams, N. S., Hatton, T. W., and McLaughlin, R. L. (2015). Fine-scale pathways used by adult sea lampreys during riverine spawning migrations. Trans. Am. Fish. Soc. 144, 549–562. doi: 10.1080/00028487.2015.1017657
Holbrook, C. M., Jubar, A. K., Barber, J. M., Tallon, K., and Hondorp, D. W. (2016). Telemetry narrows the search for sea lamprey spawning locations in the St. Clair-Detroit River System. J. Gt. Lakes Res. 42, 1084–1091. doi: 10.1016/j.jglr.2016.07.010
Hume, J. B., Luhring, T. M., and Wagner, C. M. (2020). Push, pull, or push–pull? An alarm cue better guides sea lamprey towards capture devices than a mating pheromone during the reproductive migration. Biol. Invasions 22, 2129–2142. doi: 10.1007/s10530-020-02242-4
Johnson, E. L., Caudill, C. C., Keefer, M. L., Clabough, T. S., Peery, C. A., Jepson, M. A., et al. (2012). Movement of radio-tagged adult pacific lampreys during a large-scale fishway velocity experiment. Trans. Am. Fish. Soc. 141, 571–579. doi: 10.1080/00028487.2012.683468
Johnson, N. S., Yun, S.-S., Thompson, H. T., Brant, C. O., and Li, W. (2009). A synthesized pheromone induces upstream movement in female sea lamprey and summons them into traps. Proc. Natl. Acad. Sci. 106, 1021–1026. doi: 10.1073/pnas.0808530106
Jones, P. E., Tummers, J. S., Galib, S. M., Woodford, D. J., Hume, J. B., Silva, L. G. M., et al. (2021). The use of barriers to limit the spread of aquatic invasive animal species: a global review. Front. Ecol. Evol. 9:611631. doi: 10.3389/fevo.2021.611631
Kassambara, A., and Mundt, F. (2020). factoextra: Extract and Visualize the Results of Multivariate Data Analyses. R Package Version 107999.
Kerr, J. R., Tummers, J. S., Benson, T., Lucas, M. C., and Kemp, P. S. (2023). Modelling fine scale route choice of upstream migrating fish as they approach an instream structure. Ecol. Model. 478:110210. doi: 10.1016/j.ecolmodel.2022.110210
Knipling, E. F. (1959). Sterile-male method of population control: successful with some insects, the method may also be effective when applied to other noxious animals. Science 130, 902–904. doi: 10.1126/science.130.3380.902
Krueger, C. C., Holbrook, C. M., Binder, T. R., Vandergoot, C. S., Hayden, T. A., Hondorp, D. W., et al. (2018). Acoustic telemetry observation systems: challenges encountered and overcome in the Laurentian Great Lakes. Can. J. Fish. Aquat. Sci. 75, 1755–1763. doi: 10.1139/cjfas-2017-0406
Lennox, R. J., Bravener, G. A., Lin, H.-Y., Madenjian, C. P., Muir, A. M., Remucal, C. K., et al. (2020). Potential changes to the biology and challenges to the management of invasive sea lamprey Petromyzon marinus in the Laurentian Great Lakes due to climate change. Glob. Change Biol. 26, 1118–1137. doi: 10.1111/gcb.14957
Li, K., Brant, C. O., Huertas, M., Hessler, E. J., Mezei, G., Scott, A. M., et al. (2018). Fatty-acid derivative acts as a sea lamprey migratory pheromone. Proc. Natl. Acad. Sci. 115, 8603–8608. doi: 10.1073/pnas.1803169115
Li, W., Scott, A. P., Siefkes, M. J., Yan, H., Liu, Q., Yun, S.-S., et al. (2002). Bile Acid secreted by male sea lamprey that acts as a sex pheromone. Science 296, 138–141. doi: 10.1126/science.1067797
Liu, X., Parker, G., Czuba, J. A., Oberg, K., Mier, J. M., Best, J. L., et al. (2012). Sediment mobility and bed armoring in the St Clair River: insights from hydrodynamic modeling. Earth Surf. Process. Landf. 37, 957–970. doi: 10.1002/esp.3215
Lowe, M. R., Holbrook, C. M., and Hondorp, D. W. (2020). Detecting commonality in multidimensional fish movement histories using sequence analysis. Anim. Biotelemetry 8, 1–14. doi: 10.1186/s40317-020-00195-y
Manion, P. J., and Hanson, L. H. (1980). Spawning behavior and fecundity of lampreys from the upper three great lakes. Can. J. Fish. Aquat. Sci. 37, 1635–1640. doi: 10.1139/f80-211
Miehls, S., Dawson, H. A., Maguffee, A. C., Johnson, N. S., Jones, M. L., and Dobiesz, N. (2021). Where you trap matters: implications for integrated sea lamprey management. J. Gt. Lakes Res. 47, S320–S327. doi: 10.1016/j.jglr.2020.06.023
Morman, R. H., Cuddy, D. W., and Rugen, P. C. (1980). Factors Influencing the distribution of sea lamprey (Petromyzon marinus) in the great lakes. Can. J. Fish. Aquat. Sci. 37, 1811–1826. doi: 10.1139/f80-224
Murtagh, F., and Legendre, P. (2014). Ward's hierarchical agglomerative clustering method: which algorithms implement Ward's criterion? J. Classif. 31, 274–295. doi: 10.1007/s00357-014-9161-z
Pincock, D. G. (2012). False detections: what they are and how to remove them from detection data. Vemco Appl. Note 902, 1–11.
Pyšek, P., Hulme, P. E., Simberloff, D., Bacher, S., Blackburn, T. M., Carlton, J. T., et al. (2020). Scientists” warning on invasive alien species. Biol. Rev. 95, 1511–1534. doi: 10.1111/brv.12627
Quintella, B. R., Andrade, N. O., Koed, A., and Almeida, P. R. (2004). Behavioural patterns of sea lampreys' spawning migration through difficult passage areas, studied by electromyogram telemetry. J. Fish Biol. 65, 961–972. doi: 10.1111/j.0022-1112.2004.00497.x
Robinson, K. F., Miehls, S. M., and Siefkes, M. J. (2021). Understanding sea lamprey abundances in the Great Lakes prior to broad implementation of sea lamprey control. J. Gt. Lakes Res. 47, S328–S334. doi: 10.1016/j.jglr.2021.04.002
Sard, N. M., Smith, S. R., Homola, J. J., Kanefsky, J., Bravener, G., Adams, J. V., et al. (2020). RAPTURE (RAD capture) panel facilitates analyses characterizing sea lamprey reproductive ecology and movement dynamics. Ecol. Evol. 10, 1469–1488. doi: 10.1002/ece3.6001
Schloesser, N. (2018). Correlating sea lamprey density with environmental DNA detections in the lab. Manag. Biol. Invasions 9, 483–495. doi: 10.3391/mbi.2018.9.4.11
Shetter, D. S. (1949). A brief history of the sea lamprey problem in michigan waters. Trans. Am. Fish. Soc. 76, 160–176. doi: 10.1577/1548-8659(1946)76[160:ABHOTS]2.0.CO;2
Siefkes, M. J. (2017). Use of physiological knowledge to control the invasive sea lamprey (Petromyzon marinus) in the Laurentian Great Lakes. Conserv. Physiol. 5:cox031. doi: 10.1093/conphys/cox031
Siefkes, M. J., Johnson, N. S., and Muir, A. M. (2021). A renewed philosophy about supplemental sea lamprey controls. J. Gt. Lakes Res. 47, S742–S752. doi: 10.1016/j.jglr.2021.03.013
Simpfendorfer, C. A., Huveneers, C., Steckenreuter, A., Tattersall, K., Hoenner, X., Harcourt, R., et al. (2015). Ghosts in the data: false detections in VEMCO pulse position modulation acoustic telemetry monitoring equipment. Anim. Biotelemetry 3, 1–10. doi: 10.1186/s40317-015-0094-z
Sorensen, P. W., and Vrieze, L. A. (2003). The chemical ecology and potential application of the sea lamprey migratory pheromone. J. Gt. Lakes Res. 29, 66–84. doi: 10.1016/S0380-1330(03)70478-X
Studer, M., and Ritschard, G. (2016). What matters in differences between life trajectories: a comparative review of sequence dissimilarity measures. J. R. Stat. Soc. Ser. A Stat. Soc. 179, 481–511. doi: 10.1111/rssa.12125
Sullivan, P., and Mullett, K. M. (2017). Sea Lamprey Control in the Great Lakes 2016. (Annual Report tothe Great Lakes Fishery Commission). Ontario, CA: GLFC Annual Meeting, Duluth, MN USA.
Sullivan, P., and Mullett, K. M. (2018). Sea Lamprey Control in the Great Lakes 2017. (Annual Report tothe Great Lakes Fishery Commission). Toronto: GLFC Annual Meeting.
Symbal, M. J., Neave, F. B., Jubar, A. K., Steeves, T. B., Nowicki, S. M., and Frank, R. J. (2021). Targeted lampricide treatment strategies for sea lamprey suppression in the Great Lakes: 2008–2018. J. Gt. Lakes Res. 47, S247–S258. doi: 10.1016/j.jglr.2021.09.003
U.S. Geological Survey (2021). National Water Information System data available on the World Wide Web (Water Data for the Nation). Available online at: http://waterdata.usgs.gov/nwis/ (Accessed September 29, 2021).
Walter, L. M., Dettmers, J. M., and Tyson, J. T. (2021). Considering aquatic connectivity trade-offs in Great Lakes barrier removal decisions. J. Gt. Lakes Res. 47, S430–S438. doi: 10.1016/j.jglr.2021.10.014
Weise, E. M., Scribner, K. T., Adams, J. V., Boeberitz, O., Jubar, A. K., Bravener, G., et al. (2022). Pedigree analysis and estimates of effective breeding size characterize sea lamprey reproductive biology. Evol. Appl. 15:484. doi: 10.1111/eva.13364
Weise, E. M., Scribner, K. T., Boeberitz, O., Bravener, G., Johnson, N. S., and Robinson, J. D. (2023). Evaluating the utility of effective breeding size estimates for monitoring sea lamprey spawning abundance. Ecol. Evol. 13:e10519. doi: 10.1002/ece3.10519
Wood, S. N. (2011). Fast stable restricted maximum likelihood and marginal likelihood estimation of semiparametric generalized linear models. J. R. Stat. Soc. Ser. B Stat. Methodol. 73, 3–36. doi: 10.1111/j.1467-9868.2010.00749.x
Zielinski, D. P., McLaughlin, R., Castro-Santos, T., Paudel, B., Hrodey, P., and Muir, A. (2019). Alternative sea lamprey barrier technologies: history as a control tool. Rev. Fish. Sci. Aquac. 27, 438–457. doi: 10.1080/23308249.2019.1625300
Keywords: Sea Lamprey, acoustic telemetry, spawning habitat, Great Lakes (North America), aquatic invasive species (AIS)
Citation: Lowe MR, Jubar AK, Barber JM, Hondorp DW and Holbrook CM (2025) Identifying novel Sea Lamprey (Petromyzon marinus) spawning areas in a large unimpounded river system. Front. Freshw. Sci. 3:1584751. doi: 10.3389/ffwsc.2025.1584751
Received: 27 February 2025; Accepted: 10 July 2025;
Published: 12 August 2025.
Edited by:
Cristina Coccia, Roma Tre University, ItalyReviewed by:
Christine Mayer, University of Toledo, United StatesToby Kock, United States Department of the Interior, United States
Copyright © 2025 Lowe, Jubar, Barber, Hondorp and Holbrook. This is an open-access article distributed under the terms of the Creative Commons Attribution License (CC BY). The use, distribution or reproduction in other forums is permitted, provided the original author(s) and the copyright owner(s) are credited and that the original publication in this journal is cited, in accordance with accepted academic practice. No use, distribution or reproduction is permitted which does not comply with these terms.
*Correspondence: Michael R. Lowe, bWxvd2VAdXNncy5nb3Y=