 Songbo Huang1,2
 Jinbo Zhang1 Ruiqiang Li1 Wenqian Zhang1 Zengquan He1 Tak-Wah Lam2
 Zhiyu Peng1*
 Siu-Ming Yiu2*
- 1 Bioinformatics Center, Beijing Genomics Institute at Shenzhen, Shenzhen, China
- 2 Department of Computer Science, The University of Hong Kong, Hong Kong, China
RNA-Seq, a method using next generation sequencing technologies to sequence the transcriptome, facilitates genome-wide analysis of splice junction sites. In this paper, we introduce SOAPsplice, a robust tool to detect splice junctions using RNA-Seq data without using any information of known splice junctions. SOAPsplice uses a novel two-step approach consisting of first identifying as many reasonable splice junction candidates as possible, and then, filtering the false positives with two effective filtering strategies. In both simulated and real datasets, SOAPsplice is able to detect many reliable splice junctions with low false positive rate. The improvement gained by SOAPsplice, when compared to other existing tools, becomes more obvious when the depth of sequencing is low. SOAPsplice is freely available at http://soap.genomics.org.cn/soapsplice.html.
Introduction
Alternative splicing (AS), which occurs as a universal phenomenon in eukaryotes, produces multiple mRNA transcripts from a single gene. As different mRNAs may be translated into different protein isoforms, AS greatly increases the diversity of proteins (Lareau et al., 2004; Stamm et al., 2005). Early studies of genome-wide identification of AS events were mainly based on EST (expressed sequence tag) libraries (Adams et al., 1993). However, analysis from human EST data confirms that the available EST data was insufficient for full detection of AS events (Johnson et al., 2003). Also, the availability of EST data for other species is very limited. With the emergence of next generation sequencing (NGS) technologies, RNA-Seq has been introduced as a tool for the study of AS in many species including human (Pan et al., 2008; Wang et al., 2008), mouse (Mortazavi et al., 2008), and Arabidopsis (Filichkin et al., 2010). Many novel AS events were detected using RNA-Seq data (Trapnell et al., 2010).
The first step for detecting AS events is splice junction detection. Previous methods for detecting junctions from RNA-Seq greatly rely on the annotation of gene structures (Cloonan et al., 2008; Marioni et al., 2008; Mortazavi et al., 2008; Sultan et al., 2008). In these cases, the performance of junction detection depends on the quality of gene annotation. Only until the last 2 years, tools like Q-PALMA (De Bona et al., 2008), TopHat (Trapnell et al., 2009), MapNext (Bao et al., 2009), Supersplat (Bryant et al., 2010), SpliceMap (Au et al., 2010), and MapSplice (Wang et al., 2010), for ab initio junction detection, have become available. Q-PALMA is based on a machine learning approach, in which data from previously known splice junctions are used to train the software. Thus, the tool is biased on the splice junctions that are similar to the training data (Trapnell et al., 2009). The other tools do not rely on training data, making them be able to detect novel splice junctions. These tools all follow the approach of first mapping the reads to a reference genome, and then based on the mapping results, try to predict the splice junctions. They differ in how the mapping is performed, what mapping results are used, and what criteria are used to deduce the locations of splice junctions. In this paper, we address the same problem as these tools.
TopHat maps the reads to the reference using Bowtie (Langmead et al., 2009), and then clusters all the “intact” reads (i.e., the reads that can be completely mapped to the reference without being split into parts). Each cluster represents a putative exon region, splice junctions are then searched within the neighboring (but not necessarily adjacent) exon regions with initially unmapped reads (IUM reads). TopHat however may fail to detect junctions for a variety of reasons. In particular, when the transcript is located at a region with a low sequencing depth, there might not be enough reads that straddles the junction for ease detection (Trapnell et al., 2009).
The other four tools mentioned above try to align all the IUM reads to the reference genome directly. Both Supersplat and MapNext use their own alignment approaches based on hashing. MapNext creates a hashing table of reads while Supersplat creates two hashing tables on both reads and the reference. Hashing table has the problem of size as the length of reads gets longer; on the other hand, if they keep the hash tables small even for long reads, the mapping is not straight forward. Hence, both tools work well for reads with short length, say 36 nt, but are not scalable for reads longer than 50 nucleotides which require a large amount of computational power and memory.
SpliceMap uses existing short-read alignment tools such as SeqMap (Jiang and Wong, 2008) and ELAND to map half of each read at a time, and then extends to the other half nucleotide by nucleotide until it cannot be further extended. The remaining part of the read, if long enough, is used to find junction with the same criteria. Paired-end information of reads is used to filter out false positives. This mapping and extension approach is not an effective way to handle reads with sequencing errors, thus decreasing the call rate especially when the expression level is low. Also, SpliceMap does not have a good way to deal with the reads that can be mapped to multiple locations. They simply ignore the hits that are too close together.
Instead of cutting reads into two halves, MapSplice partitions a read into non-overlapping segments with length k (where k is usually 20–25 nucleotides). Each segment is then aligned to the reference. Segments that can be fully mapped to the reference (intact segments) are used to guide the alignment of initially unmapped segments (IUM segments). MapSplice requires all segments of each read including both intact and IUM segments, to be aligned and connected in order to confirm the junctions. This requirement may be too stringent for long reads and the call rate will be greatly reduced when the sequencing depth is low. When the read is short, it is likely that these segments can be aligned to multiple regions of the genome, increasing the rate of false positives. On the other hand, they do take into account the quality value of the read to determine the best alignment for the segments.
We developed a novel tool, named SOAPsplice, to identify splice junctions from RNA-Seq data with different read lengths and sequencing depths. The principle of SOAPsplice consists of two parts: first, aligned reads from intact alignment as well as spliced alignment contribute to report as many reasonable splice junction candidates as possible, and then two effective filtering strategies filter out the most reliable results. We have assessed SOAPsplice on both simulated and real datasets which demonstrates the efficiency of the two-step detection approach. The comparative analysis among SOAPsplice, TopHat, SpliceMap, and MapSplice shows that SOAPsplice outperforms other tools in detecting a similar amount or even more canonical splice junctions while having the lowest rate of false positives. The improvement is particularly significant, when the sequencing depth is low. Thus it can be very useful in detecting junctions located in low abundance genes.
Materials and Methods
Alignment Strategy
The overall workflow of SOAPsplice is shown in Figure 1. SOAPsplice uses the Burrows Wheeler transformation (BWT) to index the reference sequence in the main memory (Lam et al., 2008). To detect junctions, SOAPsplice first performs an “intact” alignment step by mapping complete reads to the reference genome, and then, initially unmapped reads (IUM reads) are mapped with the spliced alignment algorithm.
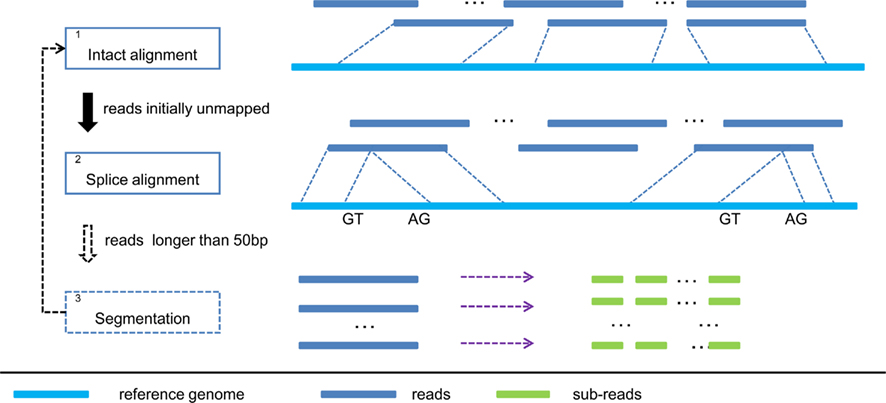
Figure 1. Pipeline of SOAPsplice. In step 1, SOAPsplice maps complete reads to the reference genome using BWT index. Then in step 2, SOAPsplice aligns IUM reads to the reference genome by using two-segment alignment strategy. Step 3 is applied for reads that are longer than 50 bp, and in this step, SOAPsplice first splits the remaining unmapped reads into sub-reads (no more than 50 bp) and then applies step 1 and step 2 to these sub-reads.
In the “intact” alignment step (Step 1 in Figure 1), SOAPsplice allows at most three mismatches or one continuous gap (≤2 bp) in the read. The gap could be either insertion or deletion in the query or the reference sequence. As the occurrence of single nucleotide polymorphism is much more frequent than the occurrence of small indels between two haplotypes (Li et al., 2008a), ungapped hits are given the precedence over gapped hits. Similar to SOAP2 (Li et al., 2009), SOAPsplice selects the best hit of each read which has the lowest number of mismatches or the smallest number of indels. Due to the limitation of sequencing technologies, reads always exhibit higher number of sequencing errors at the 3′ end (Hillier et al., 2008), which may occasionally make the reads unalienable to the reference. To deal with these reads, SOAPsplice trims several base pairs (≤7 bp) at the 3′ end and repeats the intact alignment step for the remaining part of the unaligned reads. If the “intact” alignment step fails again, these reads are then regarded as IUM reads.
In the spliced alignment step (Step 2 in Figure 1), SOAPsplice divides the IUM reads into two segments, which are expected to be derived from different exons in the premature mRNA. SOAPsplice first finds the longest 5′ end segment of an IUM read that could be mapped to the reference, then aligns the remaining segment to the reference. All the following criteria should be met:
(1) Each segment should be longer than a threshold (default: 8 bp);
(2) No more than one mismatch and no gapped alignment are allowed in the alignment of each segment;
(3) Distance of two segments, which is equal to the size of an intron, is expected to range from 50 to 50,000 bp, since this range covers the majority of known intron size in eukaryote (Trapnell et al., 2009);
(4) The boundary of an intron should be of the form “GT-AG,” “GC-AG,” or “AT-AC.” When spliced alignment produces multiple hits, splice junction candidate with “GT-AG” boundary is given the highest priority, followed by candidates with “GC-AG” and “AT-AC” boundaries (Burset et al., 2000);
(5) When the segments have multiple hits to the reference, only cases where one segment has a unique hit while the other has multiple hits, or each segment has at most three hits are considered. The closest pair of hit is reported for this read. SOAPsplice ignores the other cases for it is difficult to predict which pair of hits is correct.
The above steps are able to detect at most one junction. As the reads may span more than two exons, we applied an additional step to detect junctions with reads longer than 50 bp (Step 3 in Figure 1). If the read is shorter than 100 bp, SOAPsplice splits the read into two segments of equal size; otherwise, SOAPsplice splits the read into multiple segments of 50 nucleotides from the 5′ end until the remaining segment is of length between 50 and 100 nucleotides. SOAPsplice then splits this remaining part into two segments equally so that the segment in the 3′ end is not too short. After that, SOAPsplice considers each segment as a sub-read, and treats it with “intact” alignment step or spliced alignment step if “intact” alignment fails. Finally SOAPsplice checks and concatenates the separated alignment hits for sub-reads to build the alignment for the original read. SOAPsplice requires that at least two-thirds of the sub-reads should be aligned uniquely.
Filtering Strategy
Two main strategies are used to filter out false positives. Then SOAPsplice will output the most confidential junctions and corresponding information of junction sites, strand, and number of supporting reads.
The first strategy is to ensure that aligned positions of mate-pair reads follow their pair-end relationship. In this case, the mapping directions on the reference sequence of two paired-end reads should be consistent with the experimental design. For example, if one read is mapped in the forward direction (from 5′ end to 3′ end) on the genomic sequence, its mate read is required to be mapped in the reverse direction (from 3′ end to 5′ end).
The second strategy is applied to the second type of junctions reported by long reads (longer than 50 bp) below. Based on the spliced alignment results, we divide the reported junctions into two types:
(1) The first type includes the junctions reported by the spliced alignment of reads without segmentation (e.g., the spliced alignment of read A in Figure 2), and the junctions reported from segmented reads with all their sub-reads mapped compatibly back to the genomic sequence (e.g., the spliced alignment of read B in Figure 2). We consider that this type of junction is of high reliability, and therefore these junctions are reported without filtration.
(2) The second type includes the remaining junctions detected (e.g., the spliced alignment of read C in Figure 2), of which sub-reads are mapped incompatibly back to the genomic sequence. Since their mapping locations do not connect with each other at the same segmentation point (e.g., location 1 and 2 are not connective in Figure 2), it is hard to distinguish which spliced alignment is correct. In order to improve the accuracy of this type of reported junctions, we require that the number of junction reads supporting the second type of junctions in multiple segments should be more than a given threshold. We empirically set this threshold be 25% of the average number of junction reads supporting the first type of junctions.
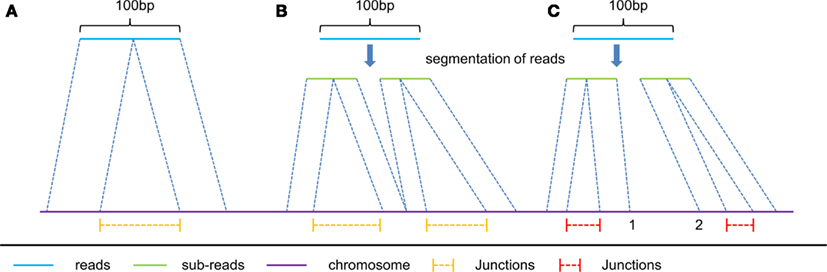
Figure 2. Three typical kinds of spliced alignment with read length of 100 bp. read (A) represents spliced alignment without segmentation of reads. This alignment can only report one junction from a single read due to the two-segment algorithm in spliced alignment. read (B) is applied only to reads longer than 50 bp, and predicts multiply junctions from a single long read with all its mapped sub-reads connecting with each other, at the same segmentation point on the reference. Unlike read (B), read (C) has its mapped sub-reads not connecting with each other at the same segmentation points on the reference. Consequently, yellow color junctions are more reliable than the red color ones.
Results and Discussions
As mentioned above, both Supersplat and MapNext are not scalable for long reads. When tested with a dataset of 40,000 reads of length 50 bp (see Simulated Datasets for how these reads are generated) and using human chromosome 10 of length 138 Mb as the reference, Supersplat requires 18 GB, while MapNext requires 32 GB of memory. On the other hand, Q-PALMA is very time consuming and might not be practical for large mammalian projects (Trapnell et al., 2009). Thus, we only compared SOAPsplice with TopHat 1.0.11, SpliceMap 3.3.5.1 and MapSplice 1.14.1 in this study. In order to maintain maximum consistency in comparison, we used default parameters as much as possible for all tools and set the maximum errors allowed for mapping as described below. For SOAPsplice, “intact” alignment was set to allow at most three mismatches, for IUM reads, each segment allows at most one mismatch. For TopHat, we set at most one mismatch for each segment alignment. For SpliceMap, similar to SOAPsplice, at most three mismatches for “intact” alignment and at most one mismatch for each segment in IUM reads. For MapSplice, k = 25 and at most one mismatch for each segment alignment.
Simulated Datasets
We obtained a total of 1,296 RefSeq (Pruitt et al., 2007) transcripts (longer than 200 bp) of the human chromosome 10. These transcripts contain a total of 8,266 junctions. Using these transcripts, we generated four sets of simulated reads (with read length = 50, 75, 100, and 150 bp respectively). For each read length, we generated reads at 1, 5, 10, 20, and 50-fold sequencing depths using the short-read simulator from MAQ (Li et al., 2008b).
Figure 3A shows the junction detection results for 50 bp reads. Both SOAPsplice and MapSplice have the highest call rates at all depths of coverage, which become more prominent with the depth lower than 10×; however, the false positive rates of MapSplice are higher than that of SOAPsplice at all depths of coverage and the difference becomes more significant as the sequencing depth increases. For example, when the sequencing depth is more than 10×, MapSplice has higher false positive rates than SOAPsplice as well as other two tools; in the case of depth 50×, the false positive rate of MapSplice is 5.41 times that of SOAPsplice (Figure 3A; Table A1 in Appendix). Therefore, MapSplice generates the highest call rate, but tends to have higher false positive rate. Thus, SOAPsplice performs the best with high call rate and low false positive rate.
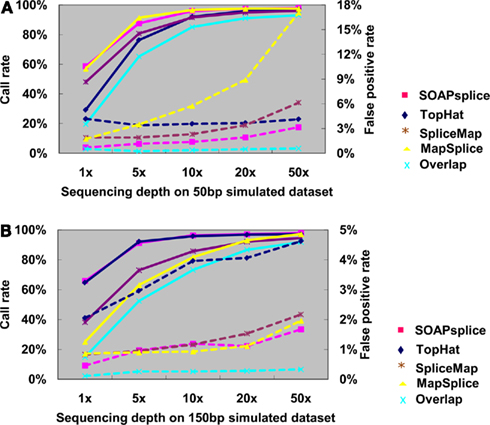
Figure 3. Comparison of four tools for junction predictions on 50 and 150 bp simulated reads. For 50 bp reads in (A) and 150 bp reads in (B), the points connected by full lines stand for the call rate at certain sequencing depth, and the points connected by dashed lines stand for the false positive rate. Call rate is equal to the number of true positives divided by the total number of junctions. False positive rate is calculated by dividing the number of false positives by the total number of detected junctions. Overlap represents the number of common junctions reported by all four tools.
For the 150-bp dataset, Figure 3B shows that both SOAPsplice and TopHat have the highest call rates at all sequencing depths, and are able to detect more true junctions than the other two tools at sequencing depths lower than 20×; however, TopHat predicts significantly more false positive junctions than SOAPsplice. The false positive rate of TopHat is at least 2.77 times more than that of SOAPsplice at all the sequencing depths (Table A2 in Appendix). These results indicate that TopHat seems to have higher call rate at the expense of higher false positive rate; in contrast, SOAPsplice can achieve high call rate but keep the same level of false positive rates as SpliceMap and MapSplice. Therefore, SOAPSplice performs better than the other three tools on 150 bp simulated reads. A similar conclusion can be arrived for on the cases of 75 and 100 bp simulated reads (Figure A1 in Appendix; Tables A3 and A4 in Appendix).
In general, when the sequencing depth increases, all tools in this study can predict more true junctions, but at the same time report more false positives. As shown in Figure 3, when the depth is as high as 50×, the call rates from all tools are approximately the same, however, SOAPsplice is able to predict more or less the same number of true junctions while having lower false positive rates in all cases. More importantly, when the sequencing depth is as low as 1×, SOAPsplice outperforms all other tools by predicting more true junctions and keeping the lowest false positive rate. As new junctions detected by RNA-Seq are usually located in low abundance genes (Wang et al., 2008), SOAPsplice was predicted to be more useful detecting novel junctions in real data analysis.
Furthermore, we investigated the number of common junctions that are reported by all four tools (“Overlap” with cyan color in Figure 3). When tested on the 50-bp dataset at depth 1×, TopHat has the lowest call rate of 29.24% (Figure 3A; Table A1 in Appendix) and the other three tools have call rates of more than 48% (Figure 3A; Table A1 in Appendix); only about 19.60% (Figure 3A; Table A1 in Appendix) of the true positive junctions are found by the all tools. Although the number of junctions found by all the tools increases when the sequencing depth increases, the overlapping call rate is still a little bit lower than the lowest call rate among the four tools, for example, with 50 bp reads at 50×, the overlapping call rate is 93.02% (Figure 3A; Table A1 in Appendix) and the lowest call rate among all tools is 95.96% (Figure 3A; Table A1 in Appendix). These results indicate that there are still some junctions missed by one tool but detected by others. On the other hand, more than half of the false positives detected by one tool can be removed by making effective use of the advantages of the other algorithms. Hence, it may be possible to improve the performance of our tool by studying the missed junctions and the algorithms of other tools in details.
Real Datasets
We also compared the four tools using two real datasets based on human genome reference sequence (NCBI build 36.1/hg18). These datasets include 14,311,384 pairs of 51 bp reads with accession number GSM506410 in the GEO database and 18,584,414 pairs of 130 bp reads with accession number GSM563061 in the GEO database. The mRNA/EST datasets from NCBI were used to validate the junction predictions.
For the 51-bp dataset, there are three important observations (Table 1). First, SOAPsplice detects more known junctions (reported in RefSeq) and novel junctions than TopHat. Second, SOAPsplice predicts roughly the same number of both known junctions and novel junctions as SpliceMap. Third, SOAPsplice predicts roughly the same number of known junctions (61,987) as MapSplice (68,396), while predicting significantly fewer novel junctions (7,929) than MapSplice (29,733). To determine the accuracy of predicted junctions, we analyzed the overlaps of junctions detected by different tools. In Figure 4A, the percentages of known junctions reported by more than one tool are similar (SOAPsplice: 97.18%, TopHat: 97.29%, SpliceMap: 97.88%, MapSplice: 94.09%), however, it is different for novel junctions (Figure 4B) because MapSplice has significantly lower percentage (23.69%) than other three tools (SOAPsplice: 82.39%, TopHat: 70.94%, SpliceMap: 83.50%). Moreover, EST validation results (Table 1) show that MapSplice has the smallest validation ratios of both the total number of junctions and the number of novel junctions. Hence, based on the above analysis, we have less confidence on the predicted junctions reported by MapSplice than those by the other three tools. Besides, with similar percentages of overlapped junctions, both SOAPsplice and SpliceMap detect more junctions than TopHat. Hence, SOAPsplice and SpliceMap have roughly the same performance on this dataset.
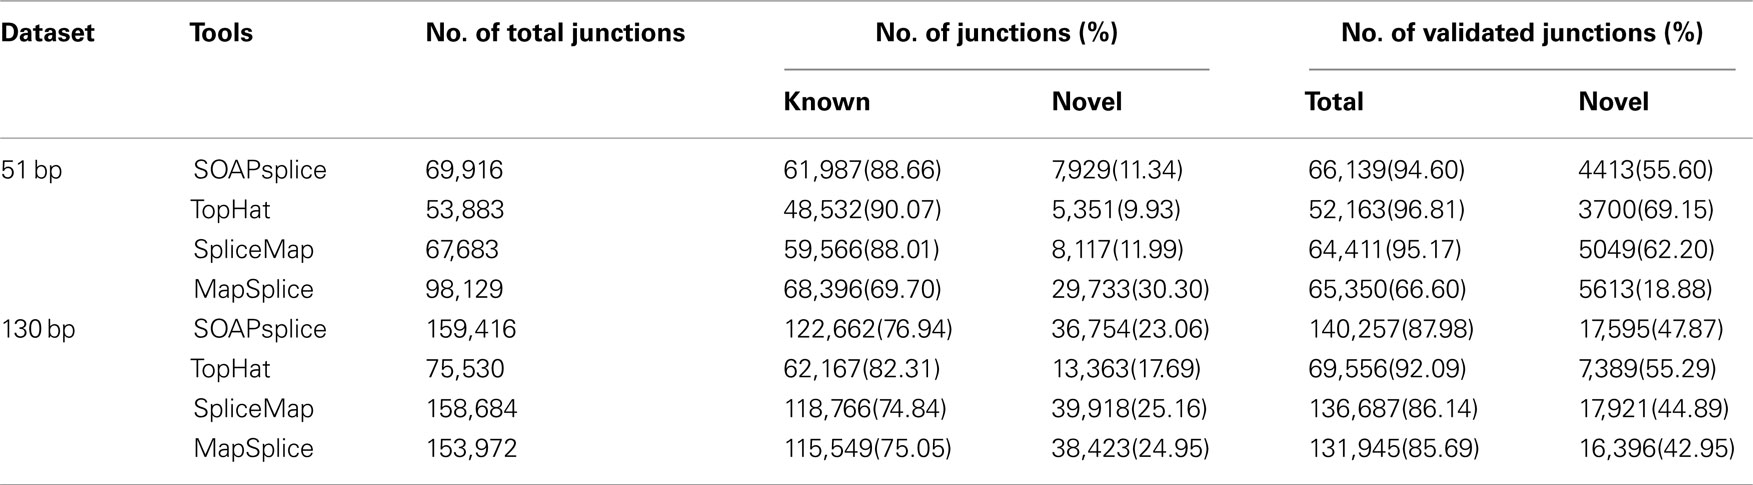
Table 1. Number of junctions detected on the real datasets.
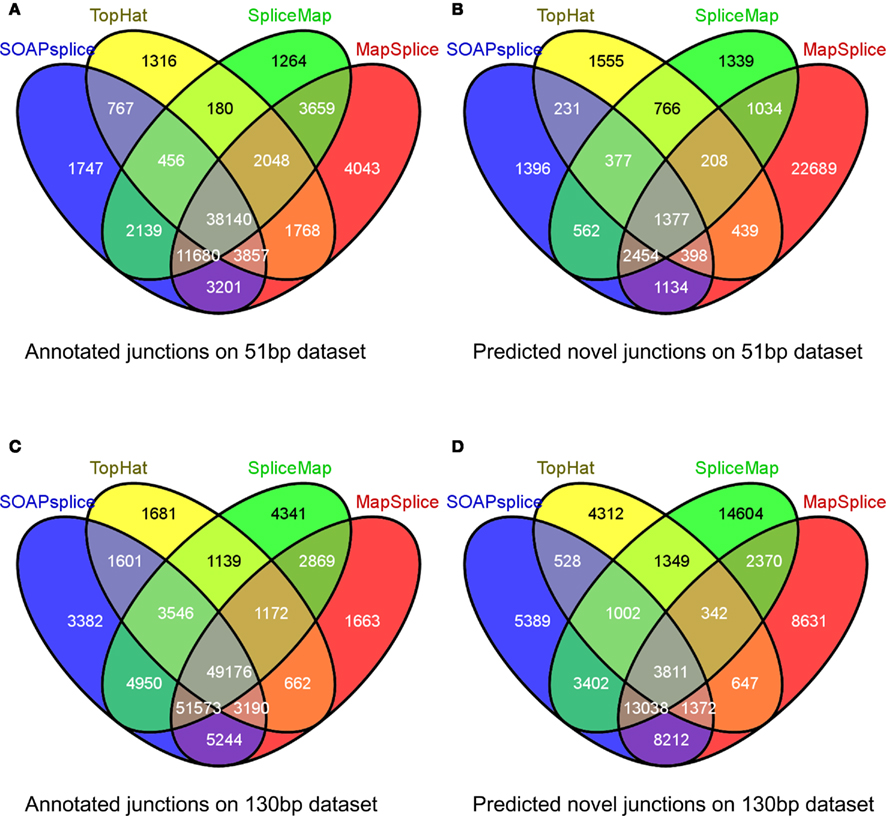
Figure 4. Overlap of reported junctions for real dataset. Junctions identified by tools are classified as annotated junctions and predicted novel junctions. Annotated junctions are the ones that can be found in RefSeq annotation and the remaining junctions are defined as predicted novel junctions. Numbers in different regions of Venn diagrams describe junctions found by one or more than one tools. Venn diagram (A) and Venn diagram (B) represent the results of 51 bp real dataset while Venn diagram (C) and Venn diagram (D) represent the results of 130 bp real dataset.
For the 130-bp dataset, there are two observations. First, SOAPsplice reports more known junctions than the other three tools (Table 1) and 97.24% of SOAPsplice’s known junctions are reported by more than one tool (Figure 4C). This percentage is close to those of three other tools (TopHat: 97.30%, SpliceMap: 96.34%, SpliceMap: 98.56%) in Figure 4C. Second, SOAPsplice reports fewer novel junctions than both SpliceMap and MapSplice (Table 1). However, 85.34% of SOAPsplice’s novel junctions are reported by more than one tool (Figure 4D). This percentage is dramatically higher than those of three other tools (TopHat: 67.73%, SpliceMap: 63.42%, MapSplice: 77.54%; Figure 4D). Moreover, EST validation tests also verify that more junctions are validated in SOAPsplice than in other three tools (Table 1). To conclude, these results suggest that SOAPsplice can detect more correct junctions than other tools with higher specificity.
We also compared the running time and main memory consumption for the four tools. Table 2 shows the comparative results on two real datasets. For the 51-bp dataset, SOAPsplice runs faster than both SpliceMap and MapSplice, but slightly slower than TopHat; for the 130-bp dataset, SOAPsplice runs the slowest among four tools, which is most likely due to the special segmentation strategy for long reads applied in SOAPsplice. This strategy can improve the accuracy of results but requires longer running time. In general, as expected, when read length increases, all tools except MapSplice require more running time. With respect to main memory consumption, SOAPsplice requires the largest amount of memory among the four tools. Thus, to further optimize SOAPsplice to make it run faster with less memory would be one of the future directions.
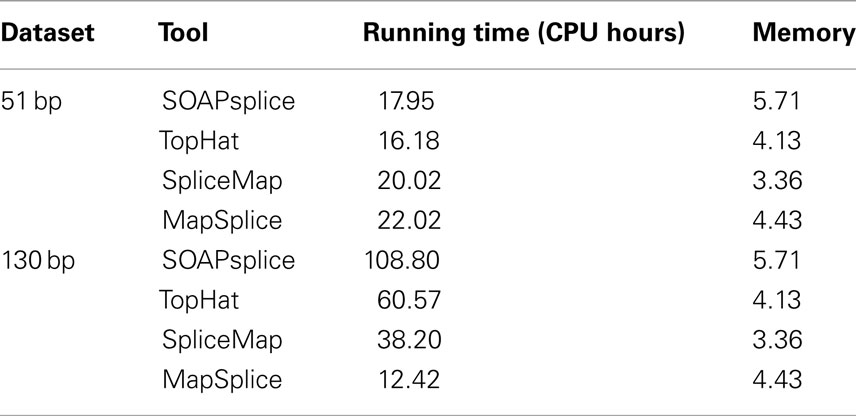
Table 2. Running time and main memory consumption for the 51 and 130-bp real datasets.
Conclusions
SOAPsplice is an effective tool for detecting not only known splice junctions but also novel ones. The novel junctions may provide valuable information for detecting novel AS events. When compared to other existing tools (TopHat, SpliceMap, and MapSplice), SOAPsplice exhibits better performance under different read lengths and sequencing depths, and this advantage is more significant when applied to the case of low sequencing depth (e.g., 1×). We also noted that a new tool, called HMMSplice (Dimon et al., 2010), was just released. A detailed comparison of this tool and SOAPsplice will be carried out as soon as possible. Our study shows that there are quite a number of junctions that can be found by one tool but not by the others, suggesting that there should be room for further improvement of the SOAPsplice algorithm.
Conflict of Interest Statement
The authors declare that the research was conducted in the absence of any commercial or financial relationships that could be construed as a potential conflict of interest.
Acknowledgments
We gratefully thank Dr. Jorge Cesar Andrade Ortíz from BGI for his invaluable assistance in revising the manuscript. We also thank the three anonymous reviewers for their helpful and constructive comments.
References
Adams, M. D., Kerlavage, A. R., Fields, C., and Venter, J. C. (1993). 3,400 new expressed sequence tags identify diversity of transcripts in human brain. Nat. Genet. 4, 256–267.
Au, K. F., Jiang, H., Lin, L., Xing, Y., and Wong, W. H. (2010). Detection of splice junctions from paired-end RNA-seq data by SpliceMap. Nucleic Acids Res. 38, 4570–4578.
Bao, H., Xiong, Y., Guo, H., Zhou, R., Lu, X., Yang, Z., Zhong, Y., and Shi, S. (2009). MapNext: a software tool for spliced and unspliced alignments and SNP detection of short sequence reads. BMC Genomics 10(Suppl. 3), S13. doi: 10.1186/1471-2164-10-S3-S13
Bryant, D. W., Shen, R., Priest, H. D., Wong, W. K., and Mockler, T. C. (2010). Supersplat-spliced RNA-seq alignment. Bioinformatics 26, 1500–1505.
Burset, M., Seledtsov, I. A., and Solovyev, V. V. (2000). Analysis of canonical and non-canonical splice sites in mammalian genomes. Nucleic Acids Res. 28, 4364–4375.
Cloonan, N., Forrest, A. R., Kolle, G., Gardiner, B. B., Faulkner, G. J., Brown, M. K., Taylor, D. F., Steptoe, A. L., Wani, S., Bethel, G., Robertson, A. J., Perkins, A. C., Bruce, S. J., Lee, C. C., Ranade, S. S., Peckham, H. E., Manning, J. M., McKernan, K. J., and Grimmond, S. M. (2008). Stem cell transcriptome profiling via massive-scale mRNA sequencing. Nat. Methods 5, 613–619.
De Bona, F., Ossowski, S., Schneeberger, K., and Ratsch, G. (2008). Optimal spliced alignments of short sequence reads. Bioinformatics 24, i174–i180.
Dimon, M. T., Sorber, K., and DeRisi, J. L. (2010). HMMSplicer: a tool for efficient and sensitive discovery of known and novel splice junctions in RNA-Seq data. PLoS ONE 5, e13875. doi:10.1371/journal.pone.0013875
Filichkin, S. A., Priest, H. D., Givan, S. A., Shen, R., Bryant, D. W., Fox, S. E., Wong, W. K., and Mockler, T. C. (2010). Genome-wide mapping of alternative splicing in Arabidopsis thaliana. Genome Res. 20, 45–58.
Hillier, L. W., Marth, G. T., Quinlan, A. R., Dooling, D., Fewell, G., Barnett, D., Fox, P., Glasscock, J. I., Hickenbotham, M., Huang, W., Magrini, V. J., Richt, R. J., Sander, S. N., Stewart, D. A., Stromberg, M., Tsung, E. F., Wylie, T., Schedl, T., Wilson, R. K., and Mardis, E. R. (2008). Whole-genome sequencing and variant discovery in C. elegans. Nat. Methods 5, 183–188.
Jiang, H., and Wong, W. H. (2008). SeqMap: mapping massive amount of oligonucleotides to the genome. Bioinformatics 24, 2395–2396.
Johnson, J. M., Castle, J., Garrett-Engele, P., Kan, Z., Loerch, P. M., Armour, C. D., Santos, R., Schadt, E. E., Stoughton, R., and Shoemaker, D. D. (2003). Genome-wide survey of human alternative pre-mRNA splicing with exon junction microarrays. Science 302, 2141–2144.
Lam, T. W., Sung, W. K., Tam, S. L., Wong, C. K., and Yiu, S. M. (2008). Compressed indexing and local alignment of DNA. Bioinformatics 24, 791–797.
Langmead, B., Trapnell, C., Pop, M., and Salzberg, S. L. (2009). Ultrafast and memory-efficient alignment of short DNA sequences to the human genome. Genome Biol. 10, R25.
Lareau, L. F., Green, R. E., Bhatnagar, R. S., and Brenner, S. E. (2004). The evolving roles of alternative splicing. Curr. Opin. Struct. Biol. 14, 273–282.
Li, R., Li, Y., Kristiansen, K., and Wang, J. (2008a). SOAP: short oligonucleotide alignment program. Bioinformatics 24, 713–714.
Li, H., Ruan, J., and Durbin, R. (2008b). Mapping short DNA sequencing reads and calling variants using mapping quality scores. Genome Res. 18, 1851–1858.
Li, R., Yu, C., Li, Y., Lam, T. W., Yiu, S. M., Kristiansen, K., and Wang, J. (2009). SOAP2: an improved ultrafast tool for short read alignment. Bioinformatics 25, 1966–1967.
Marioni, J. C., Mason, C. E., Mane, S. M., Stephens, M., and Gilad, Y. (2008). RNA-Seq: an assessment of technical reproducibility and comparison with gene expression arrays. Genome Res. 18, 1509–1517.
Mortazavi, A., Williams, B. A., McCue, K., Schaeffer, L., and Wold, B. (2008). Mapping and quantifying mammalian transcriptomes by RNA-Seq. Nat. Methods 5, 621–628.
Pan, Q., Shai, O., Lee, L. J., Frey, B. J., and Blencowe, B. J. (2008). Deep surveying of alternative splicing complexity in the human transcriptome by high-throughput sequencing. Nat. Genet. 40, 1413–1415.
Pruitt, K. D., Tatusova, T., and Maglott, D. R. (2007). NCBI reference sequences (RefSeq): a curated non-redundant sequence database of genomes, transcripts and proteins. Nucleic Acids Res. 35, D61–D65.
Stamm, S., Ben-Ari, S., Rafalska, I., Tang, Y., Zhang, Z., Toiber, D., Thanaraj, T. A., and Soreq, H. (2005). Function of alternative splicing. Gene 344, 1–20.
Sultan, M., Schulz, M. H., Richard, H., Magen, A., Klingenhoff, A., Scherf, M., Seifert, M., Borodina, T., Soldatov, A., Parkhomchuk, D., Schmidt, D., O’Keeffe, S., Haas, S., Vingron, M., Lehrach, H., and Yaspo, M. L. (2008). A global view of gene activity and alternative splicing by deep sequencing of the human transcriptome. Science 321, 956–960.
Trapnell, C., Pachter, L., and Salzberg, S. L. (2009). TopHat: discovering splice junctions with RNA-Seq. Bioinformatics 25, 1105–1111.
Trapnell, C., Williams, B. A., Pertea, G., Mortazavi, A., Kwan, G., van Baren, M. J., Salzberg, S. L., Wold, B. J., and Pachter, L. (2010). Transcript assembly and quantification by RNA-Seq reveals unannotated transcripts and isoform switching during cell differentiation. Nat. Biotechnol. 28, 511–515.
Wang, E. T., Sandberg, R., Luo, S., Khrebtukova, I., Zhang, L., Mayr, C., Kingsmore, S. F., Schroth, G. P., and Burge, C. B. (2008). Alternative isoform regulation in human tissue transcriptomes. Nature 456, 470–476.
Keywords: RNA-Seq, splice junction, spliced alignment
Citation: Huang S, Zhang J, Li R, Zhang W, He Z, Lam T-W, Peng Z and Yiu S-M (2011) SOAPsplice: genome-wide ab initio detection of splice junctions from RNA-Seq data. Front. Gene. 2:46. doi: 10.3389/fgene.2011.00046
Received: 18 March 2011;
Accepted: 26 June 2011;
Published online: 07 July 2011.
Edited by:
Paul T. Spellman, Oregon Health and Sciences University, USAReviewed by:
Bertrand Tan, Chang Gung University, TaiwanXiyin Wang, Hebei United University, China
Obi Lee Griffith, Lawrence Berkeley National Laboratory, USA
Copyright: © 2011 Huang, Zhang, Li, Zhang, He, Lam, Peng and Yiu. This is an open-access article subject to a non-exclusive license between the authors and Frontiers Media SA, which permits use, distribution and reproduction in other forums, provided the original authors and source are credited and other Frontiers conditions are complied with.
*Correspondence: Zhiyu Peng, Beijing Genomics Institute at Shenzhen, Shenzhen 518083, China. e-mail:cGVuZ2JnaUBnbWFpbC5jb20=; Siu-Ming Yiu, Department of Computer Science, The University of Hong Kong, Hong Kong, China. e-mail:c215aXVAY3MuaGt1Lmhr