

 Alexander V. Favorov1,2,3
- 1 Division of Oncology Biostatistics and Bioinformatics, Department of Oncology, Sidney Kimmel Comprehensive Cancer Center, Johns Hopkins University, Baltimore, MD, USA
- 2 Scientific Center of RF GosNIIGenetika, Moscow, Russia
- 3 Vavilov Institute of General Genetics of RAS, Moscow, Russia
- 4 Department of Health Science Informatics, School of Medicine, Johns Hopkins University, Baltimore, MD, USA
Modeling of signal driven transcriptional reprogramming is critical for understanding of organism development, human disease, and cell biology. Many current modeling techniques discount key features of the biological sub-systems when modeling multiscale, organism-level processes. We present a mechanistic hybrid model, GESSA, which integrates a novel pooled probabilistic Boolean network model of cell signaling and a stochastic simulation of transcription and translation responding to a diffusion model of extracellular signals. We apply the model to simulate the well studied cell fate decision process of the vulval precursor cells (VPCs) in C. elegans, using experimentally derived rate constants wherever possible and shared parameters to avoid overfitting. We demonstrate that GESSA recovers (1) the effects of varying scaffold protein concentration on signal strength, (2) amplification of signals in expression, (3) the relative external ligand concentration in a known geometry, and (4) feedback in biochemical networks. We demonstrate that setting model parameters based on wild-type and LIN-12 loss-of-function mutants in C. elegans leads to correct prediction of a wide variety of mutants including partial penetrance of phenotypes. Moreover, the model is relatively insensitive to parameters, retaining the wild-type phenotype for a wide range of cell signaling rate parameters.
1. Introduction
Cell signaling plays a critical role in organism development and in human disease. Signaling proteins form networks that enable complex, context-dependent responses to external and internal stimuli. Successful mechanistic modeling of cell signaling and its effects on gene expression can provide testable hypotheses leading to novel biological discoveries. Although qualitative descriptions of the phenotypic decisions resulting from cell signaling have been achieved with rule-based models (Fisher et al., 2007; Sadot et al., 2008), quantitative predictions of novel system outcomes requires quantitative organism-level models. An ideal model would quantitatively evolve all cell signaling proteins, chemical fluxes, extracellular signaling molecules, transcriptional, and translational behavior, and cellular morphology or other phenotypic indicators.
Current quantitative models can simulate reactions between a limited number of protein and chemical species in the biochemical processes of an organism. Predictions are generally made with ordinary differential equation models of biochemical processes, often solved with variations of Gillespie’s stochastic simulation algorithm (SSA; Gillespie, 1976) to account for the stochastic nature of these processes. When rate constants, binding constants, and concentrations are available, differential equation-based models have successfully simulated the temporal processes in several model organisms, including notably (Shea and Ackers, 1985; McAdams and Arkin, 1997; Arkin et al., 1998; Novak and Tyson, 2004; Meier-Schellersheim et al., 2006; Mayer et al., 2009; Kierzek et al., 2010). However, differential equation-based models are often computationally intractable when scaled to the organism-level because of the inherent stiffness arising from coupling fast cell signaling processes to the slower transcription and translation machinery. Moreover, many of the large number of parameters required to simulate all of the reactions in the organism-level system are unmeasurable in vivo. As an alternative to differential equation-based models, graphical models can abstract biochemical reactions to reduce the number of parameters required for coarse-scale modeling (Kim et al., 2002). These simulations typically represent biochemical reactions using graphical models that generalize species as nodes and interactions as edges. For example, Boolean networks have nodes with only two states that switch between on and off. As such, they can provide a useful abstraction for cell signaling networks, where protein interactions drive signal propagation through connected pathways by activating and deactivating proteins. Probabilistic Boolean Networks (PBNs) retain the binary nature of the nodes (i.e., protein activity), while introducing stochastic transitions, more accurately simulating biological systems (Shmulevich et al., 2002). However, these network-based models often cannot account for feedback loops in biochemical networks or simulate a process like gene expression, which involves a series of biochemical steps creating continuous levels of products.
In this paper, we consider a hybrid model, GESSA (Graphically Extended Stochastic Simulation Algorithm), that links a novel, network model of cell signaling, the Pooled Probabilistic Boolean Network (PPBN), to a differential equation-based model of transcription and translation solved with SSA. Simulating transcription and translation with SSA allows GESSA to model the stochastic but continuous and relatively long timescale creation of transcripts and proteins by small numbers of molecules (Gillespie, 1976). Moreover, abstracting the relatively fast signaling reactions with the network-based PPBN model avoids the prohibitive computational cost and intermediate parameters that would be required when using SSA to simultaneously model fast signaling reactions and slow transcription and translation events. Integrating these modeling techniques enables GESSA to efficiently model diverse, multicellular biochemical processes at the appropriate timescales with the appropriate mechanism.
The fate decision in development of C. elegans vulval precursor cells (VPCs) provides an optimal experimental system for developing multicellular models, such as GESSA. In this system, signaling pathways and transcriptional activity have been established from numerous experimental studies reviewed in Sternberg (2005). We summarize these processes in Figure 1. The formation of the vulva in C. elegans is initiated during the L3 larval stage. Entering L3, there are 12 equivalent VPCs, labeled P1.p to P12.p, and these undergo four fates in wild-type worms. Three of these fates involve the six central cells P3.p to P8.p, and are referred to as primary (1°, forming the vulva terminus), secondary (2°, forming the invagination), and tertiary (3°, fusing into the epidermal syncytium) fates. We note that every VPC is capable of adopting each of these fates under the appropriate signaling conditions, suggesting equivalent molecular composition of the VPCs at L3. In VPC development, signaling is initiated when LIN-3, the EGF homolog, is produced by the Anchor Cell (Figure 1). LIN-3 diffuses, reaches P6.p and activates LET-23 EGFR homolog; (Sundaram, 2006). This leads to activation of the LIN-31 transcription factor (TF) through the MAPK cascade, resulting after production of the LIN-39 TF, and then the generation of LAG-2, a member of the “DSL” family of ligands (Greenwald, 2005). The LAG-2 ligand activates the Notch pathway in neighboring cells, creating a repressor that antagonizes the signal from the RAS pathway, leading to the 2° fate in these neighboring cells, P5.p and P7.p. The development of the vulva, including vulvaless (Vul) and multivulva (Muv) phenotypes, results from the balance between these pathways, with stochastic effects leading to partial penetrance of the phenotype in a population of worms with mutant proteins (see Figure 1).
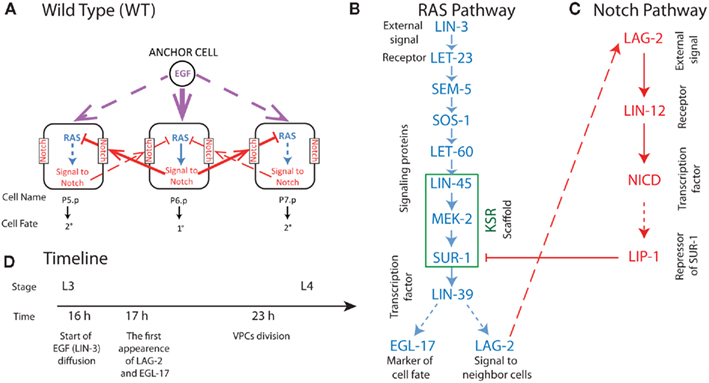
Figure 1. Summary of biochemical processes in three central VPCs (P5.p, P6.p, P7.p) involved in wild-type C. elegans vulval development (A). In (A) solid lines represent strong signal and dashed lines weak signal in wild-type VPC development. In (B,C) solid arrows represent cell signaling processes and dashed arrows creation of species by transcription and translation. Blue symbols represent species involved in the C. elegans RAS signaling triggered by the EGF homolog LIN-3, and red symbols represent species involved in Notch signaling triggered by the RAS product LAG-2 presented on the surface of neighboring cells. (D) The experimentally observed timeline of processes in VPC development at 20°C (Euling and Ambros, 1996; Burdine et al., 1998). Where known, timing for the reactions depicted in (A–C) are in the parameter supplement available on http://www.cancerbiostats.onc.jhmi.edu/GESSA.cfm.
In order to test our model, we applied GESSA to simulate cell fate in the three central VPCs (P5.p, P6.p, P7.p) in C. elegans. Previously, the VPC development has been modeled quantitatively with ODEs (Giurumescu et al., 2006, 2009), Bayesian networks (Sun and Hong, 2007), hybrid functional Petri nets (Li et al., 2009), and qualitatively with a rule-based model (Fisher et al., 2007; Sadot et al., 2008). By quantitatively linking the multiscale cellular processes in VPC fate decisions, GESSA simultaneously simulates small scale cellular dynamics (in contrast to rule-based models) and large scale phenotypic decisions (in contrast to ODE and Petri net models).
2. Materials and Methods
2.1. Graphically Extended Stochastic Simulation Algorithm
GESSA simulates multicellular fates by modeling both the cell signaling processes in response to diffusion of extracellular signals and the resulting transcription and translation events underlying those fates. In order to integrate the PPBN, SSA, and external signal diffusion models, the central GESSA simulator synchronizes updates made to the organism at independent timesteps arising from simulations with PPBN and SSA. Specifically, the global simulator initiates the cell signaling and transcription and translation processes from the current organism state at the current simulation time t. The PPBN and diffusion models update the organism state (x) for a specified timestep ΔtS and ΔtD, while the transcription and translation process evolves over a stochastic timestep ΔtT(t). Each step in the simulation model returns the change in state to the organism and final simulation time (ΔxS(t + ΔtS), ΔxD(t + ΔtD), and ΔxT(t + ΔtT) for signaling, diffusion, and transcription/translation, respectively). The simulator then updates the organism state with changes made from the process that has completed first, so that Δt = min(ΔtS, ΔtD, ΔtT) and x(t + Δt) = x + Δx(t + Δt), where

and the indicator function is defined on Boolean values of x such that  . The simulator also updates the timestep of each process to reflect the new system time so that ΔtS ← ΔtS − Δt, ΔtD ← ΔtD − Δt, and ΔtT ← ΔtT − Δt. If any process has completed, the system re-invokes that process starting from time t ← t + Δt and state x ← x + Δx(t + Δt). The process completes when the time t reaches the final simulation time specified in the input configuration files. Thus, the simulator automatically updates the organism state with the simulated change from and re-invokes the other process when it has completed. As a result, the simulator coordinates changes in the organism state resulting from simultaneous, but asynchronous processes. Similar to tau-leaping (Li et al., 2008), the update procedure relies on selecting timesteps small enough that changes in the state from each simulated processes at each update time point do not impact the evolution of the other models. For GESSA, a rate-parameter dependent timestep must be selected to ensure that few transcription factors are activated and moved to the nucleus and few products created by transcription/translation events in any single timestep. Moreover, following the same mechanism described above, the central simulator also allows for synchronization of additional user-defined modules for additional biological processes as described in the User’s Manual, provided appropriate selection of the timestep for that process.
2.2. PPBN Model of Cell Signaling
The PPBN model evolves the state of signaling network species, including notably receptors, signaling proteins, transcription factors, and scaffolds, based upon specified scaffold, receptor, activation, and repression reactions. The PPBN enables individual copies of proteins to undergo “reactions” according to rules as in a Probabilistic Boolean Network (PBN). Further details of the reactions in this algorithm are provided in the PPBN algorithm supplement on http://www.cancerbiostats.onc.jhmi.edu/GESSA.cfm. Once these reactions are performed for individual copies of signaling species, the resulting states are summed across the copies of individual species and the difference from the original state (ΔxS) is returned to the central simulator to update the cellular state. We, therefore, refer to this model as the Pooled PBN (PPBN) model.
Generally, the PPBN model performs signaling “reactions” by distributing signals uniformly among all copies of all downstream targets. The distributed signals are then transmitted successfully with a reaction-dependent (and optionally species dependent) probability. Finally, the state of each copy of each species is computed from the balance between activating and repressing signals received. In the case of scaffolds, the PPBN allows free proteins in the cytoplasm to bind to empty slots in the scaffold and bound proteins to unbind according to specified probabilities (which are optionally scaffold and species dependent). Once bound, scaffolded proteins are restricted to send signals internally unless no internal downstream targets exist. These internal scaffold signals are also transmitted with some probability and states updated according to the balance of activating and repressing signals received. To further represent signal preservation by scaffolds, the scaffold-internal probability of signal propagation between species bound to the same scaffold may be higher than for unbound species.
The PPBN algorithm assumes that each reaction described above occurs as a Poisson process so that the probabilities for the reactions are obtained from the exponential distribution using the reaction rates as parameters. As a result, this model depends only on a pool of proteins in initial states and a single reaction rate in contrast to the dependence on multiple phosphorylation reaction rates, concentrations of different post-translational modified versions of proteins, and potentially concentrations of a number of intermediate species in standard differential equation representations of cell signaling processes. Although these rates are generalized as species specific in the above algorithm, our application of GESSA to C. elegans avoids overfitting by sharing parameters across specific reaction types. Moreover, incorporation of the scaffold binding reactions in the reaction probabilities naturally enforce enhanced signal fidelity among proteins bound to the same copy of the scaffold. We note that including a population of non-interactive protein species permits modeling of therapeutics that competitively bind to signaling proteins.
2.3. SSA Simulation of Gene Expression (Transcription-Translation)
The transcription and translation processes are modeled using the SSA, which accurately models cellular systems with small species populations, where classical chemical kinetics fails (Gillespie, 1976). Each reaction j is characterized by a rate constant aj, which together with the concentration of the reactants specifies the probability of a reaction occurring during a given timestep,

where n is the total number of reactions, and S is the vector containing the number of molecules of all reactants. The rate for reaction j, aj, is computed from an input reaction parameter cj and S if j is unimolecular and from cj, S, and compartment volume (V) if j is bimolecular (Gillespie, 1976). The probability for a reaction j to occur during timestep Δt is independent of time t.
In the GESSA model, the transcription and translation model simulates the following types of reactions: (a) transport of active and inactive transcription factors between the nucleus and cytoplasm, (b) binding and unbinding reactions (e.g., disassociation of inhibitors in the nucleus, binding of transcriptional cofactors, binding of transcription factors to DNA), (c) transcription (producing mRNAs), (d) translation (producing proteins), and (e) decay of mRNAs and proteins. All other reaction types are simulated with the modeling strategies described in the previous and following subsections, with detailed equations described in the supplement on http://www.cancerbiostats.onc.jhmi.edu/GESSA.cfm.
2.4. External Signal Propagation
In the GESSA model, we have modeled external signals (ligands) as diffusable chemicals in the extracellular space. For this process, we assume that the ligand diffuses in three dimensions from a constant point source that emits a constant source of ligand over a specified time period. In this model, the concentration of the ligand available to the PPBN module for each cell depends on the instantaneous amount of ligand at the source (nd), on the time, on the diffusivity of the ligand in intercellular regions (D), and on the distance from the source. If desired, users can substitute appropriate models for their specific system as described in the GESSA User’s Manual. For instance, users may wish to introduce code to model system-specific steady-state concentrations (e.g., time released drug delivery) or periodic variations (e.g., repeated treatments).
2.5. Sample Implementation in C. elegans VPC Development
We apply GESSA to simulate the biochemical processes until the first cell division in the central VPCs (P5.p, P6.p, and P7.p) in C. elegans in response to LIN-3 diffusion from the Anchor Cell (AC), as depicted in Figure 1. Similar to experimental fate determination (Burdine et al., 1998) and the rule-based approach of Li et al. (2009), we determine the fate of each cell to be 1° if EGL-17 protein concentration surpasses a threshold at the time of cell division and 2° otherwise. This threshold is tuned to maximize the WT and Vul fates in simulations of wild-type (WT) and LIN-12 loss-of-function (LOF, LIN-12:LOF) worms. All further simulations of other genetic variants use these same thresholds to avoid overfitting. Because we base our fate decision on EGL-17 only, our model does not distinguish the 2° and 3° fates. We declare an organism to be WT when P6.p is 1° and P5.p-P7.p are 2°; Vul when P5.p-P7.p are 3°; and Muv when at least two cells in P5.p, P6.p, and P7.p adopt the 1° fate. We apply our GESSA model to 100 simulated organisms and observe the resulting penetrance of phenotypes in wild-type and mutant worms observed in experiments (Sternberg, 2005) from early L3 (16 h after hatching) to VPC cell division (23 h after hatching; Euling and Ambros, 1996; Burdine et al., 1998).
In this application, we use experimentally derived rate constants wherever possible and minimize the number of free parameters by sharing parameters within reaction types. The specific values for these parameters are provided in the parameter selection supplement available at http://www.cancerbiostats.onc.jhmi.edu/GESSA.cfm. Geometric parameters used for diffusion and SSA models are estimated from Figure 3 of Kinnunen et al. (2005). The values of D and nd for external signal propagation are selected to insure a large LIN-3 signal at late time points in P6.p and a significant delay between arrival of signal at P6.p and neighboring cells to allow RAS signaling in P6.p to generate a Notch response in P5.p and P7.p prior to arrival of LIN-3. All transport reactions between the nucleus and cytoplasm are assumed to occur at a characteristic rate of 1 min (Fujioka et al., 2006), although the PPBN uses 2 min for setting TFs for import. Keeping with our philosophy of setting parameters by molecular process, parameter values were shared wherever possible. For the SSA simulation, we chose rate constants based on a number of studies in bacterial and eukaryotic systems. As in many biological systems, none of the reaction rates have been measured for the in vivo signaling reactions in C. elegans VPC development. As described above, we, therefore, assume common rates for each reaction type in the network tuned to reflect timing and biological results observed in independent experiments such as Sako et al. (2000) and explore sensitivity to these parameters in Section 3. All rate constants used for the C. elegans simulation are provided in the GESSA User’s Manual along with code to replicate the simulations.
2.6. Matlab Software
We have implemented the GESSA model in Matlab. The Matlab code integrates (1) a graphical model of cell signaling simulated with the PPBN, (2) a differential equation-based model of transcription and translation simulated with SSA (Gillespie, 1976) implemented in Ullah et al. (2006), and (3) a diffusion model of extracellular signaling protein propagation, as described above. A global simulator distributes the diffusing external signals that can trigger the PPBN signaling process, tracks species created through transcription and translation, and stores all intermediate values of species concentrations and states for evaluation of intermediate states of the system and fate decisions. The reactions and corresponding parameters for each simulation are loaded from a set of input files, described in the User’s Manual provided with the GESSA software. The GESSA software release also includes full simulation input files for the C. elegans simulations described in the following section.
3. Results and Discussion
3.1. General Characteristics of the Hybrid Model
The model was first tuned by allowing variations in the TF and PolII binding constants. Since we limited the number of parameters by demanding that all similar processes share the same parameter value, the rate constants and binding constants are shared by all molecular species. The sharing of rate and binding constants was obviously a great simplification, but it provided fewer degrees of freedom than allowing variation between unknown parameters. We tuned the shared constants to insure that proteins were generated proportionally to signal over a range of activation of transcriptional regulators. These constants remained within an order of magnitude of measured values, even when such values came from different organisms. As described in the methods above, parameters used for simulations of fates of C. elegans VPCs are tuned to maximize WT fate and Vul fate in WT and LIN-12:LOF simulations, respectively. These parameters were then used to infer phenotypes from all remaining genetic variations presented below. The parameters and corresponding initialization files used are provided with the GESSA model release.
As demonstrated below, this approach permitted creation of a mechanistic model that avoided overfitting while retaining predictive power. As our knowledge of biological systems grows, it is hoped that parameter values will become measurable, and the model does permit specification of each parameter value if appropriate. As noted above, the LIN-3 signal strength and diffusion rate were tuned to generate a time delay in the response of neighboring cells. This generated levels of roughly 100:1 LIN-3 signal between P6.p and neighboring cells, which has been used ad hoc in some other models (Giurumescu et al., 2006). Moreover, in this system the GESSA model naturally showed substantial stochastic variation of the state of intracellular signaling species and mRNA in individual organisms, while producing more uniform protein levels (results not shown). Thus, although the states and concentrations of species vary rapidly, they tend to induce reactions and trends in those species consistent with the experimentally observed C. elegans VPC system.
3.2. VPC Phenotypes in C. elegans
We simulated 100 wild-type (WT) and LIN-12:LOF organisms which are reported to show fully penetrant WT (Sulston and Horvitz, 1977) and Multivulval (Muv; Greenwald et al., 1983) phenotypes. Each simulation is run from early L3 (16 h after hatching) to VPC cell division (23 h after hatching, Figure 1). The resulting simulation of a single organism takes approximately 1,000 s of CPU time on a 2.8 GHz quad-core Intel Xeon processor. GESSA is implemented using the Matlab parallel toolbox, so that simulations of multiple organisms can be run in parallel.
Our model included production of EGL-17 protein, which is used as a reporter for 1° fate (Burdine et al., 1998). We compared WT and LIN-12:LOF outputs and defined a cutoff based on the mean amount of EGL-17 generated over the course of the simulation from initiation with AC signaling and conclusion at the point of cell division. The cutoff value of 100 copies of EGL-17 maximized the correct overall assignment of phenotypes in WT and LIN-12:LOF (Table 1).
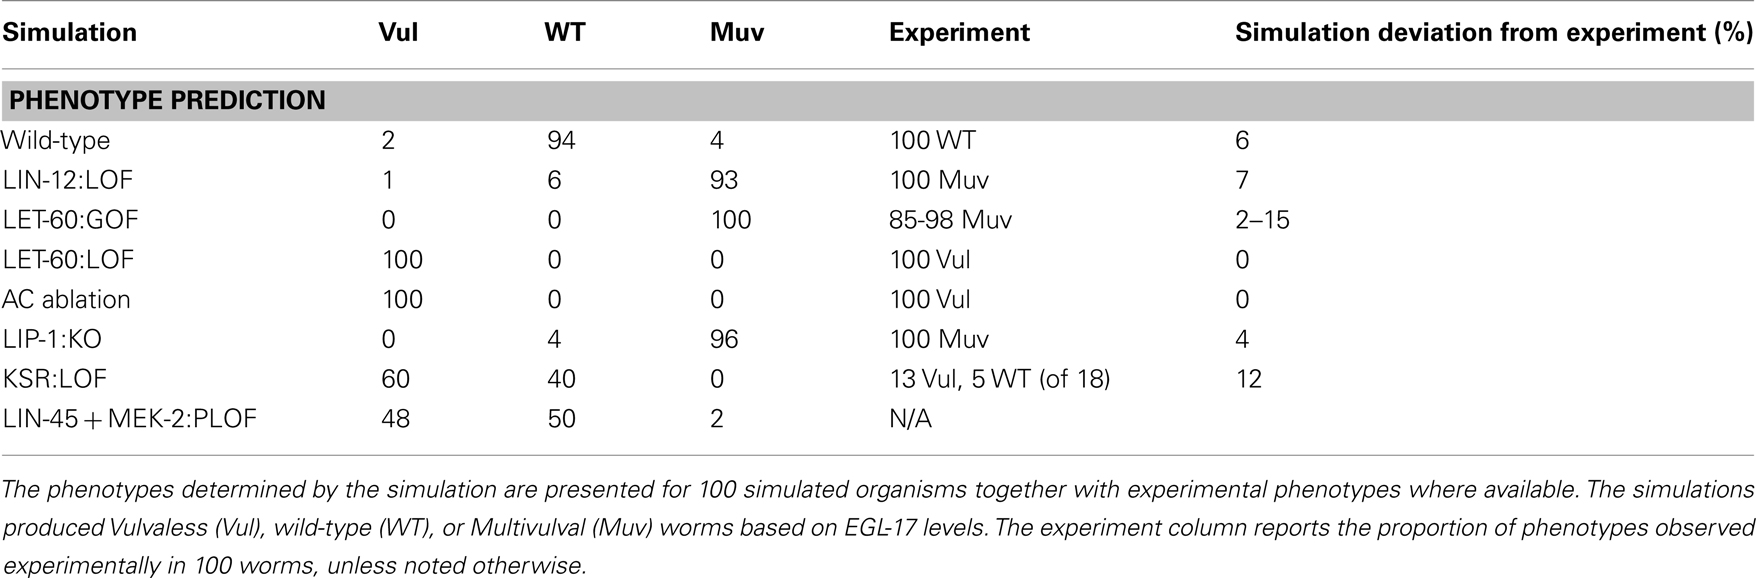
Table 1. Predicted and experimental phenotypes.
Table 1 reports the simulated phenotypes for several mutations based upon the EGL-17 threshold. The results agreed within ∼5% with published values in general. Cases where signaling was blocked well upstream of the transcriptional point in the model (i.e., LET-60:LOF, AC Ablation) had full Vulvaless (Vul) penetrance, since the stochastic activation of signaling and transcription did not produce adequate EGL-17 in the total absence of signal. More complex situations, such as knockout of the repressor providing feedback to RAS signaling, LIP-1:KO, showed some WT outcomes in a background of expected total Muv penetrance (Berset et al., 2005) due to the stochastic aspect of the model, where signals were inadequate in a few organisms to generate the required EGL-17 levels in P5.p or P7.p. This aspect of the model also causes the ∼5% misidentification in the WT simulation and may well reflect unmodeled processes, such as LIN-12:LAG-2 interactions of the same cell (i.e., P6.p), which recently have been shown to play a role in suppression of Notch signaling (Sprinzak et al., 2010).
The KSR:LOF, which simulated the loss of the KSR scaffolding proteins, gave a balanced Vul and WT phenotype, roughly matching the reported behavior, where only 18 animals were used to generate expected penetrance (i.e., 72% Vul; Ohmachi et al., 2002). We also simulated a reduced function (RF) or partial loss-of-function (PLOF) situation by reducing the number of LIN-45 and MEK-2 proteins to 25 each. This yielded a partial phenotype as well. PLOF/RF phenotypes often give rise to partial penetrance in synthetic genetic experiments.
3.3. Sensitivity to Parameters
Because rates of signaling reactions are typically unmeasurable in vivo, we also simulated C. elegans VPC fates in WT worms for a range of rate parameters for the PPBN reactions. We performed these simulations by varying rate parameters for comparable reactions across species types, notably between activation and repression reactions and activation in scaffold bound and unbound species. Table 2 reports the resulting phenotypes in simulations of 100 organisms. We observed that the PPBN was relatively insensitive to small variations in reaction probabilities, with minimal variation in the phenotypes when the repression rate matched the activation rate of scaffold bound proteins. Moreover, the phenotypes remained predominantly the WT phenotype when decreasing the probability of repression reactions by 37% and activation of scaffold bound proteins by 44%. Larger changes in the probability of repression reactions decreased the effect of Notch signaling (Figure 1) resulting in a continuous increase in the Muv phenotype as expected. Similarly, disrupting the fidelity of signal propagation in the scaffold by significantly reducing the probability of scaffold bound activation resulted in expected adoption of the Vul phenotype. We note that these large changes were, in effect, models of partial loss-of-function and behaved accordingly.
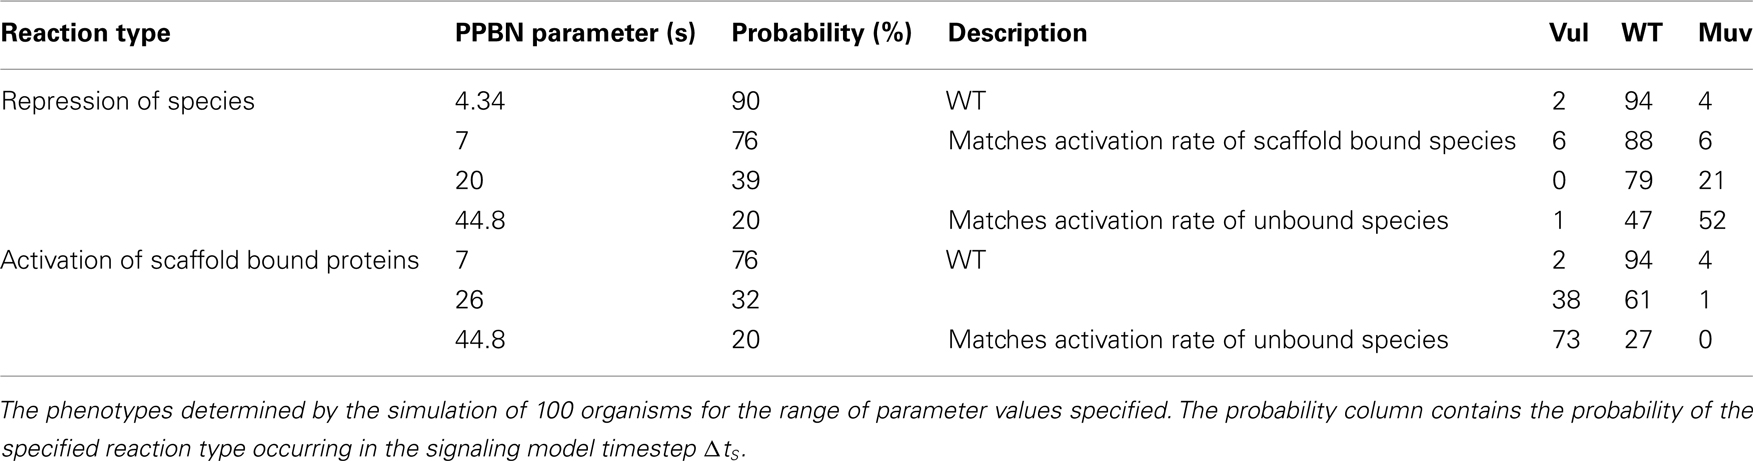
Table 2. Sensitivity of predicted phenotypes.
3.4. Signaling Cascades and Scaffolding
The primary relationships within the signaling model are activation and repression of downstream proteins by upstream proteins. The probabilistic Boolean nature of these reactions accounts for the loss of signal during propagation, because activation of a target protein is not guaranteed even when the upstream activator (e.g., kinase) is active. This signal loss can be seen in Figure 2A, where the number of active signaling proteins is plotted for a number of components in the RAS pathway (see Figure 1) during simulation of the P6.p cell from entrance into the L3 stage to the first cell division. There were 1,000 LET-23 receptors available for activation, and 100 copies of each signaling protein in the model. The receptor rose with signal from the anchor cell and reached 600 active copies, leading to 100 active copies of the SEM-5 target of the receptor. However, propagation to LIN-45 resulted in loss along the chain SEM-5 → SOS-1 → LET-60 → LIN-45 resulting in only ∼25 active copies on average. Propagation was amplified through the scaffold (KSR) however, which led to higher activity in MEK-2 than in the upstream RAS homolog LET-60. The decline in SUR-1 activity at later time points indicated that some worms had active LIP-1 in P6.p, which repressed SUR-1.
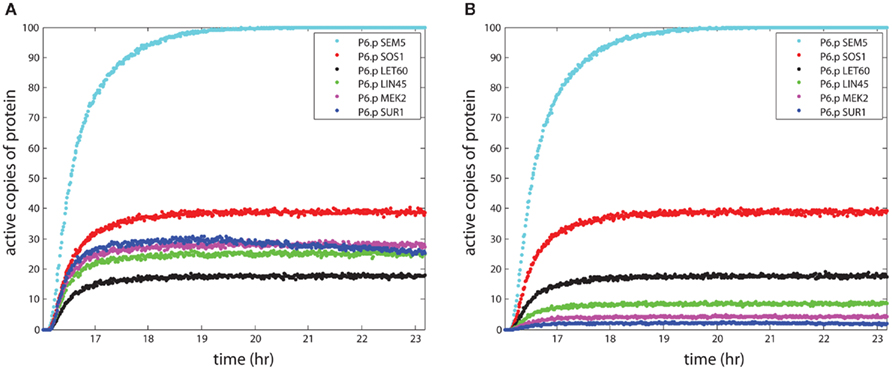
Figure 2. The propagation of signal strength. The simulations show the loss of signal strength due to the stochastic approach to modeling signaling. The y-axis shows the mean number of active proteins averaged across 100 organisms in the central VPC P6.p. In (A), the effect of the scaffold is seen as the signal stabilizes for proteins bound to the scaffold and enhances signaling in the wild-type worm. In (B), the KSR scaffold is “knocked out,” leading to a continued loss of signal during propagation.
Figure 2A demonstrates the effect of looking at collections of organisms. The single organism variation described in Section 1 averaged out over multiple organisms, so that effects such as the apparent gradual decline in SUR-1 signal in P6.p at late time points appeared in the average behavior across organisms. However, individual organisms showed either flat behavior over time or virtually total loss of signal, depending on the presence of the LIP-1 repressor driven by lateral signaling from the neighboring cells (see Figure 1). Similar behavior was observed when contrasting measurements of signaling proteins averaged across cell populations with single cell measurements, as for p53 pulses (Geva-Zatorsky et al., 2006).
The effect of the scaffold on overall signaling strength can be seen most clearly in the KSR knockout simulation in Figure 2B, where the lack of a scaffold greatly reduced the strength of the signal to MEK-2, as only ∼4 copies were active. Thus, the scaffold increased the signaling strength by roughly a factor of 6 in the case where the number of scaffolds matched the number of proteins, relative to the lack of a scaffold. This behavior resulted from parameter selection in our model, since we sought probabilities of reaction for scaffolded and non-scaffolded proteins that reproduced signaling fidelity in the presence of a scaffold.
Mismatched concentrations of scaffolding proteins have also been known to affect signaling by reducing signals (Locasale et al., 2007). In Figure 3, we plot the mean number of active MEK-2 proteins from 100 simulations for different numbers of KSR proteins to demonstrate the effect of mismatching the number of scaffolds to the number of other signaling proteins. At low scaffold concentration, this mismatch provided fewer scaffolds for signal enhancement. At high scaffold concentrations, this mismatch sequestered individual signaling proteins from the cascade (i.e., LIN-45, MEK-2, SUR-1) on different scaffolds, effectively reducing the probability of signal enhancement in this case as well. Therefore, the resulting curve peaks at matched scaffold concentrations and decreases in both directions away from the peak. High scaffold concentrations were more detrimental to signaling than low concentrations, as the scaffolds essentially isolated the cascade components away from each other, reducing signaling more significantly for similar relative fold abundance changes than at low concentrations.
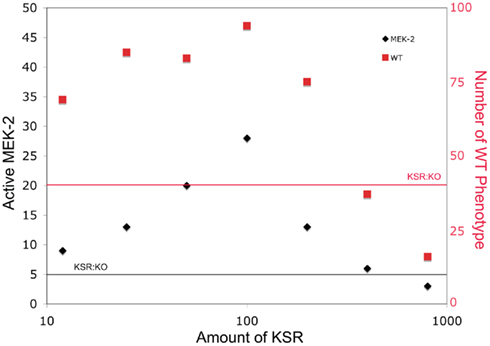
Figure 3. The effect of varying scaffold concentration on downstream signal strength. The number of scaffold proteins is varied and the mean number of active MEK-2 species across 100 simulations is determined. The number of organisms developing as WT is also plotted. The horizontal lines show levels for the KSR knockout for comparison.
3.5. Amplification from Gene Expression
The basic transcriptional response to activation of a transcriptional regulator, such as LIN-31, is a rapid rise in the number of transcriptional targets. The mRNA is then exported and multiple ribosomes bind and create protein. The final levels of mRNA and protein reached will depend on the balance between creation and decay.
The levels seen here (averaged across 100 organisms, see Figure 4) were compared with measurements made by SAGE analysis in yeast. Our model produced on the order of 5–10 copies of each mRNA on average. SAGE analysis estimated 0.3–200 mRNA copies per cell per gene (Velculescu et al., 1997). As the genes in our simulation encode regulatory aspects of development, these mRNA levels are expected to be at the low end of the range, so the results are consistent with experimental levels. These low level mRNA signals generated the protein levels shown through the action of multiple ribosomes, which coupled with longer half-lives for proteins amplified the protein levels relative to the mRNA levels. The final protein levels observed in the model range from the low hundreds to (rarely) a few thousand. Although not observed here, we note that the number of proteins generated through our model of transcription and translation will saturate over time periods that are sufficiently long for protein decay to become significant. Furthermore, these protein levels are consistent with measurements in yeast as well, although at the low end of those measurements (Gygi et al., 1999). The different levels between simulation and experiment may reflect both true low concentration of regulatory proteins in vivo and overestimation of typical protein concentrations due to finite detection levels of the technology used for the experimental protein measurements.
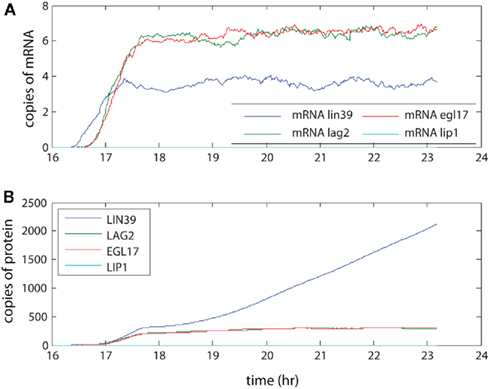
Figure 4. The amplification of signal by transcription and translation. The signal activates transcriptional regulator LIN-31, leading to expression of LIN-39. This in turn leads to creation of LAG-2, which initiates lateral signaling to neighboring cells. Here the (A) mRNA levels and (B) protein levels in P6.p averaged over 100 organisms are presented.
Conclusion
Cell signaling and its effects mediated by gene expression play a critical role in developmental processes and many human diseases, most notably cancer. We have presented here a comprehensive, mechanistic model for transcriptional reprogramming driven by cell signaling that can be applied to developmental processes, one of which is demonstrated here, and to human disease. The model utilizes a representation of underlying bio-molecular species and reactions that is predictive despite requiring minimal parameterization, providing a novel approach to predictive model building in systems biology. In addition, we have structured the model and its supporting configuration files to enable future applications where parameterization can be more substantial, once in vivo measurement technologies provide insight into reaction rates, binding constants, and intracellular chemical concentrations.
A key aspect of the GESSA model is the integration of a graphical model, our PPBN model suitable for cell signaling processes, and an SSA model, suitable for gene expression. The GESSA model allows each process to be optimally simulated. The PPBN model captures the key on-off activity of a single signaling protein from a population. This model assumes that signaling proteins adopt a binary state and interact only when in the active conformation. Nonetheless, this PPBN model could be extended naturally to account for proteins that adopt multiple conformational states. On the other hand, the SSA model captures continuous level of transcripts and proteins. To these major components, we have added a biophysical models of ligand diffusion. For the C. elegans VPC simulations, three-dimensional diffusion from a point source can represent the temporal and spatial variation of the LIN-3 signal in the VPCs. If desired, users can introduce alternative diffusion models appropriate to their system, including decay of ligands (see the GESSA User’s Manual). GESSA simulates intracellular species transport by moving species between the cytoplasm and nucleus (and between graphical and ODE models) in a finite time. If so desired, users could add additional species and reactions responsible for these active transport processes to the SSA model.
We have demonstrated the capabilities of GESSA using the well studied area of C. elegans VPC development. The model correctly predicted phenotype, including partial penetrance, in a number of mutants including LOF and GOF cases. In addition, GESSA also correctly simulated phenotypes for a genetic mutant in which the LIP-1 gene is eliminated. Moreover, the predominance of WT is observed in simulations with a wide range of PPBN parameters. The model does show less bistability in the cell fates than other modeling systems due its the stochastic aspects. However, we believe this behavior is a strength, as it allows for determination of partial penetrance, which is shown by substantial numbers of phenotypes in all species, and which can be considered a primary feature of cancer.
The hybrid modeling approach of GESSA improves computational efficiency by capturing the appropriate time frame of behavior for different mechanisms and avoids problems with stiffness in solving systems with vastly different time scales. The modularity of the code also facilitates extensions of the processes in individual modules. We present open-source Matlab code for our model on our web site (see below). While the code is fully capable as a standalone simulation environment, we view the current model code as a prototype, providing a proof of concept for the GESSA model. Moving forward, we believe such models should be integrated in larger efforts, such as the Virtual Cell system (Moraru et al., 2008). This integration would provide an efficient computational and developmental framework, building on the significant differential equation modeling tools and integrating graphical models where appropriate.
Authors Contributions
Elana J. Fertig and Ludmila V. Danilova were primary developers of the GESSA hybrid model, including creating all code, XML, and documentation. They assisted in production of the manuscript. They contributed equally to the work, with Elana J. Fertig leading PPBN model development and Ludmila V. Danilova leading SSA transcription-translation module development. Alexander V. Favorov assisted with helpful discussions during development and refinement of the model. Michael F. Ochs conceived of the hybrid modeling approach and led the development, as well as being primary author of the manuscript.
Code Availability
Code and documentation are available at http://www.cancerbiostats.onc.jhmi.edu/GESSA.cfm This website also contains supplemental documentation describing the PPBN algorithm and the parameter selection for the C. elegans simulations.
Conflict of Interest Statement
The authors declare that the research was conducted in the absence of any commercial or financial relationships that could be construed as a potential conflict of interest.
Acknowledgments
We thank the Maryland Cancer Restitution Fund (MCRF) for supporting this work with funding to Michael F. Ochs and Ludmila V. Danilova. We thank NIH-NLM for support of Elana J. Fertig, Alexander V. Favorov, and Michael F. Ochs (grants LM009382 and LM008932). We also thank Nora Smith for assistance in identifying experimental rate parameters.
References
Arkin, A., Ross, J., and McAdams, H. H. (1998). Stochastic kinetic analysis of developmental pathway bifurcation in phage lambda-infected escherichia coli cells. Genetics 149, 1633–1648.
Berset, T. A., Hoier, E. F., and Hajnal, A. (2005). The C. elegans homolog of the mammalian tumor suppressor dep-1/scc1 inhibits egfr signaling to regulate binary cell fate decisions. Genes Dev. 19, 1328–1340.
Burdine, R. D., Branda, C. S., and Stern, M. J. (1998). EGL-17(FGF) expression coordinates the attraction of the migrating sex myoblasts with vulval induction in C. elegans. Development 125, 1083–1093.
Euling, S., and Ambros, V. (1996). Heterochronic genes control cell cycle progress and developmental competence of C. elegans vulva precursor cells. Cell 84, 667–676.
Fisher, J., Piterman, N., Hajnal, A., and Henzinger, T. A. (2007). Predictive modeling of signaling crosstalk during C. elegans vulval development. PLoS Comput. Biol. 3, e92. doi:10.1371/journal.pcbi.0030092
Fujioka, A., Terai, K., Itoh, R. E., Aoki, K., Nakamura, T., Kuroda, S., Nishida, E., and Matsuda, M. (2006). Dynamics of the ras/erk mapk cascade as monitored by fluorescent probes. J. Biol. Chem. 281, 8917–8926.
Geva-Zatorsky, N., Rosenfeld, N., Itzkovitz, S., Milo, R., Sigal, A., Dekel, E., Yarnitzky, T., Liron, Y., Polak, P., Lahav, G., and Alon, U. (2006). Oscillations and variability in the p53 system. Mol. Syst. Biol. 2:2006 :0033.
Gillespie, D. T. (1976). A general method for numerically simulating the stochastic time evolution of coupled chemical reactions. J. Comput. Phys. 22, 403–434.
Giurumescu, C. A., Sternberg, P. W., and Asthagiri, A. R. (2006). Intercellular coupling amplifies fate segregation during Caenorhabditis elegans vulval development. Proc. Natl. Acad. Sci. U.S.A. 103, 1331–1336.
Giurumescu, C. A., Sternberg, P. W., and Asthagiri, A. R. (2009). Predicting phenotypic diversity and the underlying quantitative molecular transitions. PLoS Comput. Biol. 5, e1000354. doi:10.1371/journal.pcbi.1000354
Greenwald, I., Sternberg, P., and Horvitz, H. (1983). The lin-12 locus specifies cell fates in Caenorhabditis elegans. Cell 34, 435–444.
Gygi, S. P., Rochon, Y., Franza, B. R., and Aebersold, R. (1999). Correlation between protein and mrna abundance in yeast. Mol. Cell. Biol. 19, 1720–1730.
Kierzek, A., Zhou, L., and Wanner, B. (2010). Stochastic kinetic model of two component system signalling reveals all-or-none, graded and mixed mode stochastic switching responses. Mol. Biosyst. 6, 531–542.
Kim, S., Li, H., Dougherty, E., Cao, N., Chen, Y., Bittner, M., and Suh, E. (2002). Can markov chain models minic biological regulation? J. Biol. Syst. 10, 431–445.
Kinnunen, T., Huang, Z., Townsend, J., Gatdula, M. M., Brown, J. R., Esko, J. D., and Turnbull, J. E. (2005). Heparan 2-o-sulfotransferase, hst-2, is essential for normal cell migration in Caenorhabditis elegans. Proc. Natl. Acad. Sci. U.S.A. 102, 1507–1512.
Li, C., Nagasaki, M., Ueno, K., and Miyano, S. (2009). Simulation-based model checking approach to cell fate specification during Caenorhabditis elegans vulval development by hybrid functional petri net with extension. BMC Syst. Biol. 3, 42. doi:10.1186/1752-0509-3-42
Li, H., Cao, Y., Petzold, L. R., and Gillespie, D. T. (2008). Algorithms and software for stochastic simulation of biochemical reacting systems. Biotechnol. Prog. 24, 56–61.
Locasale, J. W., Shaw, A. S., and Chakraborty, A. K. (2007). Scaffold proteins confer diverse regulatory properties to protein kinase cascades. Proc. Natl. Acad. Sci. U.S.A. 104, 13307–13312.
Mayer, B. J., Blinov, M. L., and Loew, L. M. (2009). Molecular machines or pleiomorphic ensembles: signaling complexes revisited. J. Biol. 8, 81.
McAdams, H. H., and Arkin, A. (1997). Stochastic mechanisms in gene expression. Proc. Natl. Acad. Sci. U.S.A. 94, 814–819.
Meier-Schellersheim, M., Xu, X., Angermann, B., Kunkel, E. J., Jin, T., and Germain, R. N. (2006). Key role of local regulation in chemosensing revealed by a new molecular interaction-based modeling method. PLoS Comput. Biol. 2, e82. doi:10.1371/journal.pcbi.0020082
Moraru, I., Schaff, J. C., Slepchenko, B. M., Blinov, M. L., Morgan, F., Lakshminarayana, A., Gao, F., Li, Y., and Loew, L. M. (2008). Virtual cell modelling and simulation software environment. IET Syst. Biol. 2, 352–362.
Novak, B., and Tyson, J. J. (2004). A model for restriction point control of the mammalian cell cycle. J. Theor. Biol. 230, 563–579.
Ohmachi, M., Rocheleau, C. E., Church, D., Lambie, E., Schedl, T., and Sundaram, M. V. (2002). C. elegans ksr-1 and ksr-2 have both unique and redundant functions and are required for mpk-1 erk phosphorylation. Curr. Biol. 12, 427–433.
Sadot, A., Fisher, J., Barak, D., Admanit, Y., Stern, M. J., Hubbard, E. J. A., and Harel, D. (2008). Toward verified biological models. IEEE/ACM Trans. Comput. Biol. Bioinform. 5, 223–234.
Sako, Y., Minoguchi, S., and Yanagida, T. (2000). Single-molecule imaging of egfr signalling on the surface of living cells. Nat. Cell Biol. 2, 168–172.
Shea, M. A., and Ackers, G. K. (1985). The or control system of bacteriophage lambda. A physical-chemical model for gene regulation. J. Mol. Biol. 181, 211–230.
Shmulevich, I., Dougherty, E. R., Kim, S., and Zhang, W. (2002). Probabilistic boolean networks: a rule-based uncertainty model for gene regulatory networks. Bioinformatics 18, 261–274.
Sprinzak, D., Lakhanpal, A., Lebon, L., Santat, L. A., Fontes, M. E., Anderson, G. A., Garcia-Ojalvo, J., and Elowitz, M. B. (2010). Cis-interactions between notch and delta generate mutually exclusive signalling states. Nature 465, 86–90.
Sulston, J., and Horvitz, H. (1977). Post-embryonic cell lineages of the nematode, Caenorhabditis elegans. Dev. Biol. 56, 110–156.
Sun, X., and Hong, P. (2007). Computational modeling of Caenorhabditis elegans vulval induction. Bioinformatics 23, i499–i507.
Ullah, M., Schmidt, H., Cho, K. H., and Wolkenhauer, O. (2006). Deterministic modelling and stochastic simulation of biochemical pathways using matlab. Syst. Biol. (Stevenage) 153, 53–60.
Keywords: computational molecular biology, probabilistic models, development, stochastic processes, cell signaling, transcriptional reprogramming
Citation: Fertig EJ, Danilova LV, Favorov AV and Ochs MF (2011) Hybrid modeling of cell signaling and transcriptional reprogramming and its application in C. elegans development. Front. Gene. 2:77. doi: 10.3389/fgene.2011.00077
Received: 28 June 2011;
Paper pending published: 24 August 2011;
Accepted: 17 October 2011;
Published online: 08 November 2011.
Edited by:
Vladislav Petyuk, Pacific Northwest National Laboratory, USAReviewed by:
Victor Andreev, University of Miami, USAAlexander Ratushny, Seattle Biomedical Research Institute, USA
Copyright: © 2011 Fertig, Danilova, Favorov and Ochs. This is an open-access article subject to a non-exclusive license between the authors and Frontiers Media SA, which permits use, distribution and reproduction in other forums, provided the original authors and source are credited and other Frontiers conditions are complied with.
*Correspondence: Michael F. Ochs, Division of Oncology Biostatistics and Bioinformatics, Department of Oncology, Sidney Kimmel Comprehensive Cancer Center, Johns Hopkins University, 550 North Broadway Suite 1101, Baltimore, MD 21209, USA. e-mail:bWZvQGpodS5lZHU=
†Joint first author.