
 Eduardo Casas2
- 1 Department of Animal Sciences, Washington State University, Pullman, WA, USA
- 2 U.S. Meat Animal Research Center, Agricultural Research Service, United States Department of Agriculture, Clay Center, NE, USA
- 3 National Center for Foreign Animal and Zoonotic Disease Defense, Texas A&M University, College Station, TX, USA
Bovine respiratory disease (BRD) is considered to be the most costly infectious disease in the cattle industry. Bovine viral diarrhea virus (BVDV) is one of the pathogens involved with the BRD complex of disease. BVDV infection also negatively impacts cow reproduction and calf performance. Loci associated with persistently infected animals (BVD-PI) and linked with BRD have previously been identified near 14 Mb on bovine chromosome 2 (BTA2) and 15.3 Mb on bovine chromosome 26 (BTA26). The objective of this study was to refine the loci associated with BVD-PI and linked with BRD. Association testing for BVD-PI was performed on a population of 65 BVD-PI calves, 51 of their dams, and 60 unaffected calves (controls) with 142 single nucleotide polymorphisms (SNPs) on BTA2 and 173 SNPs on BTA26. Comparisons were made between BVD-PI calves and controls calves and the dams of BVD-PI calves and controls calves. For the linkage analysis of BRD, the same markers were used to genotype two half-sib families consisting of the sires and 72 BRD positive and 148 BRD negative offspring. Using an allelic chi-square test, 11 loci on BTA2 and 8 loci on BTA26 were associated with the dams of the BVD-PI calves (P < 0.05) and 4 loci on BTA2 and 11 loci on BTA26 were associated with BVD-PI calves. This demonstrates that although some of the loci on BTA2 and BTA26 are jointly involved in the fetal and dam response to BVD-PI infection, there are loci that are solely associated with the maternal or fetal susceptibility to disease. One locus on BTA2 and two loci on BTA26 were found to be linked (P < 0.05) with BRD. The regions linked with BRD were also associated with BVD-PI demonstrating that both the broad (BRD) and narrow (BVD-PI) definition of disease identified shared genomic regions as important in disease susceptibility. These results further refined the loci associated with BVD-PI and linked with BRD.
Introduction
Bovine respiratory disease (BRD) is the most prevalent disease in the cattle industry generating losses over $750 million per year (Griffin, 1997; USDA NAHMS, 2000). Bovine viral diarrhea (BVD) is a common disease reported in cattle populations worldwide and bovine viral diarrhea virus (BVDV) is frequently identified as a causative pathogen for BRD outbreaks. The BVDV is one of more than 20 pathogens that comprise the broader disease spectrum of the BRD complex (Richer et al., 1988; Wittum et al., 2001; Becher et al., 2003; Poletto et al., 2004; Talafha et al., 2009; Choi and Song, 2010; Schneider et al., 2010). Of cattle tested for BVD-PI in numerous studies worldwide, the presence of BVDV antibodies were identified in 60–85% of cattle and an additional 1–2% were persistently infected (Houe, 1999). The economic losses caused by BVD infection are estimated to range from $10 to $40 for each calf born in the U.S. (Houe et al., 1993; Houe, 1999). Most of the economic losses that result from BRD, and specifically animals persistently infected with BVD (BVD-PI), are due to reductions in milk production, conception rate, and calf growth, with a subsequent increase in abortions, congenital defects, and mortality.
Infection of pregnant cows with BVDV can lead to a trans-placental infection of the fetus. If BVDV infection occurs in a cow during late gestation (>150 days), it results in a transient infection of the dam and the fetus. In contrast, if the cow becomes BVDV infected before 150 days of gestation when the fetal immune system is not yet fully developed, the calf can become persistently infected (BVD-PI; Brock, 2003).
Bovine viral diarrhea persistently infected animals are a key source of BVDV transmission as they continuously shed the virus into the environment (Fulton et al., 2005). In feedlots, where animals are kept under close confinement, it is estimated that one BVD-PI animal can infect more than 90% of its herd-mates (Houe et al., 1993; Moerman et al., 1993). Wittum et al. (2001) reported the existence of at least one BVD-PI animal in 10% of the cattle herds from five states in the U.S. In Washington state, 13% of cattle herds had one or more BVD-PI animal with a prevalence rate of 0.92% (79/8624) in tested calves.
Estimates of the heritability of genetic susceptibility to BRD and BVD range from 0.10 to 0.48 (Muggli-Cockett et al., 1992; Snowder et al., 2005, 2006, 2007). Added support that genetics influences the susceptibility to BRD and BVD-PI is provided by a recent study that identified loci associated with BVD-PI and loci linked with BRD on cattle chromosomes 2 (BTA2) and 26 (BTA26; Neibergs et al., 2010). Unfortunately, this study was hampered by a small number of genetic markers to define the loci linked and associated with disease. The current study utilizes more genetic markers to: (1) refine the loci associated with BVD-PI and loci linked with BRD on BTA2 and BTA26, (2) identify if the loci linked with the broad (BRD) definition of disease were shared when the disease was defined narrowly (BVD-PI), and (3) identify if the loci associated with the BVD-PI calves were shared with the loci associated with the dams of the BVD-PI calves. These objectives were undertaken using a complementary approach of linkage analysis for determining the loci linked with BRD and association analysis for determining the loci associated with dams of the BVD-PI calves and the BVD-PI calves. To determine if these loci were robust in their association and linkage of disease, Bos taurus × Bos indicus crossbreds were used for the linkage study and B. taurus crossbreds were studied in the association analysis. In the first population, BRD was defined broadly and BVD-PI animals were not diagnosed separately from the more encompassing diagnosis of BRD. This population consisted of two large families with a high incidence of BRD in their calves. In the second population, the disease diagnosis was limited to BVD-PI animals and did not include animals that exhibited other signs of BRD. This population consisted of unrelated calves and the dams of the BVD-PI affected calves. The identification of loci involved with susceptibility to BRD and BVD–PI will expand our understanding of the genetic components related to the susceptibility of cattle to respiratory disorders. Identification of disease loci also provides an opportunity to select cattle that are less likely to become diseased.
Materials and Methods
Bovine Viral Diarrhea Population
The B. taurus crossbred animals used in this study were the same as those described previously (Neibergs et al., 2010). Briefly, testing for BVD-PI was conducted on 60 commercial cow–calf operations across the state of Washington with a total of 8624 calves undergoing testing. Diagnostic testing was initiated after onsite collection of calves’ ear notches from the cow–calf operations. These samples were sent to the Washington State University Washington Animal Disease Diagnostic Laboratory for BVD-PI testing as described (Neibergs et al., 2010). All animal procedures used (animal subjects protocol #3809-001) were exempt by the Institutional Animal Care and Use Committee of Washington State University as no live animal use was involved except that which re-utilized tissues obtained and submitted for routine animal health and disease diagnostic purposes.
The identification of the infection status of animals was first conducted by quantitative reverse transcription PCR to determine the presence of the BVDV in pooled ear notch samples using the AgPath-ID BVDV qRT-PCR kit (Applied Biosystems, Foster City, CA, USA). This testing was conducted on all calves in this study. If a pooled sample was identified as positive, all the animals from the pool were re-tested with the IDEXX Laboratories (Westbrook, ME, USA) BVD antigen test kit per manufacturer’s instructions to identify individual(s) infected with the BVDV. After initial screening, only BVD positive animals were re-tested with a second sample collection at least 21 days after the first collection and classified again with the IDEXX BVD antigen test kit per manufacturer’s instructions. If the second sample tested positive the animal was classified as BVD-PI. Samples from the dams of the BVD-PI animals and BVD-PI negative animals were also collected. To account for the roles of the dam during trans-placental infection and the calf immune response for the production of BVD-PI calves, both the dams’ of BVD-PI calves and BVD-PI calves’ allele and genotype frequencies were compared to a BVD-PI negative calf. Samples from 65 BVD-PI calves from eight ranches and 51 of their dams were used for the association analysis. Sixty unaffected calves from the same herd of the BVD-PI animals, with similar ages, served as controls.
Bovine Respiratory Disease Population
The animals used in this study were from two half-sib B. taurus and B. indicus crosses located in Clay Center, NE, USA (Neibergs et al., 2010). The half-sib families consisted of a Brahman × Hereford (Braford) sire bred to predominantly B. taurus crossbred cows and a Brahman × Angus (Brangus) sire also bred to predominantly B. taurus crossbred cows. From the Braford-sired family, 42 calves with BRD and 86 calves without BRD were included and from the Brangus-sired family, 30 calves with BRD and 62 calves without BRD were used to refine the loci linked with BRD on BTA2 and BTA26.
Bovine respiratory disease was detected by physical examination, necropsy, or laboratory analyses as described (Snowder et al., 2005, 2007; Neibergs et al., 2010). An animal without clinical signs of BRD was classified as BRD negative even though it was possible that the animal was never exposed to BRD pathogens and so may have been misclassified as being negative when it may have just escaped exposure to BRD pathogens. However, since the animals in this study were housed together, it is unlikely that there were significant differences in pathogen exposure among animals. Experimental procedures for the linkage study were approved and performed in accordance with U.S. Meat Animal Research Center (MARC) Animal Care Guidelines and the Guide for Care and Use of Agricultural Animals in Agricultural Research and Teachings (Federation of Animal Science Societies, 1999).
Genotyping
A custom single nucleotide polymorphism (SNP) assay (Illumina, San Diego, CA, USA) was designed and used for genotyping a 14-Mb region on BTA2 and a 15-Mb region on BTA26. Putative SNPs for the custom assay were identified through dbSNP1 and were chosen based upon three criteria: (1) lack of repetitive regions surrounding the SNP, (2) nucleotide location based on the Btau_4.0 assembly, and (3) through the use of the Illumina Assay Design Tool (Liu et al., 2009). On BTA2, 175 SNPs were chosen to cover the region of 125,942,688–139,963,957 bp with a median spacing of 73 kb. On BTA26, 209 SNPs were used to cover the region of 33,695,934–48,957,955 bp with a median spacing of 69.6 kb. Physical positions at each SNP were expressed relative to the forward strand of the bovine reference genome (Btau_4.0 assembly; Liu et al., 2009). Genotyping was performed on the custom array as per the manufacturer’s instructions (Illumina, San Diego, CA, USA). These 384 SNPs formed the basis of the linkage and association analysis as they were used to genotype all animals in the study.
Genotypes were assessed for quality prior to the association and linkage analysis. Samples were removed from the analysis when more than 10% of their genotypes failed. SNPs were also assessed for quality prior to the association analysis. SNPs were removed if the minor allele frequency (MAF) was less than 1%, if the SNPs failed to genotype in more than 10% of the samples or if the SNPs failed the Hardy–Weinberg equilibrium (HWE) test (P < 0.001).
Bovine Viral Diarrhea Persistent Infection Association Analysis
The experimental design for the BVD-PI study was a case–control design with two groups representing cases (BVD-PI calves, and the dams of the BVD-PI calves) and one group representing controls (BVD-PI negative calves). The controls (BVD-PI unaffected calves) were “matched” to BVD-PI calves as they were from the same herd as a BVD-PI calf and were born in the same week as a BVD-PI calf. This matching design was done so that the dams of the BVD-PI and unaffected calves had a similar opportunity for BVDV exposure at the same time of gestation and thus a similar opportunity to give birth to a BVD-PI calf. The genotypes of unaffected calves “matched” with BVD-PI calves were collectively put into an unaffected group for analysis of their allele and genotypic frequencies just as the genotypes of the BVD-PI animals were collectively placed into a BVD-PI group for further analysis.
Dams of BVD-PI calves were included as a separate group of cases. This was done to account for the dam’s contributions to the disease state of the calf through her immunological response to the virus as well as through the ease at which the virus crosses the placenta. The BVD-PI calves formed the second group of cases to account for the calf’s contribution to disease susceptibility through the rate at which its immune system develops. To account for the roles of the dam and the calf in BVD-PI, both the dams and calves were evaluated for an association with BVD-PI. The SNP allele and genotype frequencies of the dams of the BVD-PI calves were compared to the allele and genotype frequencies of the control calves.
A second control group of dams of unaffected calves was not collected as these samples were not available (cows were turned out before the calf results were available) and the genotypes of the unaffected calves already represented genotypes of animals that were less susceptible to BVD-PI which served the same function as collecting their dam’s genotypes.
To test for population stratification between the cases and controls prior to the BVD-PI association analysis, multi dimensional scaling (MDS) plots were constructed using PLINK (version 1.07) in the R statistical environment (Purcell et al., 2007). Only SNPs that were not in linkage disequilibrium (LD) were used for the MDS plot. Complete linkage agglomerative clustering, based on pair-wise identity by state, was used to identify and remove SNPs in LD after 10,000 phenotypic randomizations.
An association analysis was conducted to identify the loci associated with BVD-PI. Association analyses have the advantage of sampling many independent meioses from a population which increases the power to detect genetic associations. Comparisons were made between the dams of the BVD-PI calves and control calves and between the BVD-PI calves and the control calves for the association analyses to determine if there were allele or genotype frequency differences that were related to the incidence of BVD-PI in calves. The first comparison investigated if there was a genetic association with BVD-PI calves and the second comparison investigated if there was a genetic association with dams of BVD-PI calves. To determine if there was an association, chi-square tests were used to compare if there were differences in allele or genotype frequencies between the case and control groups using the allelic, genotypic, additive, dominant, and recessive models in PLINK (version 1.07; Purcell et al., 2007).
The allelic test, which compares allele frequencies differences between cases and controls, differs from the genotypic, recessive, dominant, and additive models which compare genotypic frequencies between cases and controls. The dominant model assigns one of the alleles as the dominant allele (for this example A) and compares the frequency of one of the homozygous genotypes (i.e., aa) to the combined frequency of the other homozygous (AA) and the heterozygous (Aa) genotype between cases and controls. The test for the recessive model reverses which homozygous genotype is combined with the heterozygous genotype, such that in our previous example AA would be compared to the combined genotypic frequencies of aa and Aa. A significance threshold for the association analysis of P < 0.05 was used after 1.0 × 10⁶ permutations comparing each observed test statistic against the maximum of all permuted statistics over all SNPs for each single replicate to reduce the false positives (type I error). Regions of DNA that were identified to be associated with BVD-PI were further evaluated to distinguish the levels of LD with the SNPs so that the number of loci associated with BVD-PI could be estimated. LD between SNPs was computed using the D′ option of Haploview version 4.2 (Barrett et al., 2005; Barrett, 2009).
In addition to the allelic and genotypic tests used to identify genetic associations, a haplotype analysis was performed using Haploview 4.2 to identify if a constructed haplotype provided more evidence for an association with BVD-PI than a single SNP (Barrett et al., 2005; Barrett, 2009). Haplotypes were constructed by first including neighboring SNPs with LD levels greater than 0.5 as putative SNPs in the haplotype. For each chromosome an omnibus association statistic was performed to identify the overall association of the haplotype as described by Potter (2006). An omnibus test statistic is computed using a permutation test to assess the association of the haplotype with BVD-PI. In this approach, P-values for marker-specific Cochran–Armitage trend tests are combined to form a scalar statistic, which is then used in a permutation test to determine an overall P-value. The Cochran–Armitage trend test is used to assess for the presence of an association between the presence or absence of BVD-PI. Using a backward elimination process, SNPs were sequentially included, regardless of the levels of LD, and excluded from haplotype blocks and new association tests computed to define the SNPs that composed a locus (Barrett et al., 2005; Barrett, 2009). Frequencies of the haplotypes were then generated and a chi-square test was computed comparing the case and control groups. The chi-square significance of the allelic test for each individual marker was then compared to the significance value of the haplotype to determine which provided stronger evidence for an association with BVD-PI. SNPs were considered as part of the same haplotype if they had an additive effect that improved the statistical significance of the haplotype block. If an individual SNP provided more evidence for an association than the haplotype, the haplotype was rejected and the individual SNP formed the locus.
Bovine Respiratory Disease Linkage Analysis
The population studied for the broad (BRD) definition of disease consisted of a Braford and a Brangus family. As this was a familial design, an association analysis was less appropriate than a linkage analysis to identify of the same genetic regions were found to segregate with BRD. Linkage analysis is a complementary approach for identifying loci linked with a trait. It also serves as an independent means of validating loci identified through an association analysis. Linkage analysis emphasizes the identification of the familial segregation of alleles with a phenotype whereas association analysis identifies alleles in unrelated individuals that are shared with a phenotype. One of the strengths of linkage analyses is that there is no need to control for population stratification, unlike association studies where this is always a concern. One of the strengths of association studies, which is a weakness of linkage studies, is the increased power obtained to identify loci associated with a trait due to the greater number of independent meiosis observed in unrelated individuals. By using linkage analysis for the broadly defined BRD animals and an association analysis for the narrowly defined BVD-PI calves and their dams, this study was collectively able to realize the advantages of both approaches.
For the interval linkage analysis of the Braford and Brangus families an F-statistic profile was generated at 1 cM intervals using the QTL Express program half-sib regression interval mapping (Knott et al., 1996). A two-step multi-marker linkage analysis approach was used for characterizing the loci on BTA2 and BTA26 linked with BRD. A single locus model was tested for each chromosome followed by a two loci model to determine which model was a better fit with the genotypic data. Permutation tests with 5,000 iterations of the trait data (maximum number of iterations allowed) were conducted to identify the maximum nominal significance level to determine chromosome-wide linkage at P < 0.05 for the one locus and two loci analyses.
Results
Bovine Viral Diarrhea Persistent Infection Association Analysis
Quality control analysis for the BVD-PI samples identified three samples where more than 10% of the genotypes failed and were removed prior to analysis. Two of these samples were from BVD-PI calves and one sample was from a dam of a BVD-PI calf. The samples that remained for the analysis consisted of 63 BVD-PI calves, 50 dams of BVD-PI calves, and 60 control calves. After the removal of these three samples, the genotyping success rate in the remaining individuals was 96%.
Assessment of the SNPs for minor allele frequencies identified 61 SNPs (30 on BTA2 and 31 on BTA26) that were removed due to allele frequencies less than 1%. Fifteen SNPs (nine on BTA2 and six on BTA26) were removed because they failed in more than 10% of the samples genotyped and seven SNPs (three on BTA2 and four on BTA26) were removed due to failure of HWE (P < 0.001). Nine SNPs on BTA2 and four SNPs on BTA26 failed for more than one reason. After excluding poor quality SNPs, 142 SNPs (with a median spacing of 88 kb) remained on BTA2 and 173 SNPs (with a median spacing of 81 kb) remained on BTA26 for the association analysis.
Multidimensional scaling plots were constructed for the two case–control comparisons to determine if there was evidence for population stratification. No evidence for population stratification was observed in the association analysis populations (data not shown). This was also confirmed using the permutation analysis where no genetic background differences were observed between the comparison of BVD-PI calves and BVD-PI negative calves (P = 0.79) and between the dams of BVD-PI calves and BVD-PI negative calves (P = 0.11).
BTA2
The allelic model identified 33 SNPs associated (P < 0.05) with the dams of the BVD-PI calves on BTA2. From these individual SNP associations, 11 loci were constructed. Each locus was defined by SNPs that were individually associated with BVD-PI. Loci defined by a haplotype were constructed from SNPs that were individually associated with BVD-PI, but were even more strongly associated with BVD-PI when grouped together as a haplotype based on the backward elimination method. For each locus, the SNPs included in the haplotype, the locus name, the range of the nucleotides the SNPs covered and the significance of the haplotype are shown in Table 1. Allelic and genotypic comparisons, nucleotide locations, and significance levels for individual SNPs are shown in Table A1 in Appendix for each of the statistical tests performed. In all, 11 loci were associated with the dams of the BVD-PI calves after the haplotype analysis using the allelic model. The genotypic, dominant, recessive, and additive models also identified these and additional SNPs as associated with the dams of the BVD-PI calves (Table A1 in Appendix). On BTA2, 15 individual SNPs were associated with the recessive model, 20 were associated with the genotypic model, 20 were associated with the additive model, and 26 were associated with the dominant model with dams of BVD-PI calves.
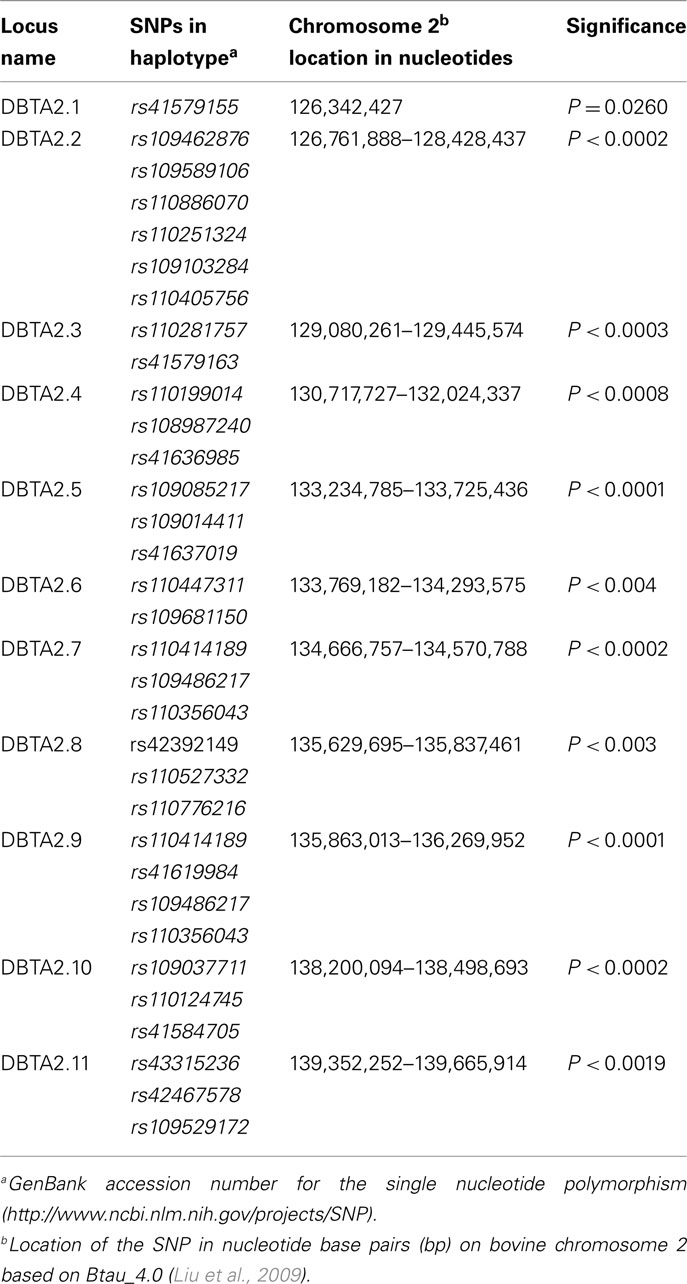
Table 1. Haplotypes associated with dams of bovine viral diarrhea persistently infected calves on BTA2 using the allelic model.
The allelic model identified nine SNPs associated (P < 0.05) with the BVD-PI calves on BTA2. Four loci were defined from these SNPs by using the backward elimination method for haplotype construction (Table 2). Comparing the allelic association results of the dams of the BVD-PI calves with the BVD-PI calves, it is apparent that all of the loci associated with the BVD-PI calves overlap with loci associated with the dams of the BVD-PI calves. For example CBTA2.1, the first locus on BTA2 that was associated with BVD-PI calves, overlaps with the DBTA2.2 locus, the second locus on BTA2 that was associated with the dams of the BVD-PI calves. In the same way CBTA2.2 overlaps with DBTA2.8, CBTA2.3 overlaps with DBTA2.8 and DBTA2.9, and CBTA2.4 overlaps with DBTA2.10 and DBTA2.11. This provides evidence that the same genomic regions are associated with the manifestation of BVD-PI in the dams and in the calves.
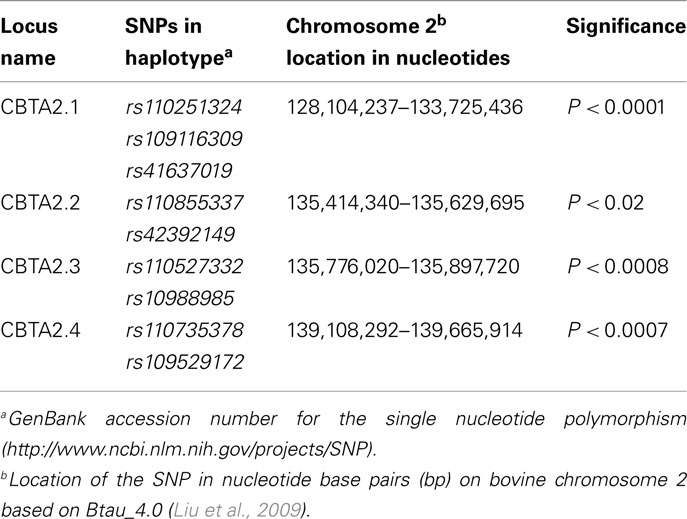
Table 2. Haplotypes associated with bovine viral diarrhea persistently infected calves on BTA2 using the allelic model.
The genotypic, dominant, recessive, and additive models identified all of the SNPs that were associated with BVD-PI in the allelic model as well as additional SNPs (Table A2 in Appendix). For the recessive model on BTA2, five SNPs were associated with BVD-PI in calves, six SNPs were associated with the genotypic model, six were associated with the additive model, and eight were associated with the dominant model.
BTA26
The allelic model found 18 individual SNPs associated (P < 0.05) with the dams of the BVD-PI calves. The haplotype analysis constructed eight loci from these SNPs as shown in Table 3. The genotypic model identified seven individual SNPs associated with the dams of the BVD-PI calves. All seven of these SNPs were also associated with the allelic model (Table A1 in Appendix). The dominant model had the most SNPs (17) associated with the dams of BVD-PI calves on BTA26 with many of the SNPs associated with the allelic model (14) sharing evidence of an association with the dominant model. The recessive model identified eight SNPs associated with the BVD-PI calves and the additive model identified seven SNPs. The number of individual SNPs on BTA26 associated with the dams of BVD-PI with all models was 28.
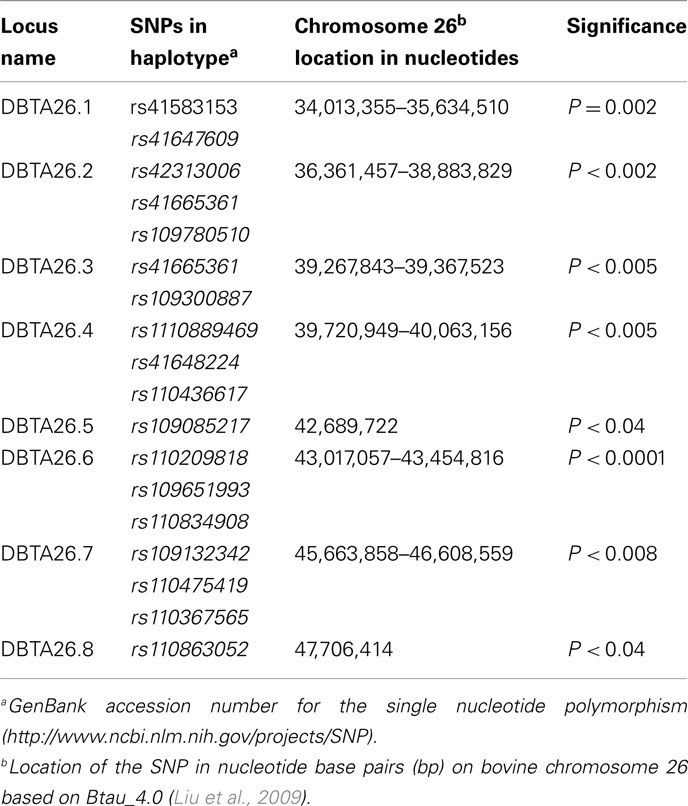
Table 3. Haplotypes associated with dams of bovine viral diarrhea persistently infected calves on BTA26 using the allelic model.
Allelic model associations were identified (P < 0.05) with BVD-PI calves with 29 individual SNPs on BTA26 (Table 4). Eleven haplotypes, consisting of between one and four SNPs (P < 0.02 to P < 0.00001), were formed. When comparing the loci associated with the dams of the BVD-PI calves and the loci associated with the BVD-PI calves, most of the loci overlapped between the two groups. The locus CBTA26.1 is contained within the locus DBTA26.1, and DBTA26.2 falls within the same genomic interval as CBTA26.2 Similarly, the locus DBTA26.5, DBTA26.6, DBTA26.7, and DBTA26.8 are contained within CBTA26.4, CBTA26.5, CBTA26.7, and CBTA26.10, respectively (see Tables 3 and 4). This leaves five loci uniquely associated with the BVD-PI calves (CBTA26.3, CBTA26.8, CBTA26.8, CBTA26.9, and CBTA26.11).
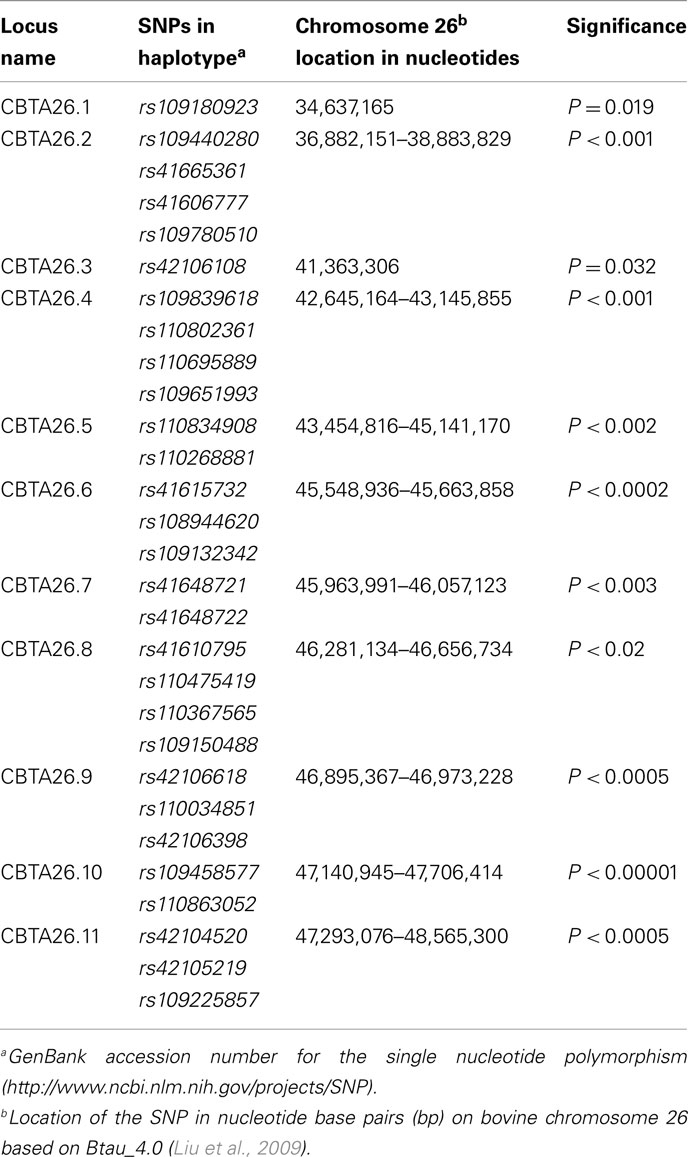
Table 4. Haplotypes associated with bovine viral diarrhea persistently infected calves on BTA26 using the allelic model.
There were 36 SNPs that were associated with BVD-PI calves with the genotypic, dominant, recessive, or additive models on BTA26. Many of these SNP associations were shared across models. The genotypic model identified 22 SNPs associated with BVD-PI calves on BTA26 (Table A2 in Appendix). The dominant, recessive, and additive models were associated with BVD-PI calves with 24, 15, and 22 SNPs, respectively.
Bovine Respiratory Disease Linkage Analysis
After quality control analysis of the genotypes of the animals, 30 animals were excluded from the linkage analysis because more than 10% of their genotypes failed. Of the animals removed, 12 animals were from the Brangus family (four BRD animals and eight unaffected animals) and 18 were from the Braford family (8 BRD animals and 10 unaffected animals). The proportion of missing genotypes did not differ (P > 0.05) between the two families or between affected and unaffected calves. This left 80 offspring from the Brangus family and 110 offspring from the Braford family. The genotyping success rate in these animals was 94.4%.
Quality control analysis of the SNPs identified and removed 41 SNPs (21 on BTA2 and 20 on BTA26) due to minor allele frequencies of less than 1%. Forty-eight more SNPs (30 on BTA2 and 18 on BTA26) were removed due to failure in more than 10% of the samples and an additional 28 SNPs (20 on BTA2 and 8 on BTA26) were excluded due to failure of HWE (P < 0.001). Sixteen SNPs (11 on BTA2 and 5 on BTA26) failed for multiple reasons. After excluding poor quality SNPs, 115 SNPs on BTA2 (with a median spacing of 100.1 kb) and 168 on BTA26 (with a median spacing of 81.7 kb) remained for the linkage analysis. The SNPs used for interval mapping were highly informative with PIC values exceeding 0.5 using the method described within the QTL Express program (Knott et al., 1998).
Applying a single locus model on BTA2, the maximum chromosomal-wide F-statistics was 5.2 (P < 0.05; Figure 1, Table A3). This locus (BBTA2.1) was located in the region between 131,782,871 bp (112.68 cM) and 132,765,640 bp (113.53 cM) and was fine mapped with 11 SNPs with a median spacing of 94 kb (Table 5). The F-statistic was less (F = 3.11) when a two loci model was tested against the one locus model, indicating that the one locus model was a better fit of the data.
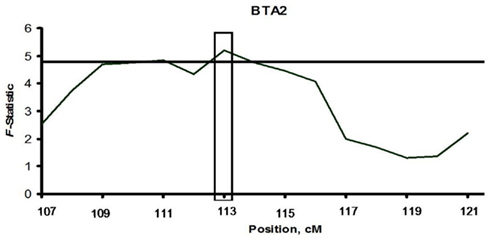
Figure 1. Linkage of bovine respiratory disease with BTA2 with a single locus model in two half-sib sire families. The computed F-statistic is shown on the y-axis and chromosomal location is given in centimorgans (cM) on the x-axis. The boxed regions identify the locus linked with bovine respiratory disease (P < 0.05) after 5,000 permutations. The horizontal line represents the significance threshold of P = 0.05.
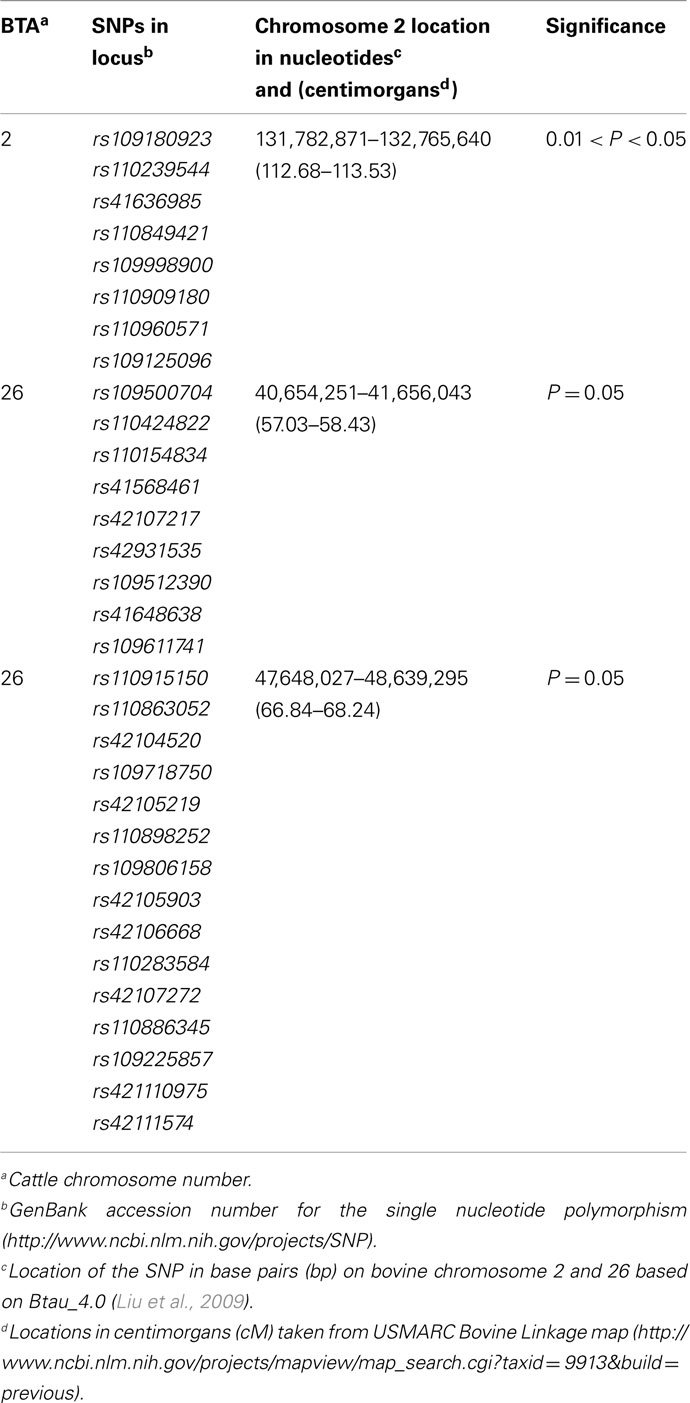
Table 5. Loci linked with bovine respiratory disease on BTA2 and BTA26 in a half-sibling Brangus and a half-sibling Braford family.
Linkage was detected using a two loci model on BTA26 resulting in a maximum chromosomal-wide F-statistic of 4.42 (P < 0.05; Figure 2, Table A3). The F-statistics was less with a one locus model (F = 3.39) indicating that the two loci model was a better fit of the data. The first locus (BBTA26.1) was located between 40,654,251 bp (57.03 cM) and 41,656,043 bp (58.43 cM) and was fine mapped with 16 SNPs with a median spacing of 66.5 kb (Table 5). The second locus (BBTA26.2) was identified between 47,648,027 bp (66.84 cM) and 48,639,295 bp (68.24 cM) and was fine mapped with 19 SNPs (P < 0.05) with a median spacing of 33.9 kb.
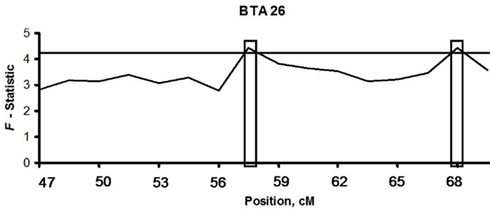
Figure 2. Linkage of bovine respiratory disease with BTA26 with a two locus model in two half-sib sire families. The computed F-statistic is shown on the y-axis and the relative distance between each SNP is given in centimorgans (cM) on the x-axis. The boxed regions identify the two loci linked with bovine respiratory disease (P < 0.05) after 5,000 permutations. The horizontal line represents the significance threshold of P = 0.05.
The loci linked to BRD are shared with the loci associated with dams of BVD-PI calves and the BVD-PI calves. The locus DBTA2.4 (P < 0.0008) that is associated with the dams of BVD-PI calves is the same location as the linkage peak on BTA2 in the Braford and Brangus families. This location also corresponds to the CBTA2.1 locus associated with BVD-PI calves. The two peak locations (40,654,251–41,656,043 and 47,648,027–48,639,295 bp) linked with BRD are the same locations identified with associations of dams of BVD-PI calves on DBTA26.8, and BVD-PI calves on CBTA26.3 and CBTA26.11. These results suggest that the loci identified with linkage analysis to BRD are shared with the association analysis of dams of BVD-PI calves as well as BVD-PI calves. Additional loci, not linked with BRD, were also found to be specific for BVD-PI on BTA2 and BTA26.
Discussion
The etiology of BRD is very complex, and multiple risk factors are involved with the progression of this illness. BRD has been associated with more than 28% of all annual cattle deaths in the U.S. (National Agricultural Statistics Service, 2006). Bovine viral diarrhea is caused by an infection from a virus in the Pestivirus genus commonly isolated during BRD outbreaks and has been classified as the most costly viral disease worldwide (Fulton et al., 2000; Ellis et al., 2001; Loneragan et al., 2005). Genetic parameters involved with susceptibility to BRD have been estimated to have a moderate role in the infection process, suggesting that selection against BRD susceptible animals will provide an additional tool to reduce the BRD incidence in the cattle industry (Muggli-Cockett et al., 1992; Snowder et al., 2005, 2007; Schneider et al., 2010).
Previously, Neibergs et al. (2010) reported an allelic association test and linkage analysis with 13 microsatellites that identified genetic regions on BTA2 and BTA26 associated with BVD-PI and linked to BRD infection in cattle. These regions were broadly defined due to the lack of density of markers in the previous study. The first objective of the current study was to refine the loci identified in the previous study. The addition of 315 SNPs (142 on BTA2 and 173 on BTA26) allowed the regions associated with BVD-PI and linked to BRD to be localized more precisely. In the previous study (Neibergs et al., 2010) six loci were associated with the dams of the BVD-PI calf on BTA2. The associations for the dam of the BVD-PI calf were located at 126, 128, 130, 133.7, 135.9, and 139 Mb. The six loci have now been further defined as 11 loci. For example, in the initial study two loci were identified as associated with the dams of the BVD-PI calves at 133 Mb (IDVGA-72) and at 125 Mb (DIK2188). It is now apparent that these two loci actually consist of five loci (DBTA2.5, DBTA2.6, DBTA2.7, DBTA2.8, and DBTA2.9). The sizes of these loci have decreased accordingly. In the previous study (Neibergs et al., 2010), one large 7.4 Mb region on BTA2 was associated with the BVD-PI calves. In the current study, four loci are jointly associated with BVD-PI calves and they range in size from 300 kb to 2 Mb.
On BTA26 associations with the dams of the BVD-PI calves were found at three loci that ranged in size from 1.4 to 4.3 Mb in the initial study (Neibergs et al., 2010), and have now been further refined to eight loci that ranged in size from 100 kb to 1.6 Mb. The associations with the BVD-PI calves on BTA26 in the initial study identified four loci (all 2 Mb or larger), while the current study identified that there were actually 11 loci that ranged from 93 kb to 2 Mb).
Neibergs et al. (2010) computed a maximum chromosome-wide F-statistic at 110 cM (108 cM with the updated linkage map; 126 Mb) on BTA2. The current study found that the peak F-statistic was approximately 4 cM (5 Mb) away (131–132 Mb; 112–113 cM) when 142 markers were added to the region. The linkage analysis on BTA26 still identified that a two loci model was the best fit for BRD, but in the current study the peaks for linkage were centered around 40 Mb (57–58 cM) and 48 Mb (67–68 cM) whereas, in the initial study the peaks on BTA26 were at 34 Mb (49 cM with the updated linkage map) and 40 Mb (58 cM with the updated linkage map). The linkage analysis peaks may have varied in this study from the initial study due to two small half-sibling families that were used in the initial study that were not used in this study.
The second objective of this study was to determine if the loci associated with BVD-PI were shared with the loci linked to BRD. The regions identified in the linkage study overlapped with the regions associated with the dams of the BVD-PI calves and the BVD-PI calves. In addition to the regions that were shared between the BRD linkage analysis and the BVD-PI association analysis, more loci were found associated with the dams of the BVD-PI calves and the BVD-PI calves. This is not surprising as the association analysis would be expected to have more power to identify loci of a complex trait, than a linkage analysis. The more narrow definition of BVD-PI disease as compared to the more broad definition of BRD also improves the power to detect loci associated with disease.
The third objective was to determine if there were shared and unshared loci between the dams of the BVD-PI calves and the BVD-PI calves. Differences in loci between the dams and the calves would be suggestive of the roles that the dams play in preventing infection (the genetic merit of the dam and the ability of the dam to interfere with the virus crossing the placenta to the calf) compared with the role of the calf (the rate at which the immune system becomes competent). On BTA2, all of the association identified in the BVD-PI calves were shared with the dams of the BVD-PI calves. Interestingly, seven additional loci were found to be associated with the dams of the BVD-PI calves. For the associations identified on BTA26, six of the eight loci associated with the dams of the BVD-PI calves were shared with the BVD-PI calves but only 6 of 11 loci associated with the BVD-PI calves were associated with the dams of the BVD-PI calves (Tables 3 and 4). These results suggest that there are common mechanisms to fight BVD-PI infection amongst the dams and their calves, but that there are also mechanisms that are unique to the dams and calves in fighting BVD-PI. Further study will be required to fully understand these differences.
These results must be examined in consideration that the control animals were assumed to be exposed to the multiple pathogens associated with BRD in the linkage analysis or just BVDV in the association analysis. The exposure of these animals is, however, unknown. This could result in animals being classified as non-susceptible when they may actually have a susceptible genotype. It is unknown what effect this may have had on identifying susceptibility loci, but it is likely that it reduced the power to detect these loci. Another consideration in interpreting these results is that the pathogens responsible for BRD were not identified in the Braford and Brangus families. It would have been preferable to have identified what proportion of the animals that were diagnosed with BRD were infected with BVDV and if those animals were more likely to share the additional loci identified in the association study. This comparison would also have made possible separating loci that might be more specifically related to persistent infection than an acute infection with BVDV.
Conclusion
Since cattle are exposed to different risk factors and pathogens associated with respiratory diseases, genetic selection for animals that are less susceptible to disease is a complementary approach to best management and biosecurity practices to reduce the incidence and losses caused by BRD and BVD-PI. The identification of 11 loci associated with dams of BVD-PI calves and 4 loci associated with BVD-PI calves on BTA2 and one locus linked with BRD that is shared with the loci associated with BVD-PI provides an opportunity to incorporate selection into the approaches to limit the devastating effects of BRD. The association and linkage results are also encouraging for BTA26 with the loci linked with BRD also associated with BVD-PI. The identification of additional loci that are specifically associated with BVD-PI is likely due to the strength of the association analysis approach and the more narrow definition of disease.
The design of this study was to utilize two complementary approaches (linkage and association) to determine if defining BRD as a complex or as a single pathogen disease (BVD-PI) in diverse cattle populations would result in the identification of loci that were shared or that were unique. Further, it explored the role of the maternal contribution to disease as well as the contribution of the calf to BVD-PI. These results demonstrate that the approaches to identify the loci associated with these diseases were complementary and that the association study provided more evidence for loci associated with disease than the linkage study. These findings also support that there are maternal contributions to susceptibility to BVD-PI that may differ from the calves’ contributions. The identification of multiple loci associated with BVD-PI or linked with the broader disease definition of BRD in diverse cattle breeds (B. indicus and B. taurus) is suggestive that these loci may be important across the cattle population in the United States. Further studies will be necessary to tease out the causative mutations responsible for susceptibility to BRD and BVD-PI so that they may be used for marker assisted selection of cattle that are less susceptible to these costly and prevalent diseases.
Conflict of Interest Statement
The authors declare that the research was conducted in the absence of any commercial or financial relationships that could be construed as a potential conflict of interest.
Acknowledgments
The authors would like to acknowledge Jan Vierck for her technical assistance and review of the manuscript and to Drs Dale Moore, Shannon Neibergs, and John Wenz for their collection of samples and organization of diagnostic testing. A special thanks to Dr. Charles Gaskins for his review and the additions to the manuscript. This work was supported through the Washington State University Extension Issue-Focused Teams Initiative.
Footnote
- ^http://www.ensembl.org/biomart/martview/ accessed March 2010
References
Barrett, J. C. (2009). Haploview: visualization and analysis of SNP genotype data. Cold Spring Harb. Protoc. 2009, pdb ip71.
Barrett, J. C., Fry, B., Maller, J., and Daly, M. J. (2005). Haploview: analysis and visualization of LD and haplotype maps. Bioinformatics 21, 263–265.
Becher, P., Avalos Ramirez, R., Orlich, M., Cedillo Rosales, S., Konig, M., Schweizer, M., Stalder, H., Schirrmeier, H., and Thiel, H. J. (2003). Genetic and antigenic characterization of novel pestivirus genotypes: implications for classification. Virology 311, 96–104.
Choi, K. S., and Song, M. C. (2010). Epidemiological observations of bovine viral diarrhea virus in Korean indigenous calves. Virus Genes 42, 64–70.
Ellis, J., West, K., Cortese, V., Konoby, C., and Weigel, D. (2001). Effect of maternal antibodies on induction and persistence of vaccine-induced immune responses against bovine viral diarrhea virus type II in young calves. J. Am. Vet. Med. Assoc. 219, 351–356.
Federation of Animal Science Societies. (1999). Guide for the Care and Use of Agricultural Animals Used in Agricultural Research and Teaching. 1st review, Savoy IL: Federation of Animal Science Societies.
Fulton, R. W., Briggs, R. E., Ridpath, J. F., Saliki, J. T., Confer, A. W., Payton, M. E., Duff, G. C., Step, D. L., and Walker, D. A. (2005). Transmission of bovine viral diarrhea virus 1b to susceptible and vaccinated calves by exposure to persistently infected calves. Can. J. Vet. Res. 69, 161–169.
Fulton, R. W., Purdy, C. W., Confer, A. W., Saliki, J. T., Loan, R. W., Briggs, R. E., and Burge, L. J. (2000). Bovine viral diarrhea viral infections in feeder calves with respiratory disease: interactions with Pasteurella spp., parainfluenza-3 virus, and bovine respiratory syncytial virus. Can. J. Vet. Res. 64, 151–159.
Griffin, D. (1997). Economic impact associated with respiratory disease in beef cattle. Vet. Clin. North Am. Food Anim. Pract. 13, 367–377.
Houe, H. (1999). Epidemiological features and economical importance of bovine virus diarrhoea virus (BVDV) infections. Vet. Microbiol. 64, 89–107.
Houe, H., Myrup Pedersenb, K., and Meylinga, A. (1993). The effect of bovine virus diarrhoea virus infection on conception rate. Prev. Vet. Med. 15, 117–123.
Knott, S. A., Elsen, J. M., and Haley, C. S. (1996). Methods for multiple-marker mapping of quantitative trait loci in half-sib populations. Theor. Appl. Genet. 93, 71–80.
Knott, S. A., Marklund, L., Haley, C. S., Andersson, K., Davies, W., Ellegren, H., Fredholm, M., Hansson, I., Hoyheim, B., Lundstrom, K., Moller, M., and Andersson, L. (1998). Multiple marker mapping of quantitative trait loci in a cross between outbred wild boar and large white pigs. Genetics 149, 1069–1080.
Liu, Y., Qin, X., Song, X. Z., Jiang, H., Shen, Y., Durbin, K. J., Lien, S., Kent, M. P., Sodeland, M., Ren, Y., Zhang, L., Sodergren, E., Havlak, P., Worley, K. C., Weinstock, G. M., and Gibbs, R. A. (2009). Bos taurus genome assembly. BMC Genomics 10, 180. doi:10.1186/1471-2164-10-180
Loneragan, G. H., Thomson, D. U., Montgomery, D. L., Mason, G. L., and Larson, R. L. (2005). Prevalence, outcome, and health consequences associated with persistent infection with bovine viral diarrhea virus in feedlot cattle. J. Am. Vet. Med. Assoc. 226, 595–601.
Moerman, A., Straver, P. J., De Jong, M. C., Quak, J., Baanvinger, T., and Van Oirschot, J. T. (1993). A long term epidemiological study of bovine viral diarrhoea infections in a large herd of dairy cattle. Vet. Rec. 132, 622–626.
Muggli-Cockett, N. E., Cundiff, L. V., and Gregory, K. E. (1992). Genetic analysis of bovine respiratory disease in beef calves during the first year of life. J. Anim. Sci. 70, 2013–2019.
National Agricultural Statistics Service. (2006). “Cattle death loss,” in Agricultural Statistics Board, (U. S.: Department of Agriculture). Available at: http://usda.mannlib.cornell.edu/usda/current/CattDeath/CattDeath-05-05-2006.pdf
Neibergs, H., Zanella, R., Casas, E., Snowder, G. D., Wenz, J., Neibergs, J. S., and Moore, D. (2010). Loci on BTA2 and BTA26 are linked with bovine respiratory disease and associated with persistent infection of bovine viral diarrhea virus. J. Anim. Sci. 89, 907–915.
Poletto, R., Kreutz, L. C., Gonzales, J. C., and Barcellos, L. J. G. (2004). Prevalência de tuberculose, brucelose e infecções víricas em bovinos leiteiros do município de Passo Fundo. Ciênc. Rural 34, 595–598.
Potter, D. M. (2006). Omnibus permutation tests of the association of an ensemble of genetic markers with disease in case-control studies. Genet. Epidemiol. 5, 438–446.
Purcell, S., Neale, B., Todd-Brown, K., Thomas, L., Ferreira, M. A., Bender, D., Maller, J., Sklar, P., De Bakker, P. I., Daly, M. J., and Sham, P. C. (2007). PLINK: a tool set for whole-genome association and population-based linkage analyses. Am. J. Hum. Genet. 81, 559–575.
Richer, L., Marois, P., and Lamontagne, L. (1988). Association of bovine viral diarrhea virus with multiple viral infections in bovine respiratory disease outbreaks. Can. Vet. J. 29, 713–717.
Schneider, M. J., Tait, R. G. Jr., Ruble, M. V., Busby, W. D., and Reecy, J. M. (2010). Evaluation of fixed sources of variation and estimation of genetic parameters for incidence of bovine respiratory disease in pre weaned calves and feedlot cattle. J. Anim. Sci. 88, 1220–1228.
Snowder, G. D., Van Vleck, L. D., Cundiff, L. V., and Bennett, G. L. (2005). Influence of breed, heterozygosity, and disease incidence on estimates of variance components of respiratory disease in preweaned beef calves. J. Anim. Sci. 83, 1247–1261.
Snowder, G. D., Van Vleck, L. D., Cundiff, L. V., and Bennett, G. L. (2006). Bovine respiratory disease in feedlot cattle: environmental, genetic, and economic factors. J. Anim. Sci. 84, 1999–2008.
Snowder, G. D., Van Vleck, L. D., Cundiff, L. V., Bennett, G. L., Koohmaraie, M., and Dikeman, M. E. (2007). Bovine respiratory disease in feedlot cattle: phenotypic, environmental, and genetic correlations with growth, carcass, and longissimus muscle palatability traits. J. Anim. Sci. 85, 1885–1892.
Talafha, A. Q., Hirche, S. M., Ababneh, M. M., Al-Majali, A. M., and Ababneh, M. M. (2009). Prevalence and risk factors associated with bovine viral diarrhea virus infection in dairy herds in Jordan. Trop. Anim. Health Prod. 41, 499–506.
USDA NAHMS. (2000). Changes in the US Feedlot Industry: 1994-1999. USDA. Available at: http://www.aphis.usda.gov/animal_health/nahms/feedlot/downloads/feedlot99/Feedlot99_dr_Changes.pdf
Wittum, T. E., Grotelueschen, D. M., Brock, K. V., Kvasnicka, W. G., Floyd, J. G., Kelling, C. L., and Odde, K. G. (2001). Persistent bovine viral diarrhoea virus infection in US beef herds. Prev. Vet. Med. 49, 83–94.
Appendix
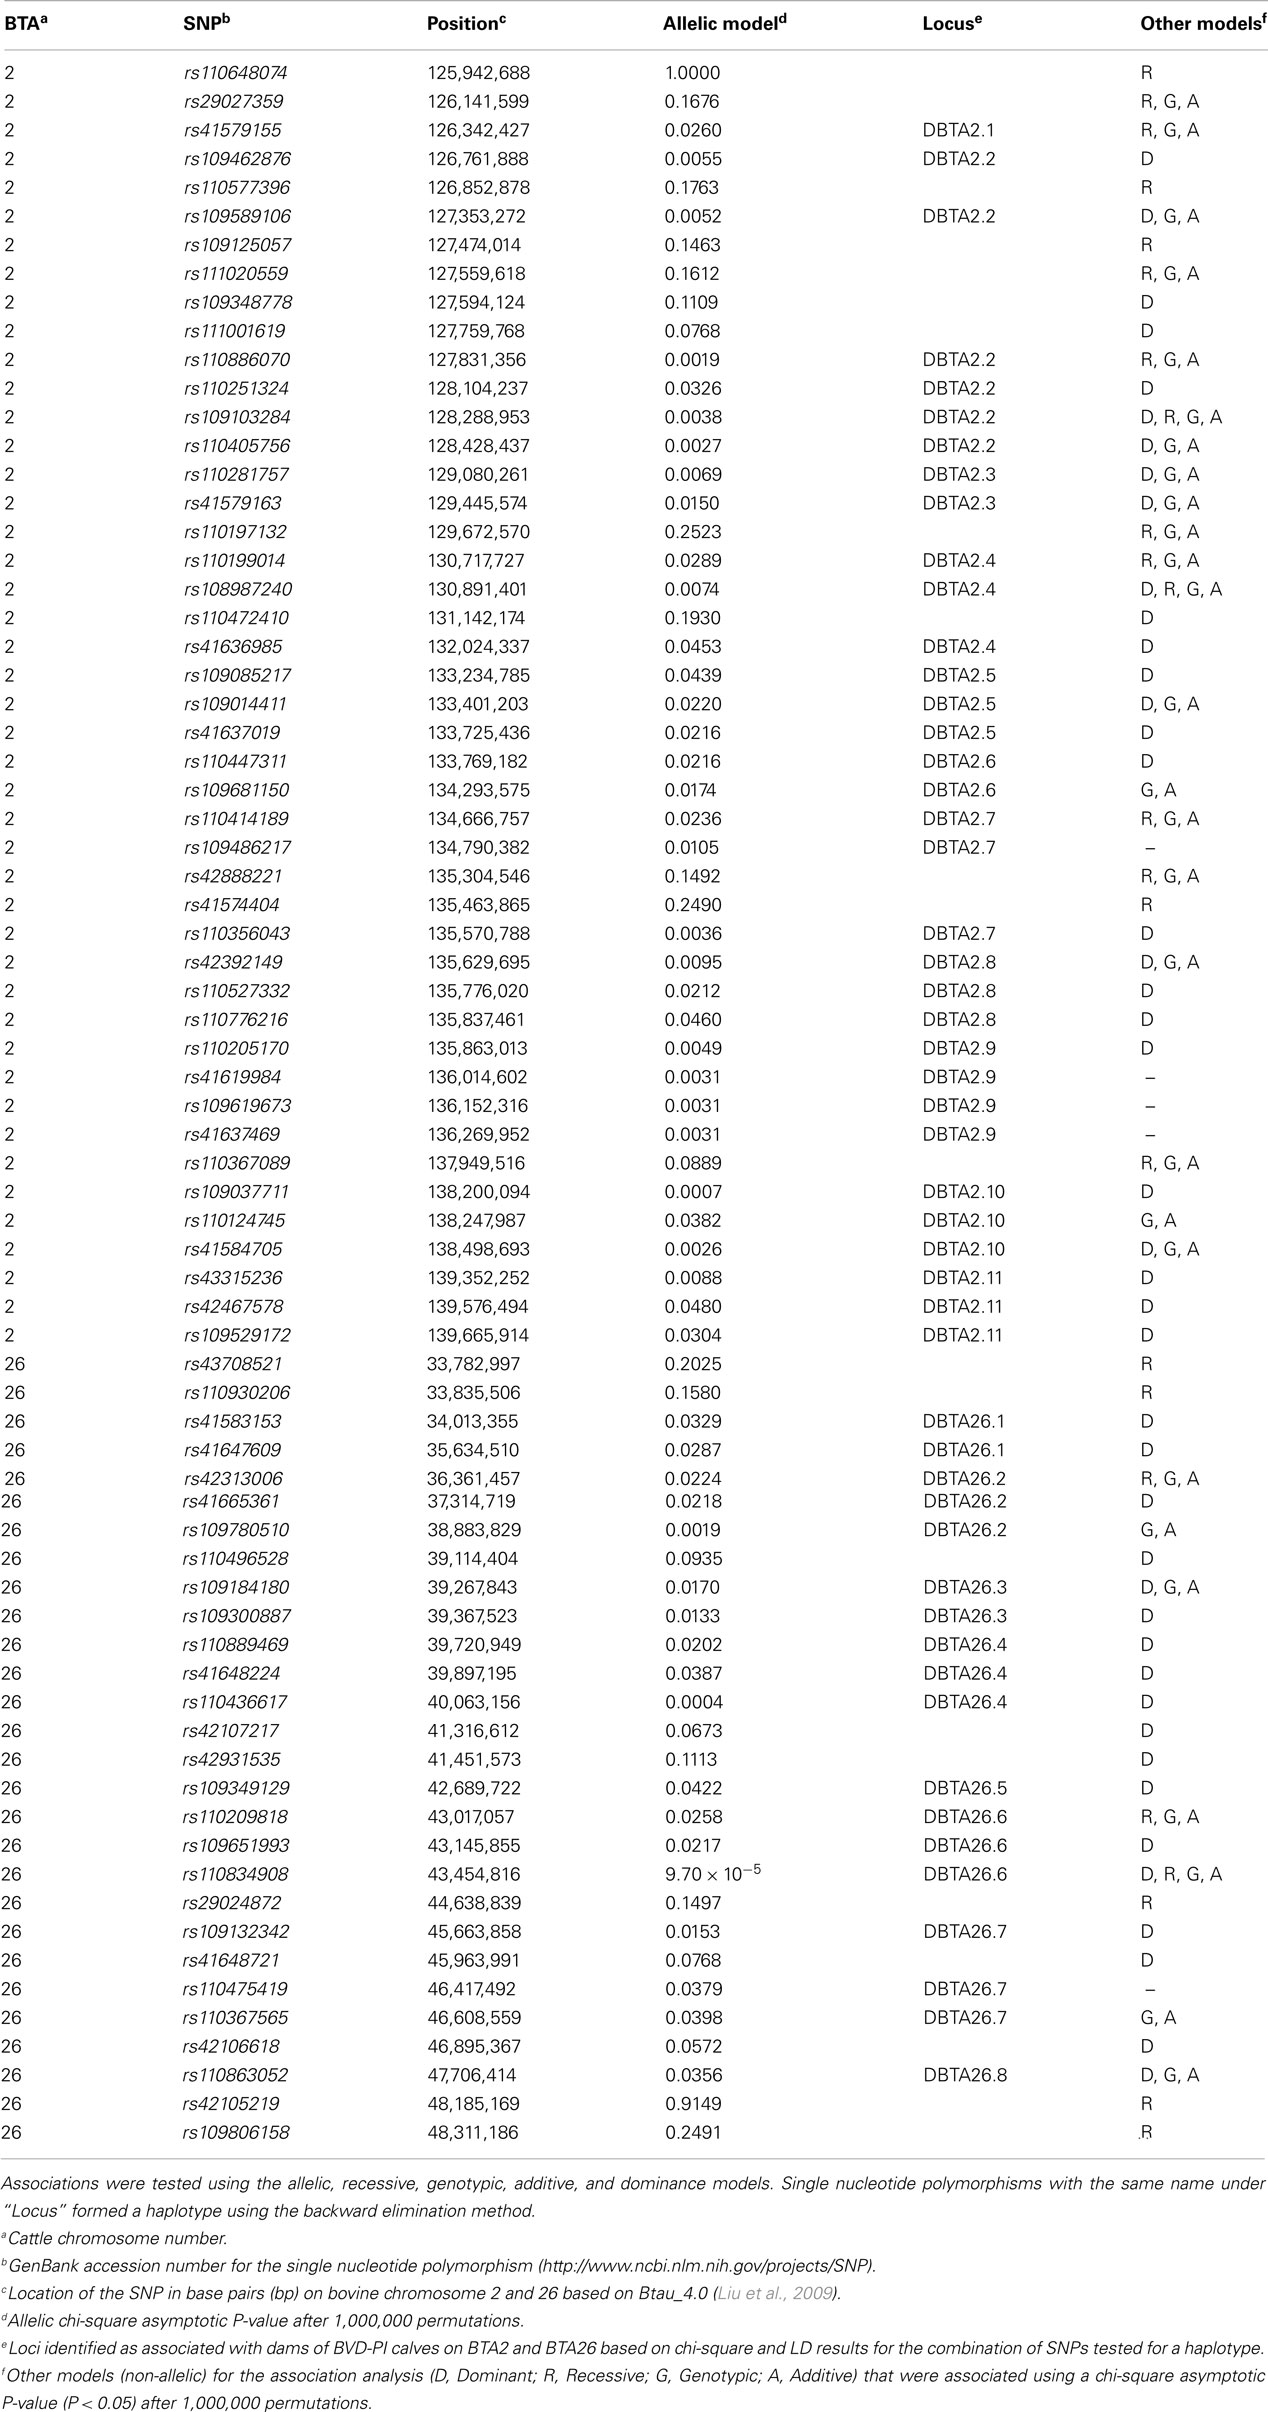
Table A1. Single nucleotide polymorphisms that represent loci associated with dams of bovine viral diarrhea persistently infected calves on BTA2 and BTA26.
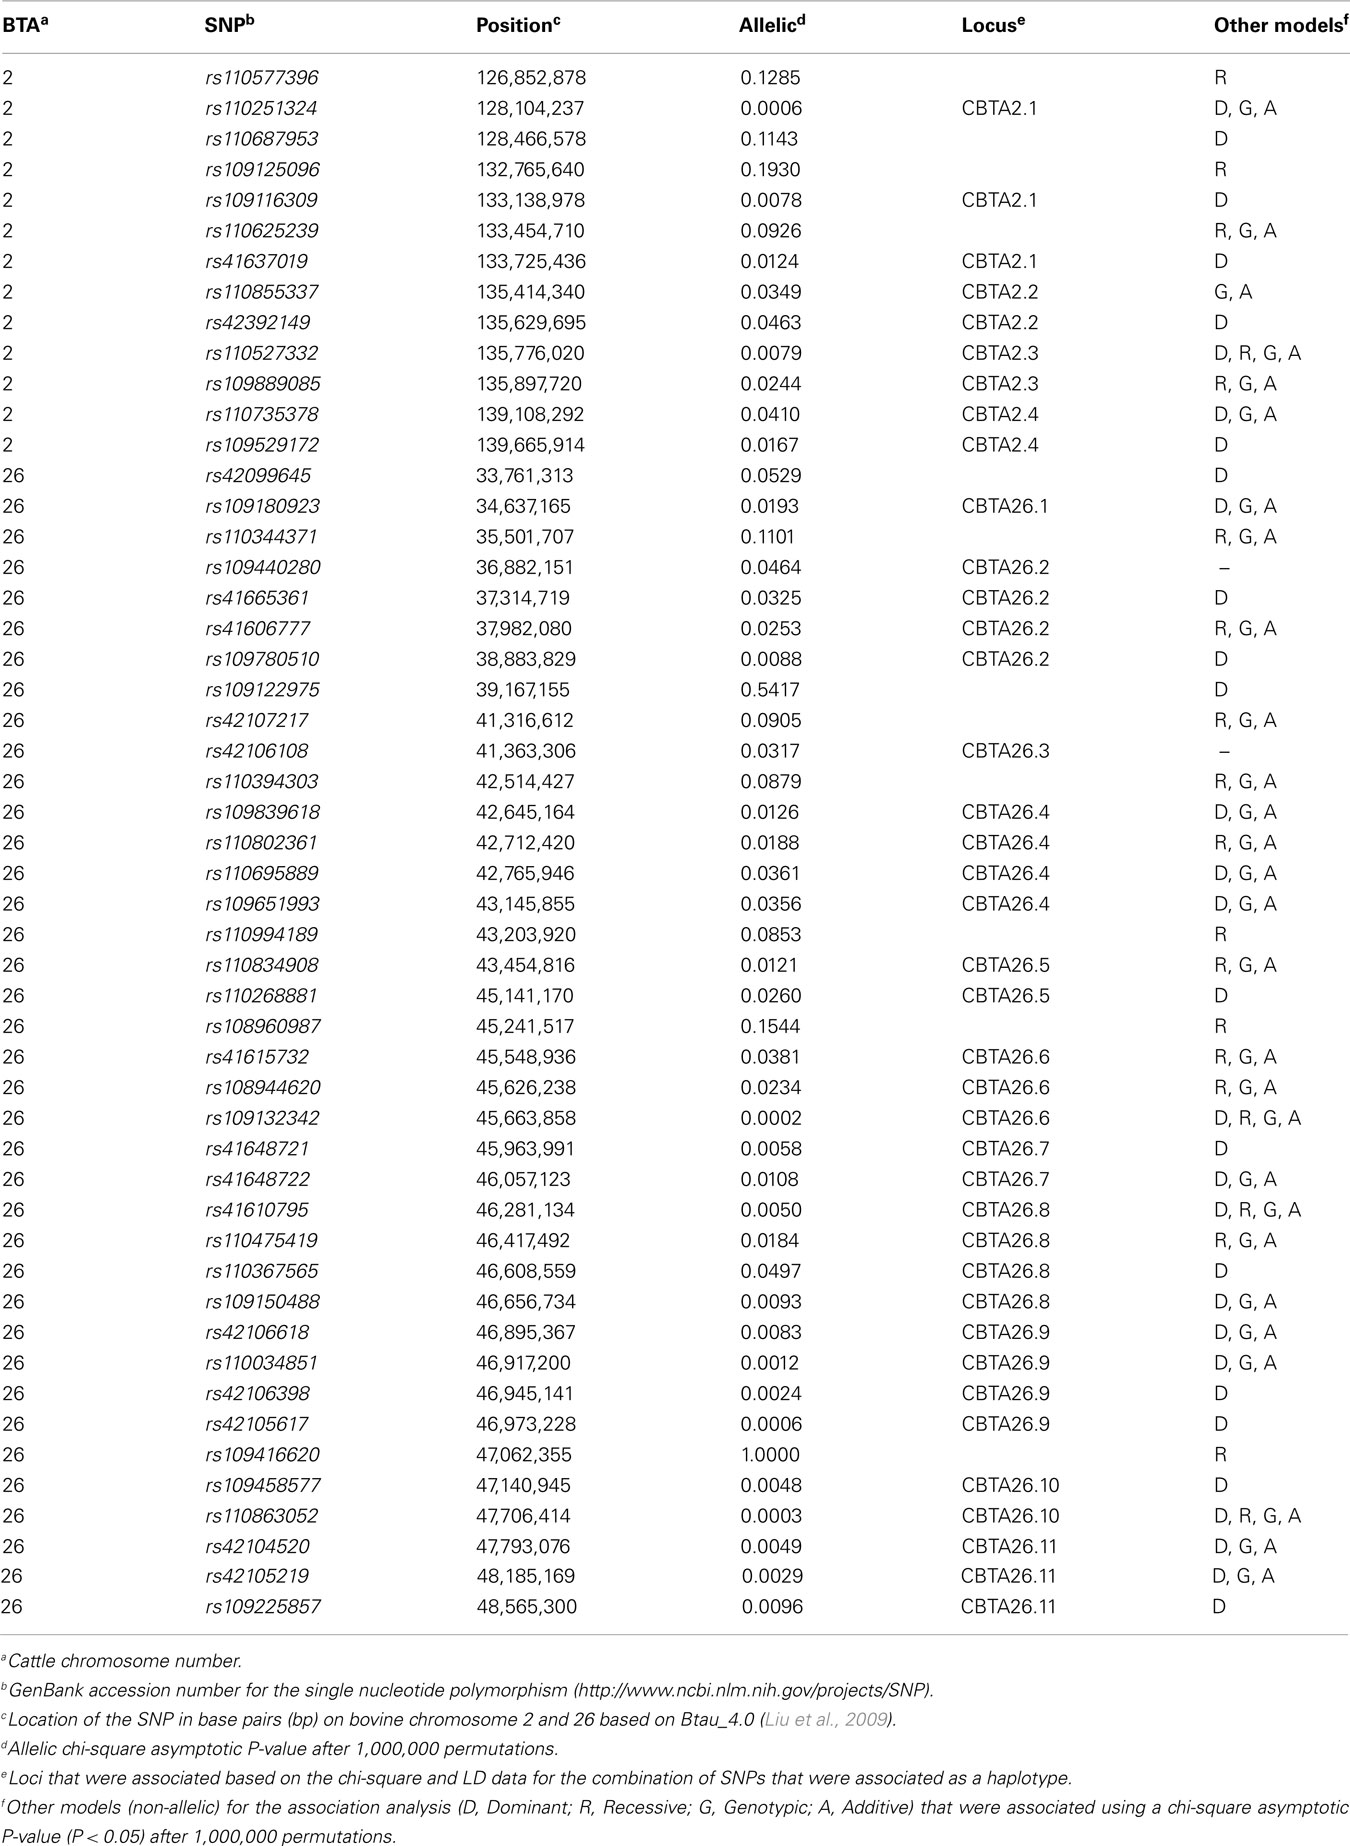
Table A2. Single nucleotide polymorphisms that represent loci associated with bovine viral diarrhea persistently infected calves on BTA2 and BTA26.
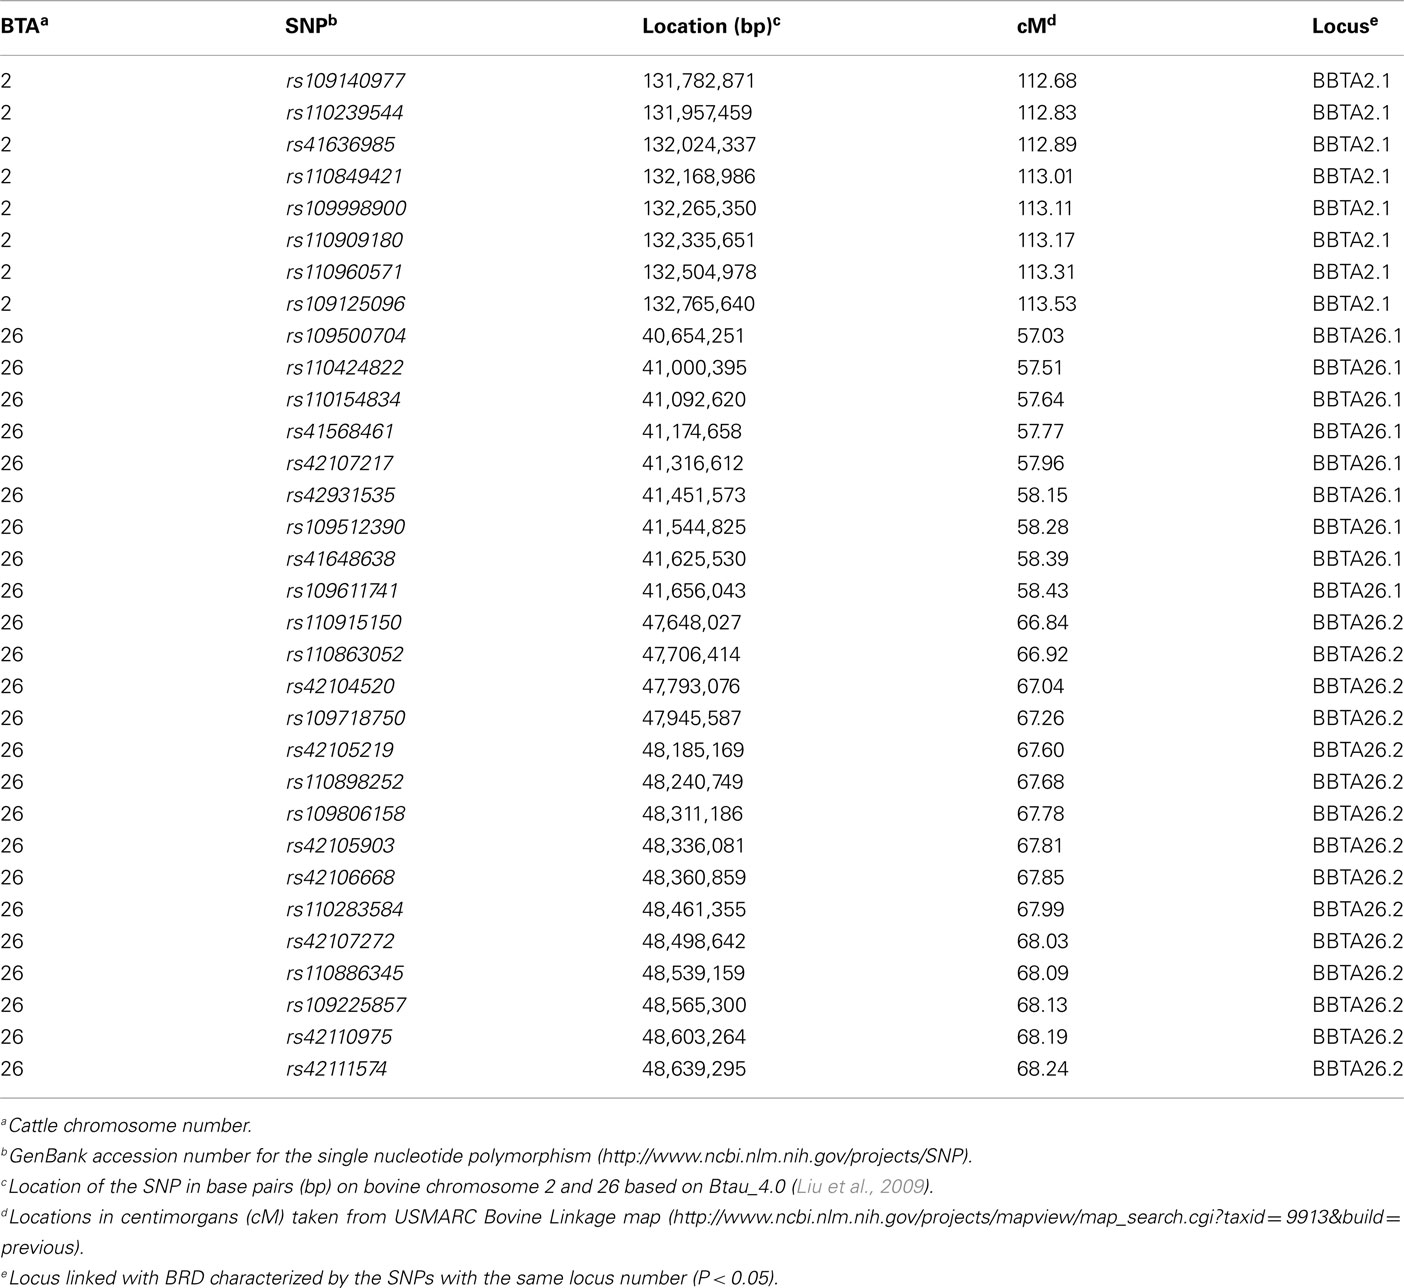
Table A3. Single nucleotide polymorphisms that represent the loci linked with bovine respiratory disease on BTA2 and BTA26 with half-sib Brangus and Braford families.
Keywords: single nucleotide polymorphism, bovine viral diarrhea, bovine respiratory disease, genetics, association linkage
Citation: Zanella R, Casas E, Snowder G and Neibergs HL (2011) Fine mapping of loci on BTA2 and BTA26 associated with bovine viral diarrhea persistent infection and linked with bovine respiratory disease in cattle. Front. Gene. 2:82. doi: 10.3389/fgene.2011.00082
Received: 09 July 2011;
Accepted: 31 October 2011;
Published online: 22 November 2011.
Edited by:
Miguel Perez-Enciso, Universitat Autonoma Barcelona, SpainReviewed by:
Miguel Perez-Enciso, Universitat Autonoma Barcelona, SpainHsiao-Ching Liu, North Carolina State University, USA
Copyright: © 2011 Zanella, Casas, Snowder and Neibergs. This is an open-access article subject to a non-exclusive license between the authors and Frontiers Media SA, which permits use, distribution and reproduction in other forums, provided the original authors and source are credited and other Frontiers conditions are complied with.
*Correspondence: Holly L. Neibergs, Department of Animal Sciences, Washington State University, PO Box 646353, Pullman, WA 99164-6353, USA. e-mail:bmVpYmVyZ3NAd3N1LmVkdQ==