 Martin Reczko1,2†
 Manolis Maragkakis1,3,4†
 Panagiotis Alexiou1,4,5
 Giorgio L. Papadopoulos1
 Artemis G. Hatzigeorgiou1*
- 1 Institute of Molecular Oncology, Biomedical Sciences Research Center “Alexander Fleming”, Vari, Greece
- 2 Synaptic Ltd., Heraklion, Greece
- 3 Institute of Computer Science, Martin Luther University Halle-Wittenberg, Halle, Germany
- 4 Department of Pathology and Laboratory Medicine, Perelman School of Medicine, University of Pennsylvania, Philadelphia, Pennsylvania PA, USA
- 5 School of Biology, Aristotle University of Thessaloniki, Thessaloniki, Greece
MicroRNAs (miRNAs) are a class of small regulatory genes regulating gene expression by targeting messenger RNA. Though computational methods for miRNA target prediction are the prevailing means to analyze their function, they still miss a large fraction of the targeted genes and additionally predict a large number of false positives. Here we introduce a novel algorithm called DIANA-microT-ANN which combines multiple novel target site features through an artificial neural network (ANN) and is trained using recently published high-throughput data measuring the change of protein levels after miRNA overexpression, providing positive and negative targeting examples. The features characterizing each miRNA recognition element include binding structure, conservation level, and a specific profile of structural accessibility. The ANN is trained to integrate the features of each recognition element along the 3′untranslated region into a targeting score, reproducing the relative repression fold change of the protein. Tested on two different sets the algorithm outperforms other widely used algorithms and also predicts a significant number of unique and reliable targets not predicted by the other methods. For 542 human miRNAs DIANA-microT-ANN predicts 120000 targets not provided by TargetScan 5.0. The algorithm is freely available at http://microrna.gr/microT-ANN.
Introduction
MicroRNAs (miRNAs) are ∼21 nt short RNA molecules that have been found to confer a novel layer of genetic regulation in a wide range of biological processes. They induce protein repression through translation repression or mRNA degradation. The involvement of miRNAs in cellular commitment and cell cycle regulation makes them important in both animal development and human disease (Ambros, 2004; Filipowicz et al., 2008). The first miRNAs and their targets were identified in 1993 via classical genetic techniques in C. elegans (Lee et al., 1993), but it was not until 2001 that they were found to be widespread and abundant in human cells (Lagos-Quintana et al., 2001; Lau et al., 2001; Lee and Ambros, 2001). This was also the impetus for the development of the first computational target prediction programs (Enright et al., 2003; Lewis et al., 2003; Stark et al., 2003; Kiriakidou et al., 2004) which led to the experimental identification of dozens of miRNA targets. Such experimentally supported and validated targets are collected in TarBase (Sethupathy et al., 2006; Papadopoulos et al., 2009b), showing an exponential increase between 2004 and 2009.
In parallel more than a dozen target prediction programs were developed while some of the first generation of programs was improved (Bartel, 2009). Features common to many of the prediction programs are the alignment of the miRNA seed region (2–7 nt starting from the 5′ end) to the 3′untranslated region (3′UTR) of a protein coding gene and the use of evolutionary conservation of miRNA recognition elements (MREs). A part of these programs combine scores of several MREs to a miRNA target gene (miTG) score using an additive or a hidden Markov model (HMM; Krek et al., 2005). Additional features such as structural accessibility of the target site, binding of the 3′ end of the miRNA, nucleotide composition of the region flanking the target site, location within the 3′UTR, and a conservation score based on phylogeny have been added to several programs (Brennecke et al., 2005; Gaidatzis et al., 2007; Grimson et al., 2007; Kertesz et al., 2007; Hammell et al., 2008). Until recently, the evaluation of such programs was based on a limited number of experimental validations or/and statistical approaches that calculated a signal to noise ratio (SNR) using targets of randomized (mock) miRNA sequences as background (Krek et al., 2005; Lewis et al., 2005).
The first high-throughput data on miRNA targets was measured in microarray gene expression experiments (Krutzfeldt et al., 2005; Lim et al., 2005), where a miRNA was either overexpressed or silenced. This method may identify a group of differentially expressed genes that are degraded through the interaction with a miRNA but is insensitive to the targets that are affected only at the translational level. Thus it can correctly identify only part of the positive data (targeted genes with messenger RNA (mRNA) degradation) and provides insufficient information for the negative data (untargeted genes).
As a recent major step toward understanding the complete effect of individual miRNAs, two groups have independently characterized miRNA-mediated gene expression changes at both the mRNA and protein level (Baek et al., 2008; Selbach et al., 2008). Selbach et al. used microarrays and pulsed stable isotope labeling with amino acids in cell culture (pSILAC) assays to determine the targets of five over or under expressed miRNAs in HeLa cells, while Baek et al. used similar methods for four miRNAs. Both methods include a fraction of indirect targets from secondary effects, but the accompanying computational analyses show a strong enrichment of targets sites for the relevant miRNA, indicating analog a strong enrichment in direct targets. This data currently provides trough their high-throughput nature one of the best approximation for both the positive and negative targeting information for several miRNAs and thousands of proteins.
Additionally, high-throughput CLIP data now allows for the direct identification and localization of MREs on the target genes (Chi et al., 2009). This type of data is used here as an accurate independent test set.
Here we introduce DIANA-microT-ANN, the first artificial neural network (ANN) miRNA target prediction algorithm, trained and tested on this type of high-throughput data (Figure 1A). The ANN is designed with a recurrent architecture which has been shown to be effective in financial (Quek et al., 2008), speech recognition (Robinson et al., 2002), and other biosequence analysis applications (Reczko and Hatzigeorgiou, 2004). One neural layer recognizes an MRE and the recurrent layer integrates the targeting signals for the whole 3′UTR (Figure 1B).
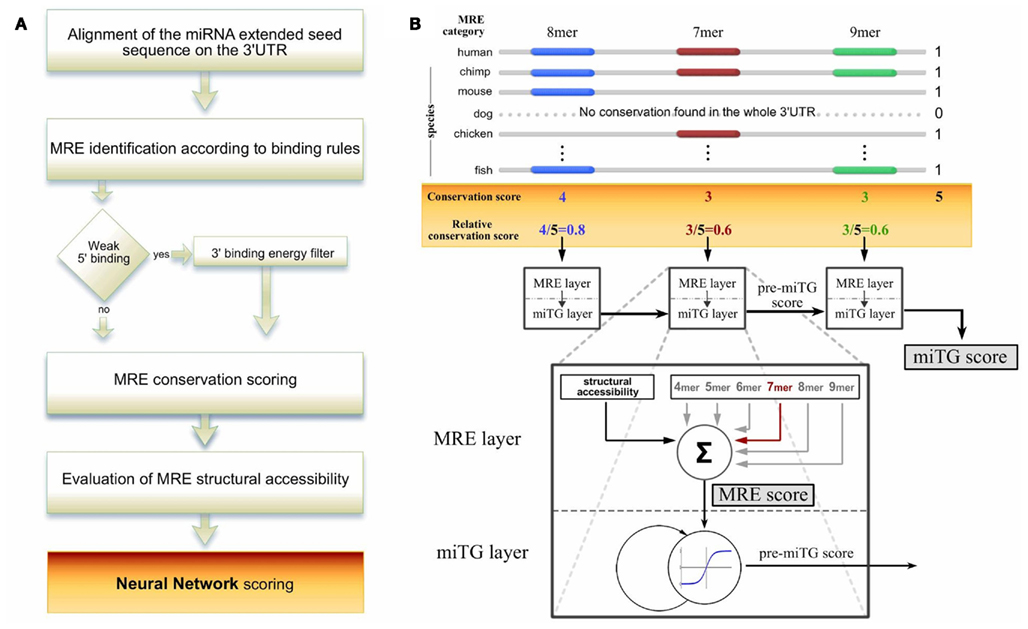
Figure 1. The DIANA-microT-ANN algorithm pipeline. (A) A schematic overview of the algorithm. The miRNA extended seed sequence is aligned to the 3′UTR of protein coding genes and identifies putative miRNA recognition elements (MREs) based on structure specific binding rules. For weak binding sites the algorithm additionally applies a free binding energy filter. For all identified MREs the conservation and structural accessibility profile is retrieved. The final prediction score is calculated by a recurrent artificial neural network (ANN) which combines all the features of the MREs on the 3′UTR. (B) Calculation of the relative MRE conservation and ANN design. An example is illustrated where the maximum number of species showing any conservation within the 3′UTR is 5. The MRE relative conservation is the number of species in which the MRE is conserved divided by this maximum. All MRE features are presented to the ANN in the MRE layer using a vector with seven components. The first component is the structural accessibility value of the MRE. The following six components correspond to the binding structure classes and have as value the relative conservation score. This vector is the input to a linear neuron that assigns the MRE score by multiplying the features with seven weights. The MRE score is the input to a non-linear neuron in the miTG layer to collect the miTG score. Using a feedback connection, this neuron simulates a saturation effect through a non-linear integration of the MRE scores. The network processes sequentially each MRE as it occurs on the 3′UTR. At each MRE the activity collected as the pre-miTG score from the previous MREs is multiplied with the weight on the feedback connection, added to the current MRE score and passed through a non-linear threshold function. The output is the current pre-miTG score at this particular MRE. After processing the last MRE, this activation is assigned as the final miTG score and reflects the degree of downregulation of the coding gene based on the particular UTR.
The program identifies putative miRNA binding sites through alignment of an extended seed region (1–9 nt from 5′ of the miRNA; Figure 2A) and calculates the selected features of these sites (binding type, minimal thermodynamic energy, evolutionary conservation, and structural accessibility). The ANN is trained to reproduce experimentally measured protein repression rates and thus its final output better reflects the strength of the miRNA:target gene (miTG) interaction. Different user requirements with respect to the prediction sensitivity are supported with three optimized score cutoffs that may also be used to adjust an additional functional analysis tool based on target enrichment in pathways.
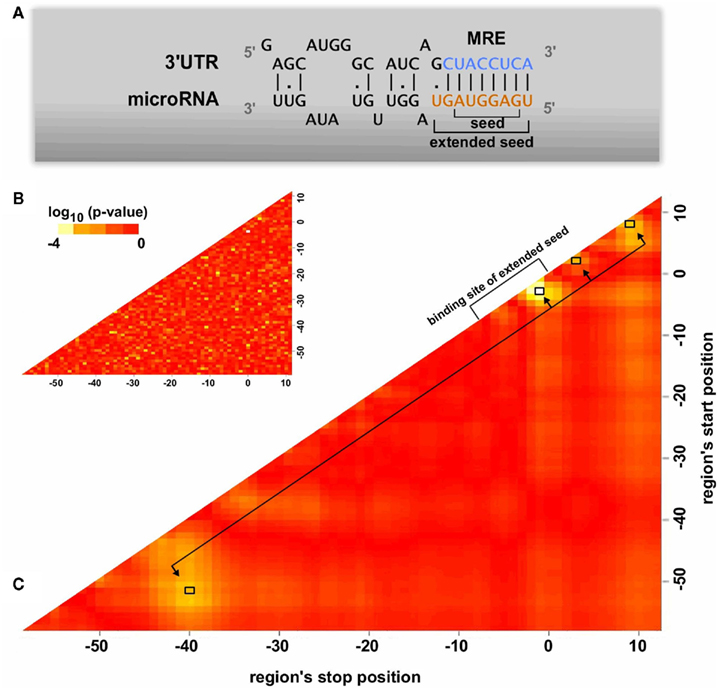
Figure 2. Features of the miRNA binding region. (A) A schematic overview of the miRNA binding on the 3′UTR of protein coding genes. The seed and the extended seed sequence of the miRNA have been noted in the graph. (B,C) Identification of significant regions in terms of structural accessibility. The structural accessibility of different regions flanking the predicted MREs is compared between targeted and non-targeted genes through a Wilcoxon two-sided test. Each point on the heatmap corresponds to a region whose start position is indicated on the x axis and stop position on the y axis. Heatmap B has been created by randomly categorizing the genes as targeted or not targeted, serving as an estimate of the randomness in the analysis. In both heatmaps the seed of the miRNA corresponds to region 0–8. Heatmap C indicates four significant regions (−51 to −40, −3 to −1, 2 to 3, 8 to 9) which have significant accessibility differences between putative MREs of targeted and non-targeted genes. The average accessibility of these regions has been used as an MRE property in the artificial neural network training.
The program is tested on the proteomics data (using crossvalidation) and on an independent high-throughput dataset from a HITS-CLIP experiment. In these tests microT-ANN outperforms other frequently used miRNA prediction algorithms.
Materials and Methods
Proteomics Data
The miRNA-mediated protein expression changes of Selbach et al. (2008) available at http://psilac.mdc-berlin.de are used. From this set, the changes while overexpressing the miRNAs hsa-mir1, hsa-mir16, hsa-mir30a, hsa-mir155, and hsa-let-7b as well as the changes after knockdown of hsa-let-7b are used. Each RefSeq protein ID is converted to the corresponding Ensembl Gene ID (Ensembl release 48; Flicek et al., 2008). There are only 120 RefSeq protein IDs that corresponded to multiple Ensembl IDs, and of these 20 corresponded to multiple Ensembl IDs with different 3′UTR lengths. For these cases, the Ensembl ID corresponding to the longest 3′UTR is used. In total 15806 measurements for potential miRNA:gene interactions are identified for all five datasets.
MiRNA Sequences
MiRNA sequences used for all predictions in DIANA-microT-ANN are taken from miRBase Build 10.0.
Gene Sequences
The 3′UTR sequences for each gene used are the longest annotated transcript from Ensembl 47.
Multiple Alignments
Multiple genome alignments (Karolchik et al., 2007) are downloaded from UCSC Genome Browser. Human (hg18) alignment to the following 16 vertebrate genomes are used: panTro1, rheMac2, rn4, mm8, oryCun1, bosTau2, canFam2, dasNov1, loxAfr1, echTel1, monDom4, galGal2, xenTro1, tetNig1, fr1, danRer3, and Mouse (mm9) alignment to the following 16 vertebrate genomes are used: rn4, oryCun1, hg18, panTro2, rheMac, canFam, bosTau3, dasNov1, loxAfr1, echTel, monDom4, galGal3, xenTro2, tetNig, fr2, danRer5.
MRE Identification
A dynamic programming algorithm identifies the best alignment between the miRNA extended seed sequence and every 9 nt window on the 3′UTR. The alignment is initially restricted so as the pairing of the miRNA extended seed with the 9 nt window begins at position 1 or 2 of the miRNA extended seed. A minimum of four consecutive Watson–Crick (WC) binding nucleotides is required starting at position 1 or 2 of the miRNA extended seed. A single G:U wobble pair is allowed for binding sites with more than six consecutive WC binding nucleotides. A single bulge or mismatch is allowed for binding sites with eight WC binding nucleotides. Table A1 in Appendix summarizes the allowed binding categories.
Hybrid Energy Restrictions for the Identification of Putative miRNA Binding Sites
All binding sites with less than six consecutive WC matches (4mers, 5mers) as well as sites containing a binding imperfection (wobble, bulge, mismatch) are filtered based on their free binding energy. The free binding energy between the mature miRNA sequence and the corresponding 3′UTR sequence is calculated using RNAhybrid (Rehmsmeier et al., 2004). The binding energy of the duplex of a miRNA and its reverse complement sequence is considered as the perfect complement energy. The site under consideration is only selected if the ratio of its free binding energy versus the perfect complement energy is higher than a threshold determined for each binding category as described below. The threshold for a 7mer binding site with a wobble for is 0.7. For all other binding sites with imperfections it is 0.6. For 4mers and 5mers the threshold is 0.4.
Calculation of Energy Thresholds for Complementary Matches
Energy thresholds are calculated based on the comparison of real miRNA sequences versus shuffled miRNA sequences. Shuffled miRNA sequences are designed to have the same extended seed sequence as the real miRNA but a shuffled 3′ end with the same nucleotide composition as the real miRNA. The free binding energy ratio e is defined as the ratio of the free binding energy of the miRNA:3′UTR heteroduplex at this position over the theoretical free binding energy between the mature miRNA sequence and its reverse complement. For each binding category, and for each free binding energy ratio e, the number of putative binding sites of real miRNAs Nr(e) and shuffled miRNAs Ns(e) that have energy ratios equal or greater than e are counted. The ratio R(e) = Nr(e)/Ns(e) indicates how much more prevalent the free binding energy e for real binding sites is, compared to the shuffled ones. The energy thresholds for each binding category are chosen at the point where the ratio R(e) becomes greater than 2.
Conservation Assessment
The algorithm assesses the evolutionary conservation of all identified MREs by calculating a conservation score based on 16 species. An initial filter retains only MREs that are conserved at all matching positions of the seed in at least three species. For these MREs the conservation score is defined as the ratio of the number of species in which the binding positions of the extended seed region are conserved versus the respective number using the maximal number of species having any conservation in the whole 3′UTR region.
Structural Accessibility Estimation
To provide an accurate estimate of structural accessibility with reasonable computational complexity the statistical sampling for the occurrence of single stranded regions as implemented in the Sfold program (Ding et al., 2004) is used. To reduce computational complexity, long transcripts (>800 nt) are divided in regions of 450 nt in length with an overlap of 150 nt between consecutive regions. The structural accessibility for each nucleotide located in the overlapping part between two consecutive regions is selected from the closest 450 nt region.
Artificial Neural Network Design and Training
Artificial neural networks are algorithms using simplified models of natural neurons to simulate their classification and learning capabilities. These models usually map patterns onto neural activities that can be interpreted as class probabilities. An ANN is characterized by a collection of neurons that are interconnected with adaptable weights. For their successful application in miRNA target prediction, a suitable selection and representation of the features used as input patterns has to be found. For a miRNA mi targeting a gene k, this interaction is denoted as miTGmi,k. It has a total of nMREs(mi,k) MREs conserved in all extended seed positions of at least three other species and each MRE is assigned an MRE scorei using

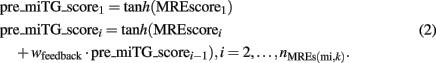
where categ is the binding category and acci the average accessibility of the MRE, relconsi is the conservation score of the MRE and is defined as the ratio of the number of species in which the binding positions of the extended seed region are conserved versus the respective number using the maximal number of species having any conservation in the whole 3′UTR region. The weight wacc, categ for the accessibility vanishes for the 4mer and 5mer categories. This score is used to accumulate an internal value corresponding to the neural activity called pre_miTG_scorei using a non-linear feedback function defined by
The final miTG_score is obtained from the last pre_miTG_score with

To use the available high-throughput data measuring protein-fold changes (proFCmi,k) induced by overexpression of miRNA mi, the networks scores are required to approximate the measured fold changes by minimizing the error

where g(fc) = min[max(−2.5fc, 0),1] is a clamping function to consider only the initial range of downregulation and minimizing the effect of outliers. All weights and the bias in this network are adapted with a generating set search method (Kolda et al., 2003) by using a fivefold leave-one-out crossvalidation of the measurements in the overexpressed miRNA data sets of Selbach et al. (2008) to minimize (4). Performance measurements on this data was obtained from each single network not containing the tested miRNA in its training set. Final testing on novel data is performed by using the average score of the jury of the five different networks. For each predicted miTG we report also a precision metric which corresponds to the probability of a prediction being a true target. This is calculated by comparing the predictions to a random background as described in (Maragkakis et al., 2009a).
Results
Design of Artificial Neural Network Model for miRNA Targeted Genes
Artificial neural networks are algorithms using simplified models of natural neurons to simulate their classification and learning capabilities. These models usually map patterns onto neural activities that can be interpreted as class probabilities. An ANN is characterized by a collection of neurons that are interconnected with adaptable weights. For their successful application in miRNA target prediction, a suitable selection, and representation of the features used as input patterns has to be found. To generate these features a collection of potential MREs is calculated by aligning the extended miRNA seed to each 3′UTR and retaining all matches between 4 and 9 nt that pass a binding energy filter. MRE binding sites are mapped to six classes based on their structure (see Supplementary Material). Each MRE can be characterized by a large number of features such as: local AU composition, location on the 3′UTR, minimal thermodynamic energy of the miRNA:mRNA duplex, conservation, and structural accessibility. Extensive training is performed to identify the most significant feature combination characterizing a miRNA:target gene interaction (data not shown). The three features identified are the binding structure type of the MRE, the conservation, and the structural accessibility of the MRE. The resulting network architecture shown in Figure 1.
The MRE conservation score is based on a normalization procedure to adjust to the overall conservation of the 3′UTR region. This relative conservation information is collected at the binding positions of the extended seed in 16 different species (see Materials and Methods).
Target site accessibility has been shown to be a common prerequisite of effective MREs (Kertesz et al., 2007; Long et al., 2007). In order to assess its effect on MRE functionality, we scan for regions with significant differences in accessibility between putative MREs of targeted and non-targeted genes. Structural accessibility is predicted in a 300 nt region around each MRE using the Sfold (Ding et al., 2004) program. The measurements produced by Selbach et al. (2008) are divided into a downregulated set consisting of predicted MREs of genes having a log2(protein-fold change) < −0.2 and a control set with log2(protein-fold change) > 0.2. All possible regions flanking each putative MRE from 50 nt upstream to 12 nt downstream of the miRNA extended seed binding position are tested by calculating the average accessibility of the nucleotides within the region. These averages are then compared between the targeted and non-targeted set using Wilcoxon rank sum tests to assign significance scores to each region. This analysis as shown in (Figures 2B,C) identifies four significant regions which relative to the start of the MRE extended seed binding position are located at: −51 to −40 nt, −3 to −1 nt, 2 to 3 nt, and 8 to 9 nt. The interesting enrichment of accessible sites at the 11 nt region starting 51 nt upstream of the start of the MRE and the absence of any significant accessibility between this region and the end of the MRE together with the higher accessibility on and close to the MRE, suggests a potential presence of closed structural elements on the UTR that may guide further experimental studies. Selecting and averaging the accessibility in these specific locations leads to higher prediction accuracy than using an average accessibility over regions of various sizes.
The ANN sequentially processes the relative conservation and accessibility of each MRE as they occur on the 3′UTR and assigns an MRE score by multiplying its features with the respective adaptive parameters (weights). In parallel it integrates all MRE scores into the final “miRNA targeted gene score” (miTG score) using a non-linear feedback loop (Figure 1B). More specifically, for a miRNA targeting a gene, each MRE is assigned an MRE score using the binding category, the average accessibility, and the conservation score of the MRE. This score is used to accumulate an internal value called pre_miTG_score using a non-linear feedback function. The final miTG_score is the last pre_miTG_score with an additive bias.
To use the available high-throughput data measuring protein-fold changes induced by the overexpression of a miRNA, the networks scores are required to approximate the measured fold changes. The log2 of the fold changes are mapped such that values smaller than −0.2 correspond to a score 1, values larger than 0 correspond to a score of 0 and all values between 0 and −0.2 are mapped linear to the scores between 0 and 1.
In this way, only the initial range of downregulation is considered and the effect of outliers is minimized. This approximation approach avoids the difficult assignment of a hard fold change cutoff for targeted proteins and performs better than grouping the proteins into a targeted and non-targeted class using this type of fixed threshold (data not shown). We are aware of the fact that not all downregulated proteins are direct targets of miRNA targeting. Using the threshold of −0.2 increases the likelihood to have a higher enrichment of direct targets in the positive data. During training, all weights and the bias in this network are optimized to minimize the error of the approximation.
An important issue in the application of machine learning methods is the assessment of generalization performance of the trained system. It has to be verified that the memory capacity of the learning system can perform equally well on novel data and does not only memorize feature combinations specific for the used training data. Therefore we use crossvalidated training, in which the available data is split into several partitions. Multiple learning systems are obtained by training on one partition and validating the performance on another partition. For the ANN described here a fivefold crossvalidated training and testing is performed, where five ANNs are trained with targets of four miRNAs and tested on the targets of the fifth. For the DIANA-microT-ANN web server, the five network prediction scores are averaged to form a jury prediction.
The straightforward architecture of the neural network with nine adaptable parameters facilitates an interpretation of the learned values, as seven weights correspond to the features of the MRE and the weight on the feedback connection corresponds to the importance of multiple, potentially weaker target sites on the UTR. The weights (shown in Figure A2 in Appendix) for the short (non-canonical) seeds binding only with 4 or 5mers have small negative values, suggesting that the presence of non-functional target sites has an overall negative influence on the effectivity of downregulating the protein levels, potentially interfering with other functional sites. This observation is confirmed by excluding all sites of the 4 and 5mer categories and retraining, which leads to significantly worse prediction performance.
Determination of Useful Score Threshold Cutoffs
In order to provide the choice of multiple reasonable prediction sensitivities, we use different criteria to determine a loose, medium, and strict score cutoff with increasing prediction precision (fraction of predicted targets that are correct) and decreasing sensitivity. For all threshold calculations the crossvalidated results on the training data are used, selecting always the network that has not been trained on the tested miRNA. During testing we consider as positive data the 2406 genes that have a respective log2 protein-fold change below −0.2 after the overexpression of a miRNA. The loose threshold is obtained from the score distribution of targeted and non-targeted genes that shows a bimodal shape that can be separated at a cutoff of 0.33 (see Figure A1 in Appendix). The medium threshold of 0.41 is determined to achieve precision at approximately 50% while the strict threshold of 0.6 is chosen to provide the highest precision of 65%. The relation of prediction sensitivity and precision for different score cutoffs is visualized in Figure 3. It has to be noted that the fold change threshold of −0.2 used here differs from the one used by Selbach et al. (2008) (−0.1) and therefore produces differences in the comparison measurements. In detail, using a fold change threshold of −0.1 to define the number of targets considered as positive increases the precision values to 62 and 74% for the loose and strict threshold respectively.
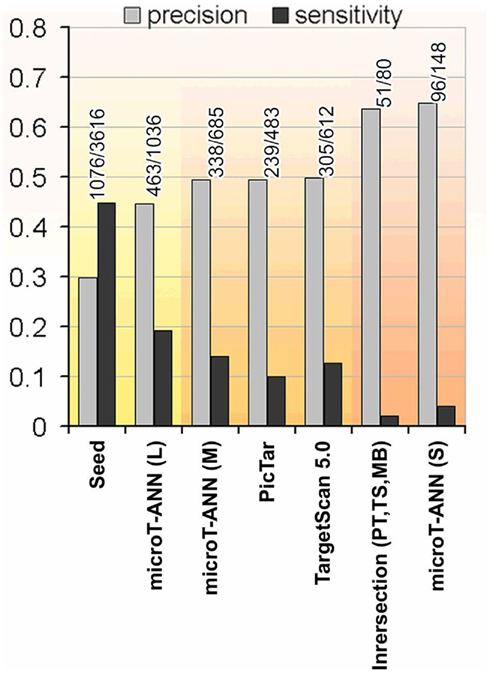
Figure 3. The precision and sensitivity of representative target prediction methods tested on the proteomics data. The tested programs are: Pictar, TargetScan 5.0, and DIANA-microT-ANN using the suggested three different score cutoffs denoted as strict (S), medium (M), and loose (L). Additionally the performance of a seed occurrence measure, detecting genes containing at least one occurrence of the miRNA seed is shown as a very sensitive prediction criterion, and the commonly used intersection of the predicted targets of Pictar, TargetScan 5.0, and miRBase as a very strict and precise measure. Three groups are highlighted indicating the methods with high sensitivity, medium, and high precision (from left to right).
Cross Validated Testing on pSILAC Measurements and on HITS-CLIP Data
In order to evaluate the performance of DIANA-microT-ANN with other frequently used target prediction programs we performed two extensive tests. First we used the data from Selbach et al. (2008) and the five trained ANNs. As mentioned before the crossvalidation training used here omits four of the five trained ANNs during testing and therefore serves for an unbiased comparison. At the medium threshold where all three programs have a similar prediction precision (or positive predictive value) of around 49% DIANA-microT-ANN achieves the highest sensitivity of 14% compared to 9.9% for PicTar (Lall et al., 2006) and 12.7% for TargetScan 5.0 (Friedman et al., 2009). Assessing the uniqueness of each program’s predictions, DIANA-microT-ANN has with 14% the largest fraction of correct targets not predicted by any other program (Figures 4A,B). When we further analyze the 245 miTGs predicted by DIANA-microT-ANN but missed by TargetScan 5.0 we identify that 106 of them are predicted correctly by our approach. These targets constitute the novel predictions and amount to around 20 targets per miRNA when tested on the genes for which pSILAC measurements were available. These genes are only 1/5 of all known genes and we thus expect around novel 80 targets per miRNA for all genes. Extrapolating this fraction to the predicted targets for 542 miRNAs for which both our approach and TargetScan 5.0 provide predictions, we identify approximately 120000 miTGs predicted by DIANA-microT-ANN alone, expecting more than 40000 to be correct. In a comparison with three other target prediction programs DIANA-microT-ANN constantly achieves the best results (Figure 3) and at the strict threshold its performance exceeds even the commonly used intersection of predictions of TargetScan 5.0, PicTar, and the miRanda program used in miRBase-Targets (Enright et al., 2003), obtaining both a slightly increased precision as well as an almost twofold sensitivity. In addition, assessing the performance of DIANA-microT-ANN on the hsa-let-7b pSILAC knockout data (see Materials and Methods) yields analogous results to those derived for the five miRNAs already mentioned. At a similar prediction precision for all three programs of around 23% corresponding to the medium threshold of DIANA-microT-ANN, our approach achieves a sensitivity of 12% in comparison to 10% for PicTar, and 11% for TargetScan 5.0.
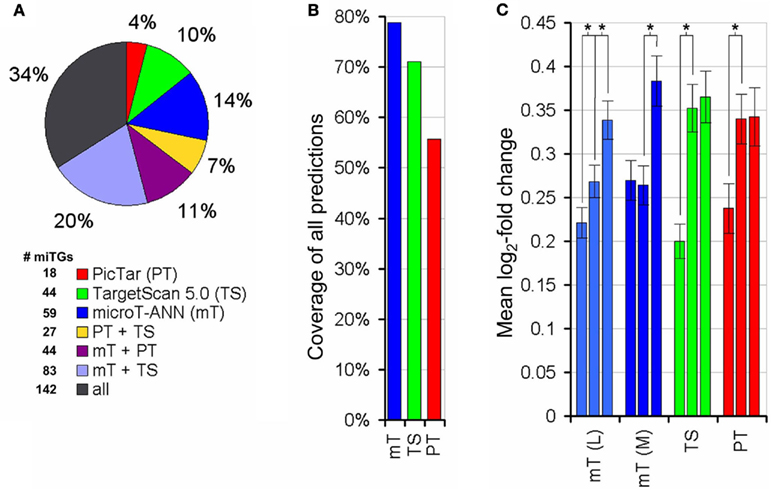
Figure 4. Performance comparison on the proteomics data. (A) Percentage of targets predicted by DIANA-microT-ANN, PicTar, or TargetScan 5.0 alone or in different combinations of them. The whole pie corresponds to the correct targets [log 2 (fold change) < −0.2, as measured by Selbach et al., 2008) predicted by any of the three programs. For PicTar and TargetScan 5.0 all of their suggested targets are used while the “medium” score threshold (0.41) is used for DIANA-microT-ANN giving all programs approximately equal precision (or positive predictive value, the fraction of predicted targets that are correct) levels. The number of predicted targeted genes (miTGs) corresponding to the fractions in the pie chart are shown next to the legend. (B) Coverage of each program in all combined predictions. DIANA-microT-ANN misses 21% of all predictions, compared to PicTar and TargetScan 5.0 which miss 35 and 29% respectively. (C) Significance of the prediction scores of DIANA-microT-ANN, PicTar and TargetScan 5.0 in relation to the protein repressions. All predicted targets [mT(L) = DIANA-microT-ANN (loose threshold, 1036 targets), mT(M) = DIANA-microT-ANN (medium threshold, 733 targets), TS = TargetScan5 (612 targets), PT = PicTar (483 targets)] are sorted according to their prediction scores and divided into three equal-sized bins. Significant differences between adjacent groups are indicated (asterisk, P < 0.005, Mann–Whitney U-test). The predictions of DIANA-microT-ANN are the only showing significant differences between the middle and top third, both at loose and medium threshold. For PicTar and TargetScan 5.0 only the lower and middle third of the predictions have significant differences in their protein-fold changes.
Additionally we noticed that the training of the ANN using the relative fold changes results in a biologically meaningful ranking of the targets and helps in the interpretation of the score. Comparing the predicted scores with measured fold changes for all proteins predicted as targeted, an almost linear relation can be observed for DIANA-microT-ANN using a loose score threshold (Figure 4C). When considering the targets predicted by the program at the medium threshold that results in a total number of predictions comparable to PicTar and TargetScan 5.0, the top third predictions of DIANA-microT-ANN are significantly more responsive than the middle third (P < 0.005, Mann–Whitney U-test), indicating the value and higher relevance of the top-scoring predictions.
With the jury ANN we perform an additional independent evaluation on a high-throughput data set. In (Chi et al., 2009), the authors use Ago HITS-CLIP data to identify binding sites of miRNAs expressed in the mouse brain. In their analysis they isolated two different sets of data. The first corresponds to miRNA binding sites and the second one to miRNA sequences. Mapping the above mentioned data to the genome and analyzing them we identified 30 miRNAs which are most probably expressed in the specific tissue. In order to identify the binding sites of each of these miRNAs we performed a seed match prediction on the 3′UTRs of the genes and the identified matches were filtered to keep only those which overlap with any of the 356743 identified peaks of the HITS-CLIP data. Overall this analysis resulted in 2065 positive miRNA:gene interactions which have been used for the evaluation of the target prediction algorithms. The sensitivity and precision of the predictions of DIANA-microT-ANN, Tagetscan 5.0, and PicTar, averaged of all miRNAs contained in the test set are shown in Figure 5, where in comparison with the other programs both a higher precision for the top-scoring targets and a higher final sensitivity can be observed for DIANA-microT-ANN.
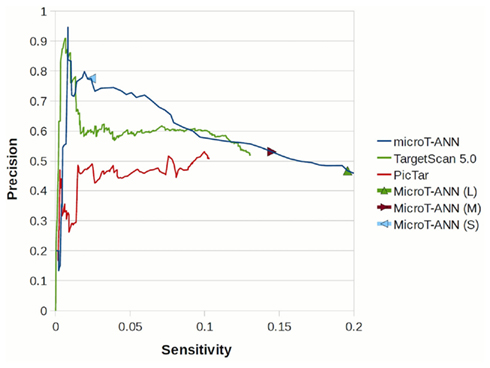
Figure 5. Sensitivity – precision plot for DIANA-microT-ANN, PicTar, and TargetScan 5.0 predictions on the HITS-CLIP dataset of Chi et al. (2009). By lowering the score cutoff, the precision of each algorithm (the fraction of the supported targets correctly predicted, averaged over all miRNAs) is shown versus the sensitivity for that cutoff. The performance of DIANA-microT-ANN at the strict, medium, and loose score cutoffs are also indicated.
Discussion
A commonly used strategy to increase the specificity of predicted targets is to use the intersection of the outcome of more than one target prediction program. A frequent combination is the intersection of TargetScan, PicTar, and the miRanda method of miRBase-Targets (Liang, 2008; Tian et al., 2008), as these programs are currently available at miRBase (Griffiths-Jones et al., 2008). In an extended comparison on the Selbach et al. (2008) data using a fold change cutoff of −0.2 to distinguish between targeted and non-targeted genes, we tested the prediction sensitivity and precision of all possible combinations of 10 different target prediction programs either for the union or the intersection of their results. Figure 6 shows the sensitivity and precision of all union and intersection combinations of the programs and the performance of DIANA-microT-ANN alone at various score cutoffs. Generally, even the best performing combinations do not significantly exceed the performance of the program described here alone. As an example for a possible improvement, the union of TargetScan 5.0 and DIANA-microT-ANN at the medium score cutoff achieves the same precision and a 3% higher sensitivity than DIANA-microT-ANN alone.
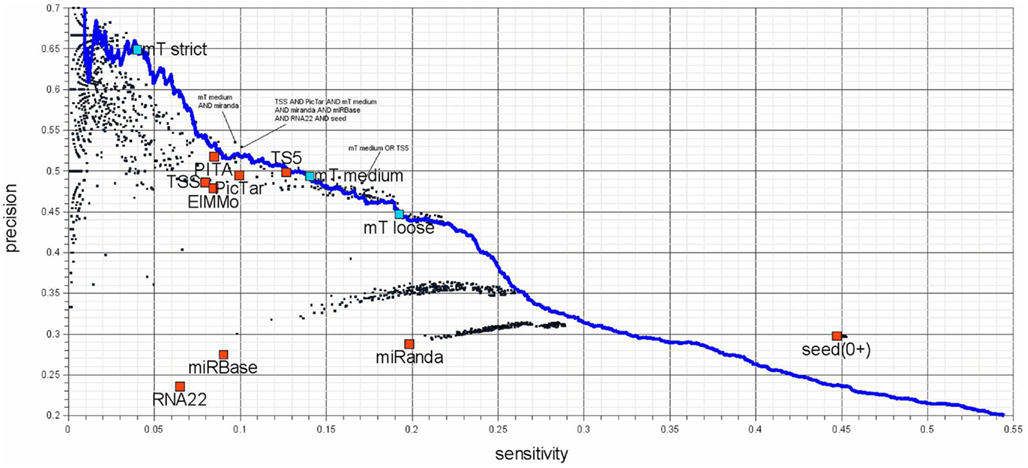
Figure 6. Sensitivity – precision plot for 10 target-predictors (red) and all possible combinations of their predictions (black). The performance of DIANA-microT-ANN is measured at the three suggested score cutoffs (blue squares) as well as at all other score cutoffs (blue line). Union combinations contain all target genes predicted by any of the combined programs and intersection combinations contain target genes predicted commonly by all of the combined programs. The investigated programs are PicTar (Lall et al., 2006), TargetScanS (Lewis et al., 2003), TargetScan 5.0 (Friedman et al., 2009), PITA (Kertesz et al., 2007), ElMMo (Gaidatzis et al., 2007), RNA22 (Miranda et al., 2006), miRanda (John et al., 2004; obtained from mirna.org), miRBase-Targets (Enright et al., 2003; miRanda algorithm provided by microrna.sanger.ac.uk), DIANA-microT-ANN, and additionally genes containing at least a single 6 nt long miRNA seed. Seed based predictions achieve a much higher sensitivity compared to some of the programs (the two miRanda programs and RNA22), without sacrificing precision. The seed measure is a good choice for a low-precision but very sensitive prediction. The remaining target prediction programs (PicTar, TargetScan 5.0, PITA, ElMMo, and DIANA-microT-ANN) achieve precision and sensitivity values of a similar range among them. It should be mentioned that although TargetScan 5.0 and DIANA-microT-ANN are very recent programs, PicTar is performing comparable using the same algorithm over the last few years. Their online predictions have not been updated regarding the number of new miRNAs reported in miRBase. Interesting combinations are marked in the figure and an exhaustive list of all combinations can be found in Table S1 in Supplementary Material.
The proteomics data used for training contains a certain amount of false negative targets. This depends directly on the used thresholds for the log2 of the level of protein expression changes. In Selbach et al. (2008) the threshold chosen was −0.1. We systematically tested this and two more cutoffs (−0.2, −0.3). We finally chose −0.2 as the cutoff which provides the best compromise of correct and false positive targets for training. The influence of the small amount of false positive data due to indirect targets in the proteomics data is assessed by the additional tests on the HITS-CLIP data, that serves to indicate only direct targets.
The majority of users of target prediction programs inspect only a few top-scoring predictions. For these users, our predictions obtained with a strict score cutoff are most useful. Averaged over 555 human miRNAs, 54 genes will be predicted as targeted with a strict cutoff, compared to 398 genes at the medium cutoff. Comparing to TargetScan 5.0 as the second best program on the tested proteomics data, DIANA-microT-ANN has a 10.1% higher precision at the same sensitivity and a threefold higher sensitivity to obtain the same prediction precision.
The algorithm is embedded in a user friendly web environment (Maragkakis et al., 2009a,b) that visualizes the scores for each target site on a gene, the species the site is conserved and the binding structure of the miRNA to the site and allows the adjustment of the score cutoff depending on the required sensitivity/specificity relations. The latter is not only useful for defining predicted targets with high specificity (strict threshold) as mentioned above but also equally important for defining targets of a miRNA with high sensitivity (loose threshold). For example DIANA-microT-ANN can predict with the medium score threshold 338 out of the 2226 genes that are showing a protein repression of fold change −0.2 in the Selbach et al. (2008) data. With the loose threshold the programs provides 125 more correct targets (463 out of 2226) with a prediction precision of 45%.
To integrate the predictions for miRNA repression within a systems biology framework, we provide the information regarding cellular pathways that are enriched in targets of one or more miRNAs (Papadopoulos et al., 2009a). Using the sensitive score this option can act also as a functional filter of larger sets of predicted miTGs and leads to smaller and functionally related miTG subsets with a graphical representation of their pathway relations. In the example shown in Figure 7, mir155 has an initial list of more than 600 targets that is reduced to around 10 targets on the enriched pathways. Interestingly when we evaluate the precision of the targets predicted with the loose score cutoff and mapped to the pathways with highest enrichment for each miRNA we measure a performance of 64% which matches almost the specificity using the strict threshold and is nearly 20% higher than if we consider all the targets independent of the pathways.
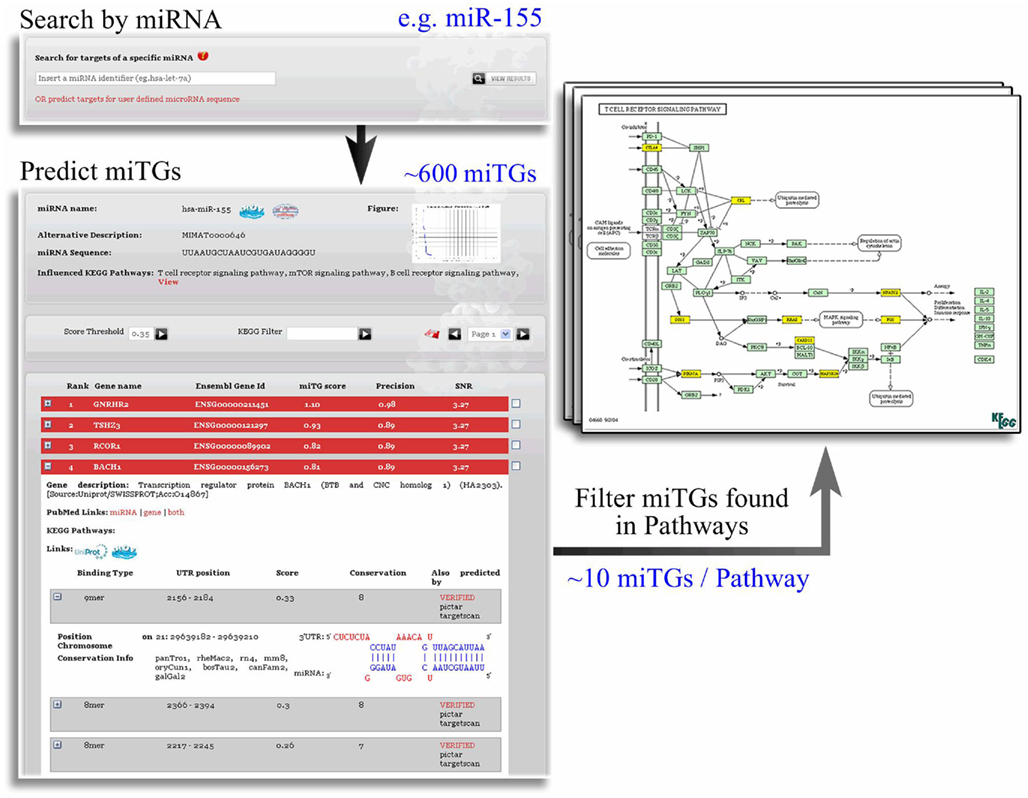
Figure 7. Integration of DIANA-microT-ANN and DIANA-mirPath. The functional filtering performed by DIANA-mirPath produces much smaller, functionally related, subsets of miTGs. The visualization of the miTG subsets in the pathway maps provides a direct indication of the overall influence of the miRNA in the pathway. Each set of genes predicted as targeted for a single miRNA are analyzed with DIANA-mirPath and the results are integrated in the DIANA-microT-ANN web server to illustrate the biological pathways enriched this set. The functional relation and interplay of the miTGs are provided in a graphically annotated network where only those few targets of the specific miRNA, implicated in the process of interest, are presented instead of the usually overwhelming list of predicted miTGs. The results of this enrichment analysis focus the set of targeted genes to a few pathways and usually increase prediction precision.
In conclusion, we introduce a novel approach for miRNA target prediction based on a machine learning approach trained on both positive and negative protein data from high-throughput proteomics experiments in order to optimize the separation of miTGs and non-miTGs and achieving highest performance. Through an iterative learning procedure a novel algorithm for miRNA target prediction learns to determine the best weights for each class of target sites on a UTR. The architecture of the recurrent ANN allows a better integration of multiple binding sites and together with the additional accessibility feature DIANA-microT-ANN improves sensitivity and is able to correctly predict a large fraction of target genes which are not reported by other frequently used programs. When we closer inspect the targets predicted only by DIANA-microT-ANN we notice significantly higher site accessibility and a significantly larger number of MREs.
The flexibility and scalability of the approach supports the straightforward implementation of several generations of miRNA target predictions programs. In particular, it can easily tackle the advent of other high-throughput miRNA induced proteomics data and the expected huge amounts of Argonaute tagged deep sequencing data that will pinpoint orders of magnitudes of real MREs.
Conflict of Interest Statement
The authors declare that the research was conducted in the absence of any commercial or financial relationships that could be construed as a potential conflict of interest.
Acknowledgments
We thank N. Koziris of the National Technical University of Athens for providing their computational cluster to conduct experiments and supporting all DIANA-microT-ANN web services.
Supplementary Material
The Supplementary Material for this article can be found online at http://www.frontiersin.org/Bioinformatics_and_Computational_Biology/10.3389/fgene.2011.00103/abstract
References
Baek, D., Villen, J., Shin, C., Camargo, F. D., Gygi, S. P., and Bartel, D. P. (2008). The impact of microRNAs on protein output. Nature 455, 64–71.
Brennecke, J., Stark, A., Russell, R. B., and Cohen, S. M. (2005). Principles of microRNA-target recognition. PLoS Biol. 3, e85. doi:10.1371/journal.pbio.0030085
Chi, S. W., Zang, J. B., Mele, A., and Darnell, R. B. (2009). Argonaute HITS-CLIP decodes microRNA-mRNA interaction maps. Nature 460, 479–486.
Ding, Y., Chan, C. Y., and Lawrence, C. E. (2004). Sfold web server for statistical folding and rational design of nucleic acids. Nucleic Acids Res. 32, W135–W141.
Enright, A. J., John, B., Gaul, U., Tuschl, T., Sander, C., and Marks, D. S. (2003). MicroRNA targets in Drosophila. Genome Biol. 5, R1.
Filipowicz, W., Bhattacharyya, S. N., and Sonenberg, N. (2008). Mechanisms of post-transcriptional regulation by microRNAs: are the answers in sight? Nat. Rev. Genet. 9, 102–114.
Flicek, P., Aken, B. L., Beal, K., Ballester, B., Caccamo, M., Chen, Y., Clarke, L., Coates, G., Cunningham, F., Cutts, T., Down, T., Dyer, S. C., Eyre, T., Fitzgerald, S., Fernandez-Banet, J., Graf, S., Haider, S., Hammond, M., Holland, R., Howe, K. L., Howe, K., Johnson, N., Jenkinson, A., Kahari, A., Keefe, D., Kokocinski, F., Kulesha, E., Lawson, D., Longden, I., Megy, K., Meidl, P., Overduin, B., Parker, A., Pritchard, B., Prlic, A., Rice, S., Rios, D., Schuster, M., Sealy, I., Slater, G., Smedley, D., Spudich, G., Trevanion, S., Vilella, A. J., Vogel, J., White, S., Wood, M., Birney, E., Cox, T., Curwen, V., Durbin, R., Fernandez-Suarez, X. M., Herrero, J., Hubbard, T. J., Kasprzyk, A., Proctor, G., Smith, J., Ureta-Vidal, A., and Searle, S. (2008). Ensembl 2008. Nucleic Acids Res. 36, D707–D714.
Friedman, R. C., Farh, K. K., Burge, C. B., and Bartel, D. P. (2009). Most mammalian mRNAs are conserved targets of microRNAs. Genome Res. 19, 92–105.
Gaidatzis, D., Van Nimwegen, E., Hausser, J., and Zavolan, M. (2007). Inference of miRNA targets using evolutionary conservation and pathway analysis. BMC Bioinformatics 8, 69. doi:10.1186/1471-2105-8-69
Griffiths-Jones, S., Saini, H. K., Van Dongen, S., and Enright, A. J. (2008). miRBase: tools for microRNA genomics. Nucleic Acids Res. 36, D154–D158.
Grimson, A., Farh, K. K., Johnston, W. K., Garrett-Engele, P., Lim, L. P., and Bartel, D. P. (2007). MicroRNA targeting specificity in mammals: determinants beyond seed pairing. Mol. Cell 27, 91–105.
Hammell, M., Long, D., Zhang, L., Lee, A., Carmack, C. S., Han, M., Ding, Y., and Ambros, V. (2008). mirWIP: microRNA target prediction based on microRNA-containing ribonucleoprotein-enriched transcripts. Nat. Methods 5, 813–819.
John, B., Enright, A. J., Aravin, A., Tuschl, T., Sander, C., and Marks, D. S. (2004). Human MicroRNA targets. PLoS Biol. 2, e363. doi:10.1371/journal.pbio.0020363
Karolchik, D., Hinrichs, A. S., and Kent, W. J. (2007). The UCSC genome browser. Curr. Protoc. Bioinformatics Chapter 1, Unit 1.4.
Kertesz, M., Iovino, N., Unnerstall, U., Gaul, U., and Segal, E. (2007). The role of site accessibility in microRNA target recognition. Nat. Genet. 39, 1278–1284.
Kiriakidou, M., Nelson, P. T., Kouranov, A., Fitziev, P., Bouyioukos, C., Mourelatos, Z., and Hatzigeorgiou, A. (2004). A combined computational-experimental approach predicts human microRNA targets. Genes Dev. 18, 1165–1178.
Kolda, T. G., Lewis, R. M., and Torczon, V. (2003). Optimization by direct search: new perspectives on some classical and modern methods. SIAM Rev. 45, 385–482.
Krek, A., Grun, D., Poy, M. N., Wolf, R., Rosenberg, L., Epstein, E. J., Macmenamin, P., Da Piedade, I., Gunsalus, K. C., Stoffel, M., and Rajewsky, N. (2005). Combinatorial microRNA target predictions. Nat. Genet. 37, 495–500.
Krutzfeldt, J., Rajewsky, N., Braich, R., Rajeev, K. G., Tuschl, T., Manoharan, M., and Stoffel, M. (2005). Silencing of microRNAs in vivo with ‘antagomirs’. Nature 438, 685–689.
Lagos-Quintana, M., Rauhut, R., Lendeckel, W., and Tuschl, T. (2001). Identification of novel genes coding for small expressed RNAs. Science 294, 853–858.
Lall, S., Grun, D., Krek, A., Chen, K., Wang, Y. L., Dewey, C. N., Sood, P., Colombo, T., Bray, N., Macmenamin, P., Kao, H. L., Gunsalus, K. C., Pachter, L., Piano, F., and Rajewsky, N. (2006). A genome-wide map of conserved microRNA targets in C. elegans. Curr. Biol. 16, 460–471.
Lau, N. C., Lim, L. P., Weinstein, E. G., and Bartel, D. P. (2001). An abundant class of tiny RNAs with probable regulatory roles in Caenorhabditis elegans. Science 294, 858–862.
Lee, R. C., and Ambros, V. (2001). An extensive class of small RNAs in Caenorhabditis elegans. Science 294, 862–864.
Lee, R. C., Feinbaum, R. L., and Ambros, V. (1993). The C. elegans heterochronic gene lin-4 encodes small RNAs with antisense complementarity to lin-14. Cell 75, 843–854.
Lewis, B. P., Burge, C. B., and Bartel, D. P. (2005). Conserved seed pairing, often flanked by adenosines, indicates that thousands of human genes are microRNA targets. Cell 120, 15–20.
Lewis, B. P., Shih, I. H., Jones-Rhoades, M. W., Bartel, D. P., and Burge, C. B. (2003). Prediction of mammalian microRNA targets. Cell 115, 787–798.
Liang, Y. (2008). An expression meta-analysis of predicted microRNA targets identifies a diagnostic signature for lung cancer. BMC Med. Genomics 1, 61. doi:10.1186/1755-8794-1-61
Lim, L. P., Lau, N. C., Garrett-Engele, P., Grimson, A., Schelter, J. M., Castle, J., Bartel, D. P., Linsley, P. S., and Johnson, J. M. (2005). Microarray analysis shows that some microRNAs downregulate large numbers of target mRNAs. Nature 433, 769–773.
Long, D., Lee, R., Williams, P., Chan, C. Y., Ambros, V., and Ding, Y. (2007). Potent effect of target structure on microRNA function. Nat. Struct. Mol. Biol. 14, 287–294.
Maragkakis, M., Alexiou, P., Papadopoulos, G. L., Reczko, M., Dalamagas, T., Giannopoulos, G., Goumas, G., Koukis, E., Kourtis, K., Simossis, V. A., Sethupathy, P., Vergoulis, T., Koziris, N., Sellis, T., Tsanakas, P., and Hatzigeorgiou, A. G. (2009a). Accurate microRNA target prediction correlates with protein repression levels. BMC Bioinformatics 10, 295. doi:10.1186/1471-2105-10-295
Maragkakis, M., Reczko, M., Simossis, V. A., Alexiou, P., Papadopoulos, G. L., Dalamagas, T., Giannopoulos, G., Goumas, G., Koukis, E., Kourtis, K., Vergoulis, T., Koziris, N., Sellis, T., Tsanakas, P., and Hatzigeorgiou, A. G. (2009b). DIANA-microT web server: elucidating microRNA functions through target prediction. Nucleic Acids Res. 37, W273–W276.
Miranda, K. C., Huynh, T., Tay, Y., Ang, Y. S., Tam, W. L., Thomson, A. M., Lim, B., and Rigoutsos, I. (2006). A pattern-based method for the identification of MicroRNA binding sites and their corresponding heteroduplexes. Cell 126, 1203–1217.
Papadopoulos, G. L., Alexiou, P., Maragkakis, M., Reczko, M., and Hatzigeorgiou, A. G. (2009a). DIANA-mirPath: integrating human and mouse microRNAs in pathways. Bioinformatics 25, 1991–1993.
Papadopoulos, G. L., Reczko, M., Simossis, V. A., Sethupathy, P., and Hatzigeorgiou, A. G. (2009b). The database of experimentally supported targets: a functional update of TarBase. Nucleic Acids Res. 37, D155–D158.
Quek, C., Pasquier, M., and Kumar, N. (2008). A novel recurrent neural network-based prediction system for option trading and hedging. Appl. Intell. 29, 138–151.
Reczko, M., and Hatzigeorgiou, A. (2004). Prediction of the subcellular localization of eukaryotic proteins using sequence signals and composition. Proteomics 4, 1591–1596.
Rehmsmeier, M., Steffen, P., Hochsmann, M., and Giegerich, R. (2004). Fast and effective prediction of microRNA/target duplexes. RNA 10, 1507–1517.
Robinson, A. J., Cook, G., Ellis, D., Fosler-Lussier, E., Renals, S., and Williams, D. A. G. (2002). Connectionist speech recognition of broadcast news. Speech Commun. 37, 27–45.
Selbach, M., Schwanhausser, B., Thierfelder, N., Fang, Z., Khanin, R., and Rajewsky, N. (2008). Widespread changes in protein synthesis induced by microRNAs. Nature 455, 58–63.
Sethupathy, P., Corda, B., and Hatzigeorgiou, A. G. (2006). TarBase: a comprehensive database of experimentally supported animal microRNA targets. RNA 12, 192–197.
Stark, A., Brennecke, J., Russell, R. B., and Cohen, S. M. (2003). Identification of Drosophila MicroRNA targets. PLoS Biol. 1, E60. doi:10.1371/journal.pbio.0000060
Tian, Z., Greene, A. S., Pietrusz, J. L., Matus, I. R., and Liang, M. (2008). MicroRNA-target pairs in the rat kidney identified by microRNA microarray, proteomic, and bioinformatic analysis. Genome Res. 18, 404–411.
Appendix
Table A1. Graphical examples for the allowed binding categories.
Figure A1. Determination of loose score threshold cutoff. The loose threshold is obtained from the score distribution of targeted and non-targeted genes on the Selbach et al. (2008) data that shows a bimodal shape that can be separated at a cutoff of 0.33. Score distributions on positive and negative data.
Figure A2. Average weights of the ANN after fivefold crossvalidation. Weights of the ANN averaged over the five validations. The error bars show the SE. The “4mer” to “9mer” weights are used to multiply with the relative conservation of the corresponding seed match size. “acc” Denotes the weight to the structural accessibility feature, “feedback” is the weight on the feedback connection and “bias” the bias term in Eq. 3.
Keywords: microRNAs, target prediction, binding site structure
Citation: Reczko M, Maragkakis M, Alexiou P, Papadopoulos GL and Hatzigeorgiou AG (2012) Accurate microRNA target prediction using detailed binding site accessibility and machine learning on proteomics data. Front. Gene. 2:103. doi: 10.3389/fgene.2011.00103
Received: 25 October 2011;
Paper pending published: 09 November 2011;
Accepted: 18 December 2011;
Published online: 18 January 2012.
Edited by:
Shaojie Zhang, University of Central Florida, USACopyright: © 2012 Reczko, Maragkakis, Alexiou, Papadopoulos and Hatzigeorgiou. This is an open-access article distributed under the terms of the Creative Commons Attribution Non Commercial License, which permits non-commercial use, distribution, and reproduction in other forums, provided the original authors and source are credited.
*Correspondence: Artemis G. Hatzigeorgiou, Biomedical Sciences Research Center “Alexander Fleming”, P.O. Box 74145, 16602 Varkiza, Greece. e-mail:aGF0emlnZW9yZ2lvdUBmbGVtaW5nLmdy
† Martin Reczko and Manolis Maragkakis have contributed equally to this work.