
 Ruitao Liu2

- 1 Department of Quantitative Health Sciences, Cleveland Clinic, Cleveland, OH, USA
- 2 Department of Statistics and Actuarial Science, University of Iowa, Iowa City, IA, USA
- 3 Center for Statistical Genetics, Pennsylvania State University, Hershey, PA, USA
- 4 Respiratory Institute, Cleveland Clinic, Cleveland, OH, USA
- 5 Department of Pathobiology, Cleveland Clinic, Cleveland, OH, USA
Haplotype analysis has been increasingly used to study the genetic basis of human diseases, but models for characterizing genetic interactions between haplotypes from different chromosomal regions have not been well developed in the current literature. In this article, we describe a statistical model for testing haplotype-haplotype interactions for human diseases with a case-control genetic association design. The model is formulated on a contingency table in which cases and controls are typed for the same set of molecular markers. By integrating well-established quantitative genetic principles, the model is equipped with a capacity to characterize physiologically meaningful epistasis arising from interactions between haplotypes from different chromosomal regions. The model allows the partition of epistasis into different components due to additive × additive, additive × dominance, dominance × additive, and dominance × dominance interactions. We derive the EM algorithm to estimate and test the effects of each of these components on differences in the pattern of genetic variation between cases and controls and, therefore, examine their role in the pathogenesis of human diseases. The method was further extended to investigate gene-environment interactions expressed at the haplotype level. The statistical properties of the models were investigated through simulation studies and its usefulness and utilization validated by analyzing the genetic association of sarcoidosis from a human genetics project.
1. Introduction
One important aspect of the genetic complexity of human diseases is that the effect of one gene depends on the expression of one or more other genes, regulated by environmental and developmental signals (Martin et al., 2002; Gabutero et al., 2007). Such dependence, called epistasis, is thought to pervade biological kingdoms and play a pivotal role in determining the genetic architecture of complex traits (Wu et al., 2004; Shao et al., 2008). Because of increasing recognition of the importance of epistasis, there has been an explosive interest over the past 5 years in modeling epistasis and estimating its effects on complex traits and diseases (Marchini et al., 2005; Purcell et al., 2007; An et al., 2009; Lambrechts, 2010; Wang et al., 2010; Wray and Goddard, 2010; Wu et al., 2010). With the continuous reduction of cost and time to generate high-throughput genotyping data, the analysis and detection of epistatic effects will become a routine procedure for genetic association studies, particularly in genome-wide association studies.
Most existing work of epistatic modeling focuses on the genetic interaction between individual genes and its different components, additive × additive, additive × dominance, dominance × additive, and dominance × dominance components, originally defined by Fisher (1918). Early geneticists incorporated Fisher’s theory into an experimental design by which gene-gene epistasis and its individual components can be tested and estimated using statistical models (Cockerham, 1954; Mather and Jinks, 1982). Epistatic modeling has been implemented in genetic mapping derived from an experimental cross or natural population, allowing the characterization of epistatic effects on any complex trait (Kao and Zeng, 2002; Wu et al., 2004, 2006). More recently, several researchers have incorporated epistasis into commonly used case-control genetic association studies (Zhang and Liu, 2007; Gayan et al., 2008) to accommodate the recent rapid development of genome-wide association studies. Most of these studies focus on the statistical definition of epistasis, i.e., the deviation from additivity of individual loci due to a non-linear relationship between multilocus genotypes and phenotypic variation in a population. This so-called statistical epistasis is a population concept depending on allele frequencies. In fact, epistasis has its own physiological meaning, in which the mutual dependence of multiple genes results from physiological interactions among biomolecules within gene regulatory networks and biochemical pathways in an individual (Cheverud and Routman, 1995; Moore and Williams, 2005).
In general, statistical epistasis can better be used in evolutionary genetics and plant breeding for complex traits (Hallauer et al., 2010), aimed to study the change of population means. Physiological epistasis is relevant to the medical genetics of complex diseases, interested in genotypic values of every individual. Liu et al. (2011) incorporated physiological epistasis into the contingency table of a case-control design by embedding Fisher’s epistatic definition (see also North et al., 2005). They have proved a favorable statistical property of epistatic test and showed increased power to detect epistasis using a simple χ2 test. Wang et al. (2010) derived a general model for analyzing epistasis of any number of genes in a case-control study, showing the importance of high-order epistasis in genetic control of human diseases.
With the availability of HapMap data (The International HapMap Consortium, 2003, 2005), a growing body of evidence shows that haplotypes, i.e., a sequence of alleles for single nucleotide polymorphisms (SNPs) on the same chromosomal region, may impact on a complex disease or trait in a different way from what individual alleles do (Judson et al., 2000; Bader, 2001; Rha et al., 2007). Computer simulation also demonstrates that haplotype analysis involving multiple SNPs may be more powerful than single SNP analysis (Collins et al., 1997; Akey et al., 2001; Morris and Kaplan, 2002; Zaykin et al., 2002). Before current array technologies can directly genotype haplotypes, we will always need a computational algorithm to estimate haplotype effects and variation based on a statistical mixture model (Liu et al., 2004; Huang et al., 2007).
The motivation of this article is to develop a general procedure for testing epistasis expressed at the haplotype level and its genetic components in genetic association studies. Lin and Wu (2006) developed a model for testing epistatic effects of haplotypes derived from the same genome on quantitative traits. This model was extended to study two-way interactions between different haplotypes expressed at the host genome and tumor genome in cancer research (Li and Wu, 2009) and three-way interactions among different haplotypes from the viral genome, transmitter genome, and recipient genome in infectious disease studies (Li et al., 2009). In this article, we combine these well developed haplotype-haplotype interaction models into a case-control design to test and characterize how different components of epistasis exert genetic effects on a complex disease. We extend this new procedure to allow a genome-wide search for the distribution and magnitude of epistatic interactions and gene-environment interactions expressed at the haplotype level through the genome. Unlike likelihood-based approaches proposed by Lake et al. (2003) and Lin and Zeng (2006), our proposed method is based on stratified contingency tables. By analyzing a real data set from the Cleveland Clinic Sarcoidosis project, the new model identified significant haplotype-expressed epistasis for sarcoidosis. The statistical behavior of the new model was tested and validated through simulation studies.
2. Methods
2.1. Study Design
We assume that a natural human population is at Hardy-Weinberg equilibrium (HWE), from which two groups of samples were drawn at random. The first group includes  cases who display a disease, and the second group includes
  controls with no disease. It is assumed that cases and controls are matched for potentially important covariates such as age, sex, ethnicity, geographical location, environmental factors, etc. All the cases and controls are genotyped for a panel of SNPs from different haplotype blocks.
Let us first consider two SNPs A and B from block 1 and two SNPs C and D from block 2, with the capital letters A, B, C, and D standing for major alleles and small letters a, b, c, and d for minor alleles at the corresponding SNPs. The four SNPs form a total of 81 genotypes. Let j1, j2, k1, and k2 denote the genotypes at SNPs A, B, C, and D, respectively, at each of which there are three genotypes denoted by 0, 1, and 2. These values stand for the homozygote of the minor allele, the heterozygote of the minor and major alleles, and the homozygote of the major allele, respectively; for example, j1 = 0 for aa, 1 for Aa, and 2 for AA at SNP A. Let  and
and  denote the numbers of the observations of four-SNP genotypes j1 at SNP A and j2 at SNP B from block 1 and k1 at SNP C and k2 at SNP D from block 2 in cases and controls, respectively. From the observations of four-SNP genotypes from two blocks, we calculate the marginal observations of two-SNP genotypes from each block, which are expressed as
A model will be developed to detect and test the effects on disease of haplotypes from each block and the interactions between different haplotypes from two blocks in the case-control study.
2.2. Detecting Risk Haplotype
2.2.1. Estimation of haplotype frequencies
Let us first consider two SNPs from block 1. In a recent book by Wu and Lin (2008), the EM algorithm with a closed form is given to estimate haplotype frequencies from unphased genotypic data. In our case, the complete data are the diplotype (haplotype) and disease status, but the observed data are genotypes and disease status, thus the missing data is the connection from genotypes to diplotypes (haplotypes). If subject i is a double heterozygote, A1A2B1B2, it may be one and only one of the two possible diplotypes. We use

to denote the proportion of diplotype AB|ab in the total amount of double heterozygote AaBb in cases and controls, respectively. Note AB|ab and Ab|aB denote two underlying diplotypes for genotype AaBb, where the vertical lines separate two chromosomes each derived from a different parent. Under HWE, the frequency of a diplotype is expressed as the product of frequencies of the two haplotypes that constitute the diplotype. Thus, we have PAB|ab = pABpab and PAb|aB = pAbpaB for cases and QAB|ab = qABqab and QAb|aB = qAbqaB for controls, where pAB, pAb, paB, and pab are the haplotype frequencies for cases and qAB, qAb, qaB, and qab are the haplotype frequencies for controls. The EM algorithm is implemented to separate these two diplotypes from the double heterozygote genotypes. In the E step, the proportion of one diplotype accounting for the double heterozygote in cases and controls are calculated using equation (1). In the M step, haplotype frequencies are estimated respectively, using the following formulas:
where  and
and  (j1, j2 = 0, 1, 2). The E and M steps are iterated between equations (1) and (2), leading to the maximum likelihood estimates of haplotype frequencies in cases and controls, respectively.
Four possible haplotypes, AB, Ab, aB, and ab of these two SNPs may perform differently in association with the disease. Yet, for simplicity, we assume that one haplotype is distinct from the remaining three. Lin and Wu (2006) called this distinct haplotype the risk haplotype (denoted by R1) and the remaining the non-risk haplotype (denoted by R0). Wu et al. (2007) extended this assumption to handle any number of risk haplotypes and implemented a model selection criterion to select an optimal risk haplotype(s) from a given data set. The risk and non-risk haplotypes combine randomly to form three composite diplotypes, R1R1, R1R0, and R0R0. If these composite diplotypes function differently, it suggests that two SNPs A and B affect a disease in a unit of haplotypes. Without loss of generality, we first assume that AB is the risk haplotype and then the composite diplotypes for each genotype are formed as in Table 1, where observations in cases and controls are also given. Table 2 tabulates the counts of composite diplotypes in cases and controls, respectively, after the genotypes of the same composite diplotypes are added together.
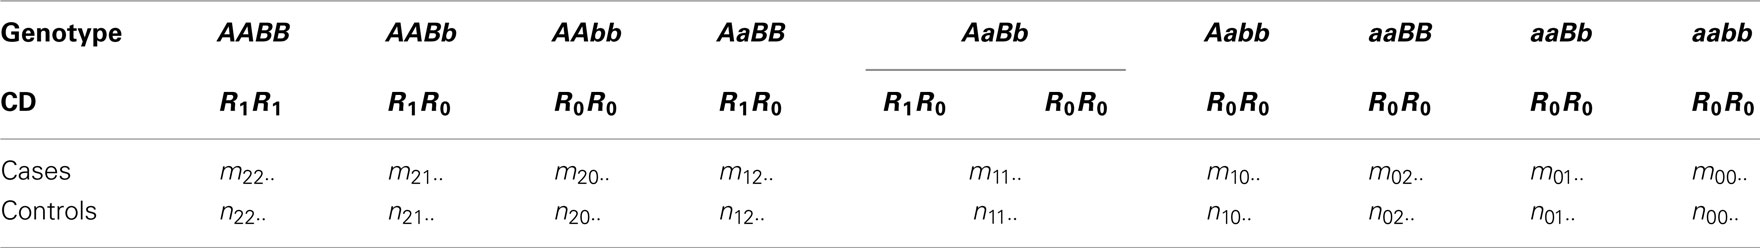
Table 1. Frequencies of 2-SNP genotypes at block 1 calculated from genotypic observations for 2 SNPs at block 1 in both cases and controls. The composite diplotypes (CD) of each genotype are also given assuming that AB is the risk haplotype.
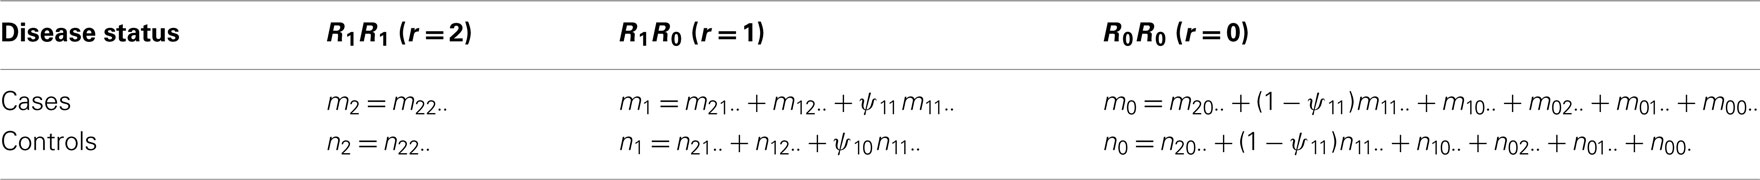
Table 2. Frequencies of composite diplotypes for 2 SNPs at block 1 in both cases and controls assuming that AB is the risk haplotype.
2.2.2. Test and estimation of haplotype effects
The overall haplotype effect due to risk haplotype AB can be tested by analyzing a 2 × 3 contingency table (Table 2) using a simple χ2 approach with df = 2. Let πr denote the proportion of cases carrying a given composite diplotype r (r = 2 for R1R1, 1 for R1R0, and 0 for R0R0). The expectation for this proportion is related to the penetrance of that composite diplotype, with the extent being dependent on the number of cases and controls and the population prevalence of the disease (North et al., 2005). We apply a logistic model to test and estimate the haplotype effect,

where μr denotes the genetic value of a composite diplotype. Following quantitative genetics principle (Mather and Jinks, 1982), the genetic value of a composite diplotype is expressed as μ2 = μ + a for R1R1, μ1 = μ + d for R1R0, and μ0 = μ − a for R0R0 where μ, a, and d are the overall mean, the additive effect and the dominance effect of the risk haplotype, respectively. Thus, the model (3) can be parameterized in terms of additive and dominance effects at each SNP and their interactions.
By simple algebra, we have
where  denotes the disease odds ratio of composite diplotype r1 vs. composite diplotype r2 (r1, r2 = 2, 1, 0). Let â and
  are the maximum likelihood estimates (MLEs) of a and d, respectively. Note that â and
  asymptotically follow a normal distribution,
Appendix A gives detailed derivations. By equation (5), we are not only be able to test the existence of additive (H0:a = 0) and dominance effects (H0:d = 0) by a z-test separately, but also be able to obtain their estimates.
In practice, a true risk haplotype is unknown. We may assign each of all possible haplotypes as a risk haplotype and then calculate test statistics in each case. An optimal risk haplotype is chosen, if it corresponds to the smallest false positive report probability (FPRP; Wacholder et al., 2004), expressed as
As can be seen, the FPRP is not only determined by the observed p-value, but also depends on both the prior probability that the association between the genetic variant and disease is real and the statistical power of the test. It reflects the probability of no true association between a genetic variant and disease given that a significant association is found. Here, we assume that all haplotypes have an equal chance to be the risk haplotype, thus choosing the smallest FPRP values is equivalent to choosing the smallest value of ratio between p-value and the power of the test. A similar procedure can be used to detect the risk haplotype and estimate haplotype effects for two SNPs from block 2.
2.3. Testing Epistasis Effects between Two Blocks
The interactions of haplotypes between two different blocks are modeled as follows. Without loss of generality, we assume that AB and CD are the risk haplotypes (R1) and (S1) for block 1 and 2, respectively, whereas the rest are the non-risk haplotypes, denoted as R0 (Ab, aB, ab) for block 1 and S0 (Cd, cD, cd) for block 2. Three composite diplotypes from one block are combined to those from the second block to form nine across-block composite diplotypes with observations tabulated in Table 3. Table A1 in Appendix gives the detailed counts only for cases, with a similar table can be obtained for controls. In these tables, the relative proportions of a particular diplotype in the total amount of a double heterozygote are expressed as
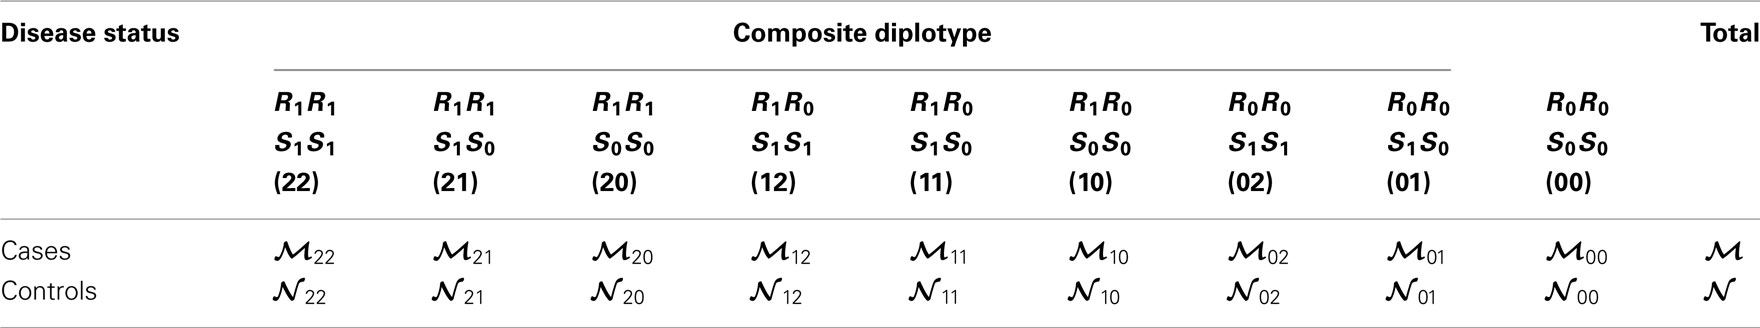
Table 3. Frequencies of across-block composite diplotypes in both cases and controls, assuming that AB is the risk haplotype for block 1 and CD is the risk haplotype for block 2.
The frequency of a diplotype is expressed as the product of haplotype frequencies under HWE. Haplotype frequencies can be estimated by implementing the EM algorithm proposed in the previous section for each block. However, there are two cases here: (1) the two blocks are independent, and (2) the two blocks are not independent with linkage disequilibria of different orders. Wu and Lin (2008) provided the EM algorithm to estimate haplotype frequencies in each of these two cases. The overall effect of two haplotypes from two blocks can be tested using a 2 × 9 contingency table (Table 3) based on a simple χ2 test with df = 8. The estimation of haplotype effects including interactions is based on a logistic model

where πrs is the proportion of subjects carrying a given across-block composite diplotype rs (r = 2 for R1R1, 1 for R1R0, and 0 for R0R0 at block 1 and s = 2 for S1S1, 1 for S1S0, and 0 for S0S0 at block 2) who are cases rather than controls. Mather and Jinks’ (1982) model is used to describe the genotypic values of a across-block composite diplotype, μrs’s, as described in Table 4.
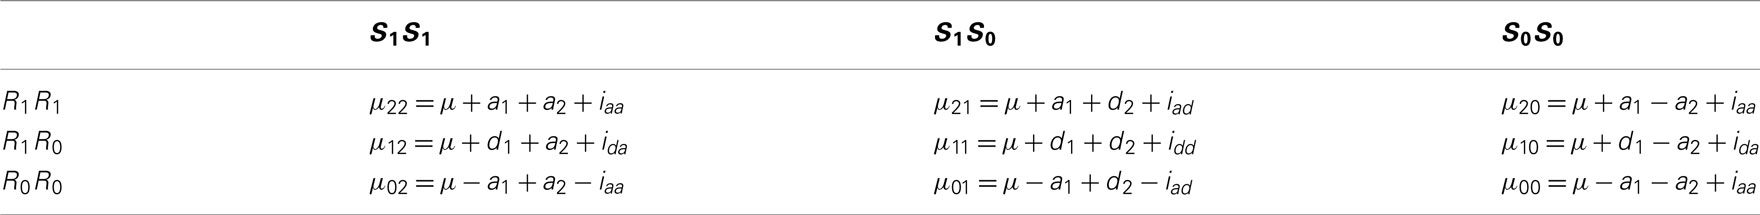
Table 4. The genotypic values of across-block composite diplotypes in terms of additive and dominant effects at each block and interactions between two blocks.
Let  (r1 ≤ r2, s1 ≤ s2 = 2, 1, 0) denote the disease odds ratio of composite diplotype r1s1 vs. r2s2. By simple algebra, we have μ = 1/4(μ22 + μ20 + μ02 + μ00) which is the overall mean (which is, as a nuisance parameter, not one of interest);
which is the additive genetic effect of haplotypes from block 1;
which is the additive genetic effect of haplotypes from block 2;
which is the dominance genetic effect of haplotypes from block 1;
which is the dominance genetic effect of haplotypes from block 2;
Which is the additive × additive genetic effect between the two blocks;
which is the additive × dominance genetic effect between the blocks;
which is the dominance × additive genetic effect between the two blocks; and
which is the dominance × dominance genetic effect between the two blocks.
We have proved that each of the genetic effects above has an asymptotical normality property (see Appendix B for a detail). Therefore, testing each of the effects can be based on a z-test. In practice, a true risk haplotype combination from two blocks is determined using a combinatory approach. This approach assigns any possible haplotype as a risk haplotype for each block. Thus, there are a total of 16 combinations for risk haplotypes from the two blocks. Similarly as in the test of the haplotype effect in one block, an optimal combination of risk haplotype is one that yields the smallest FPRP values, which is equivalent to the smallest ratio of p-value versus power for each single hypothesis test.
Extension of the proposed method to multiple SNPs (>2) in each block is straightforward (see Wu et al., 2007), which could be easily accomplished by sliding windows. As shown in the following section with 7 SNPs in one gene and 11 SNPs from the second gene, we consider a sliding window of SNP 1–2 in gene 1 with SNPs 1–2, SNPs 2–3, …, SNPs 10–11 in gene 2 sequentially and, then do the same thing for SNP 2–3, …, SNPs 6–7 in gene 1.
2.4. Incorporating Gene-environment Interactions
It has been widely recognized that environment affects the expression of genetic effects including epistasis (Lukens and Doebley, 1999; Willett and Burton, 2003). Here, we incorporate environment effects into our epistasis model to explore additive × environment and additive × additive × environment interactions in a case-control study. Consider a 1/0 binary environment (E) factor like gender or smoking status. The environment is implemented into a stratified contingency table (Table A2 in Appendix).
The environment-specific genotypic value is expressed as
As shown in Table A2 in Appendix, the genotypic values can be dissolved into different components including additive (a1, a2) and dominant effects (d1, d2) at each block, the environmental effect ξ, epistatic interactions between two blocks (iaa, iad, ida, idd), gene-environment interactions expressed by the additive and dominant effects at each block  and gene-environment interactions expressed by epistasis (iaaξ, iadξ, idaξ, iddξ). Similarly, each of these parameters can be written in a linear combination of μe,rs’s, which is equivalent to a linear combination of logarithm of disease odds ratios (see Appendix C). It can be proved that asymptotic normality property with gene-environment interactions still holds (results not shown).
3. Results
3.1. Sarcoidosis Data
Sarcoidosis is a disease of unknown cause that leads to inflammation (swelling) in the lymph nodes, lungs, liver, eyes, skin, or other tissues. Like many other complex disease, sarcoidosis is thought to involve a genetic component (Grunewald, 2008), but genetic risk factors for sarcoidosis have rarely been assessed in the context of gene-gene interactions. In the sarcoidosis study conducted in the Cleveland Clinic, five candidate genes were measured for both Caucasian and African Americans, which were chosen based on gene expression data. Specifically, 89 race-specific tagging SNPs for the coding and promoter regions of the PPAR-gamma, MMP-7, MMP-9, MMP-12, and ADAMDec1 genes, were genotyped using the SNPlex platform. Since the patients were all from Northeast Ohio, we assume that there is no population admixture in the study population.
To demonstrate how our method works in a real data analysis, we first analyzed a cohort of African Americans without implementing the environment, including 284 sarcoidosis subjects and 240 healthy volunteers recruited at the Cleveland Clinic. Of all SNPs, 82 passed quality control. We tested the additive, dominant, and epistasis between different haplotypes from each pair of five genes using sliding windows of size = 2. Because of multiple comparisons involved, we need to adjust for the significance level detected using false discovery rates (FDR, Benjamini and Hochberg, 1995) across all pairs of SNPs between the two genes studied for interaction. We found several significant dominant effects due to haplotypes from MMP9 after the adjustment (Table 5). Figure 1 illustrates the map of additive × dominant epistatic tests between haplotypes from genes MMP7 and MMP9 using sliding widows. It was found that genomic region from SNP rs880197 to rs11568819 within MMP7 displays significant additive × dominant epistatic (iad) effects with genomic region from SNP rs3918249 to rs3918254 within MMP9 (p = 0.0085 − 0.0004). After the adjustment for the significance level by FDR, iad is significant at p = 0.102 − 0.018 (Table 5).
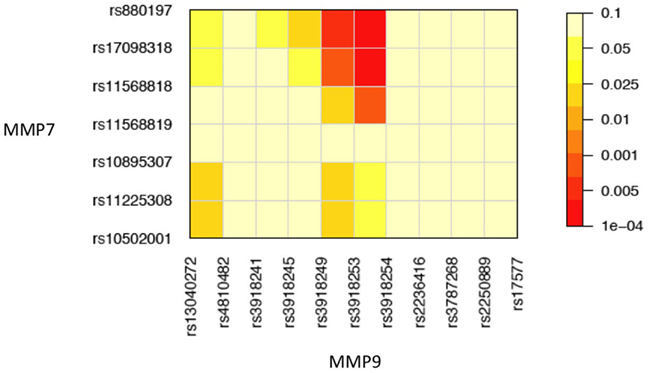
Figure 1. Pairwise significance tests of additive × dominant epistasis between 7 SNPs at MMP7 and 11 SNPs at MMP9 in a genetic association study of sarcoidosis risk.
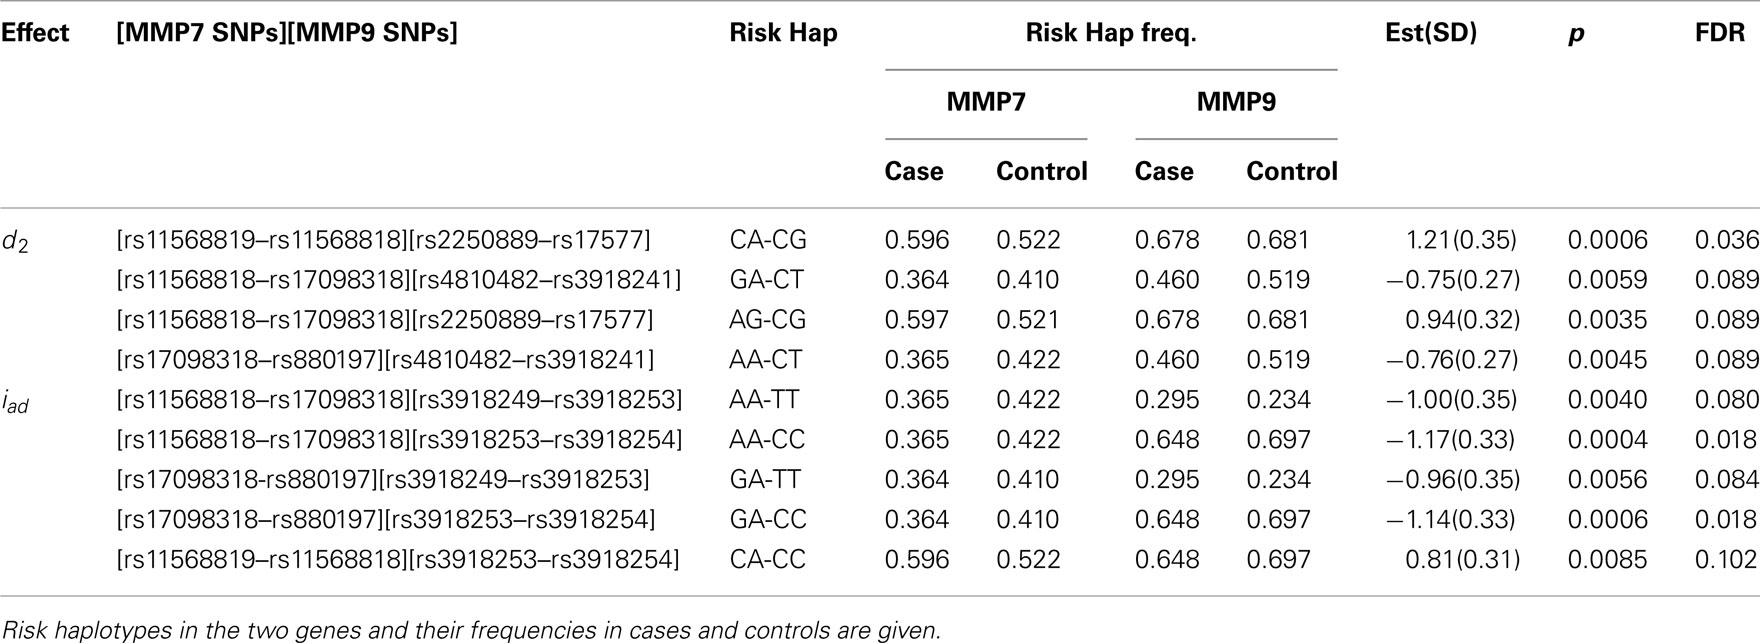
Table 5. Estimation and significance test (corrected for multiple comparisons using FDR) of genetic effects on sarcoidosis risk by haplotypes composed of SNPs from MMP7 and MMP9.
A significant iad effect between haplotypes from a pair of SNPs rs880197 and rs17098318 (MMP7) and a pair of SNPs rs3918249 and rs3918253 (MMP9) operates through risk haplotypes AA and TT. The negative iad value suggests that composite diplotype AA|AA at MMP7 combines composite diplotype  are the rest of haplotypes, CC, CT, and TC) at MMP9 to reduce the sarcoidosis risk. The same pair from MMP7 also exerts a significant iad effect with a pair of SNPs rs3918253 and rs3918254 within MMP9 in a similar way. Like pair rs880197 and rs17098318, haplotypes from pair rs17098138 and rs11568818 within MMP7 interacts with haplotypes from pairs rs3918249 and rs3918253 as well as pair rs3918253 and rs3918255 to reduce sarcoidosis risk to a similar extent. A pair of SNPs rs11568819 and rs11568819 (CA) within MMP7, displayed a significant additive × dominant epistatic effect with a pair of SNPs rs3918253 and rs3918254 (CC) within MMP9. The risk haplotypes detected are CA for MMP7 and CC for MMP9 and the additive × dominant effect produced by these two risk haplotypes was estimated as iad = 0.81. The significant positive value of iad suggests that the homozygous composite diplotype at gene MMP7 CA|CA combines with the heterozygous composite diplotype at MMP9
  are the rest of haplotypes, CT, TC, and TT) to increase the risk of sarcoidosis.
A conventional method, such as in SNPassoc of R, was used to analyze SNP-SNP interactions of the same data although only an overall interaction effect can be tested. It was found that SNP rs11568819 at MMP7 has a significant interaction with SNP rs3918253 at MMP9 (p = 0.003). This finding is basically consistent with those from our method, although the latter can be explained in a physiologically meaningful way.
In the second analysis, we explored how the environment influences the expression of additive, dominant, and epistatic effects on sarcoidosis risk. We consider smoking status as an environmental factor. Data analysis based on Table 5 suggests that smoking status displays a significant interaction (p = 0.0005) with the dominant effect triggered by a haplotype of SNPs rs9650409 and rs12334642 (ADAMDEC1), with the estimated interaction value  and SE = 0.47. However, this result should be interpreted with caution because 30% of the subjects have no smoking information and, thus, were excluded from our analysis.
3.2. Simulation study
We performed simulation studies to investigate the power and Type I error rate of epistatic detection by our model. Two independent haplotype blocks were simulated, each composed of two SNPs. A natural population at HWE with the prevalence of disease = 0.35% was first generated, from which 250 cases and 250 controls (or 500 cases and 500 controls) were randomly selected. The first two scenarios of simulation were used to evaluate the power and precision of the estimation, and the last one is to assess the Type I error rate under the null model of no interactions:
• Scenario 1: mimicking SNPs rs11568819–rs11568818 at MMP7 and SNPs rs3918253–rs3918254 at MMP9 with a significant epistatic effect of iad;
• Scenario 2: mimicking SNPs rs11568818–rs17098318 at MMP7 and SNPs rs4810482–rs3918241 at MMP9 with significant genetic effects of d2 and idd.
• Scenario 3: mimicking SNPs rs11568819–rs11568818 at MMP7 and SNPs rs3918253–rs3918254 at MMP9 without any significant epistatic effects, i.e., iaa = iad = ida = idd = 0.
Haplotype frequencies, risk haplotypes, and other genetic effects used for the simulation were their MLEs from the real data at the corresponding SNPs. Simulation results based on 1000 simulations are summarized in Tables A3– A5 in Appendix.
In general, our method provides reasonably precise estimates for all genetic effects parameters with small biases and MSEs (mean squared errors) even when a moderate sample size is used. However, if the study is aimed to estimate additive effects of haplotypes, 250 cases and 250 controls should be adequately enough to get convincing results. If we are interested in the estimation of dominant effects and their interactions with other effects, 500 cases and 500 controls are recommended. We also analyzed the power of our model based on 1000 simulations at the significance level of 0.05. In Scenario 1, the power of detecting the additive × dominant effect is 0.72 for 250 cases and 250 controls and increases to 0.96 for doubled sample sizes. To compare with existing models, we use SNPassoc, R, to estimate the power of interaction detection, which is much lower than our method (Table A3 in Appendix). In Scenario 2 with one more significant effect, similar results of power were detected, although the comparison between our method and existing approach is more sharply contrast relative to Scenario 1. Scenario 3 shows that the Type I error rates are comparative (around 0.05) comparing with the conventional SNP-SNP interaction method (around 0.2) and, as expected, the Type I error rate does not depend on sample sizes (Table A5 in Appendix).
4. Discussion
By dissecting epistasis into its different components according to traditional quantitative genetic theory (Mather and Jinks, 1982), we develop a new model for detecting haplotype-haplotype interactions in case-control studies via population-based sampling. The model was founded on two bodies of increasingly proven evidence that the genetic variation of complex traits arises from haplotype diversity and effects (Judson et al., 2000; Bader, 2001; Rha et al., 2007) and genetic interactions (Marchini et al., 2005; North et al., 2005; Purcell et al., 2007; An et al., 2009; Lambrechts, 2010; Wang et al., 2010; Wray and Goddard, 2010; Wu et al., 2010). The advantage of the new model is not only a simple combination of the power of haplotype analysis and epistatic modeling, but also lies in its capacity to provide more genetic meaningful explanations and conclusions for a given data set.
Liu et al. (2011) provided an elegant proof for the asymptotic property of epistatic detection at the individual gene level from a contingency table. This property greatly enhances the computing efficiency of epistatic testing throughout the genome and also displays greater power to detect epistasis for additive × dominant, dominant × additive, and dominant × dominant components, compared with conventional log-logistic models. In this article, the statistical property proven at the gene level is found to hold for epistatic identification at the haplotype level. This consistency greatly facilitates the practical usefulness of our new model to characterize genetic interactions that occur between haplotypes derived from chromosomal segments. When this property is used to study genome-genome interactions (Li and Wu, 2009; Li et al., 2009), we will be able to dictate a comprehensive picture of the genetic architecture of complex diseases and pathogenesis.
Although our derivation focuses on two genome blocks in a genome, we are currently working to expand this model into a genome-wide association study in which all possible pairs of haplotype interactions can be detected and tested. Li et al. (2011) have used a lasso model to detect significant genetic variants from high-dimension genetic data through penalized regression. A similar line of model selection can be implemented into our case-control design aimed to detect significant haplotype-haplotype interactions. The determination of an optimal length of haplotype may be an issue. Yet, our model is flexible to include any number of SNPs for haplotype analysis. As shown in Li et al. (2006), an increasing number of disequilibrium parameters expressed at different orders will need to be modeled when multiple SNPs are included, which may prohibit computation. A cluster of paralleled machines can be deployed to accelerate analysis and discrimination processes of haplotype-haplotype interactions.
Our model was built on a two-SNP haplotype assumption. The idea presented can be readily extended to include an arbitrary number of SNPs with no technical difficulty. For L1 SNPs in gene one, there are  haplotype. But we can still assume one risk haplotype that is combined with
  − 1 non-risk haplotypes to generate three composite diplotypes. When gene two with L2 SNPs is also considered, we will still have nine composite diplotypes. However, the selection of an optimal combination of risk haplotypes at the two genes will be made from 2(L1 + L2) haplotype combinations. It should be pointed out that there will be lower numbers in some cells of the contingency table when long haplotype are modeled. To make our normality assumption a case in this situation, we need to determine the maximum length of haplotypes which can be reasonably used to identify the risk haplotype for a given sample size.
Conflict of Interest Statement
The authors declare that the research was conducted in the absence of any commercial or financial relationships that could be construed as a potential conflict of interest.
Acknowledgments
This work is supported by NSF/IOS-0923975. Part of this work was done when Rongling Wu was invited Research Fellow at the Statistical and Applied Mathematical Sciences Institute (SAMSI), sponsored by Duke University, University of North Carolina at Chapel Hill, and North Carolina State University.
References
Akey, J., Jin, L., and Xiong, M. (2001). Haplotypes vs single marker linkage disequilibrium tests: what do we gain? Eur. J. Hum. Genet. 9, 291–300.
An, P., Mukherjee, O., Chanda, P., Yao, L., Engelman, C. D., Huang, C. H., Zheng, T., Kovac, I. P., Dubé, M. P., Liang, X., Li, J., de Andrade, M., Culverhouse, R., Malzahn, D., Manning, A. K., Clarke, G. M., Jung, J., and Province, M. A. (2009). The challenge of detecting epistasis (G x G interactions): genetic analysis Workshop 16. Genet. Epidemiol. 33, S58–S67.
Bader, J. S. (2001). The relative power of snps and haplotype as genetic markers for association tests. Pharmacogenomics 2, 11–24.
Benjamini, Y., and Hochberg, Y. (1995). Controlling the false discovery rate: a practical and powerful approach to multiple testing. J. R. Stat. Soc. Series B 57, 289–300.
Cheverud, J. M., and Routman, E. J. (1995). Epistasis and its contribution to genetic variance components. Genetics 139, 1455–1461.
Cockerham, C. C. (1954). An extension of the concept of partitioning hereditary variance for analysis of covariances among relatives when epistasis is present. Genetics 39, 859–882.
Collins, F. S., Guyer, M. S., and Charkravarti, A. (1997). Variations on a theme: cataloging human DNA sequence variation. Science 278, 1580–1581.
Fisher, R. A. (1918). The correlation between relatives on the supposition of Mendelian inheritance. Trans. R. Soc. Edinb. 52, 399–433.
Gabutero, E., Moore, C., Mallal, S., Stewart, G., and Williamson, P. (2007). Interaction between allelic variation in IL12B and CCR5 affects the development of AIDS. AIDS 21, 65–69.
Gayan, J., Gonzalez-Perez, A., Bermudo, F., Saez, M. E., Royo, J. L., Quintas, A., Galan, J. J., Moron, F. J., Ramirez-Lorca, R., Real, L. M., and Ruiz, A. (2008). A method for detecting epistasis in genome-wide studies using case-control multi-locus association analysis. BMC Genomics 9, 360.
Hallauer, A. R., Carena, M. J., and Filho, J. B. M. (2010). Quantitative Genetics in Maize Breeding. New York: Springer.
Huang, B. E., Amos, C. I., and Lin, D. Y. (2007). Detecting haplotype effects in genome wide association studies. Genet. Epidemiol. 31, 803–812.
Judson, R., Stephens, J. C., and Windemuth, A. (2000). The predictive power of haplotypes in clinical response. Pharmacogenomics 1, 15–26.
Kao, C. H., and Zeng, Z. B. (2002). Modeling epistasis of quantitative trait loci using Cockerham’s model. Genetics 160, 1243–1261.
Lake, S. L., Lyon, H., Tantisira, K., Silverman, E. K., Weiss, S. T., Laird, N. M., and Schaid, D. J. (2003). Estimation and tests of haplotype-environment interaction when linkage phase is ambiguous. Hum. Hered. 55, 56–65.
Lambrechts, L. (2010). Dissecting the genetic architecture of pathogen specificity. PLoS Pathog. 6, e1001019.
Li, H. Y., Kim, B. R., and Wu, R. L. (2006). Identification of quantitative trait nucleotides that regulate cancer growth: a simulation approach. J. Theor. Biol. 242, 426–439.
Li, J. H., Das, K., Fu, G., Li, R., and Wu, R. L. (2011). Bayesian lasso for genome-wide association studies. Bioinformatics 27, 516–523.
Li, Y., Berg, A., Chang, M. N., Du, P., Ahn, K., Mauger, D., Liao, D. P., and Wu, R. L. (2009). A statistical model for genetic mapping of viral infection by integrating epidemiological behavior. Stat. Appl. Genet. Mol. Biol. 8, Article 38.
Li, Y., and Wu, R. L. (2009). Modeling host-cancer genetic interactions with multilocus sequence data. J. Comput. Sci. Syst. Biol. 2, 24–43.
Lin, D. Y., and Zeng, D. (2006). Likelihood-based inference on haplotype effects in genetic association studies. J. Am. Stat. Assoc. 101, 89–104.
Lin, M., and Wu, R. L. (2006). Detecting sequence-sequence interactions for complex diseases. Curr. Genomics 7, 59–72.
Liu, T., Johnson, J. A., Casella, G., and Wu, R. L. (2004). Sequencing complex diseases with HapMap. Genetics 168, 503–511.
Liu, T., Thalamuthu, B., Liu, C., Chen, J., and Wu, R. L. (2011). Asymptotic distribution for epistatic tests in case-control studies. Genomics 98, 145–151.
Lukens, L. N., and Doebley, J. (1999). Epistatic and environmental interactions for quantitative trait loci involved in maize evolution. Genet. Res. 74, 291–302.
Marchini, J., Donnelly, P., and Cardon, L. R. (2005). Genome-wide strategies for detecting multiple loci that influence complex diseases. Nat. Genet. 37, 413–417.
Martin, M. P., Gao, X., Lee, J. H., Nelson, G. W., Detels, R., Goedert, J. J., Buchbinder, S., Hoots, K., Vlahov, D., Trowsdale, J., Wilson, M., O’Brien, S. J., and Carrington, M. (2002). Epistatic interaction between KIR3DS1 and HLA-B delays the progression to AIDS. Nat. Genet. 31, 429–434.
Moore, J. H., and Williams, S. M. (2005). Traversing the conceptual divide between biological and statistical epistasis: systems biology and a more modern synthesis. Bioessays 27, 637–646.
Morris, R. W., and Kaplan, N. L. (2002). On the advantage of haplotype analysis in the presence of multiple disease susceptibility alleles. Genet. Epidemiol. 23, 221–233.
North, B. V., Curtis, D., and Sham, P. C. (2005). Application of logistic regression to case-control association studies involving two causative loci. Hum. Hered. 59, 79–87.
Purcell, S., Neale, B., Todd-Brown, K., Thomas, L., Ferreira, M. A., Bender, D., Maller, J., Sklar, P., de Bakker, P. I., Daly, M. J., and Sham, P. C. (2007). PLINK: a tool set for whole-genome association and population-based linkage analyses. Am. J. Hum. Genet. 81, 559–575.
Rha, S. Y., Jeung, H. C., Choi, Y. H., Yang, W. I., Yoo, J. H., Kim, B. S., Roh, J. K., and Chung, H. C. (2007). An association between RRM1 haplotype and gemcitabine induced neutropenia in breast cancer patients. Oncologist 12, 622–630.
Shao, H., Burrage, L. C., Sinasac, D. S., Hill, A. E., Ernest, S. R., O’Brien, W., Courtland, H. W., Jepsen, K. J., Kirby, A., Kulbokas, E. J., Daly, M. J., Broman, K. W., Lander, E. S., and Nadeau, J. H. (2008). Genetic architecture of complex traits: large phenotypic effects and pervasive epistasis. Proc. Natl. Acad. Sci. U.S.A. 105, 19910–19914.
The International HapMap Consortium. (2005). A haplotype map of the human genome. Nature 437, 1299–1320.
Wacholder, S., Chanock, S., Garcia-Closas, M., El Ghormli, L., and Rothman, N. (2004). Assessing the probability that a positive report is false: an approach for molecular epidemiology studies. J. Natl. Cancer Inst. 96, 434–442.
Wang, Z., Liu, T., Lin, Z. W., Hegarty, J., Koltun, W. A., and Wu, R. L. (2010). A general model for multilocus epistatic interactions in case-control studies. PLoS ONE 5, e11384.
Willett, C. S., and Burton, R. S. (2003). Environmental influences on epistatic interactions: viabilities of cytochrome c genotypes in interpopulation crosses. Evolution 57, 2286–2292.
Wray, N. R., and Goddard, M. E. (2010). Multi-locus models of genetic risk of disease. Genome Med. 2, 10.
Wu, R. L., Ma, C. X., Lin, M., and Casella, G. (2004). A general framework for analyzing the genetic architecture of developmental characteristics. Genetics 166, 1541–1551.
Wu, S., Yang, J., Wang, C. G., and Wu, R. L. (2007). A general quantitative genetic model for haplotyping a complex trait in humans. Curr. Genomics 8, 343–350.
Wu, S., Yang, J., and Wu, R. L. (2006). Multilocus linkage disequilibrium mapping of epistatic quantitative trait loci that regulate HIV dynamics: a simulation approach. Stat. Med. 25, 3826–3849.
Wu, X., Dong, H., Luo, L., Zhu, Y., Peng, G., Reveille, J. D., and Xiong, M. (2010). A novel statistic for genome-wide interaction analysis. PLoS Genet. 6, e1001131.
Zaykin, D. V., Westfall, P. H., Young, S. S., Karnoub, M. A., Wagner, M. J., and Ehm, M. G. (2002). Testing association of statistically inferred haplotypes with discrete and continuous traits in samples of unrelated individuals. Hum. Hered. 53, 79–91.
Zhang, Y., and Liu, J. S. (2007). Bayesian inference of epistatic interactions in case-control studies. Nat. Genet. 39, 1167–1173.
Appendix
A. Two-SNP Haplotype in Block 1
Let us first consider the case-control data of two SNPs from block 1, assuming AB is the risk haplotype. In a case-control study, we have m and n random samples drawn from the case group and the control group, respectively. The data can be summarized in the following table
where mr an nr are the observed counts of composite diplotype r = 2, 1, 0 for cases and controls, respectively.
pdr = P(Composite diplotype = r|D = d), d = 1 (cases) and 0 (controls); r = 2, 1, 0. For examples p12 = P(R1R1|Cases), p00 = P(R0R0|Controls).
By the result on Page 150 of Agresti’s book (Agresti, 2002), we know
where p1 = (p12, p11, p10)′, p0 = (p02, p01, p00)′ and
Please note that  and
and  are independent.
By using the multivariate Delta method, we get
where 13 is the 3-dimension vector with each entry being 1.
A.1. The Asymptotic Normality of Additive Effect a
Recall that a = 1/2(log OR2,0), i.e.,
The MLE of a is  with the asymptotic (1 − α)100% confidence interval
A.2. The Asymptotic Normality of Dominance Effect d
Recall the dominance effect d is defined as 1/2(logOR1,2 + logOR1,0), the MLE of d is
with the asymptotic (1 − α)100% confidence interval
B. Epistasis Effects between Two Blocks
Now let’s think about the more complicated cases – testing epistasis effects between two blocks. The data can be summarized in the following table,
where  rs and
  rs are the observed counts of composite diplotype rs for cases and controls, respectively.
Let pd,rs = P(Composite type = rs|Disease = d), d = 1, 0; rs = 22, 21, 20, 12, 11, 10, 02, 01, 00. For examples p1,22 = P(R1R1S1S1|Cases), p0,00 = P(R0R0S0S0|Controls).
From previous results, we can find that

where r1s1 and r2s2 indicate two different composite diplotypes.
Let
where  and
and 
B.1. The Asymptotic Normality of Effect a1
Recall that a1 = 1/4[logOR22,02 + logOR20,00]. The MLE of a1 is
with the asymptotic (1 − α)100% confidence interval of a1 is

B.2. The Asymptotic Normality of Effect a2
Recall that a2 = 1/4[logOR22,20 + logOR02,00]. Similarly, the MLE of a2 is
with the asymptotic (1 − α)100% confidence interval of a2 is

B.3. The Asymptotic Normality of Effect d1
Recall that

The MLE of d1 is
with the asymptotic (1 − α)100% confidence interval of d1 is

B.4. The Asymptotic Normality of Effect d2
Recall that

The MLE of d2 is
the asymptotic (1 − α)100% confidence interval of d2 is

B.5. The Asymptotic Normality of Effect iaa
Recall that
The MLE of iaa is
The asymptotic (1 − α)100% confidence interval of iaa is

B.6. The Asymptotic Normality of Effect iad
Recall that

The MLE of iad is

The asymptotic (1 − α)100% confidence interval of iad is

B.7. The Asymptotic Normality of Effect ida
Recall that

The MLE of ida is
The asymptotic (1 − α)100% confidence interval of ida is

B.8. The Asymptotic Normality of Effect idd
Recall that
The MLE of idd is
The asymptotic (1 − α)100% confidence interval of idd is

where

C. Epistasis Effects between Two Blocks and Interactions between Haplotype and A Binary Environmental Factor
Table A2 presents the genotypic values of 9 across-block composite diplotypes stratified by a binary environmental factor (E = 0, 1). As shown in below, each parameter can be written in a linear combination of μe,rs’s, which is equivalent to a linear combination of logarithm of disease odds ratios, i.e.,
 denotes the disease odds ratio of composite diplotype r1s1 vs. r2s2 given a fixed e = 0, 1. orrs stands for the disease odds ratio of the environmental factor e = 1 vs. e = 0 given a fixed composite diplotype rs.
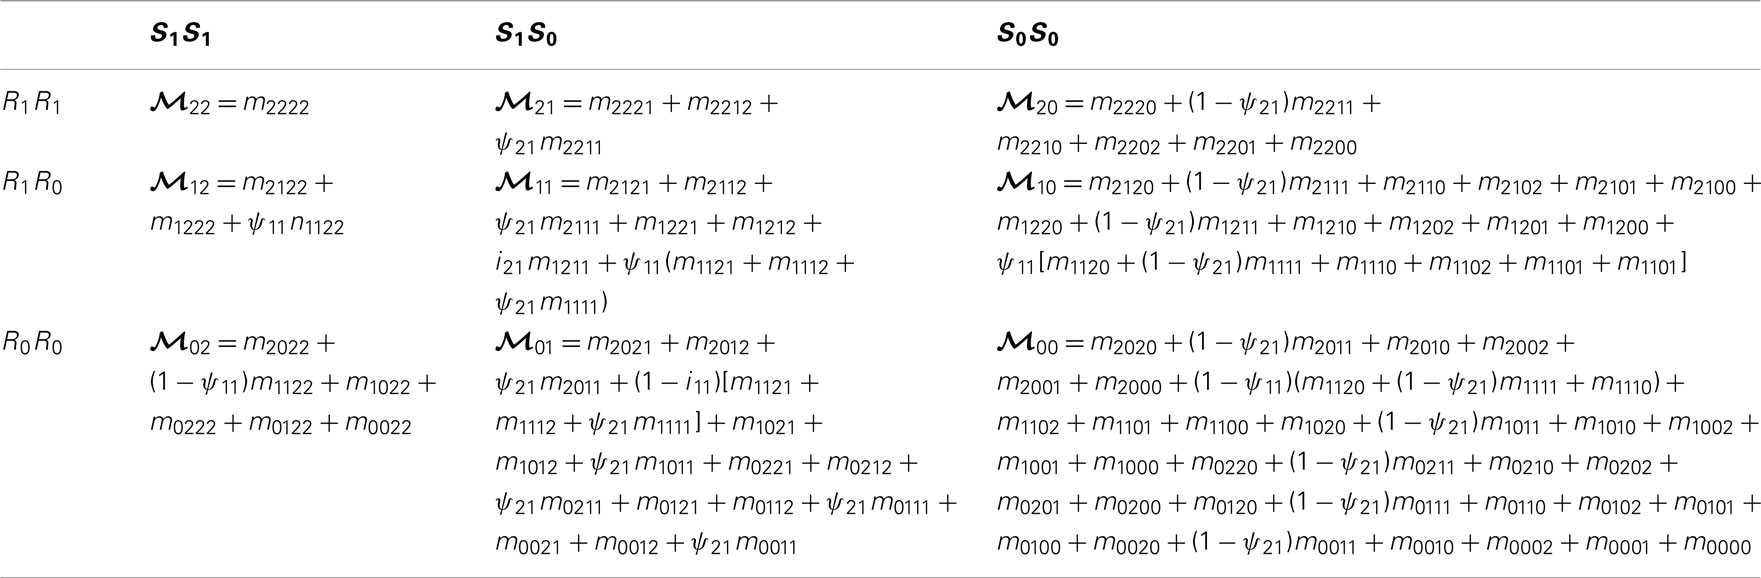
Table A1. Frequencies of across-block composite diplotypes calculated from across-block genotypes in cases, assuming that AB is the risk haplotype for block 1 and CD is the risk haplotype for block 2.
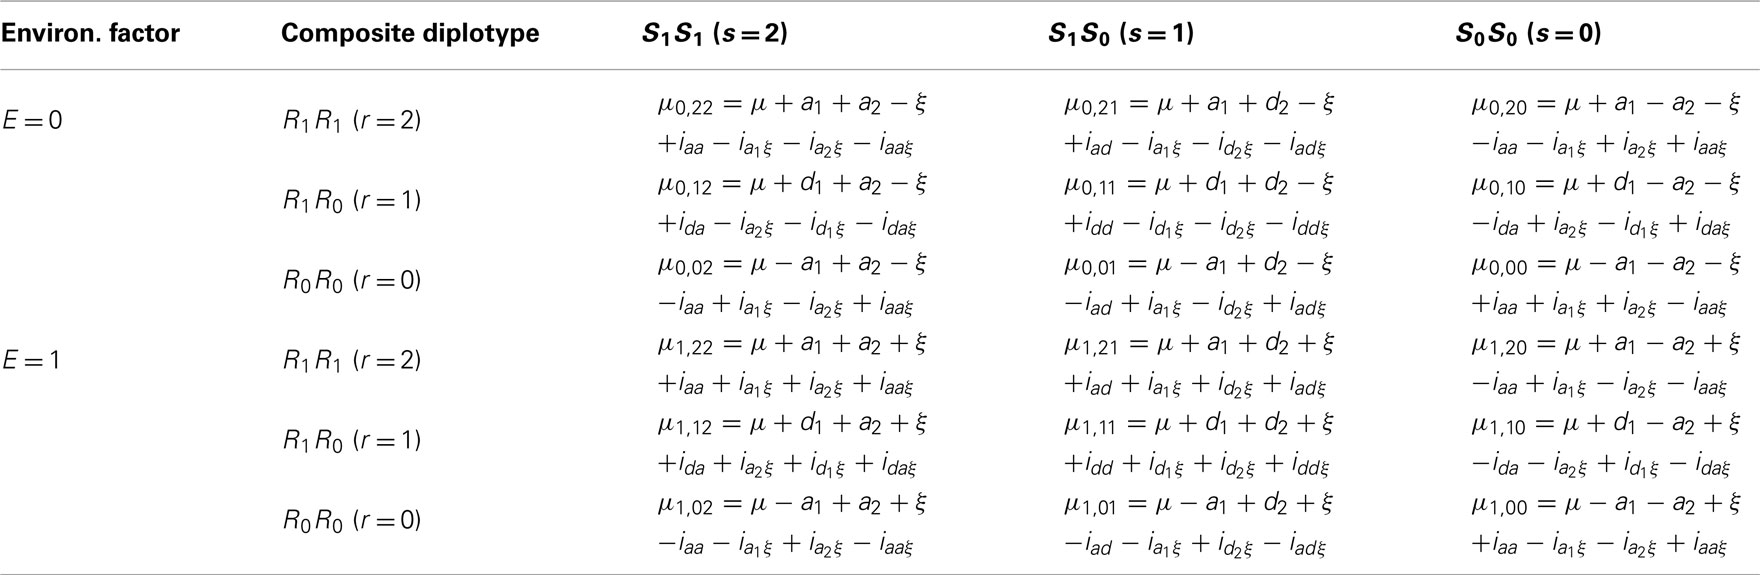
Table A2. The genotypic values of 9 across-block composite diplotypes stratified by a binary environmental factor (E = 0, 1).
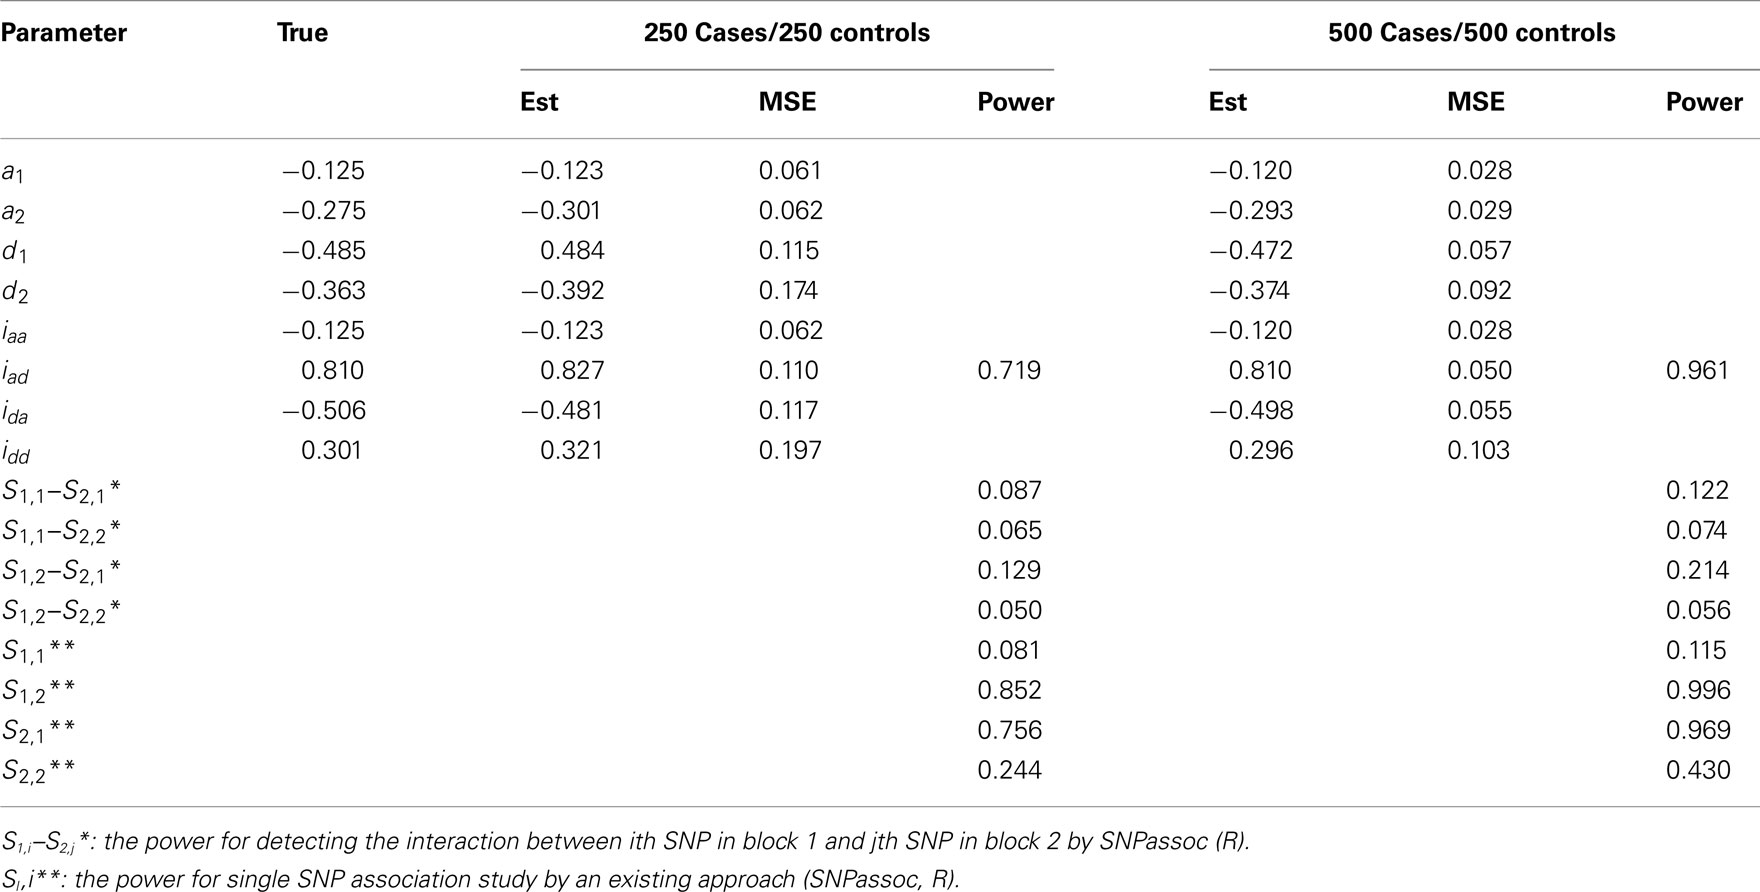
Table A3. Estimation of genetic parameters and power of epistatic detection from a simulated data for two independent blocks under Scenario 1 for all 1000 simulations.

Table A4. Estimation of genetic parameters and power of epistatic detection from a simulated data for two independent blocks under Scenario 2 for all 1000 simulations.
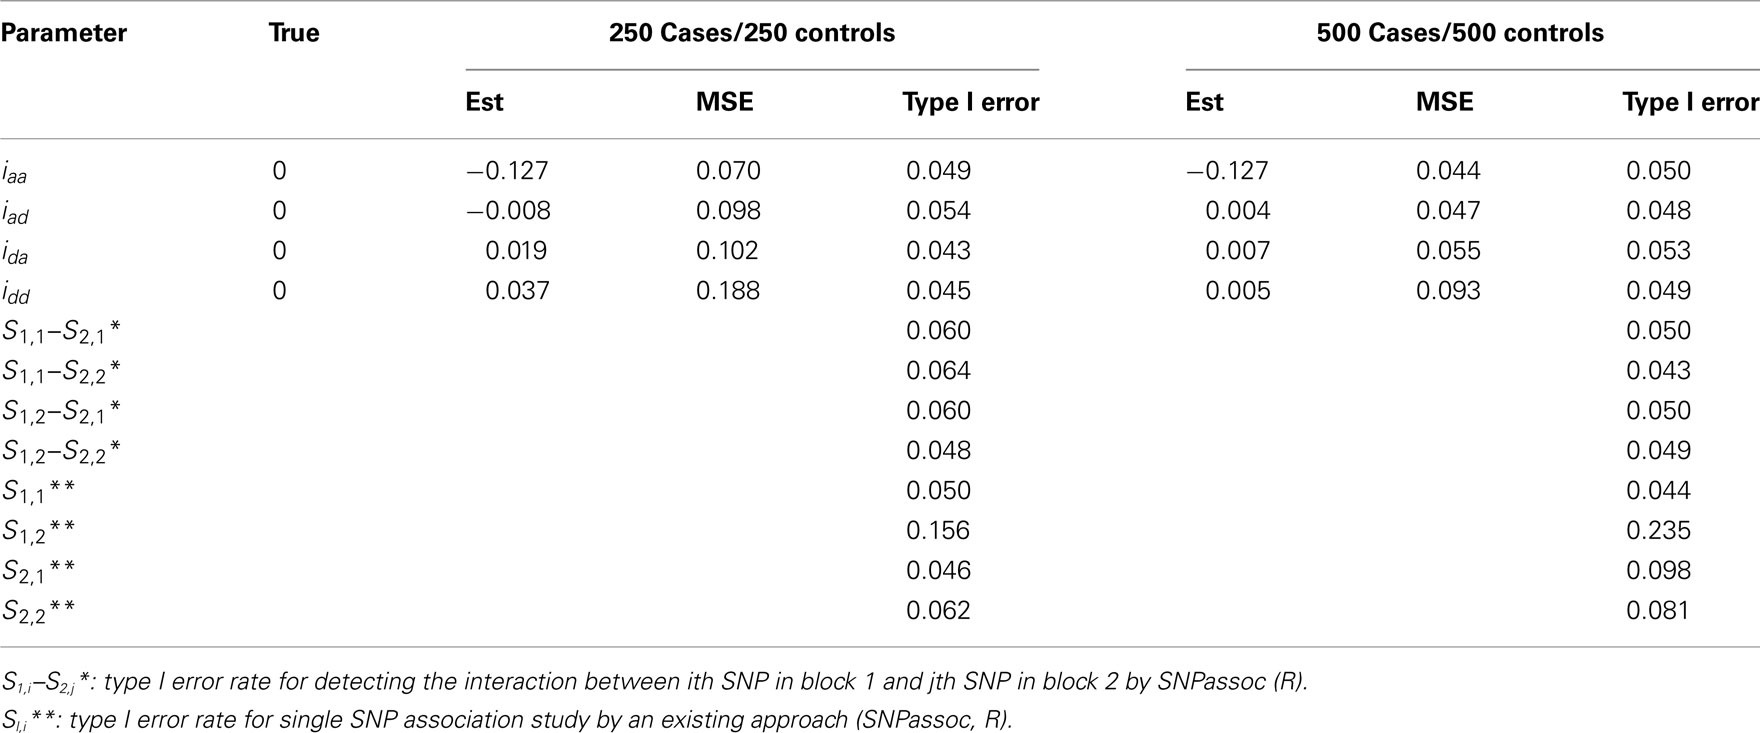
Table A5. Type I error rate for all epistatic detection of two independent blocks under Scenario 3 for 1000 simulations.
Keywords: haplotype, linkage disequilibrium, EM algorithm, risk haplotype, epistasis
Citation: Zhang L, Liu R, Wang Z, Culver DA and Wu R (2012) Modeling haplotype-haplotype interactions in case-control genetic association studies. Front. Gene. 3:2. doi: 10.3389/fgene.2012.00002
Received: 29 September 2011; Accepted: 02 January 2012;
Published online: 18 January 2012.
Edited by:
Shuang Wang, Columbia University, USAReviewed by:
Weihua Guan, University of Minnesota, USATian Zheng, Columbia University in the City of New York, USA
Copyright: © 2012 Zhang, Liu, Wang, Culver and Wu. This is an open-access article distributed under the terms of the Creative Commons Attribution Non Commercial License, which permits non-commercial use, distribution, and reproduction in other forums, provided the original authors and source are credited.
*Correspondence: Li Zhang, Statistical Genetics and Bioinformatics Section, Department of Quantitative Health Sciences, The Cleveland Clinic, Cleveland, OH 44195, USA. e-mail:emhhbmdsM0BjY2Yub3Jn