
 Bryan E. Linggi2

- 1 Department of Biotechnology, Boku University Vienna, Vienna, Austria
- 2 Environmental Molecular Sciences Laboratory, Pacific Northwest National Laboratory, Richland, WA, USA
- 3 School of Life Sciences, University of Warwick, Coventry, UK
With currently available RNA-Seq pipelines, expression estimates for most genes are very noisy. We here introduce MapAl, a tool for RNA-Seq expression profiling that builds on the established programs Bowtie and Cufflinks. In the post-processing of RNA-Seq reads, it incorporates gene models already at the stage of read alignment, increasing the number of reliably measured known transcripts consistently by 50%. Adding genes identified de novo then allows a reliable assessment of double the total number of transcripts compared to other available pipelines. This substantial improvement is of general relevance: Measurement precision determines the power of any analysis to reliably identify significant signals, such as in screens for differential expression, independent of whether the experimental design incorporates replicates or not.
1. Introduction
RNA-Seq exploits next-generation sequencing of cDNA for the study of gene expression. It has been applied to gain global views of the complexity of the transcriptome (Cloonan et al., 2008; Mortazavi et al., 2008; Ramsköld et al., 2009; Tang et al., 2009). In contrast to other profiling technologies, RNA-Seq can provide a comprehensive assay of gene expression that is not reliant on probes for targets that must be specified in advance. It is particularly well suited for the de novo discovery of exons and splice junctions, and it allows genome-wide qualitative expression profiling of organisms with unknown genome sequence.
Increasingly, there has been an interest in also applying RNA-Seq for the quantification of gene expression (Blow, 2009). While earlier work has focused on reads that unambiguously identify a transcript (Wilhelm et al., 2008), improved algorithms allow an extension of data analysis to complex gene models of alternative splicing, also taking into account the many reads that may come from different splice forms (Jiang and Wong, 2009). The discrimination of complex alternative splice forms is now possible with modern tools like ERANGE (Mortazavi et al., 2008), ALEXA-seq (Griffith et al., 2010), NEUMA (Lee et al., 2011), IsoEM (Nicolae et al., 2010), RSEM (Li et al., 2010; Li and Dewey, 2011), or TopHat + Cufflinks (Trapnell et al., 2009, 2010).
In the popular TopHat + Cufflinks suite of tools, this is achieved by first aligning reads to the genome, with de novo discovery of exons and splice junctions (TopHat). Then this information is used to assemble transcripts and calculate their abundances in a second step (Cufflinks). Cufflinks can take advantage of reference gene model annotation for the quantification of known transcripts, omitting the transcript assembly step.
The MapAl tool presented here builds on this two-stage approach and extends the algorithm to already exploit gene models at the alignment step. Not having to identify novel splice forms for known genes considerably improves the assignment of reads to annotated transcripts, particularly for splice forms covered only by a small number of reads (Łabaj et al., 2011). This novel approach substantially increases the number of transcripts that can be measured reliably. That is of general interest because measurement precision determines the power of any subsequent analysis, such as the sensitive detection of differentially expressed transcripts, independent of whether replicates are employed or not (Anders and Huber, 2010).
2. Materials and Methods
2.1. Data Sources and Annotation
To validate the proposed approach, we consider two data sets representing different technologies, with different read lengths, read depths, sequencing strategies (single-end and paired-end), replicate type, and derived from different human cell lines.
2.1.1. Set 1
Three replicate measurements of mRNA extracted from a human HMEC 184A1 cell line culture were performed. With a total of 993 million 50 bp reads, corresponding to an entire ABI SOLiD-3+ flow cell per measurement sample, this constitutes one of the largest RNA-Seq data sets featuring technical replicates to date (measurements SRR413934, SRR413935, and SRR413936 from the PNNL-EMSL project with SRA-ID SRP011007).
2.1.2. Set 2
Three measurements from the now publicly available expression profiles of H1-hESC cell lines from the Wold/Caltech lab (experiments SRX026674, SRX026669, and SRX026685 from the ENCODE project with SRA-ID SRP003497) were also examined. They provide 2 × 50 million of 75 bp paired-end reads per measurement, obtained using an Illumina Genome Analyzer II. While the measurements are not technical replicates, biological replicates of cell lines are sufficiently similar (in contrast to, say, patient samples) to allow a comparative study of processing approaches and their effects on measurement precision. The fact that we observe a similarly strong performance improvement in both data sets furthermore confirms this post hoc.
For an unbiased assessment of splice-form identification rate, we focused on reads aligned to the comprehensive 140,079 human transcripts annotated in EnsEMBL 58.
2.2. MapAl Pipeline
The performance of MapAl is demonstrated using the well established TopHat + Cufflinks programs as reference. Similar results were observed with alternative programs (data not shown).
In the standard TopHat + Cufflinks pipeline, annotated “gene models” are only used by the Cufflinks step (right-hand side, Figure 1A). MapAl, in contrast, allows the exploitation of gene models already at the alignment stage: Reads are directly aligned to the known transcript sequences (left-hand side, Figure 1B). MapAl next maps the aligned reads to genomic locations described by the corresponding “gene models” (box highlighted in bold), taking as an input a transcriptome mapped (SAM) file together with transcript annotations and produce a chromosome based SAM file. Cufflinks can subsequently be used for an estimation of transcript abundances (right-hand side).
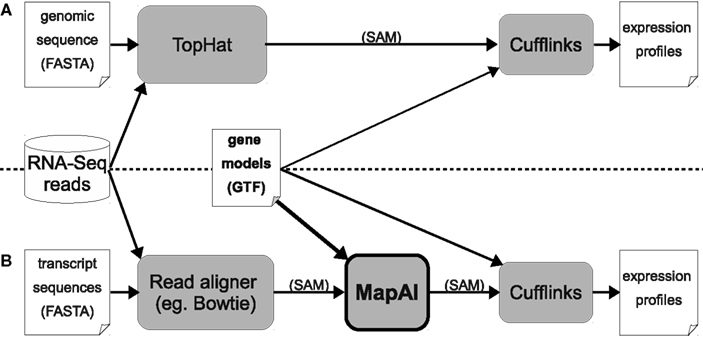
Figure 1. Workflows for RNA-Seq expression profiling. The established TopHat pipeline (A) is compared with the new MapAl approach (B), which exploits gene models already at the alignment stage. Arrows indicate data flow – alignments can be provided in SAM format (Sequence Alignment/Map), gene models in GTF (Gene Transfer Format), a refinement of the General Feature Format (GFF).
Reads mapping to different splice forms of the same gene are reduced to one alignment, during MapAl processing when they match the same genomic location (Figure 2). On the other hand, different reads mapping to multiple targets are kept as distinct, matching different genomic locations.
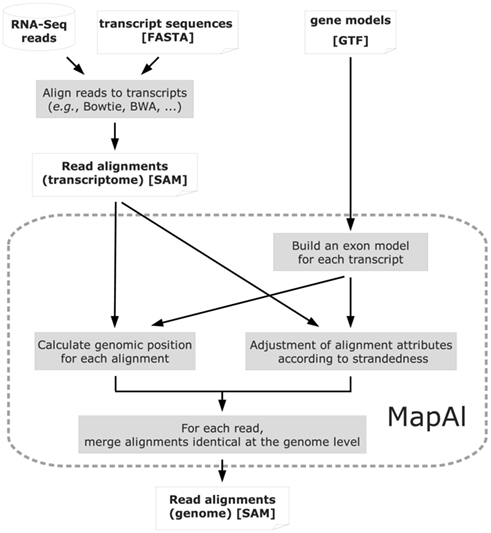
Figure 2. Algorithm structure of MapAl. The flow chart presents the algorithmic structure of the MapAl pipeline. The steps executed by the MapAl script are marked by a dashed rounded rectangle. In particular, reads are first aligned to the known transcript sequences using any aligner supporting the SAM output format. They are then mapped to genomic locations by MapAl by means of the provided gene models. Alignment attributes embedded in the SAM format are adjusted according to strandedness. Then, for each read, alignments identical at the genome level are merged to produce the final genomic alignment file.
We make that any read aligner supporting the SAM format can be used (Li and Homer, 2010). Here, RNA-Seq reads were aligned to the transcript sequences with Bowtie (Langmead et al., 2009). This facilitates a direct comparison of the tested pipelines because Bowtie is also used internally by TopHat. Bowtie v0.12.7 and TopHat v1.1.4 were run with settings suitable for the examined data set types (see Appendix for details).
2.3. Quantifying Expression Levels
Expression levels were calculated using Cufflinks v0.9.1 (Trapnell et al., 2010) with EnsEMBL gene models provided as specified. For de novo only transcript discovery, EnsEMBL gene models were provided to Cufflinks in order to ignore all reads that could have come from known genes. Parameters were set for maximal sensitivity (–min-frags-per-transfrag 1 and -F 0). When processing alignments in the MapAl pipeline, the option -A 0 could also be set, as all parts of a read were known to originate from the same transcript sequence (this parameter is usually used to support reliable splice junction discovery through TopHat). For splice forms supported by less than one read alignment as assigned by Cufflinks, expression levels were set to zero. For a direct splice-form level comparison of MapAl and TopHat results, expression estimates had to be normalized by the total number of alignments considered at the respective Cufflinks step.
2.4. Measures of Reproducibility
For a systematic assessment of reproducibility, we can either consider the coefficient of variation (CV) on the linear scale, or the SD of log expression levels. For a number of reasons, gene expression data is typically analyzed on a log scale, on which differences in expression are examined by a t-test. Differences on the log scale then correspond to a fold-change on the linear scale. In this context, the appropriate measure of precision is the SD on the log scale. When referring to a relative error of 20% or less in the manuscript, we threshold the SD σ < log2(120%) so that a value μ + σ compared to μ on the log2-scale corresponds to a relative error of 20% or less on the linear scale. We considered a transcript measured reliably if the relative error was less than 20%. The comparisons of reproducibility do not depend on this arbitrary threshold. Note that reproducibility also determines the power of statistics that operate without replicates (Anders and Huber, 2010).
It is noteworthy that many analyses considering replicate precision exclude measurements with no signal in any one of the replicates. This creates a methods bias toward a better perceived precision in the assay. In the examined Data Set 1, of all identified transcript targets, 14% had zero reads in one or two of the replicates but non-zero counts in the others, with 1–26 reads observed. These transcripts substantially contribute to the measurement noise at low expression levels, and consequently have to be counted toward the fraction of unreliable measurements. That approach is consistent because they have an infinite error on the log scale (and also the coefficient of variation on the linear scale is always >80%).
3. Results
We introduce MapAl, a novel approach for the quantification of transcript abundances from RNA-Seq data. We have validated our tool in comparison to the popular TopHat + Cufflinks analysis pipeline. In particular, we have considered the numbers of transcripts that could be identified and measured reliably. This was tested on two independent data sets representing alternative sequencing strategies and technologically different platforms.
3.1. Read Mapping
Read alignment statistics are shown in Table 1. On one hand, the established pipeline with TopHat yielded up to 10% more mapped reads. This reflects the additional, unknown transcripts discovered by alignment to the genome sequence. The effect was particularly clear for Data Set 2, where paired-end reads could be exploited and TopHat was able to take advantage of the longer 75 bp reads, for which it was designed. In contrast, however, MapAl identified 2–3 times as many reads falling on known exon junctions, a consequence of making use of known splice-form sequences already at the alignment stage. Alignments to a typical transcript illustrate this point in Figure A1 in Appendix. In the IGV browser window (Robinson et al., 2011), the blue boxes represent the second and third exons of ENST00000377403 (H6PD). The coverage band at the top indicates that reads entirely falling into exons are mapped identically by both MapAl (top) and TopHat (bottom). The difference is in the alignment of reads straddling splice junctions. In particular, for this exon structure, no reads spanning the exons one and two were identified by TopHat, whereas a substantial number was correctly mapped by MapAl (bridging the junction to the left of the browser window). Similarly, no reads spanning the exons three and four were identified by TopHat, whereas MapAl correctly identifies many reads spanning this region (bridging the junction to the right of the browser window). While some reads spanning the splice junction between exons two and three were found by TopHat, about twice as many such reads were identified by the MapAl pipeline. It is these reads mapping to exon junctions that often play a key role in identifying the expression of a particular splice form, and therefore determine both splice-form identification rate and transcript-specific measurement precision.
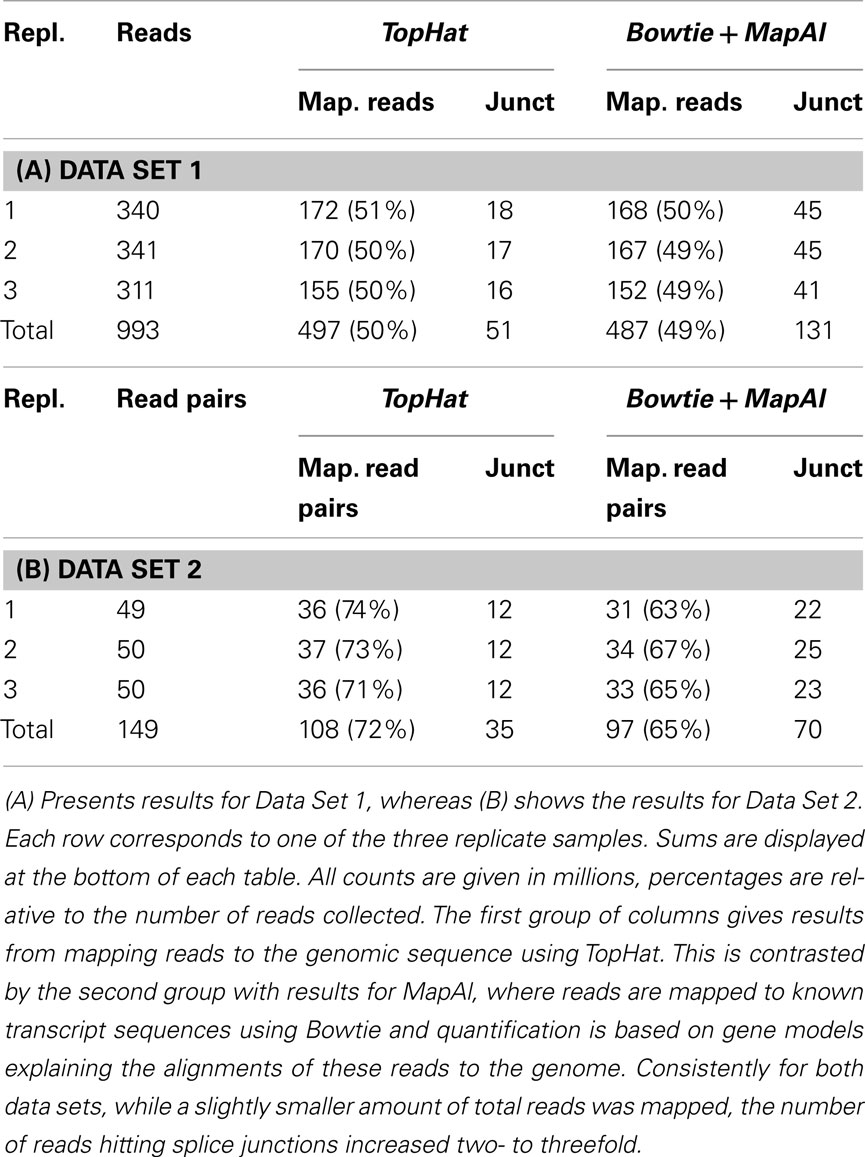
Table 1. Statistics of reads and mapping results.
In addition we have examined the effects of providing TopHat known splice junctions via GTF a file (-G option) or through a junction list file (the -j option). Interestingly, this consistently increases the number of alignments falling on splice junctions by about 7%. Thus the remaining discrepancy can only be explained by particularities of the TopHat algorithm, such as the filtering of reads where the junction falls into a terminal region of the reads. We have also explored alternative TopHat parameter options (such as less restrictive -a and -F settings), yet the main picture remains, giving only a further 8% increase of the number of reads falling on junctions.
It also worth noticing that for MapAl about 80% of identified splice junctions were supported by more than 10 alignments. For TopHat that fraction was about 2/3, indicating that MapAl is not only able to identify more reads falling on splice junctions but also increases the support of identified splice junctions.
3.2. Reproducibility of Quantitative Expression Profiling
Table 2 compares the numbers of transcripts that could be identified and measured reliably. For Set 1 the MapAl pipeline found 101,169 splice forms versus the 87,649 identified by TopHat (72 vs 63% of all known transcripts). See Appendix for a detailed comparison.
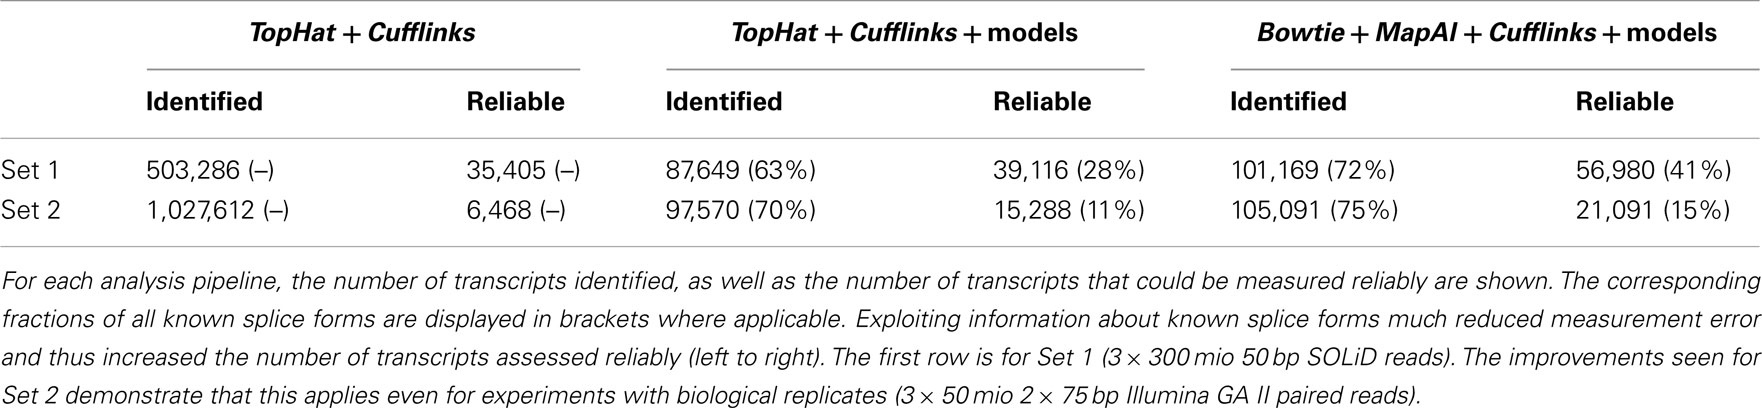
Table 2. Statistics of identified and reliably measured transcripts.
Even more pronounced performance differences emerge when we consider only reliably measured splice forms: The standard TopHat + Cufflinks pipeline, including de novo discovery of alternative splice forms and genes, could assess 35,405 splice forms with a relative error <20%. Interestingly, making use of known gene models increased the number of reliably measured transcripts to 39,116, even though these now include only known genes and splice forms.
Using MapAl, however, the expression levels of 56,980 transcripts could be measured reliably – obtaining an improvement by almost 50% over the established workflow. Figure 3 compares the distributions of measurement errors. On one hand, the maximum errors are larger for TopHat (red curves, extending further to the right). On the other hand, a larger number of transcripts could be measured with low errors by MapAl (black curves plotting higher values on the y-axes to the left of the dashed lines). The dashed lines indicate measurement errors of 20%. These observations equally hold for the technical replicates of Data Set 1 and the biological replicates of Data Set 2 (which exhibit higher variation in general).
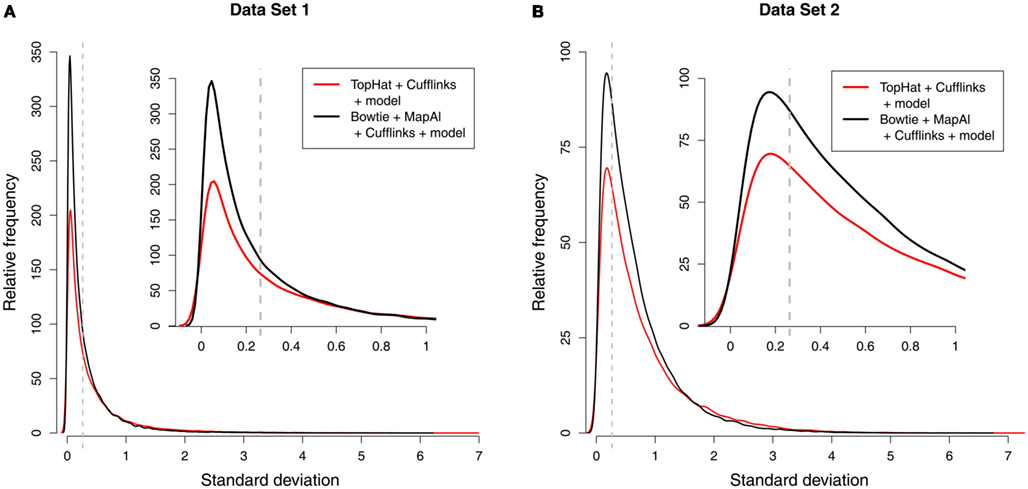
Figure 3. Distribution of measurement errors. Each of the plots compares the distributions of measurement errors for TopHat (red line) and MapAl (black line). The x-axis shows the SD across three replicate measurements on the log scale. The dashed vertical line marks an error of 20%. The y-axis represents the number of splice forms that could be measured with a certain precision (scaled to an arbitrary unit allowing a comparison across samples). The first panel displays results for Data Set 1 [(A) technical replicates], the second panel is for Data Set 2 [(B) biological replicates].
It is noteworthy that the 56,980 known transcripts that could be measured reliably can easily be complemented by measurements for newly discovered genes, adding another 11,288 transcripts, and bringing the total to 68,268 reliably profiled splice forms. This is almost twice as many as the 35,405 that could be assessed reliably with the standard pipeline, and similar improvements could be demonstrated for Data Set 2 (Table 3).
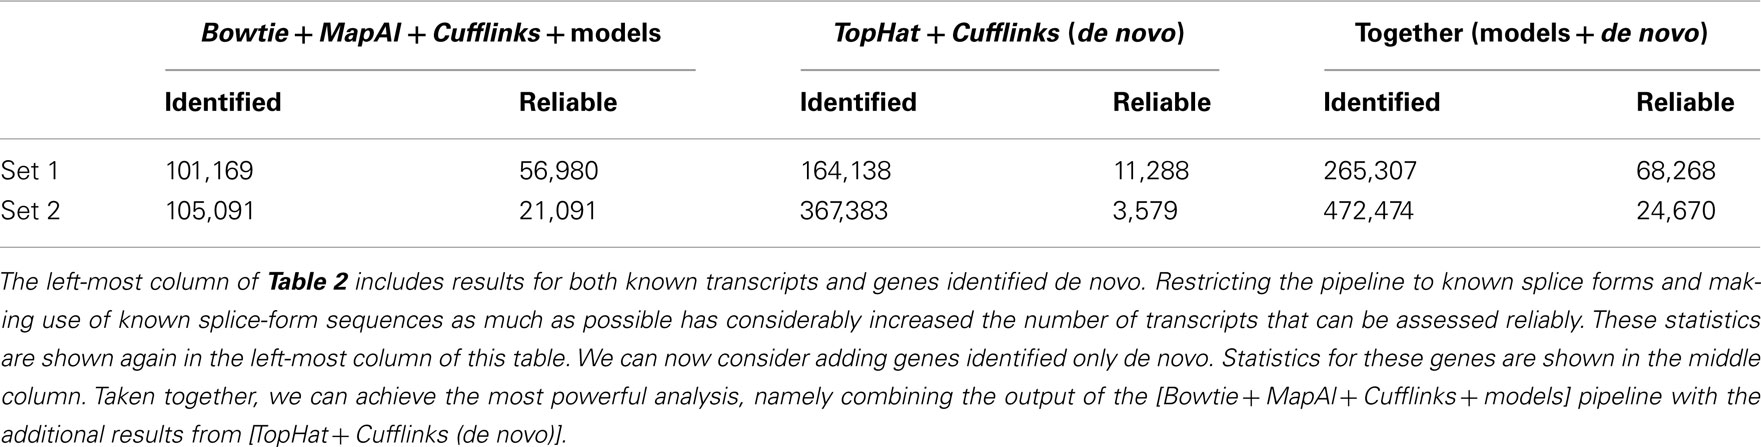
Table 3. Statistics of identified and reliably measured transcripts, adding genes identified de novo.
As it is always interesting to compare the performance of alternative pipelines, MapAl has been constructed for an easy combination with other tools that support the SAM format, supporting future developments and further independent benchmarks.
3.3. Comparison of Execution Times
Collected data sets getting even bigger, it is of interest to asses the execution time of the analyzed pipelines. The examined approaches considered a similar number of alignments, thus giving similar running times for the Cufflinks step. As this step is fast compared to the overall running time of the pipeline, we can focus on the remaining steps, comparing Bowtie + MapAl and TopHat.
As MapAl performance was disk bound, parallelization did not yield a considerable speed-up. Thus MapAl was run in single-thread mode, however, parallel analysis of reads aligned to transcripts for each chromosome is worth further consideration. Note that the performance of the file system may easily become the limiting factor in overall throughput.
Table 4 presents averaged execution times for both pipelines. For Data Set 1, featuring shorter, single-end reads, the MapAl pipeline executed over five times faster than established TopHat + Cufflinks. For Data Set 2, MapAl was almost twice faster, despite two factors working to the advantage of the established tools: (1) TopHat was designed and optimized for the longer 75 bp reads, and (2) each pair of reads is treated as a “one fragment” by TopHat, while both reads are processed independently by MapAl, doubling the effective number of sequences that have to be considered.
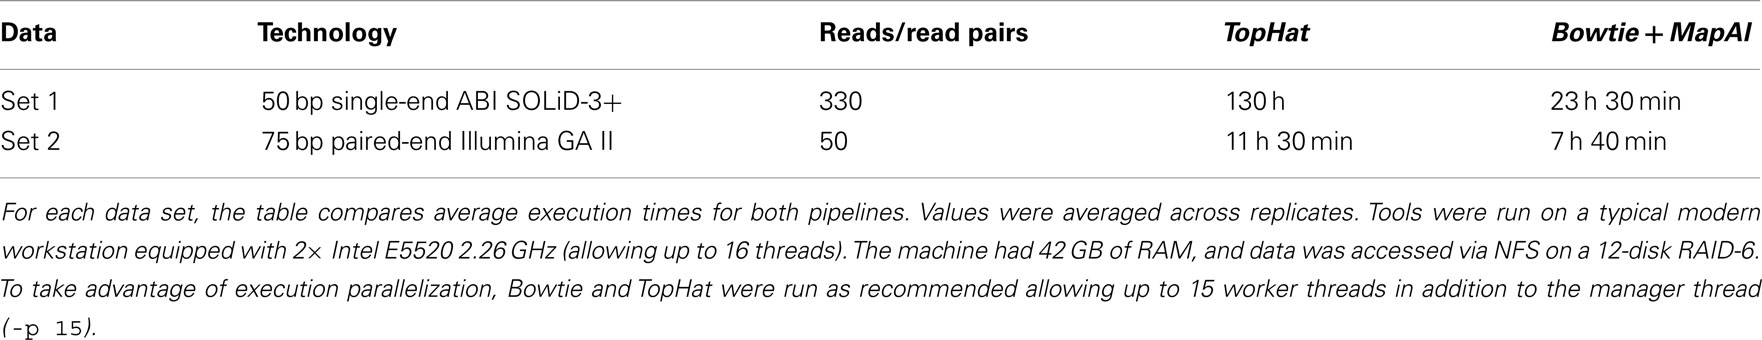
Table 4. Comparison of pipeline execution times.
4. Discussion
Whereas taking advantage of known transcript sequences at the alignment stage and simultaneously discovering new alternative splice forms of known genes will require the development of extended models for the estimation of transcript levels, MapAl builds on existing tools to provide a fast and straightforward solution for quantitative expression profiling by RNA-Seq.
It supports both users and further development by giving a free choice of combining alternative steps at different stages of the process. In particular, a wide range of read mappers supporting the standard SAM format can be employed, because MapAl also handles indels correctly. Indels are the most frequent form of sequencing error (Albers et al., 2011) but can also play an important role in variant discovery (Krawitz et al., 2010).
For this manuscript, the software has been validated on data from single-end reads generated by a stranded RNA-Seq protocol (SOLiD, Data Set 1), and on data from paired-end reads generated by an unstranded RNA-Seq protocol (Illumina, Data Set 2). We are now extending the tool to support single-end, paired-end, and mate-pair reads from both stranded and unstranded RNA-Seq protocols.
We are also improving the handling of exon junctions. With few exceptions, exons are longer than 50 nucleotides (Berget, 1995). Therefore, reads spanning more than two exon junctions have been very rare for early next-generation sequencing data, with typical read lengths as short as 36 bp. Current equipment already produces 150 bp reads. With read lengths of modern platforms ever increasing, reads spanning multiple splice junctions are becoming a more frequently observed issue. As these reads are particularly powerful in the discrimination of specific splice forms, we are adding full support for reads that span multiple junctions.
The next release of our software implementing these features will become available on http://www.bioinf.boku.ac.at/pub/MapAl/early March 2012, and will also support the latest version of Cufflinks (Jan 2012), taking advantage of recent features like the improved multi-mapped read correction that has been introduced last year.
In summary, MapAl provides a flexible, modular approach to quantitative expression profiling by RNA-Seq, building on the strengths of popular established tools. It implements advanced features dealing with challenges in read alignment to support the analysis needs of the latest sequencing platforms. In particular, it takes advantage of splice-form sequence information already at the alignment stage. MapAl increases the number of reliably measured known transcripts by about 50% and also allows the profiling of new genes, in total almost doubling the number of transcripts that can reliably be assessed.
Note Added in Proof
With version 1.4.0 released this year, TopHat can now also map reads directly to the transcriptome, exploiting ideas similar to the approach first introduced in Łabaj et al. (2011). Initial comparisons with MapAl, however, suggest considerable differences in resulting expression level estimates, apparently due to additional heuristics and different implementation details. In view of the substantial effects of selecting one program over another, further comparative studies of alternative tools are certainly of interest. The modular approach of MapAl gives users a valuable choice, allowing an easy combination of its efficient two-stage mapping strategy with established options, like Bowtie and Cufflinks, but also working directly with other tools supporting the SAM format.
Availability and Implementation
The MapAl suite is available for download under the GPL at www.bioinf.boku.ac.at/pub/MapAl
Conflict of Interest Statement
The authors declare that the research was conducted in the absence of any commercial or financial relationships that could be construed as a potential conflict of interest.
Acknowledgments
The authors thank Dr. Lan Hu (Center for Cancer Computational Biology, Dana-Farber Cancer Institute, Boston) for her contributions to improving MapAl and her help in thoroughly testing the tool. This work was supported by the Vienna Science and Technology Fund (WWTF), Baxter AG, the Austrian Institute of Technology, and the Austrian Centre of Biopharmaceutical Technology. A portion of this research was performed using the EMSL, a national scientific user facility sponsored by the Office of Biological and Environmental Research of the Department of Energy of the USA, located at Pacific Northwest National Laboratory. Bryan E. Linggi was in part supported by LDRD funding from Pacific Northwest National Laboratory.
References
Albers, C. A., Lunter, G., MacArthur, D. G., McVean, G., Ouwehand, W. H., and Durbin, R. (2011). Dindel: accurate indel calls from short-read data. Genome Res. 21, 961–973.
Anders, S., and Huber, W. (2010). Differential expression analysis for sequence count data. Genome Biol. 11, R106.
Cloonan, N., Forrest, A. R., Kolle, G., Gardiner, B. B., Faulkner, G. J., Brown, M. K., Taylor, D. F., Steptoe, A. L., Wani, S., Bethel, G., Robertson, A. J., Perkins, A. C., Bruce, S. J., Lee, C. C., Ranade, S. S., Peckham, H. E., Manning, J. M., McKernan, K. J., and Grimmond, S. M. (2008). Stem cell transcriptome profiling via massive-scale mRNA sequencing. Nat. Methods 5, 613–619.
Griffith, M., Griffith, O. L., Mwenifumbo, J., Goya, R., Morrissy, A. S., Morin, R. D., Corbett, R., Tang, M. J., Hou, Y. C., Pugh, T. J., Robertson, G., Chittaranjan, S., Ally, A., Asano, J. K., Chan, S. Y., Li, H. I., McDonald, H., Teague, K., Zhao, Y., Zeng, T., Delaney, A., Hirst, M., Morin, G. B., Jones, S. J., Tai, I. T., and Marra, M. A. (2010). Alternative expression analysis by RNA sequencing. Nat. Methods 7, 843–847.
Jiang, H., and Wong, W. H. (2009). Statistical inferences for isoform expression in RNA-seq. Bioinformatics 25, 1026–1032.
Krawitz, P., Rödelsperger, C., Jäger, M., Jostins, L., Bauer, S., and Robinson, P. N. (2010). Microindel detection in short-read sequence data. Bioinformatics 26, 722–729.
Łabaj, P. P., Linggi, B. E., Markillie, L. M., Wiley, H. S., and Kreil, D. P. (2011). Characterization and improvement of RNA-seq precision in quantitative transcript expression profiling. Bioinformatics 27, i383–i391.
Langmead, B., Trapnell, C., Pop, M., and Salzberg, S. (2009). Ultrafast and memory-efficient alignment of short DNA sequences to the human genome. Genome Biol. 10, R25.
Lee, S., Seo, C. H., Lim, B., Yang, J. O., Oh, J., Kim, M., Lee, S., Lee, B., Kang, C., and Lee, S. (2011). Accurate quantification of transcriptome from RNA-seq data by effective length normalization. Nucleic Acids Res. 39, e9.
Li, B., and Dewey, C. (2011). RSEM: accurate transcript quantification from RNA-seq data with or without a reference genome. BMC Bioinformatics 12, 323. doi:10.1186/1471-2105-12-323
Li, B., Ruotti, V., Stewart, R. M., Thomson, J. A., and Dewey, C. N. (2010). RNA-Seq gene expression estimation with read mapping uncertainty. Bioinformatics 26, 493–500.
Li, H., and Homer, N. (2010). A survey of sequence alignment algorithms for next-generation sequencing. Brief. Bioinform. 11, 473–483.
Mortazavi, A., Williams, B. A., McCue, K., Schaeffer, L., and Wold, B. (2008). Mapping and quantifying mammalian transcriptomes by RNA-seq. Nat. Methods 5, 621–628.
Nicolae, M., Mangul, S., Mandoiu, I., and Zelikovsky, A. (2010). “Estimation of alternative splicing isoform frequencies from RNA-seq data,” Algorithms in Bioinformatics, Vol. 6293 of Lecture Notes in Computer Science, eds V. Moulton and M. Singh (Berlin: Springer), 202–214.
Ramsköld, D., Wang, E. T., Burge, C. B., and Sandberg, R. (2009). An abundance of ubiquitously expressed genes revealed by tissue transcriptome sequence data. PLoS Comput. Biol. 5, e1000598. doi:10.1371/journal.pcbi.1000598
Robinson, J. T., Thorvaldsdóttir, H., Winckler, W., Guttman, M., Lander, E. S., Getzl, G., and Mesirow, J. P. (2011). Integrative genomics viewer. Nat. Biotechnol. 29, 24–26.
Tang, F., Barbacioru, C., Wang, Y., Nordman, E., Lee, C., Xu, N., Wang, X., Bodeau, J., Tuch, B. B., Siddiqui, A., Lao, K., and Surani, M. A. (2009). mRNA-seq whole-transcriptome analysis of a single cell. Nat. Methods 6, 377–382.
Trapnell, C., Pachter, L., and Salzberg, S. L. (2009). TopHat: discovering splice junctions with RNA-Seq. Bioinformatics 25, 1105–1111.
Trapnell, C., Williams, B. A., Pertea, G., Mortazavi, A., Kwan, G., van Baren, M. J., Salzberg, S. L., Wold, B. J., and Pachter, L. (2010). Transcript assembly and quantification by RNA-seq reveals unannotated transcripts and isoform switching during cell differentiation. Nat. Biotechnol. 28, 511–515.
Wilhelm, B. T., Marguerat, S., Watt, S., Schubert, F., Wood, V., Goodhead, I., Penkett, C. J., Rogers, J., and Bahler, J. (2008). Dynamic repertoire of a eukaryotic transcriptome surveyed at single-nucleotide resolution. Nature 453, 1239–1243.
Appendix
Bowtie and TopHat Execution Parameters
To facilitate a direct comparison of the established TopHat pipeline with the new approach implemented in MapAl we have used Bowtie as an aligner because it is also used by TopHat. To make sure that the comparison is as fair as possible we run Bowtie with the settings used internally by the TopHat tested (v1.1.4).
For Data Set 2 (Illumina), TopHat runs Bowtie with the following parameters:
bowtie -q –un TopHat1/tmp/left_kept_reads_

missing.fq \

–max/dev/null -n 2 -p 15 -k 40 -m 40
As we are not interested in separate reports about not aligned reads and reads aligning to too many locations we specify options –max and –un to drop these. The -S switch requests output of alignments in SAM format:
bowtie -q -n 2 -p 15 -k 40 -m 40 -S
For Data Set 1 (ABI SOLiD, colourspace), TopHat runs Bowtie with the following parameters:
bowtie -q -C –col-keepends –un \

TopHat1/tmp/left_kept_reads_missing.fq

–max \

/dev/null -n 2 -p 15 -k 40 -m 40
Because the original files of this data set are provided in . fastc and . qual formats, we change -q to -f. Again, we drop –max and –un and add -S to select the required output files and formats, yielding:
bowtie -f -C –col-keepends -n 2 -p 15 -k

40 -m 40 -S
Users might want to consider increasing the values for the -k and -m parameters while aligning directly to the transcriptome in order to allow more correct hits to be reported, as large numbers of such hits can be expected for complex splice-form structures.
Detailed Comparison of Expression Level Estimates from the Two Pipelines
MapAl identifies additional reads spanning exon junctions. We here discuss the differences in expression level estimates that are observed as a result. Comparative scatter plots for individual replicates are presented in Figure A2. For each transcript, the x-axes show the MapAl expression level in comparison to the TopHat expression level on the y-axes, each on a log10 scale. Darker gray levels indicate a higher number of transcripts. Note that we plot transcripts with no expression call at –5 in order to also visualize differences in presence calls.
First, consider the simple gene models of Figure A3A. At sufficient coverage, it is possible to assess the expression of both splice forms even without reads spanning exon junction. Adding read alignments that fall on splice junctions will therefore slightly increase the coverage at exon boundaries and thus increase the respective expression levels. This contributes to the observation in the scatter plots (Figure A2), that the expression levels for MapAl are in general higher (densities below the diagonal).
Larger differences can already be expected for the simple gene model of Figure A3B. Consider a scenario where no reads spanning exon 2 could be identified by TopHat, as shown in the plot of a hypothetical coverage at the top of the panel. This can happen particularly easily for shorter exons. In that case, the evidence seems to suggest that splice-form T1 was clearly expressed whereas there is a lack of specific evidence for an expression of T2. Adding read alignments that cover the splice junctions between exons 1 and 2 or exons 2 and 3 changes the picture. One may even reach the opposite conclusion, namely, that splice-form T2 was expressed whereas T1 was not, if there is a sufficient number of these reads. In such extreme cases, a difference in presence calls will be observed (Table A1). These contribute to the densities parallel to an axis in the scatter plots.
Generally, if both splice forms were expressed, one expects additional read alignments that cover the splice junctions between exons 1 and 3, providing specific evidence for the expression of splice-form T1, and also additional read alignments that cover the splice junctions between exons 1 and 2 or exons 2 and 3, providing specific evidence for the expression of splice-form T2. In that case, the MapAl expression level for T1 will be lower (contributing to the density above the diagonal). In contrast to TopHat, MapAl can however make a presence call for T2, contributing to the horizontal density in the scatter plot. This explains why the density indicating presence calls unique to MapAl (horizontal), has a larger volume than the density indicating presence calls unique to TopHat (vertical). The scatter plots thus reflect that MapAl consistently identifies more transcripts. Table A1 gives a detailed comparison.
More complex effects can be understood using the gene model of Figure A3C as an example. Consider the scenario where no reads spanning exon junctions could be identified by TopHat, as shown in the plot of a hypothetical coverage at the top of the panel. With no evidence for the specific expression of the different splice forms, reads are evenly assigned. Additional evidence from alignments falling on splice junctions plays a critical role in assessing the specific splice-form expression levels. In a common case, reads covering exon junctions support the dominant expression of a particular splice-form. Taking this evidence into account will therefore boost the MapAl expression level estimate for this splice-form, while depressing the expression level estimates for the others. This change is smaller as it is spread across multiple splice forms. That explains why the deviations below the diagonal in the scatter plots comparing MapAl and TopHat are stronger. In fact, depending on the data set and replicate considered, expression levels for MapAl were higher for 38%–42% of all known transcripts, and higher for TopHat for 13%–17% (Table A2).
In summary, the correct consideration of reads spanning splice forms in MapAl can affect expression estimates considerably.
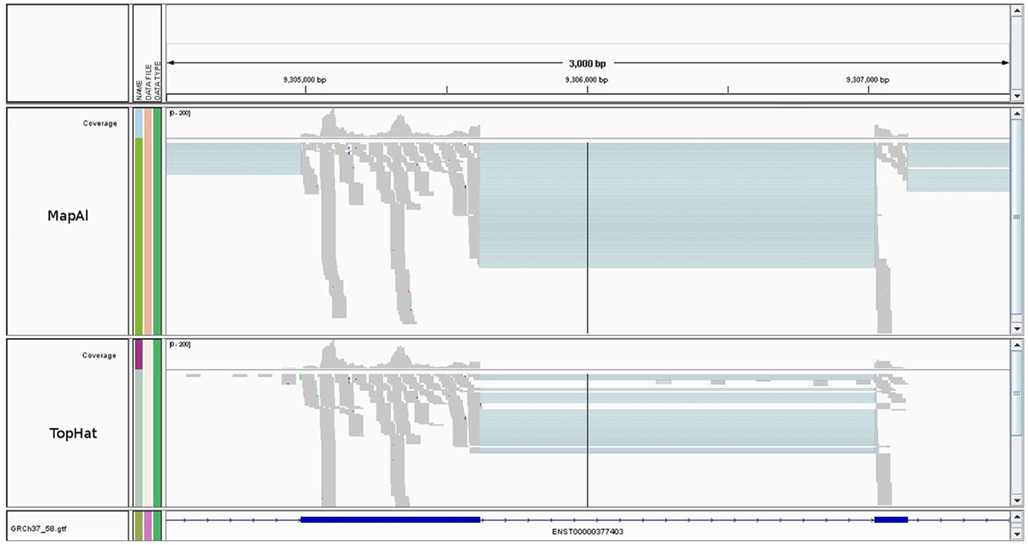
Figure A1. Alignments to a typical transcript. The figure shows an IGV browser window (Robinson et al., 2011). The blue boxes represent the second and third exons of ENST00000377403 (H6PD). The gray coverage band at the top reflects that reads entirely falling into exons are mapped identically by both MapAl (top) and TopHat (bottom). The difference is in the alignments of reads straddling splice junctions.
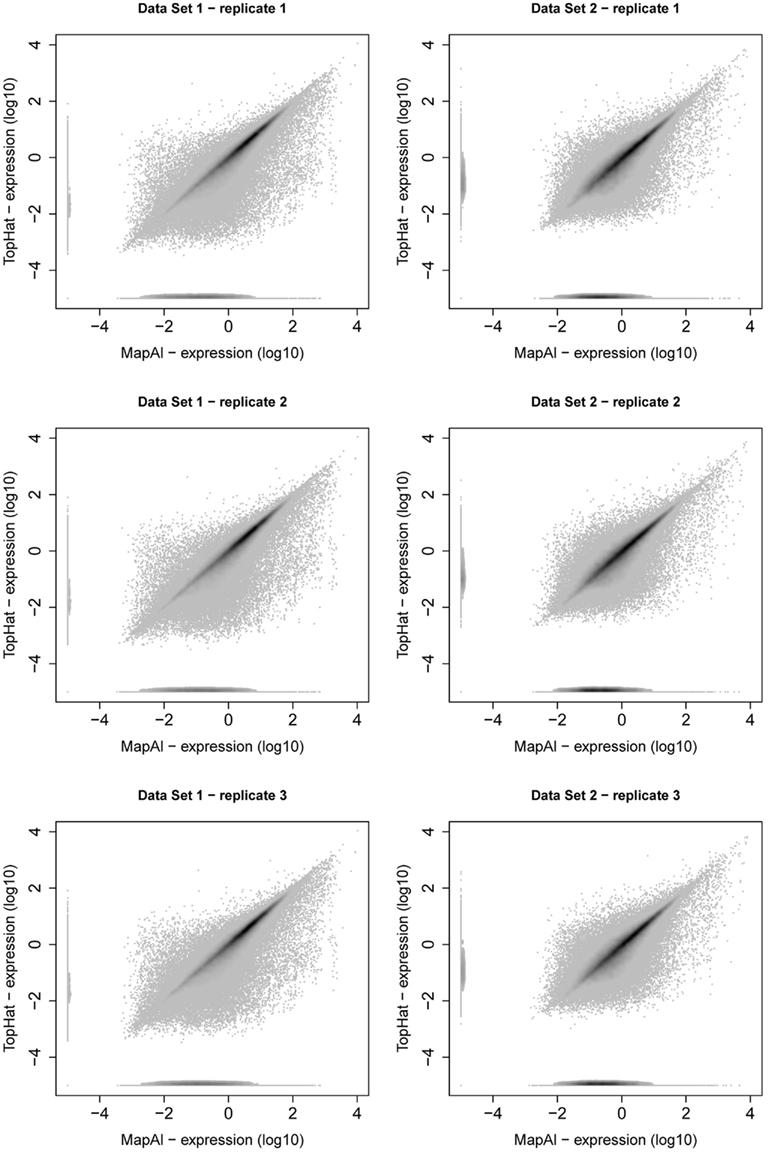
Figure A2. Scatter plot of transcript expression levels. Scatter plots present relation between transcript expression assessed by Cufflinks for TopHat pipeline (y-axis) and MapAl pipeline (x-axis). The left column presents scatter plots of three replicates of Data Set 1, the right column presents scatter plots of three replicates of Data Set 2. From all scatter plots it is clear that substantial amount of transcripts are higher expressed for MapAl pipeline than for TopHat one.
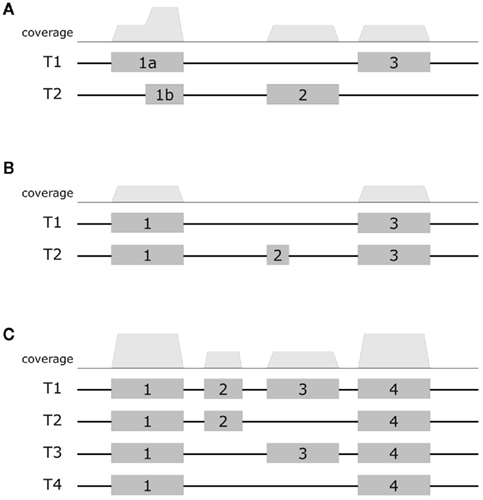
Figure A3. Exemplary gene models. Schematic diagrams presents three example gene models. The top row displays a hypothetical coverage assuming a uniform distribution of reads falling entirely within the exons. The models (A–C) exhibit increasing complexity. In the first model, it is still possible to assess the expression of alternative splice forms even without reads covering exon junctions. Additional junction spanning reads will moderately affect expression level estimates. In the next model, adding read alignments that fall on splice junctions can already considerably affect presence calls and estimates of specific splice-form expression levels. In the most complex model, adding read alignments that fall on splice junctions plays a critical role in assessing the specific splice-form expression levels. In this scenario additional evidence will boost the expression level estimate for the dominant splice-form, while depressing the expression level estimates for the others.
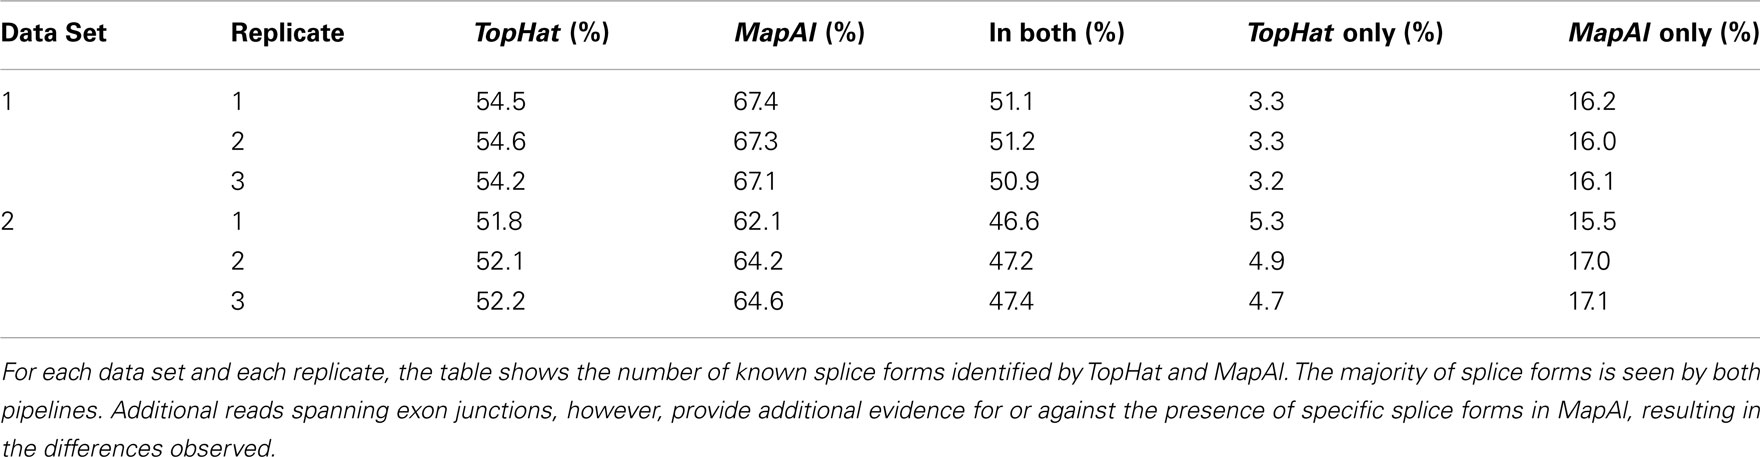
Table A1. Comparison of presence calls.
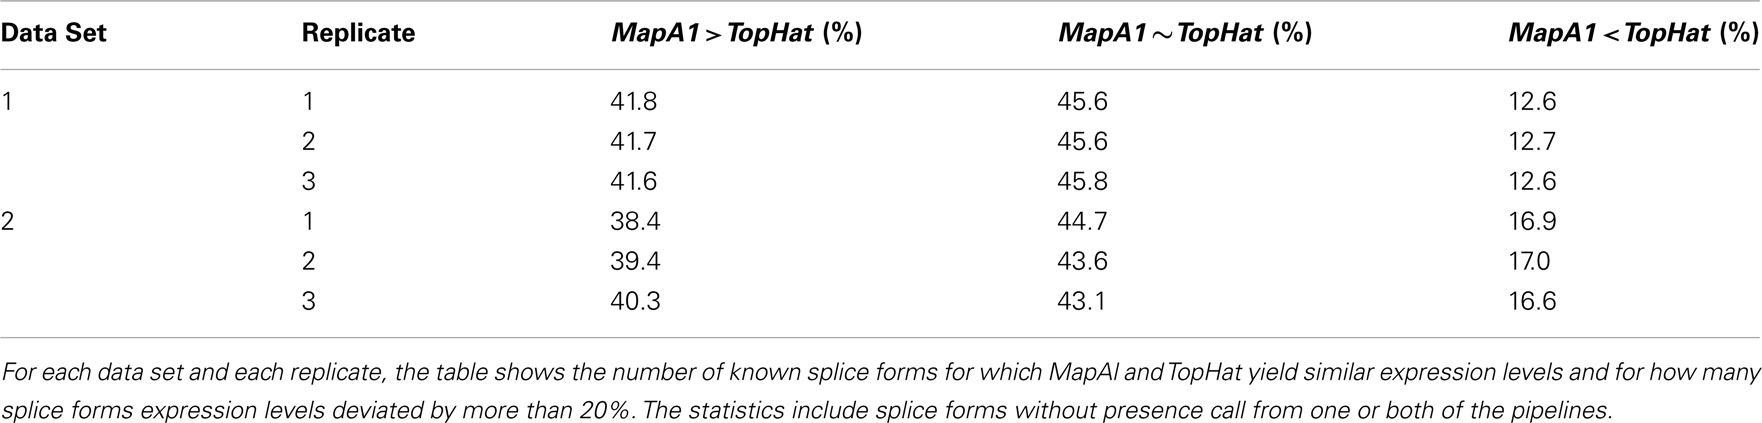
Table A2. Comparison of expression level estimates.
Keywords: RNA-Seq, gene expression profiling, transcriptomics, measurement precision, reliability, splice-form discrimination, read mapping
Citation: Łabaj PP, Linggi BE, Wiley HS and Kreil DP (2012) Improving RNA-Seq precision with MapAl. Front. Gene. 3:28. doi: 10.3389/fgene.2012.00028
Received: 21 November 2011; Accepted: 14 February 2012;
Published online: 02 April 2012.
Edited by:
Richie Soong, National University of Singapore, SingaporeReviewed by:
Yuannian Jiao, The Pennsylvania State University, USAWei Xu, Northwestern University, USA
Copyright: © 2012 Łabaj, Linggi, Wiley and Kreil. This is an open-access article distributed under the terms of the Creative Commons Attribution Non Commercial License, which permits non-commercial use, distribution, and reproduction in other forums, provided the original authors and source are credited.
*Correspondence: David P. Kreil, Boku University Vienna, Muthgasse 18, 1190 Vienna, Austria. e-mail:ZnJvbnRpZXJzMTFAa3JlaWwub3Jn