 Omar de Faria Jr.1,2,3 Qiao-Ling Cui1,3 Jenea M. Bin1,2 Sarah-Jane Bull1,2 Timothy E. Kennedy1,2 Amit Bar-Or1,3 Jack P. Antel1,3 David R. Colman1,2
 Ajit S. Dhaunchak1,2,3*
- 1 Department of Neurology and Neurosurgery, Montreal Neurological Institute and Hospital, McGill University Health Centre, McGill University, Montreal, QC, Canada
- 2 Program in NeuroEngineering of McGill University, Montreal, QC, Canada
- 3 Neuroimmunology Unit, Montreal Neurological Institute and Hospital, McGill University Health Centre, McGill University, Montreal, QC, Canada
MicroRNAs (miRs) regulate diverse molecular and cellular processes including oligodendrocyte (OL) precursor cell (OPC) proliferation and differentiation in rodents. However, the role of miRs in human OPCs is poorly understood. To identify miRs that may regulate these processes in humans, we isolated OL lineage cells from human white matter and analyzed their miR profile. Using endpoint RT-PCR assays and quantitative real-time PCR, we demonstrate that miR-219, miR-338, and miR-17-92 are enriched in human white matter and expressed in acutely isolated human OLs. In addition, we report the expression of closely related miRs (miR-219-1-3p, miR-219-2-3p, miR-1250, miR-657, miR-3065-5p, miR-3065-3p) in both rodent and human OLs. Our findings demonstrate that miRs implicated in rodent OPC proliferation and differentiation are regulated in human OLs and may regulate myelination program in humans. Thus, these miRs should be recognized as potential therapeutic targets in demyelinating disorders.
Introduction
In the central nervous system (CNS), the myelination program that includes oligodendrocyte precursor cell (OPC) proliferation and differentiation is regulated by factors intrinsic and extrinsic to oligodendrocytes (OLs; Sherman and Brophy, 2005). In addition to growth factors, neurotrophins, neuronal factors, and transcription factors, members of a recently recognized class of cell intrinsic regulators known as miRNAs (miRs) have emerged as key regulators of these processes (Emery, 2010). miRs are small (20–22 nt), non-coding RNAs that negatively regulate gene expression by direct binding to a target mRNA. This results in either mRNA degradation or translation blockade, lowering the level of the translated protein. It is estimated that around 30% of all mammalian protein-coding genes are controlled by miRs (Friedman et al., 2009).
Dozens of miRs are expressed in OLs (Lau et al., 2008); some of them, namely miR-219-5p, miR-338-5p, miR-338 -3p, miR-17-92, miR-138, and miR-23 are implicated in the regulation of OPC proliferation or differentiation (Lin and Fu, 2009; Budde et al., 2010; Dugas et al., 2010; Zhao et al., 2010). miRs 219-5p, 338-5p, and 338-3p are among the most highly expressed miRs in GalC+ OLs when compared to A2B5+ precursors (Lau et al., 2008). Interestingly, transfection of these miRs into primary OPCs promotes differentiation and myelin gene expression (Dugas et al., 2010; Zhao et al., 2010). miR-219-5p, miR-338-5p, and miR-338-3p positively regulate OL differentiation by inhibiting the expression of differentiation inhibitors such as Sox6 and HES5 (Nave, 2010).
The miR-17-92 cluster is a polycistronic gene that is amplified in B-cell type lymphomas and lung carcinomas (Ota et al., 2004; Hayashita et al., 2005). This gene encodes six principal mature miRs: miR-17-5p, miR-18a-5p, miR-19a-3p, miR-20a-5p, miR-19b-3p and miR-92a-3p. In addition to a role in accelerating lymphoma tumorigenesis (He et al., 2005), the miR-17-92 cluster regulates survival and proliferation of B-cells and lung epithelia (Hayashita et al., 2005; Matsubara et al., 2007; Ventura et al., 2008). Conditional null mice lacking miR-17-92 cluster expression in OLs display a reduced number of oligodendroglial cells and therefore a function regulating OPC number has been suggested for this miR cluster (Budde et al., 2010).
Though a role for miR-mediated control of rodent OL differentiation is beginning to be elucidated, miR expression and regulation in primary human OPCs and OLs is currently uncharacterized. It is critical to address the specific role of various miRs in human OPC proliferation and differentiation because the majority of predicted miR targets are not conserved between rodents and humans (Table A1 in Appendix). Furthermore, miR-219-5p regulates OPC differentiation in rodents, but not in chicken, and while miR-338-5p and miR-338-3p regulate differentiation in mice, they do not appear to play a similar role in rats or zebrafish (Dugas et al., 2010; Zhao et al., 2010). Moreover, the only study so far addressing miR expression in humans failed to detect miRs relevant for rodent OPCs in OLs differentiated from human embryonic stem cells (Letzen et al., 2010).
A more direct approach to obtain OL lineage cells of human origin is to directly isolate these cells from the adult human white matter (Ruffini et al., 2004; Cui et al., 2010). We have previously isolated different populations of human OLs based on the cell surface expression of the ganglioside recognized by the A2B5 antibody. Adult brain-derived A2B5-positive (A2B5+) cells are able to ensheath axons in vitro (Cui et al., 2010) and engage in extensive myelination upon transplantation into the myelin-deficient shiverer mice (Windrem et al., 2004). These cells are extensively committed with the OL lineage although expression of NG2 and incorporation of BrdU in vitro indicate that they have retained some progenitor properties. Adult brain-derived A2B5-negative (A2B5−) cells express MBP, PLP, and MAG, but not NG2; they are post-mitotic and consistent with this, PDGFRα is highly downregulated in this fraction (Ruffini et al., 2004 and data not shown). We have therefore isolated primary human OL lineage cells from the human adult brain to analyze the expression of miRs that regulate OPC differentiation and proliferation in rodents. Using RT-PCR and real-time quantitative real-time RT-PCR we demonstrate that some of rodent OPC relevant miRs are enriched in the human white matter and regulated in acutely isolated human A2B5+ and A2B5− cells. We also report the expression in rodent/human OLs of miR-219-1-3p, miR-219-2-3p, miR-1250, miR-657, miR-3065-5p, and miR-3065-3p. In addition, we provide estimates of relative abundance of each miR in human and rodent OLs. Our data represent the first evidence that rodent-relevant miRs may also regulate OL proliferation and differentiation in humans.
Materials and Methods
Rodent Oligodendrocyte Culture
Sprague-Dawley rat pups were obtained from Charles River Canada (QC, Canada). All procedures were performed in accordance with the Canadian Council on Animal Care guidelines. Mixed glial cultures were generated from postnatal day 0 Sprague-Dawley rat cortices and OPCs isolated as previously described (Armstrong, 1998). Mixed cultures were maintained for 8–10 DIV in OPC medium (DMEM, 10% FBS, 1% penicillin–streptomycin, 1% Glutamax) prior to OPC isolation. OPCs were plated at a density of 150,000 cells per well in 12-well plates in OLDEM (DMEM, 5 μg/ml insulin, 100 μg/ml transferrin, 30 nM sodium selenite, 30 nM triiodothyronine, 100 μg/ml penicillin–streptomycin, 2 mM glutamax) and allowed to mature for 8 h (DIV1), 4 days (DIV5), or 7 days (DIV8) in vitro prior to RNA and protein isolation.
Human Adult Brain Tissue and Primary OL Isolation
We obtained white matter tissue excised from surgical resections carried out to ameliorate non-tumor-related intractable epilepsy as previously described (Ruffini et al., 2004; Dhaunchak et al., 2010). The protocol was approved by an institutional review board according to the guidelines provided by the Canadian Institutes for Health Research. Informed consent was obtained from all subjects. After surgery, white and gray matter were dissected and frozen for subsequent RNA isolation or directly processed for OL isolation. Briefly, tissue was subjected to enzymatic/mechanical dissociation and cells separated on a linear 30% percoll density gradient. The resulting suspension was plated in minimal essential medium containing 5% fetal calf serum for 24 h. The next day, the poorly adherent cells enriched in human OPCs/OLs were removed and incubated on ice with microbead-conjugated A2B5 IgM antibody. After washing with magnetic cell sorting (MACS) buffer (phosphate-buffered saline, 2 mM EDTA, 5% FCS), cells were sorted using a positive selection column (Miltenyi Biotech). The A2B5-positive (A2B5+) and negative (A2B5−) fractions were lysed, homogenized, and frozen for subsequent RNA isolation.
MO3.13 Cell Line
MO3.13 cells (McLaurin et al., 1995; a gift from Dr. P Talbot) were cultured and passaged as previously described (McLaurin et al., 1995; Dhaunchak et al., 2011).
Reverse Transcription Reaction
miRNA cDNA synthesis required miRNA-specific stem-loop primers designed as previously described (Chen et al., 2005; Tang et al., 2006; Schmittgen et al., 2008). Fifty to two-hundred nanograms of total RNA was combined with 5 nM miR-specific stem-loop primers, 3 μl of 5 × RT reaction buffer, 1 mM dNTP, 0.26 U/μl ribonuclease inhibitor (Invitrogen, cat. No 10777-019), and 3.3 U/μl reverse transcriptase (Invitrogen, cat. No 18064-014) in a 15-μl total volume reaction. Reverse transcription was performed in a pulsed reaction with the following cycling parameters: 16°C for 30 min, followed by 60 cycles of 20°C for 30 s, 42°C for 30 s, and 50°C for 1 s. Finally, reverse transcriptase was inactivated at 85°C for 5 min. A separate RT reaction was performed in order to synthesize 18S RNA and mRNA cDNA. Equal amounts of RNA (50–200 ng) were combined with 300 ng of random hexamer primers and heated to 65°C for 10 min. Samples were allowed to stand on ice for 2 min and a mixture containing 1× RT buffer, 1 mM dNTP, 2 U/μl ribonuclease inhibitor (Invitrogen, cat. No 10777-019), and 10 U/μl reverse transcriptase (Invitrogen, cat. No 18064-014) was added to the sample (total volume = 20 μl). The reverse transcription reaction was performed at 25°C for 5 min, followed by 50°C for 30 min and 55°C for 30 min. At the end of the reaction, reverse transcriptase was inactivated at 70°C for 15 min.
Pre-PCR
A multiplex pre-PCR step was included before PCR analysis in order to detect low expression miRNAs (Tang et al., 2006). miRNA-specific sense-primers and a universal anti-sense primer pairing to the cDNA stem-loop region were designed as described by Chen et al. (Chen et al., 2005; Tang et al., 2006; Schmittgen et al., 2008). Five microliters of the RT product was combined with 50 nM sense primer, 2 μM universal anti-sense primer, 5 μl of 5 × PCR buffer, 0.5 mM dNTP, and 0.25 U/μl Taq polymerase (NEB, cat. No M0324S) in a 25-μl total volume reaction. PCR cycling parameters were: 95°C for 10 min, 55°C for 2 min followed by 18 cycles of 95°C for 1 s and 65°C for 1 min. The product was 400-fold diluted for real-time analysis.
Quantitative Real-Time PCR
Diluted pre-PCR product was combined with 1 μM sense primer, 1 μM universal anti-sense primer and 7.5 μl of 2 × SYBR Green PCR master mix (Invitrogen, cat. No 4364344) in a 15-μl total volume reaction. Real-time qPCR was performed in the Applied Biosystems 7000 thermocycler with the following cycling conditions: 95°C for 10 min, followed by 40 cycles of 95°C for 25 s, 59°C for 30 s, and 72°C for 40 s (Tang et al., 2006; Schmittgen et al., 2008). Data analysis used the 2−ΔΔCt method (Winer et al., 1999; Schmittgen et al., 2000) and qBase software (Hellemans et al., 2007) to generate expression values. Values were normalized to 18S RNA levels.
Semi-Quantitative RT-PCR
Equal volumes of diluted pre-PCR product were combined with 1 μM each sense and anti-sense-primers, 3 μl of 5 × PCR buffer, 0.5 mM dNTP, and 1 U of Taq polymerase (NEB, cat. No M0324S) in a 15-μl total volume reaction. The PCR amplification was performed in the Biometra T1 plus thermocycler with the following cycling conditions: 95°C for 3 min, followed by 40 cycles of 94°C for 30 s, 55°C for 30 s, and 72°C for 30 s. Final extension was carried out at 72°C for 10 min. PCR product was resolved by 20% polyacrylamide gel electrophoresis and stained with ethidium bromide for 45 min prior to image acquisition.
Primers
A list containing all the primers used in this study can be found in the Appendix section (Table A2 in Appendix).
Western Blot
Equal amounts of protein resolved by SDS-PAGE were transferred to a PVDF membrane (BioRad, cat. No 1620184). The membrane was blocked with 5% milk in TBST (25 mM Tris pH 7.4, 27 mM KCl, 137 mM NaCl, 0.1% Tween 20) for 1 h and incubated with primary antibodies overnight at 4°C. The membrane was washed three times with TBST and incubated with horseradish peroxidase-conjugated secondary antibodies for 1 h at room temperature (1:10,000 in 0.1% milk-TBST). The membrane was washed three times with TBST and developed with an Enhanced Chemiluminescence Detection kit (Pierce, cat. No 32106). Primary antibodies used: monoclonal mouse 3F4 anti-PLP (hybridoma supernatant; Dhaunchak and Nave, 2007); polyclonal rabbit anti-GAPDH (Santa Cruz, SC-25778); monoclonal mouse anti-β-actin (Sigma, A5441).
Statistical Analysis
Expression analysis in murine brain developmental series was performed in pooled triplicates (n = minimum of three animals per age group). Expression analysis from cultured rat OPCs was quantified from a representative experiment, of n = 3 independent experiments, performed in triplicates. For comparison of these developmental stages, one-way ANOVA test followed by Tukey’s post-test was performed. miR enrichment in human white matter was performed from two independent samples in triplicates. For miR expression in acutely isolated primary human cells, A2B5+, and A2B5− cells were obtained from four independent surgical resections from different subjects, each analyzed in triplicates. The comparison of human samples was performed by unpaired Student’s t-test.
Results
In order to profile miRNA expression in oligodendrocytes, we first validated the RT-PCR primers by conventional PCR followed by polyacrylamide gel electrophoresis and found unique amplicons (∼70 nts) for every primer pair (Figure 1; Table A2 in Appendix). In addition, the dissociation curves obtained after real-time RT-PCR amplification of a representative human cDNA sample confirmed that only one major product is generated during real-time quantification. Thus the primer pairs listed in Table A2 in Appendix can be reliably used to profile miRs in human samples.
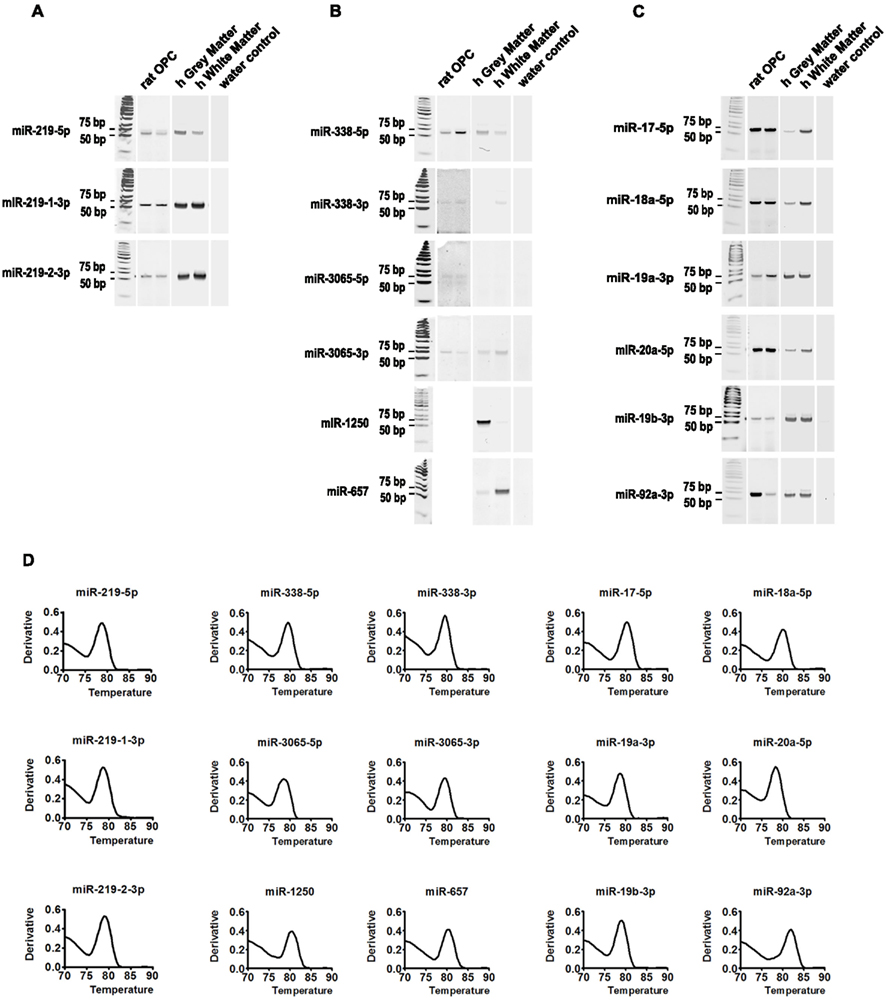
Figure 1. Validation of miR-specific primers. Endpoint RT-PCR followed by polyacrylamide gel electrophoresis showing that all miR primers yield a unique RT-PCR product with an expected amplicon of ∼70 nts. The entire gels are shown. Rat OPC (lane 1; 1 DIV and lane 2; 5 DIV), human brain (lane 3; h gray matter and lane 4; h white matter) and water control (lane 5). (A) Amplification of miRs 219 loci products yield a single amplicon in both human and rodent samples. (B) Amplification of miR-338 cluster products yields a single amplicon in both human and rodent samples, except for 3065-5p which was undetectable in the human samples used at this time. Note that miR-1250 and miR-657 are only predicted to be expressed by humans, thus, only the human samples are shown. (C) Amplification of miR-17-92 cluster products yields a single amplicon in both human and rodent samples. (D) Representative melting point analysis for each primer pair. The derivative of dissociations confirms that a single major amplicon is generated during quantitative real-time RT-PCR. The representative curves are average of four replicates.
Regulation of MiR-219 Expression during OPC Differentiation
In humans and mice, two loci encode miR-219 precursor transcripts, mir-219-1 and mir-219-2 (Figure 2A). Processing of the precursor transcripts by dicer generates three miRs: miR-219-5p from the 5′ ends of both precursors and the miRs miR-219-1-3p and miR-219-2-3p from the 3′ end of precursors mir-219-1 and mir-219-2, respectively. Since the seed region in the three resulting mature products is unique, each miR is predicted to regulate the expression of unique targets. Though miR-219-5p is known to be upregulated during rodent OPC differentiation, expression of miR-219-1-3p and miR-219-2-3p has not been studied. We therefore analyzed the expression of all three miRs in rodent brain and cultured OPCs by quantitative real-time PCR.
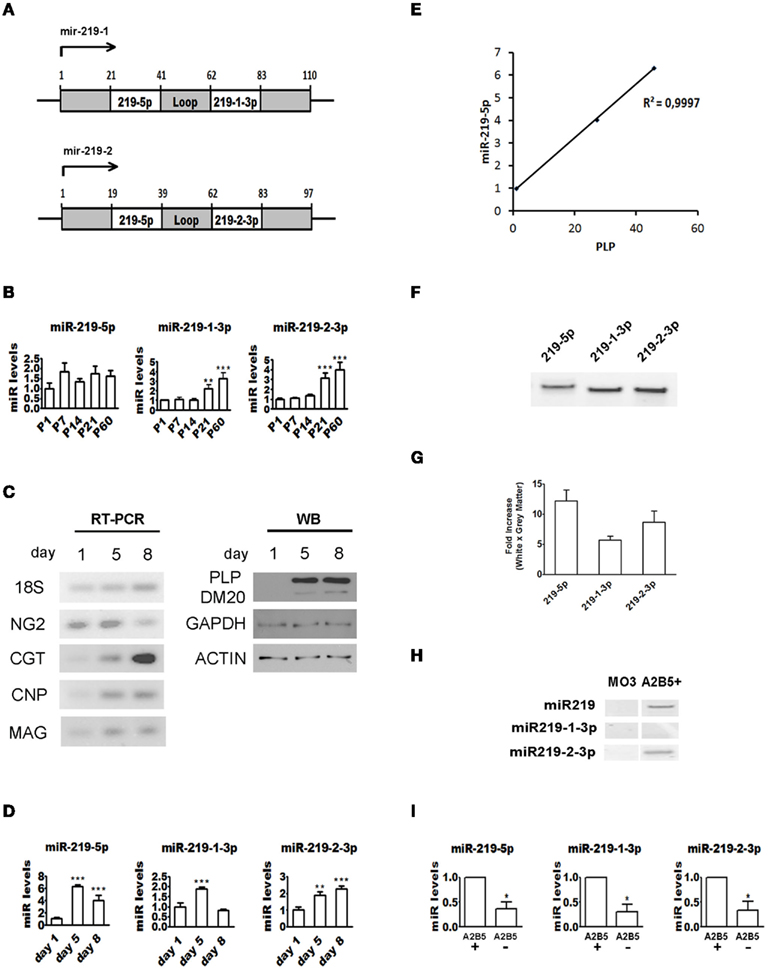
Figure 2. Regulation of miR-219 expression during OPC differentiation. (A) Schematic showing human mir-219-1 and mir-219-2 genomic structures. Processing of the precursor transcripts generates the same miR-219-5p and two unique miRs, 219-1-3p and 219-2-3p. (B) Quantitative real-time RT-PCR showing elevation in all three mature products during postnatal mouse brain development. ΔΔCt method was used to calculate miR levels normalized to 18S RNA expression. Each time point represents at least three pooled animals analyzed in triplicates. P values are derived from one-way ANOVA analysis followed by the Tukey’s post-test. **P < 0.01; ***P < 0.001. (C) Left panel: endpoint RT-PCR followed by agarose gel electrophoresis showing that early OPC genes are downregulated and myelin genes are upregulated when rat OPCs are cultured in vitro in the absence of mitogens. Right panel: western blot showing that PLP is upregulated during OPC differentiation. (D) Quantitative real-time RT-PCR showing upregulation of all three mature miR-219 products during rat OPC differentiation in vitro. ΔΔCt method was used to calculate miR levels normalized to 18S RNA expression. The graphs are representative of one of the three experiments performed in triplicates. P values are derived from one-way ANOVA analysis followed the Tukey’s post-test. **P < 0.01; ***P < 0.001. (E) Pearson correlation between miR-219-5p and PLP levels during rat OPC differentiation in vitro. miRNA levels were calculated as described in (D). P value is derived from two-tailed unpaired Student’s t-test. P < 0.05. (F) Endpoint RT-PCR followed by polyacrylamide gel electrophoresis showing that all three mature miR-219 products are expressed in the human brain. (G) Quantitative real-time RT-PCR showing that miR-219 mature products are enriched in human brain white matter. ΔΔCt method was used to calculate miR levels normalized to 18S RNA expression. Fold-change was calculated by dividing miR levels in white matter by levels in gray matter. The graphs are obtained from analysis of two brains done in triplicates. P values are derived from two-tailed unpaired Student’s t-test. (H) Endpoint RT-PCR followed by polyacrylamide gel electrophoresis showing that miR-219 mature products are expressed by human A2B5+ OLs. (I) Quantitative real-time RT-PCR showing that miR-219 levels are higher in adult human A2B5+ cells when compared to A2B5− OLs. ΔΔCt method was used to calculate miR levels normalized to 18S RNA expression. Each bar represents the average of four subjects analyzed by real-time PCR done in triplicates. P values are derived from two-tailed unpaired Student’s t-test. *P < 0.05.
miR-219-5p levels show elevation trend after the first postnatal week in mouse brain (Figure 2B; 1.85-fold at P7, 1.76-fold at P21, P = 0.051), coinciding with the period of OPC differentiation in rodents (Kessaris et al., 2006). In contrast, both miR-219-1-3p and miR-219-2-3p show late (P21) but robust upregulation lasting into adulthood (Figure 2B). Since the expression changes detected in total brain could result from non-OL lineage cells, we next profiled miR expression in cultures enriched with rat OPCs. Prior to the miR expression analysis, we confirmed by endpoint RT-PCR and western blot that when cultured in the absence of mitogens, OPCs downregulate precursor genes (NG2) and upregulate myelin genes (PLP, MAG, CGT; Figure 2C). Quantitative real-time RT-PCR shows that miR-219-5p is dramatically upregulated, peaking at DIV5 (>6-fold higher than at DIV1) and dropping by DIV8, but remaining higher than at DIV1 (Figure 2D). Interestingly, miR-219-5p levels correlate very well with PLP expression at all time points (Pearson coefficient = 0.999, P = 0.01; Figure 2E). Additionally, we found that miR-219-1-3p and 219-2-3p are regulated during rodent OPC differentiation: miR-219-1-3p peaks at DIV5, but returns to DIV1 levels by DIV8 whereas miR-219-2-3p levels remain high through DIV5 to DIV8. We also compared the relative miR level at each DIV and found that despite the upregulation of miR-219 products during OPC differentiation, their levels are still lower than miR-17-92 cluster (Table 1). In addition, the higher levels of miR-219-5p when compared to miR-219-1/2-3p suggests that miR-219-5p may be preferentially excised from the stem-loop precursor during OPC differentiation (Table 1). Overall, our data establish that the levels of miR-219-5p and two related miRs, miR-219-1-3p and miR-219-2-3p, increase in the rodent brain as it matures in vivo and in rodent OPCs as they differentiate in vitro.
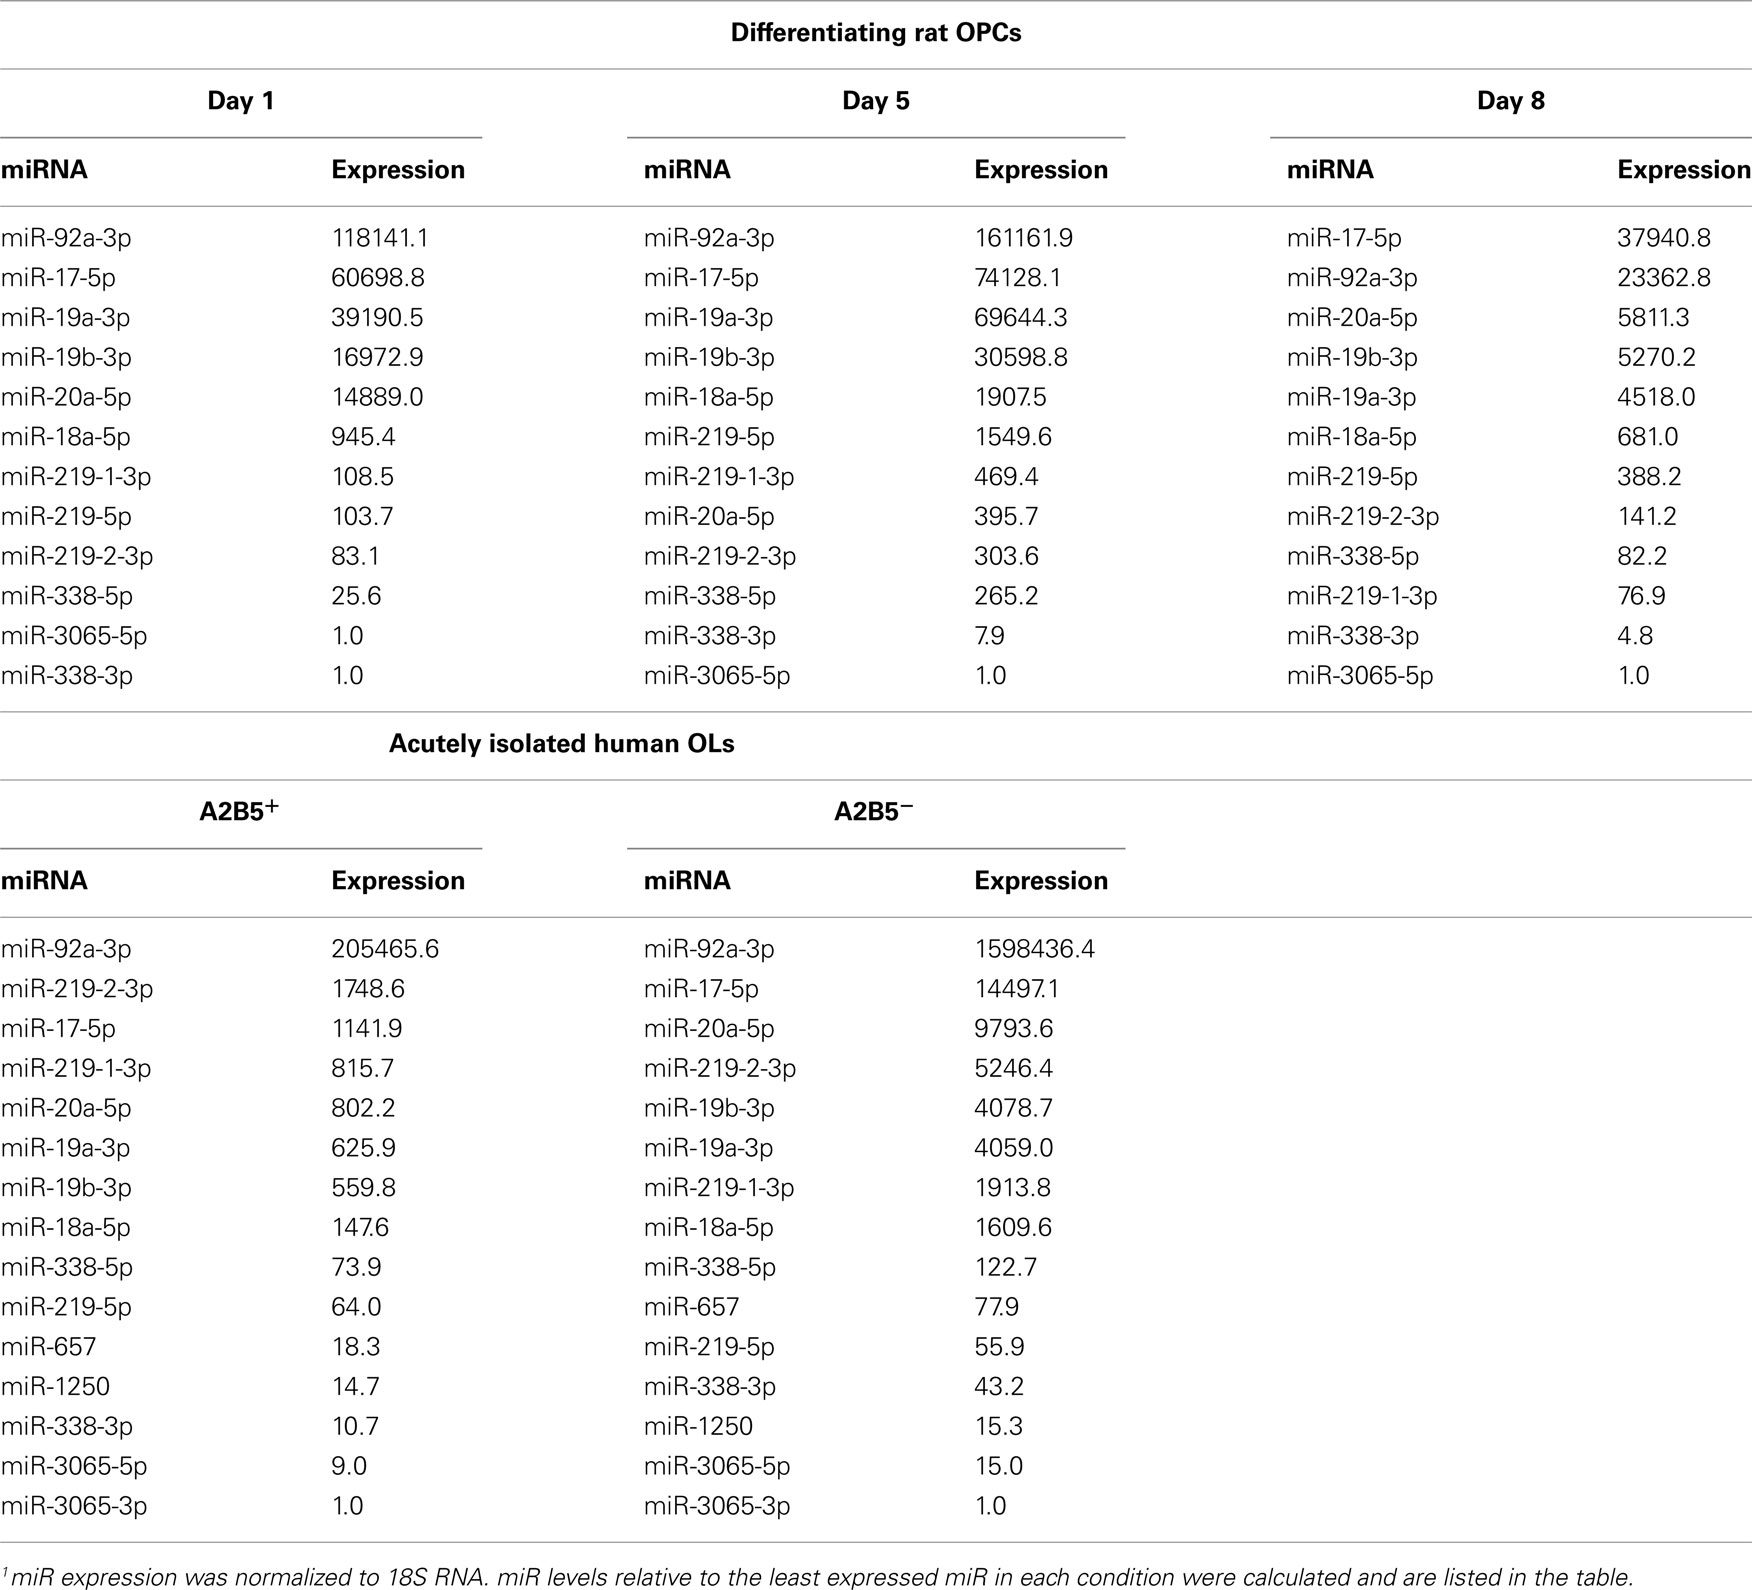
Table 1. Relative expression analysis of miRs in rodent and human OLs1.
We next asked if miR-219 mature products are expressed in the human adult brain. Endpoint RT-PCRs followed by polyacrylamide gel electrophoresis shows that transcripts of all three mature miRs (miR-219-5p, miR-219-1-3p, and miR-219-2-3p) are detectable in the human brain (Figure 2F). To determine if these miRs are enriched in human cortical white matter tracts, we compared the levels of miRs 219-5p, 219-1-3p, and 219-2-3p in white and gray matter by quantitative real-time RT-PCR and found that these miRs are at least five times enriched in the white matter (Figure 2G). As this result suggests that miR-219 family members are expressed by glial cells, we profiled miR expression in human OLs. For this purpose, we isolated OL lineage cells from the human adult brain and used cell sorting to separate stage-specific populations of OLs based on the cell surface expression of the ganglioside recognized by the antibody A2B5; in addition, we also investigated miR expression in the human OPC cell line MO3.13 (McLaurin et al., 1995). Using endpoint RT-PCR followed by polyacrylamide gel electrophoresis we did not detect expression of any miR-219 mature products in MO3.13 cells. However, miR-219-5p and miR-219-2-3p were readily detected in acutely isolated human A2B5+ cells, in contrast to the previously reported in Ols derived from embryonic stem cells (Letzen et al., 2010; Figure 2H). Quantitative real-time RT-PCR analysis indicates that both A2B5+ and A2B5− OLs express the three miRs and that expression is downregulated as cells mature from A2B5+ to A2B5− OLs (Figure 2I). In summary, our findings provide the first evidence that human OL lineage cells express mature products of the miR-219 locus, indicating a conserved role for these miRs during human OL differentiation.
Regulation of the MiR-338 Cluster during OPC Differentiation
In humans, the miR-338 cluster encodes six different mature miRs (miR-338-5p, miR-338-3p, miR-3065-5p, miR-3065-3p, miR-657, and miR-1250) that are encoded by four independent loci (Figure 3A). Mir-657 and mir-1250 each encode only a single mature form (from the 3′-end of mir-657 and the 5′-end of mir-1250). Interestingly, these two miRs are specific to humans and have not been detected in rodents. miRs 338-5p and 338-3p were previously detected in mature rodent OLs but miR-3065 expression has not been demonstrated before. We therefore used quantitative real-time RT-PCR to study the expression of all miR-338 cluster members during mouse brain development and OPC differentiation in vitro (Figures 3B,C).
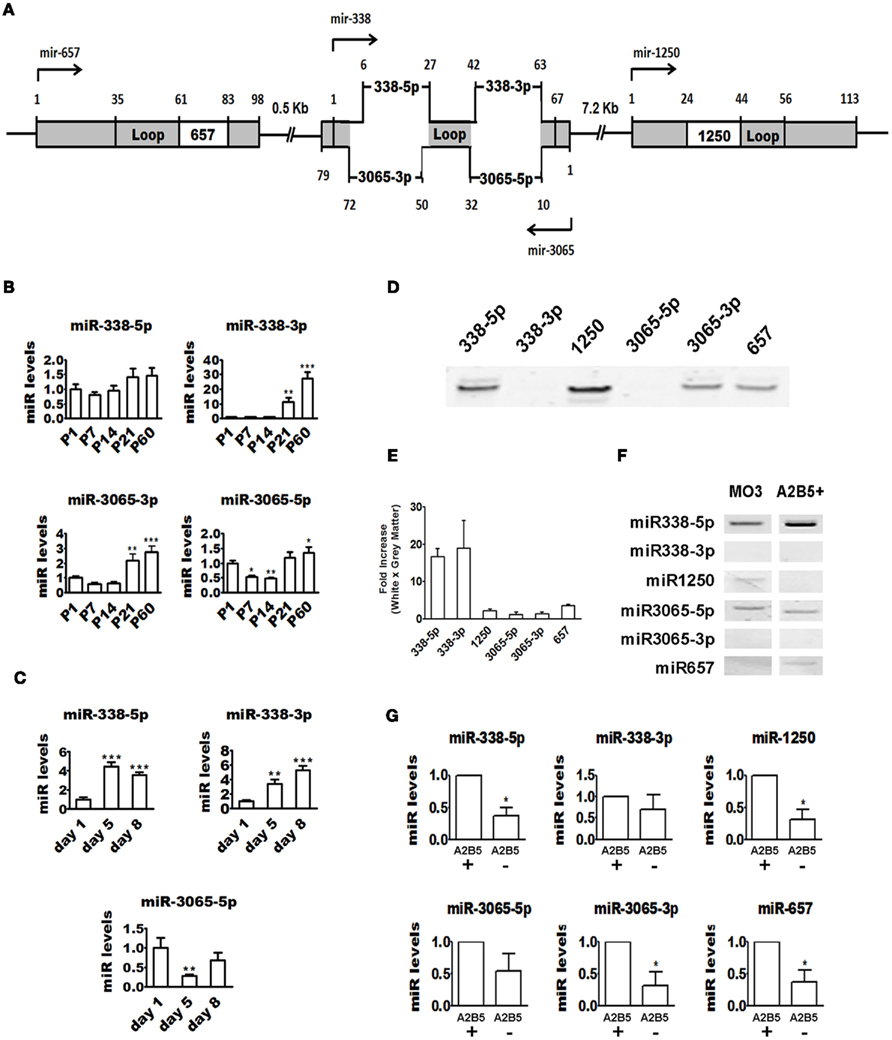
Figure 3. Regulation of miR-338 cluster expression during OPC differentiation. (A) Schematic showing human mir-338 cluster genomic structure. Note that miR-3065 is encoded by the complementary strand of miR-338. (B) Quantitative real-time PCR showing that overall expression of miR-338 cluster increases in the mouse brain during postnatal development. ΔΔCt method was used to calculate miR levels normalized to 18S RNA expression Each time point represents at least three pooled animals analyzed in triplicates. P values are derived from one-way ANOVA analysis followed by the Tukey’s post-test. *P < 0.05; **P < 0.01; ***P < 0.001. (C) Quantitative real-time PCR showing upregulation in miR-338-5p and -3p and downregulation of miR-3065-5p during rat OPC differentiation in vitro. ΔΔCt method was used to calculate miR levels normalized to 18S RNA expression. The graphs are representative of one of the three experiments performed in triplicates. P values are derived from one-way ANOVA analysis followed by the Tukey’s post-test. **P < 0.01; ***P < 0.001. (D) Endpoint RT-PCR followed by polyacrylamide gel electrophoresis showing that the miR-338 cluster is expressed in the human brain. (E) Quantitative real-time PCR showing that all members of the miR-338 cluster except for miRs 3065-5p and -3p are enriched in human brain white matter. ΔΔCt method was used to calculate miR levels normalized to 18S RNA expression. Fold-change was calculated by dividing miR levels in white matter by levels in gray matter. The graphs are obtained from analysis of two different brains done in triplicates. P values are derived from two-tailed unpaired Student’s t-test. (F) Endpoint RT-PCR followed by polyacrylamide gel electrophoresis showing that miR-338 cluster is expressed by the human cell line MO3.13 and human A2B5+ OLs. (G) Quantitative real-time PCR showing that levels of some miR-338 cluster members are higher in adult human A2B5+ cells than A2B5− OLs. ΔΔCt method was used to calculate miR levels normalized to 18S RNA expression. Each bar represents the average of four subjects analyzed by real-time PCR done in triplicates. P values are derived from two-tailed unpaired Student’s t-test. *P < 0.05.
During maturation of the mouse brain, miR-338-3p undergoes a robust upregulation similar to that of the 219-3p miRs. Specifically, there is a delayed 10-fold elevation in miR-338-3p expression at P21 and a 30-fold elevation at P60 (compared to the levels at P1). In contrast, miR-338-5p appears to be expressed throughout postnatal development. miR-3065 shows a unique profile with significant downregulation during the first two postnatal weeks and upregulation by the third week (Figure 3B). Quantitative real-time RT-PCR shows that in vitro OPC differentiation is marked by a robust upregulation (five-fold increase) of both miR-338-5p and miR-338-3p (Figure 3C). Interestingly, we found miR-338-5p to be more abundant then miR-338-3p from day 1 to day 8, indicating preferential maturation of the miR located at 5′ arm of the pre-miR-338 (Table 1). miR-3065-5p is highly expressed at DIV1 but markedly downregulated at DIV5. These data suggest that the positive and negative strands of the miR-338 locus, producing miR-338 and miR-3065, respectively, are preferentially transcribed during different stages of rodent OPC differentiation.
Since the miR-338 cluster in humans encodes two additional miRs not found in rodents (miR-1250 and miR-657), we investigated the expression of these miRs in human samples. We first studied the expression profile of all six mature miRs transcribed from the miR-338 cluster locus in human brain. By endpoint RT-PCR followed by polyacrylamide gel electrophoresis, we were able to detect the expression of miRs 338-5p, 1250, 3065-3p, and 657 (Figure 3D). Although miR-338-3p and miR-3065-5p were not detected by RT-PCR, both miRs were readily amplified using more sensitive real-time RT-PCR. To our knowledge, this is the first report of the expression of miRs 1250, 3065-5p, 3065-3p, and 657 in the human brain. We next used quantitative real-time RT-PCR to compare expression levels in white and gray matter and found that miR-338-5p and miR-338-3p are highly enriched (>15-fold) in white matter tracts (Figure 3E). miR-3065-5p and miR-3065-3p do not show any clear enrichment in either white or gray matter while miR-1250 and miR-657 are slightly concentrated in the white matter (2- and 3.5-fold enrichment respectively).
The enrichment of miR-338-5p and miR-338-3p in the white matter suggests that human glial cells express these miRs. To determine whether this is the case, we performed endpoint RT-PCR in the MO3.13 cell line and acutely isolated OLs. Using this method, we found that miR-338-5p, miR-1250, and miR-3065-5p are expressed in the MO3.13 cell line whereas miR-338-5p, miR-3065-5p, and miR-657 are expressed in A2B5+ cells (Figure 3F). Quantitative real-time RT-PCR analysis shows that all miR-338 cluster members are detectable in acutely isolate OLs and that miR-338-5p, miR-1250, miR-3065-5p, and miR-657 are significantly downregulated in the A2B5− fraction (Figure 3G). Interestingly, relative expression analysis grouped miR-338 cluster members together, suggesting that these miRs may be co-transcribed in human OLs (Table 1). In summary, we provide the first evidence that miR-338 cluster is expressed in human OLs, as previously demonstrated in rodents (Lau et al., 2008; Dugas et al., 2010; Zhao et al., 2010). These findings suggest a conserved role for the miR-338 cluster in regulating OPC differentiation in humans.
Regulation of the miR-17-92 Cluster during OPC Differentiation
The miR-17-92 cluster encodes 12 different miRs in both humans and rodents. Some of them (miR-17-5p, 18a-5p, 19a-3p, 20a-5p, 19b-3p, and 92a-3p, highlighted in red in Figure 4A) have been implicated in the regulation of OPC proliferation in rodents, but their expression during postnatal brain development and cultured OPC differentiation has not been addressed (Budde et al., 2010). We used quantitative real-time RT-PCR to study the expression of these miRs during mouse brain development and found a dramatic downregulation within the first postnatal week, in agreement with their role in controlling OPC number (Budde et al., 2010). When compared to P1, levels at P7 are about 90% reduced and maintained at a similarly low level into adulthood (Figure 4B). Intriguingly, at P21, a significant upregulation from levels at P7 is seen for all miRs except miR-92a-3p, suggesting that these miRs also play some specialized role in the postnatal brain. Quantitative real-time RT-PCR shows that miRs 19a-3p, 20a-5p, 19b-3p, and 92a-3p are also clearly downregulated in cultured OPCs during differentiation (Figure 4C). No significant changes are seen for miRs 17-5p and 18a-5p. Though most miR-17-92 cluster members are downregulated during OPC differentiation, relative expression analysis reveals that these miRs are the most highly expressed miRs in both precursor and mature OLs (Table 1), suggesting that these miRs might play a role in regulating levels of housekeeping transcripts in OLs.
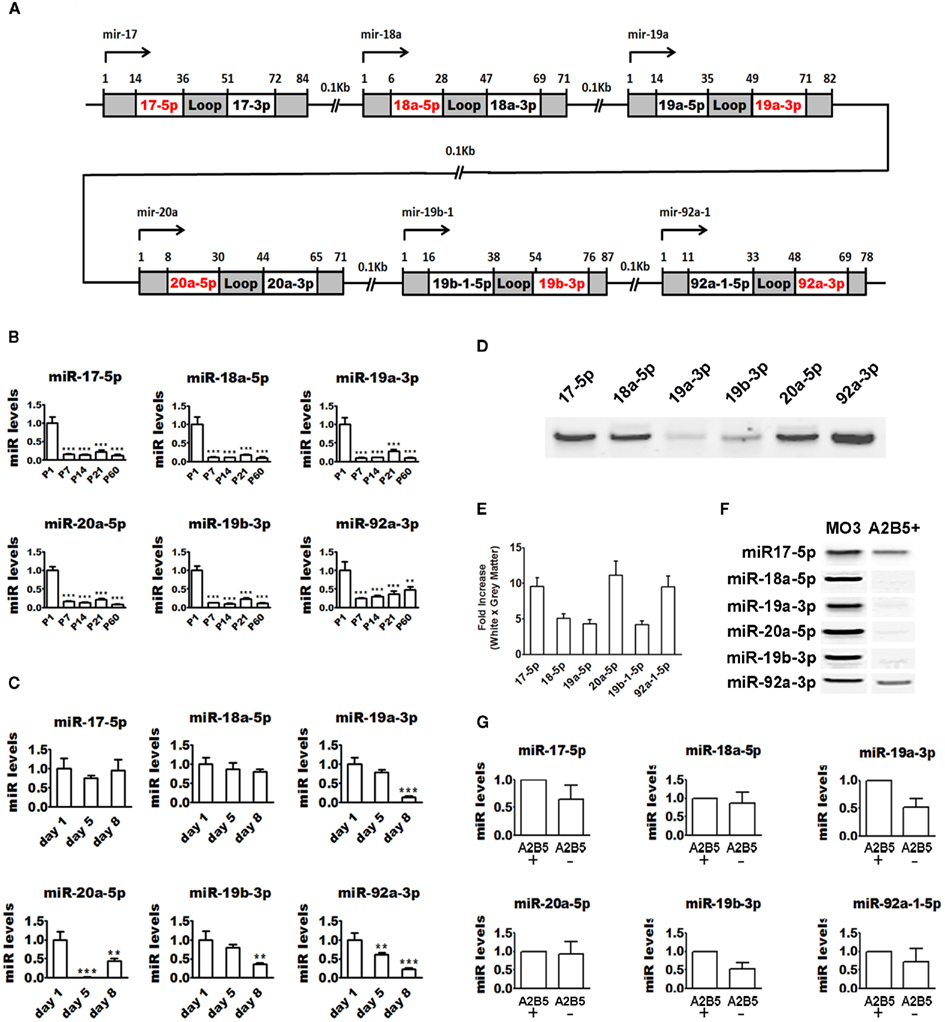
Figure 4. Regulation of miR-17-92 cluster expression during OPC differentiation. (A) Schematic showing the human mir-17-92 cluster genomic structure. (B) Quantitative real-time PCR showing that levels of members of the miR-17-92 cluster are dramatically downregulated during postnatal mouse brain development. ΔΔCt method was used to calculate miR levels normalized to 18S RNA expression. Each time point represents at least three pooled animals analyzed in triplicates. P values are derived from one-way ANOVA analysis followed by the Tukey’s post-test. **P < 0.01; ***P < 0.001. (C) Quantitative real-time PCR showing that levels of members of the miR-17-92 cluster are downregulated during rat OPC differentiation in vitro. ΔΔCt method was used to calculate miR levels normalized to 18S RNA expression. The graphs are representative of one of the three experiments performed in triplicates. P values are derived from one-way ANOVA analysis followed by the Tukey’s post-test. **P < 0.01; ***P < 0.001. (D) Endpoint RT-PCR followed by polyacrylamide gel electrophoresis showing that miR-17-92 members are expressed in the human brain. (E) Quantitative real-time PCR showing that miR-17-92 members are enriched in the human brain white matter. ΔΔCt method was used to calculate miR levels normalized to 18S RNA expression. Fold-change was calculated by dividing miR levels in white matter by levels in gray matter. The graphs are obtained from analysis of two brains done in triplicates. P values are derived from two-tailed unpaired Student’s t-test. (F) Endpoint RT-PCR followed by polyacrylamide gel electrophoresis showing that miR-17-92 members are expressed by MO3.13 cells and human A2B5+ OLs. (G) Quantitative real-time PCR analysis of the miR-17-92 cluster members in human A2B5+ and A2B5− OLs shows no difference in expression between the two cell types. ΔΔCt method was used to calculate miR levels normalized to 18S RNA expression. Each bar represents the average of four subjects analyzed by real-time PCR done in triplicates. P values are derived from two-tailed unpaired Student’s t-test.
All six miR-17-92 cluster members are readily detected in the adult human brain by endpoint RT-PCR (Figure 4D). In addition, quantitative real-time RT-PCR shows that they are enriched in white matter tracts when compared to gray matter (>4-fold; Figure 4E). We also used endpoint RT-PCR to study their expression in human OL lineage cells and found that all miRs are expressed in the human OPC cell line (MO3.13) and in acutely isolated A2B5+ OLs (Figure 4F). Quantitative real-time RT-PCR analysis revealed that expression of the miR-17-92 cluster is highly upregulated in MO3.13 cells when compared with adult primary OLs (data not shown). All miR-17-92 miRs were readily detectable by quantitative real-time RT-PCR in both A2B5+ and A2B5− OLs with no significant differences in expression levels between the two populations (Figure 4G). This data is in agreement with the relative expression analysis revealing that this cluster represents one of the most highly expressed miRs in both A2B5+ and A2B5− OLs (Table 1).
Discussion
We have applied endpoint RT-PCR followed by polyacrylamide gel electrophoresis and quantitative real-time RT-PCR to profile miR expression in human OLs. Our focused approach prioritized miRs that have been previously shown to regulate OPC number and differentiation in rodents. The current data provides evidence for the expression of miR-219, miR-338, and miR-17-92 clusters in acutely isolated-adult brain OLs in marked contrast to what was observed with human OLs derived from embryonic stem cells (Letzen et al., 2010). In addition, we show that some of these glial enriched miRs are differentially expressed by human A2B5+ and A2B5− OLs.
miR Regulation in Rodent OLs
Expression profiling studies with rodent OLs have reported that several miR species are dramatically regulated during OPC differentiation (Lau et al., 2008; Budde et al., 2010; Dugas et al., 2010). In these studies, over-expression of miR-219-5p, miR-338-5p, and miR-338-3p was shown to promote rodent OPC differentiation, indicating that these miRs play important roles during myelination (Lau et al., 2008; Budde et al., 2010; Dugas et al., 2010). Our results are in agreement with previous findings and we for the first time demonstrate that closely related miRs (miR-219-1-3p, miR-219-2-3p, miR-338-3p, and miR-3065-5p) are also regulated during rodent OPC differentiation. Notably, miR-3065-5p shows a dramatic drop in expression during the first 5 days in vitro, suggesting that 3065-5p might play a role in regulating OPC proliferation and/or differentiation.
In previous microarray studies, regulation of miR-17-92 cluster expression during the OPC/OL transition was not reported (Lau et al., 2008). The high sensitivity of our real-time approach demonstrates that miR-19a-3p, miR-19b-3p, miR-20a-5p, and miR-92a-3p are downregulated during rodent OPC differentiation. This data is consistent with the proposed role of the miR-17-92 cluster in the control of cell number (Budde et al., 2010). The relative expression analysis, however, reveals that members of the miR-17-92 cluster are among the most highly expressed miRs in both rodent OPCs and mature OLs (Table 1). In addition, the expression profile of miR-17-92 cluster members during OPC differentiation in vitro is very similar to the profile seen in the developing mouse brain (Figure 4B), suggesting that this cluster is OPC/OL enriched. This data is consistent with the finding that the miR-17-92 cluster is enriched in OPCs rather than in astrocytes (Budde et al., 2010). Thus the miR-17-92 cluster may be designated as an OL enriched miR in rodents.
miR Regulation in Human OLs
The human brain has also been examined for miR expression and miR-219-5p, miR-338-5p, miR-338-3p, and members of the miR-17-92 cluster have been reported to be expressed (Barad et al., 2004; Sempere et al., 2004). In addition to the above-mentioned miRs, we report that four other miRs, miR-219-1-3p, miR-219-2-3p, miR-1250, and miR-657, are enriched in white matter tracts of the human brain (Figures 2G and 3E). Our data is consistent with previous findings showing dramatic downregulation of miR-219-5p and miR-338-5p in inactive white matter lesions in multiple sclerosis patients (Junker et al., 2009). Importantly, our study is the first to report that miR-219-5p and miR-338-5p and -3p are expressed by human OLs (Figures 2H and 3F). These findings open the possibility that the same miRs controlling OPC differentiation in rodents (miR-219-5p and miR-338-5p and -3p) may also control OPC differentiation in humans. Discrepancies between our focused expression study and the microarray approach previously employed (Letzen et al., 2010) could be due to differences in the origin of the samples and detection sensitivity. In the current study, human OLs were acutely isolated whereas in the previous report, OLs had been differentiated from human embryonic stem cells. In addition, we used very sensitive real-time qRT-PCR to profile miRs whereas in the previous report less sensitive miR microarray was used. Despite the use of different techniques, both studies show that the miR-17-92 cluster is abundantly expressed by human OLs (Figure 4; Table 1). Taken together, our data, along with the data obtained from inactive white matter lesions in multiple sclerosis (Junker et al., 2009) strongly suggests that miR-219, miR-338, and miR-17-92 clusters may also regulate OPC differentiation in humans.
In summary, our study establishes that rodent-relevant miRs are also expressed by human OLs. We propose that miRs demonstrated to be functionally relevant in rodents perform a conserved function and regulate the proliferation and differentiation of human OPCs. Further investigation into the functional contribution of these miRs to human myelination may provide insights into their potential as targets to promote remyelination in demyelinating diseases.
Conflict of Interest Statement
Amit Bar-Or has act as a consultant for Bayer, Bayhill Therapeutics, Berlex, Biogen-IDEC, BioMS, Diogenix, Eli-Lilly, Genentech, GSK, Guthy-Jackson/GGF, Merck-Serono, Novartis, Ono, Roche, Teva Neuroscience, and Wyeth. Jack P. Antel has act as a consultant for TEVA, NOVARTIS, Serono, Biogen, Sanofi, Genzyme, and as part of the Burroughs Welcome Medical Scientist Program board.
Acknowledgments
The authors would like to thank Dr. Madeline Pool for editing the manuscript prior to submission and Dr. Pierre Talbot for kindly providing MO3.13 cell line. We also thank members of the Colman, Bar-Or, and Antel labs for helpful discussions. Omar de faria Jr. also wants to thank Dr. Lu Faissal for providing invaluable support. Our work is supported in part by grants from Rio Tinto Alcan, The Molson Foundation, Multiple Sclerosis Society of Canada, and National Multiple Sclerosis Society. Jenea M. Bin is funded by a Vanier Canada Graduate Scholarship. Ajit S. Dhaunchak and Sarah-Jane Bull are funded by Multiple Sclerosis Society of Canada. Omar de Faria Jr. and Ajit S. Dhaunchak dedicate this paper to late David R. Colman.
References
Armstrong, R. C. (1998). Isolation and characterization of immature oligodendrocyte lineage cells. Methods 16, 282–292.
Barad, O., Meiri, E., Avniel, A., Aharonov, R., Barzilai, A., Bentwich, I., Einav, U., Gilad, S., Hurban, P., Karov, Y., Lobenhofer, E. K., Sharon, E., Shiboleth, Y. M., Shtutman, M., Bentwich, Z., and Einat, P. (2004). MicroRNA expression detected by oligonucleotide microarrays: system establishment and expression profiling in human tissues. Genome Res. 14, 2486–2494.
Budde, H., Schmitt, S., Fitzner, D., Opitz, L., Salinas-Riester, G., and Simons, M. (2010). Control of oligodendroglial cell number by the miR-17-92 cluster. Development 137, 2127–2132.
Chen, C., Ridzon, D. A., Broomer, A. J., Zhou, Z., Lee, D. H., Nguyen, J. T., Barbisin, M., Xu, N. L., Mahuvakar, V. R., Andersen, M. R., Lao, K. Q., Livak, K. J., and Guegler, K. J. (2005). Real-time quantification of microRNAs by stem-loop RT-PCR. Nucleic Acids Res. 33, e179.
Cui, Q. L., Fragoso, G., Miron, V. E., Darlington, P. J., Mushynski, W. E., Antel, J., and Almazan, G. (2010). Response of human oligodendrocyte progenitors to growth factors and axon signals. J. Neuropathol. Exp. Neurol. 69, 930–944.
Dhaunchak, A. S., Colman, D. R., and Nave, K. A. (2011). Misalignment of PLP/DM20 transmembrane domains determines protein misfolding in Pelizaeus-Merzbacher disease. J. Neurosci. 31, 14961–14971.
Dhaunchak, A. S., Huang, J. K., De Faria Junior, O., Roth, A. D., Pedraza, L., Antel, J. P., Bar-Or, A., and Colman, D. R. (2010). A proteome map of axoglial specializations isolated and purified from human central nervous system. Glia 58, 1949–1960.
Dhaunchak, A. S., and Nave, K. A. (2007). A common mechanism of PLP/DM20 misfolding causes cysteine-mediated endoplasmic reticulum retention in oligodendrocytes and Pelizaeus-Merzbacher disease. Proc. Natl. Acad. Sci. U.S.A. 104, 17813–17818.
Dugas, J. C., Cuellar, T. L., Scholze, A., Ason, B., Ibrahim, A., Emery, B., Zamanian, J. L., Foo, L. C., McManus, M. T., and Barres, B. A. (2010). Dicer1 and miR-219 Are required for normal oligodendrocyte differentiation and myelination. Neuron 65, 597–611.
Emery, B. (2010). Regulation of oligodendrocyte differentiation and myelination. Science 330, 779–782.
Friedman, R. C., Farh, K. K., Burge, C. B., and Bartel, D. P. (2009). Most mammalian mRNAs are conserved targets of microRNAs. Genome Res. 19, 92–105.
Hayashita, Y., Osada, H., Tatematsu, Y., Yamada, H., Yanagisawa, K., Tomida, S., Yatabe, Y., Kawahara, K., Sekido, Y., and Takahashi, T. (2005). A polycistronic microRNA cluster, miR-17-92, is overexpressed in human lung cancers and enhances cell proliferation. Cancer Res. 65, 9628–9632.
He, L., Thomson, J. M., Hemann, M. T., Hernando-Monge, E., Mu, D., Goodson, S., Powers, S., Cordon-Cardo, C., Lowe, S. W., Hannon, G. J., and Hammond, S. M. (2005). A microRNA polycistron as a potential human oncogene. Nature 435, 828–833.
Hellemans, J., Mortier, G., De Paepe, A., Speleman, F., and Vandesompele, J. (2007). qBase relative quantification framework and software for management and automated analysis of real-time quantitative PCR data. Genome Biol. 8, R19.
Junker, A., Krumbholz, M., Eisele, S., Mohan, H., Augstein, F., Bittner, R., Lassmann, H., Wekerle, H., Hohlfeld, R., and Meinl, E. (2009). MicroRNA profiling of multiple sclerosis lesions identifies modulators of the regulatory protein CD47. Brain 132, 3342–3352.
Kessaris, N., Fogarty, M., Iannarelli, P., Grist, M., Wegner, M., and Richardson, W. D. (2006). Competing waves of oligodendrocytes in the forebrain and postnatal elimination of an embryonic lineage. Nat. Neurosci. 9, 173–179.
Lau, P., Verrier, J. D., Nielsen, J. A., Johnson, K. R., Notterpek, L., and Hudson, L. D. (2008). Identification of dynamically regulated microRNA and mRNA networks in developing oligodendrocytes. J. Neurosci. 28, 11720–11730.
Letzen, B. S., Liu, C., Thakor, N. V., Gearhart, J. D., All, A. H., and Kerr, C. L. (2010). MicroRNA expression profiling of oligodendrocyte differentiation from human embryonic stem cells. PLoS ONE 5, e10480. doi:10.1371/journal.pone.0010480
Lin, S. T., and Fu, Y. H. (2009). miR-23 regulation of lamin B1 is crucial for oligodendrocyte development and myelination. Dis. Model. Mech. 2, 178–188.
Matsubara, H., Takeuchi, T., Nishikawa, E., Yanagisawa, K., Hayashita, Y., Ebi, H., Yamada, H., Suzuki, M., Nagino, M., Nimura, Y., Osada, H., and Takahashi, T. (2007). Apoptosis induction by antisense oligonucleotides against miR-17-5p and miR-20a in lung cancers overexpressing miR-17-92. Oncogene 26, 6099–6105.
McLaurin, J., Trudel, G. C., Shaw, I. T., Antel, J. P., and Cashman, N. R. (1995). A human glial hybrid cell line differentially expressing genes subserving oligodendrocyte and astrocyte phenotype. J. Neurobiol. 26, 283–293.
Nave, K. A. (2010). Oligodendrocytes and the “micro brake” of progenitor cell proliferation. Neuron 65, 577–579.
Ota, A., Tagawa, H., Karnan, S., Tsuzuki, S., Karpas, A., Kira, S., Yoshida, Y., and Seto, M. (2004). Identification and characterization of a novel gene, C13orf25, as a target for 13q31-q32 amplification in malignant lymphoma. Cancer Res. 64, 3087–3095.
Ruffini, F., Arbour, N., Blain, M., Olivier, A., and Antel, J. P. (2004). Distinctive properties of human adult brain-derived myelin progenitor cells. Am. J. Pathol. 165, 2167–2175.
Schmittgen, T. D., Lee, E. J., Jiang, J., Sarkar, A., Yang, L., Elton, T. S., and Chen, C. (2008). Real-time PCR quantification of precursor and mature microRNA. Methods 44, 31–38.
Schmittgen, T. D., Zakrajsek, B. A., Mills, A. G., Gorn, V., Singer, M. J., and Reed, M. W. (2000). Quantitative reverse transcription-polymerase chain reaction to study mRNA decay: comparison of endpoint and real-time methods. Anal. Biochem. 285, 194–204.
Sempere, L. F., Freemantle, S., Pitha-Rowe, I., Moss, E., Dmitrovsky, E., and Ambros, V. (2004). Expression profiling of mammalian microRNAs uncovers a subset of brain-expressed microRNAs with possible roles in murine and human neuronal differentiation. Genome Biol. 5, R13.
Sherman, D. L., and Brophy, P. J. (2005). Mechanisms of axon ensheathment and myelin growth. Nat. Rev. Neurosci. 6, 683–690.
Tang, F., Hajkova, P., Barton, S. C., Lao, K., and Surani, M. A. (2006). MicroRNA expression profiling of single whole embryonic stem cells. Nucleic Acids Res. 34, e9.
Ventura, A., Young, A. G., Winslow, M. M., Lintault, L., Meissner, A., Erkeland, S. J., Newman, J., Bronson, R. T., Crowley, D., Stone, J. R., Jaenisch, R., Sharp, P. A., and Jacks, T. (2008). Targeted deletion reveals essential and overlapping functions of the miR-17 through 92 family of miRNA clusters. Cell 132, 875–886.
Windrem, M. S., Nunes, M. C., Rashbaum, W. K., Schwartz, T. H., Goodman, R. A., McKhann, G. II, Roy, N. S., and Goldman, S. A. (2004). Fetal and adult human oligodendrocyte progenitor cell isolates myelinate the congenitally dysmyelinated brain. Nat. Med. 10, 93–97.
Winer, J., Jung, C. K., Shackel, I., and Williams, P. M. (1999). Development and validation of real-time quantitative reverse transcriptase-polymerase chain reaction for monitoring gene expression in cardiac myocytes in vitro. Anal. Biochem. 270, 41–49.
Zhao, X., He, X., Han, X., Yu, Y., Ye, F., Chen, Y., Hoang, T., Xu, X., Mi, Q. S., Xin, M., Wang, F., Appel, B., and Lu, Q. R. (2010). MicroRNA-mediated control of oligodendrocyte differentiation. Neuron 65, 612–626.
Appendix
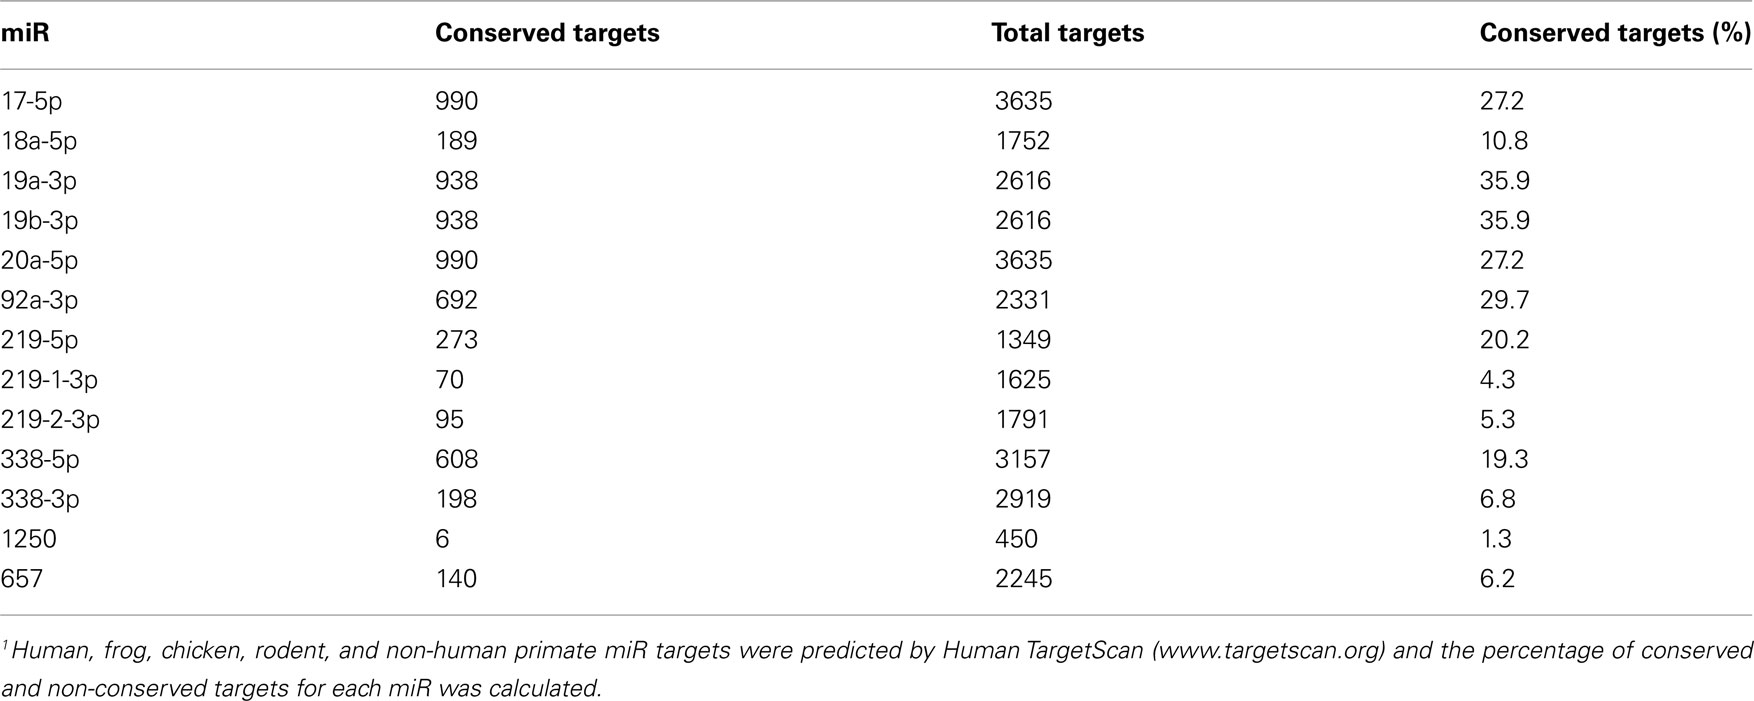
Table A1. Percentage of miR targets conserved across vertebrates1.
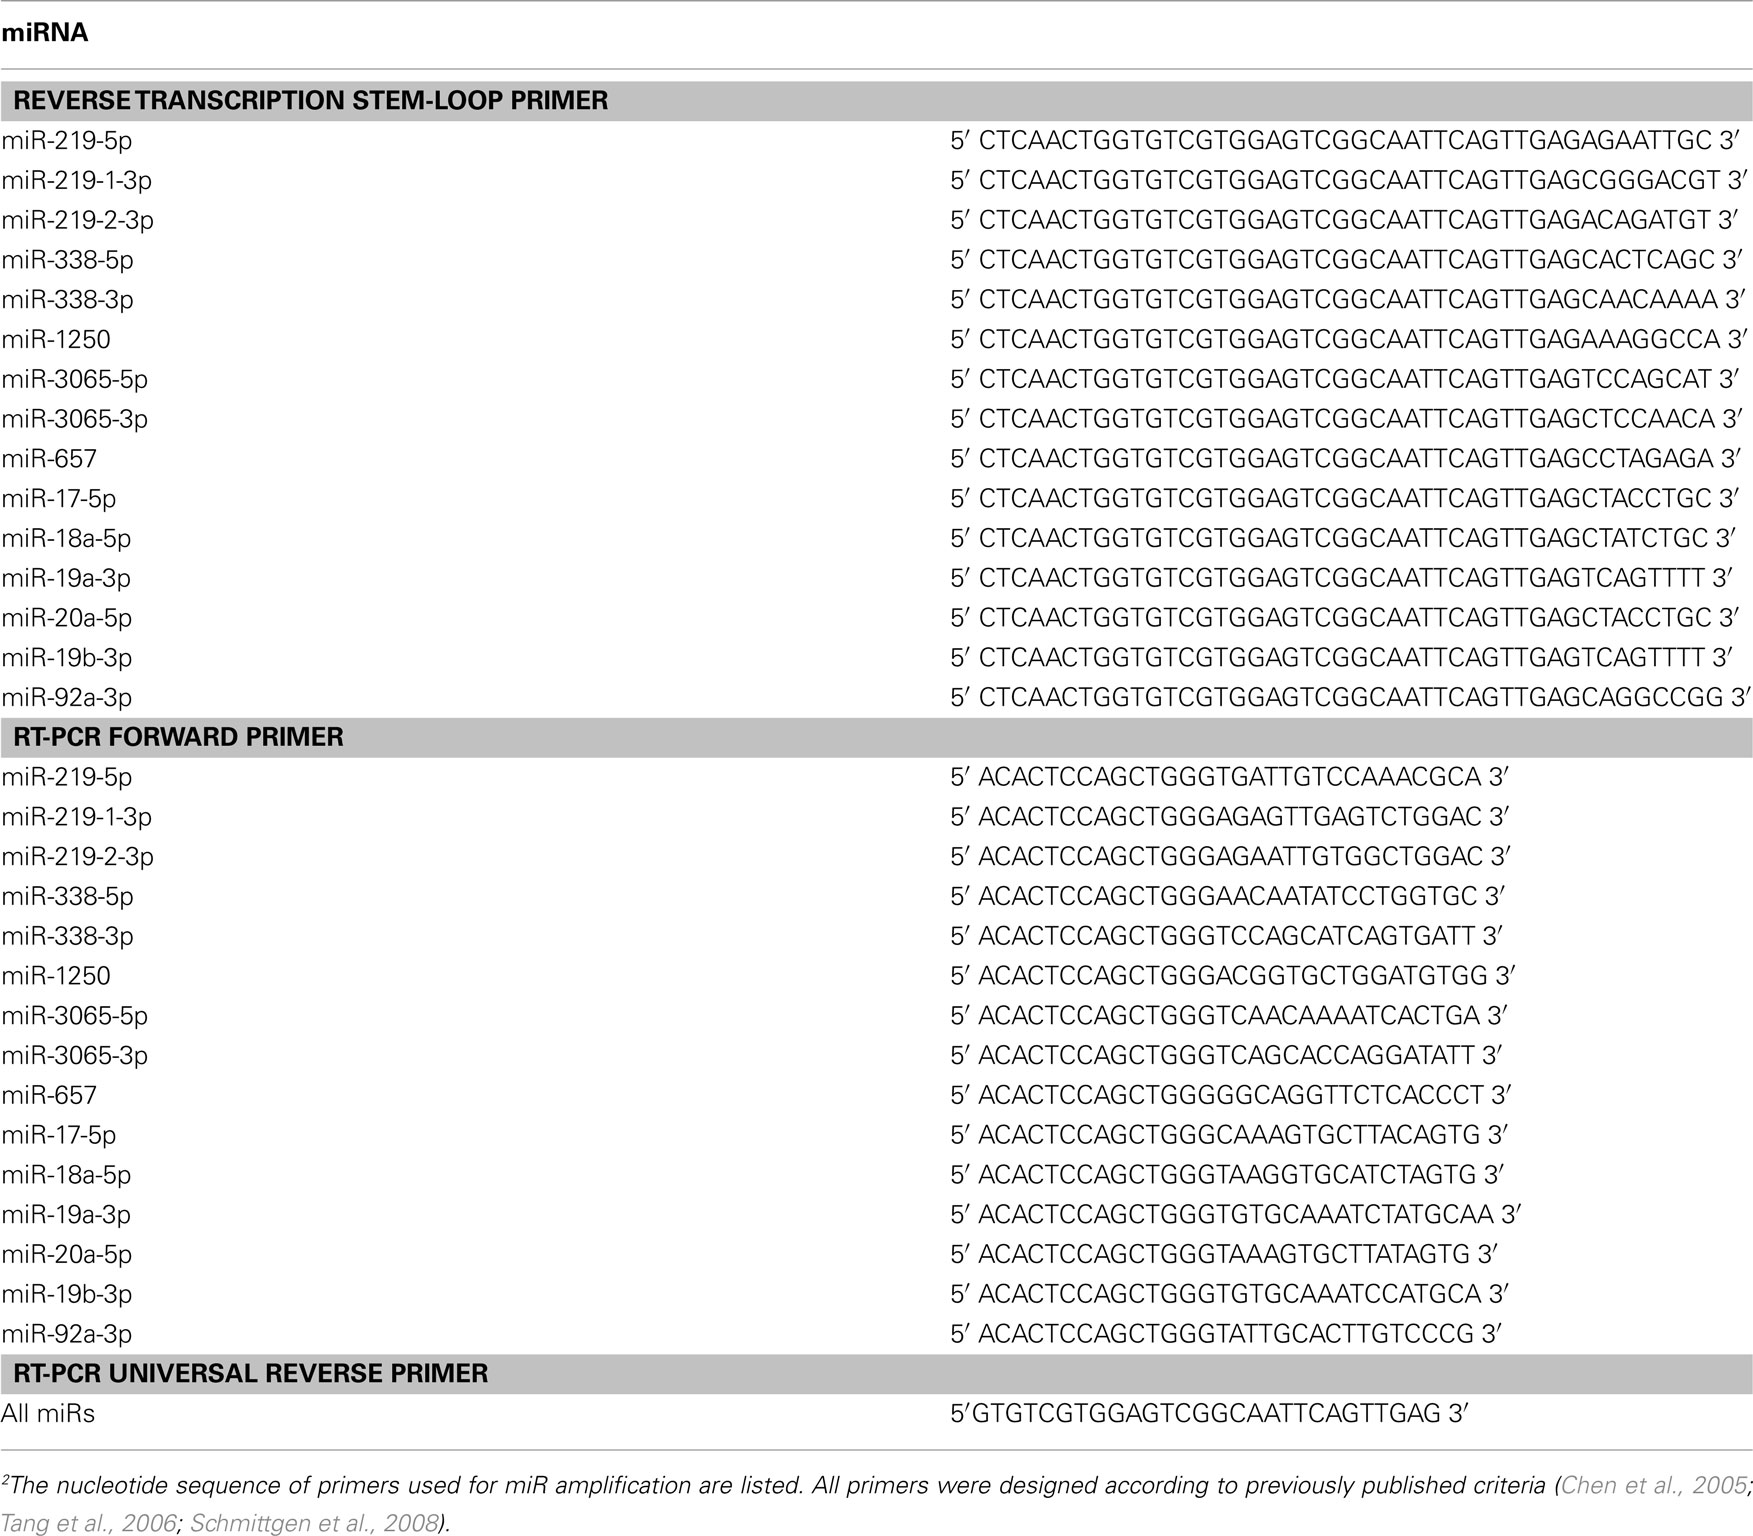
Table A2. List of primers used on this study2.
Keywords: microRNA, oligodendrocyte precursor cell, differentiation, myelination
Citation: de Faria Jr. O, Cui Q-L, Bin JM, Bull S-J, Kennedy TE, Bar-Or A, Antel JP, Colman DR and Dhaunchak AS (2012) Regulation of miRNA 219 and miRNA clusters 338 and 17-92 in oligodendrocytes. Front. Gene. 3:46. doi: 10.3389/fgene.2012.00046
Received: 14 February 2012; Accepted: 13 March 2012;
Published online: 28 March 2012.
Edited by:
Peng Jin, Emory University School of Medicine, USACopyright: © 2012 de Faria Jr., Cui, Bin, Bull, Kennedy, Bar-Or, Antel, Colman and Dhaunchak. This is an open-access article distributed under the terms of the Creative Commons Attribution Non Commercial License, which permits non-commercial use, distribution, and reproduction in other forums, provided the original authors and source are credited.
*Correspondence: Ajit S. Dhaunchak, Department of Neurology and Neurosurgery, Montreal Neurological Institute and Hospital, McGill University Health Centre, McGill University, 3801, University Street, BT101, Montreal, QC, Canada H3A2B4. e-mail:YWppdC5kaGF1bmNoYWtAbWNnaWxsLmNh