 P. Kochunov1,2,3*
 D. C. Glahn4
 L. E. Hong1
 J. Lancaster3
 J. E. Curran2
 M. P. Johnson2
 A. M. Winkler4 H. H. Holcomb1 J. W. Kent Jr.2
 B. Mitchell5 V. Kochunov3
 R. L. Olvera6 S. A. Cole2 T. D. Dyer2 E. K. Moses2 H. Goring2 L. Almasy2 R. Duggirala2 and J. Blangero2
- 1 Department of Psychiatry, Maryland Psychiatric Research Center, University of Maryland School of Medicine, Baltimore, MD, USA
- 2 Department of Genetics, Texas Biomedical Research Institute, San Antonio, TX, USA
- 3 Research Imaging Institute, University of Texas Health Science Center at San Antonio, San Antonio, TX, USA
- 4 Department of Psychiatry, Olin Neuropsychiatric Research Center, Yale University, New Hartford, CT, USA
- 5 Department of Epidemiology, University of Maryland School of Medicine, Baltimore, MD, USA
- 6 Department of Psychiatry, University of Texas Health Science Center at San Antonio, San Antonio, TX, USA
Background and Purpose: We hypothesized that the P-selectin (SELP) gene, localized to a region on chromosome 1q24, pleiotropically contributes to increased blood pressure and cerebral atrophy. We tested this hypothesis by performing genetic correlation analyses for 13 mRNA gene expression measures from P-selectin and 11 other genes located in 1q24 region and three magnetic resonance imaging derived indices of cerebral integrity. Methods: The subject pool consisted of 369 (219F; aged 28–85, average = 47.1 ± 12.7 years) normally aging, community-dwelling members of large extended Mexican-American families. Genetic correlation analysis decomposed phenotypic correlation coefficients into genetic and environmental components among 13 leukocyte-based mRNA gene expressions and three whole-brain and regional measurements of cerebral integrity: cortical gray matter thickness, fractional anisotropy of cerebral white matter, and the volume of hyperintensive WM lesions. Results: From the 13 gene expressions, significant phenotypic correlations were only found for the P- and L-selectin expression levels. Increases in P-selectin expression levels tracked with decline in cerebral integrity while the opposite trend was observed for L-selectin expression. The correlations for the P-selectin expression were driven by shared genetic factors, while the correlations with L-selectin expression were due to shared environmental effects. Conclusion: This study demonstrated that P-selectin expression shared a significant variance with measurements of cerebral integrity and posits elevated P-selectin expression levels as a potential risk factor of hypertension-related cerebral atrophy.
Introduction
Genetic factors are responsible for a large (40–80%) proportion of individual variability in measurements of blood pressure (BP) and cerebral integrity (Kochunov et al., 2009, 2010a; Winkler et al., 2010). Elevated BP shares genetic risk factors with genetic risk factors for decline in cerebral integrity in both hypertensive (Turner et al., 2005) and normally aging populations (DeStefano et al., 2006; Kochunov et al., 2010b, 2011a). Some these risk factors were localized to a region on the q-arm of chromosome one (1q24; Turner et al., 2005; Kochunov et al., 2010b). This region was also previously identified as harboring risk genes for development of cardiovascular disorders (Blann et al., 2003; Zee et al., 2004; Rutherford et al., 2007) and essential hypertension (Duggirala et al., 2000; Chang et al., 2007; Goring et al., 2007). Five genes within this region, including a constellation of selectin (SELP, SELL, and SELE) genes, ATP1B1 and the coagulation factor V (F5) genes, were confirmed to be involved in determining individual susceptibility for essential hypertension (Kochunov et al., 2009, 2010a). Previously, we hypothesized that P-selectin (SELP) gene was a likely contributor to the variations in BP and brain atrophy BP (Kochunov et al., 2010b, 2011a). Elevated platelet P-selectin expression level is a marker of endothelial dysfunction (Nomura et al., 2009) and is positively correlated with systolic BP, pulse pressure, and diagnosis of hypertension (Lee et al., 2008; Reiner et al., 2008; Nomura et al., 2009). Common SELP sequence variants also explain a significant proportion of individual variability in the soluble P-selectin protein levels, even after correcting for environmental factors such as smoking (Lee et al., 2008; Reiner et al., 2008). Furthermore, SELP 1087A/G polymorphism is a predictor of poorer neurocognitive functioning in hypertensive elderly (Gunstad et al., 2009). Here, we aimed to test the hypothesis that elevated P-selectin expression levels predict declining brain integrity. To this end, we employed genetic correlations with quantitative mRNA expressions measured in large, extended pedigree (Blangero et al., 2003). This approach has strategic benefits such as the increased power to study causal genes and increased power to detect the effects of rare functional variants, over the more common strategy that has focused upon collections of unrelated individuals (Blangero et al., 2003).
We performed these analyses using leukocyte-based mRNA expression measurements for 12 genes the 1q24 region and three magnetic resonance imaging (MRI)-derived measurements of cerebral integrity in a well-characterized population of normally aging, community-dwelling Mexican-Americans from large extended families (Mitchell et al., 1996). Gene expression measurements were performed on the lymphocytes exacted from blood samples collected 16 year prior to collection of imaging data; hence, giving a prospective element to the brain measures. Previous analyses in this population established a positive correlation between elevated expression levels for P-selectin and arterial hypertension (Goring et al., 2007). Additional analyses demonstrated a genetic relationship among BP measurements and two MRI-derived measurements of cerebral white matter (WM) integrity (Kochunov et al., 2010b, 2011a). Specifically, elevated arterial pulse pressure and systolic BP corresponded to lower fractional anisotropy (FA) of cerebral WM values (Kochunov et al., 2011a). Elevated arterial pulse pressure and systolic BP also corresponded to the increased volumes of subcortical and ependymal hyperintensive WM (HWM) regions (Kochunov et al., 2010b), which is a classical marker of focal WM atrophy (Fazekas et al., 1993). Here, we propose to test the next logical hypothesis that there should be a significant degree of shared genetic variance between cerebral atrophy and gene expression level of P-selectin and/or others genes located at the 1q24 QTL region. In addition to two previously used measurements of WM atrophy, we obtained whole-brain and regional measurements of cortical gray matter (GM) thickness to estimate intersubject differences in the integrity of cortical GM (Huttenlocher and Dabholkar, 1997).
Materials and Methods
Subjects
Three hundred sixty-nine (219 females) active participants in the San Antonio Family Heart Study (SAFHS; Mitchell et al., 1996), for whom gene expression and brain imaging data were available. They are Mexican-Americans from large extended families selected randomly from the community. Subjects ranged from 28 to 85 years of age (47.1 ± 12.7 years) and were members of 47 families (9.3 ± 8.2 individuals/family; range 2–38). Subjects’ demographic and health information is detailed in Table 1. Four hundred forty-eight SAFHS subjects, for whom transcript data were available agreed to participate in the imaging study. Forty-six subjects were excluded from the imaging for: MRI contraindications such as claustrophobia or presents of metal in their bodies (N = 35), history of neurological illnesses, such as multiple sclerosis (N = 6), or stroke, transient ischemic attack or other major neurological event (N = 5). Complete MRI data was not collected for 33 subjects because a subject was unable to complete the MRI session (N = 26), scanner malfunction (N = 4), and other reasons (N = 3). All subjects provided written informed consent on forms approved by the Institutional Review Board of the University of Texas Health Science Center at San Antonio (UTHSCSA) and Yale University.
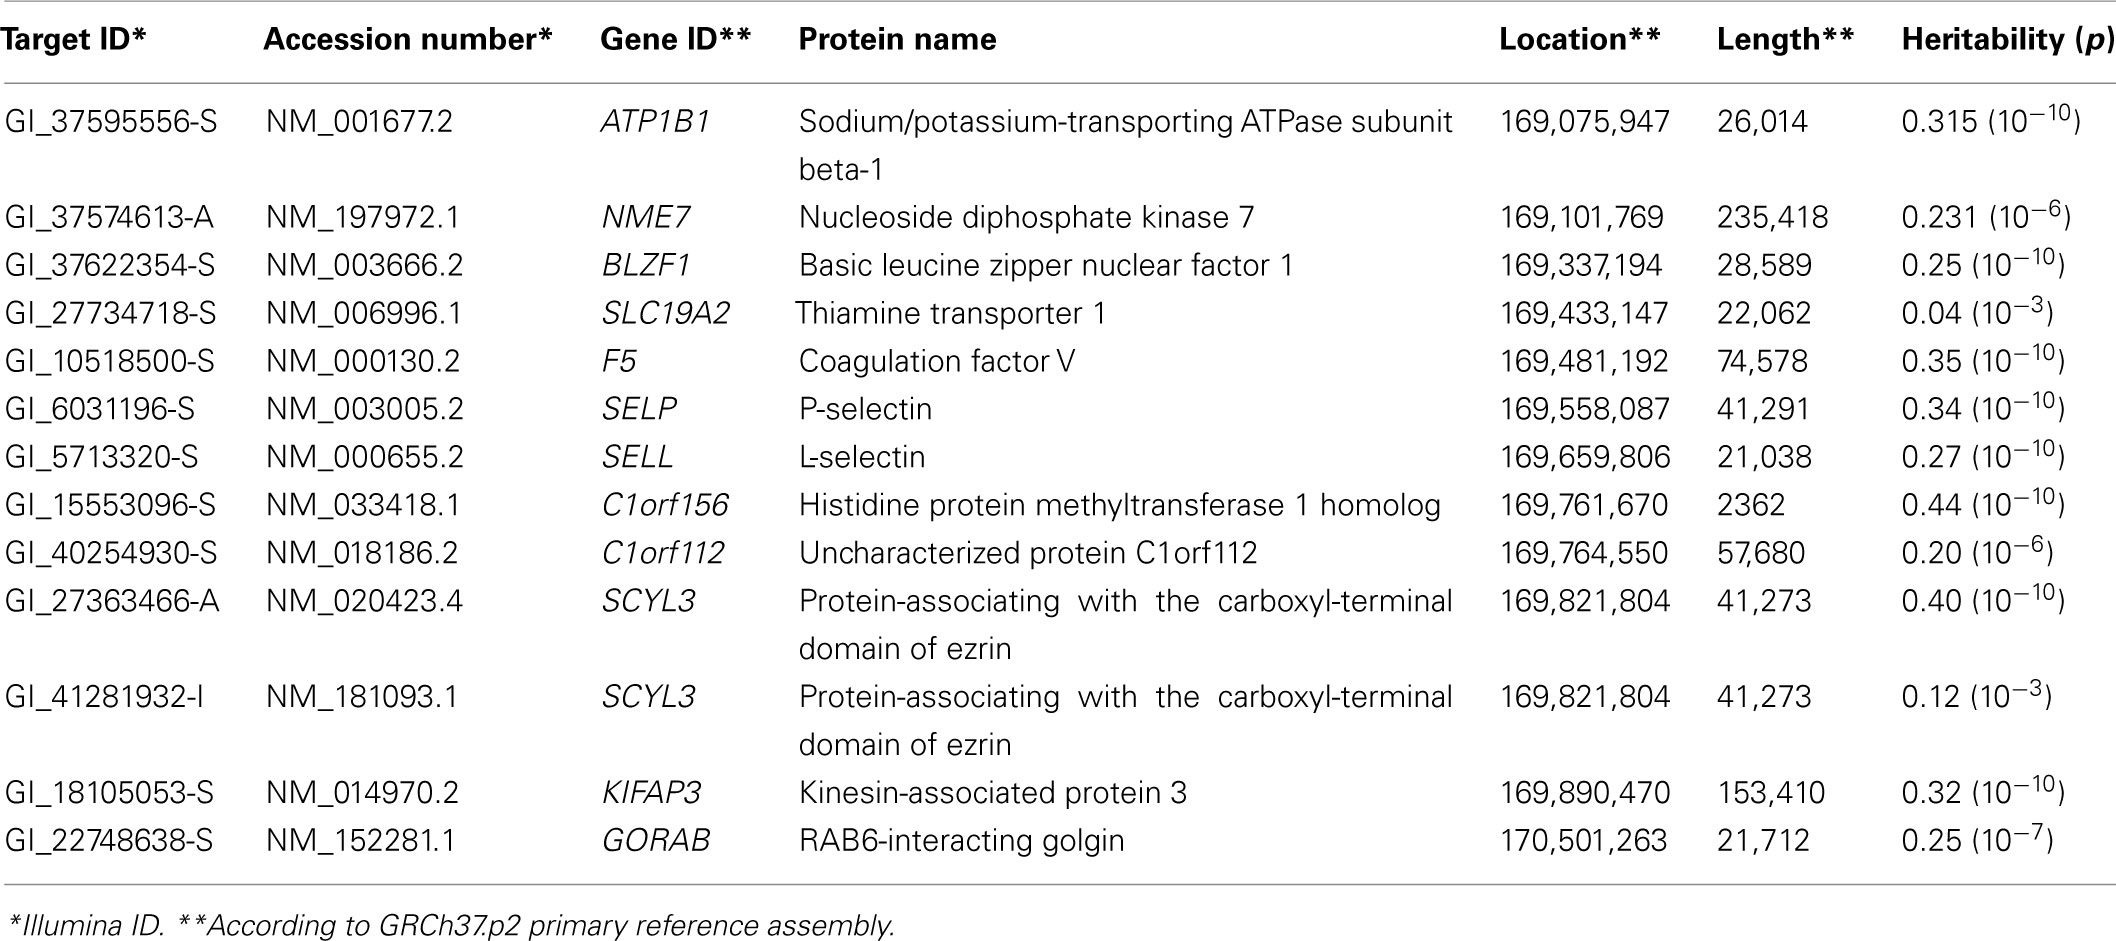
Table 1. Thirteen measurements of gene transcriptions were available for 12 genes located on chromos 1q24 between markers rs137915045 and rs111909575.
MR imaging and data processing
Imaging data were collected using a Siemens 3 T Trio scanner located at the Research Imaging Institute, UTHSCSA. The details of imaging protocol and data collection are described elsewhere (Kochunov et al., 2011b). In short, this study used a multimodal MRI protocol specifically optimized for measurements of GM thickness, FA values, and volume of HWM lesions.
The protocol for measurements of GM thickness was designed to collect data capable of resolving the cortical ribbon across the cerebral cortex using an isotropic spatial resolution of 0.8 mm (voxel volume = 0.5 mm3). T1-weighted contrast was achieved using a magnetization prepared sequence with an adiabatic inversion contrast-forming pulse (scan parameters: TE/TR/TI = 3.04/2100/785 ms, flip angle = 11°). A retrospective motion correction technique (Kochunov et al., 2011b) was used to reduce artifacts related to subject motion. Whole-brain average and regional measurements of cortical thickness were performed using a freely available BrainVisa software (Kochunov et al., 2012b; Figure 1)1. This tool uses a “normal-average” algorithm that has been reported to be a good compromise between accuracy and performance (Lerch and Evans, 2005). The GM thickness is measured as the Euclidean distance from an inner mesh vertex to the outer mesh along the direction normal to the inner mesh polygon. The measurement is repeated, inward, along the direction normal the outer mesh and the two distances are averaged (Kochunov et al., 2008). The consistency of the distance measurements is ensured by verifying that the line connecting the two surfaces does not intersect other polygons, inner or outer, along the way. GM thickness measurements were averaged for individual cortical areas for both hemispheres; the whole-brain GM thickness measurement was obtained by averaging all gyral GM thickness measurements as described elsewhere (Wakana et al., 2004).
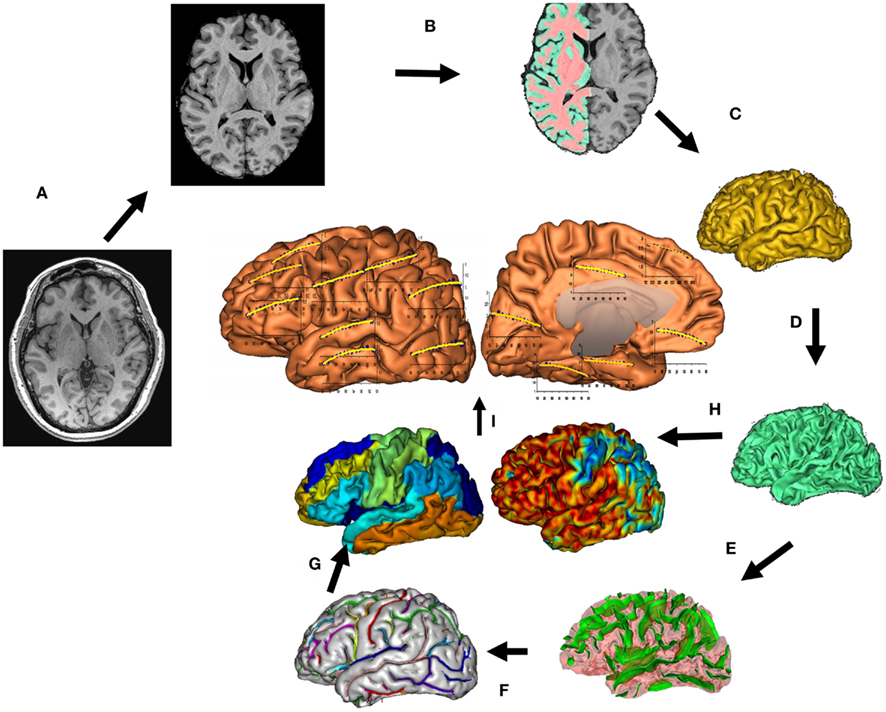
Figure 1. T1-w image processing pipelines. A T1-w image is skull-stripped, globally spatially normalized, and RF inhomogeneity corrected (A). Next, cerebral hemispheres and cerebellum and identified and tissue classified (B); cortical surfaces for GM and WM are calculated (C,D) and homotopic erosion operation and crevasse detector are used to reconstruct sulcal surface as the medial surface of the two opposing gyral banks (E). Sulcal identification pipeline uses a congregation of 500 artificial neural network-based pattern classifiers to identify (F) sulcal landmarks and to perform gyral segmentation of the cortex (G). GM thickness was calculate as the distance between the pial (C) and GM/WM interface surfaces (H). (I) Average GM thickness was calculated 14 primary cortical gyri.
Diffusion tensor data were collected using a single-shot, echo-planar, single refocusing spin-echo, T2-weighted sequence with a spatial resolution of 1.7 mm × 1.7 mm × 3.0 mm. The sequence parameters were: TE/TR = 87/8000 ms, FOV = 200 mm, axial slice orientation with 50 slices, and no gaps, 55 isotropically distributed diffusion weighted directions, two diffusion weighting values (b = 0 and 700 s/mm2) and three b = 0 images. Details for the choice of DTI parameters and processing of DTI scans, including extracting whole-brain and regional FA values, are discussed elsewhere (Kochunov et al., 2011b). In short, the tract-based spatial statistics (TBSS) software (Kochunov et al., 2011b) was used for multi-subject analysis of FA images. Whole-brain average FA values were calculated by averaging values for the entire WM skeleton. Average FA values were calculated for nine major WM tracts (Figure 2) as described elsewhere (Kochunov et al., 2010a, 2012a). Briefly, the population-based, 3D, DTI cerebral WM tract atlas developed at the John Hopkins University (JHU) and distributed as part of the FSL software package (Wakana et al., 2004) was used to calculate population average diffusion parameter values along the nine major WM tracts (Figure 2). The JHU atlas was non-linearly aligned and labels for individual tracts were transferred to the subjects’ brains using nearest-neighbor interpolation. Per-tract average values were calculated by averaging the values along the tracts for both hemispheres. The overall average FA values were calculated by averaging values for the entire WM skeleton.
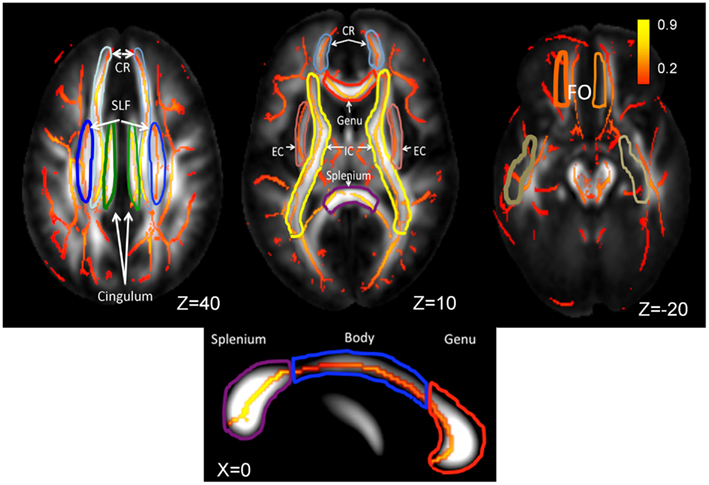
Figure 2. Skeletonized, average FA values are shown on the population average FA image. WM tract labels for nine major tracts are taken from the Johns Hopkins DTI WM atlas. The average FA values were calculated for the following tracts: corona radiata (CR), superior longitudinal fasciculus (SLF), cingulate, external capsule (EC), internal capsule (IC), fronto-occipital (FO), and the genu, body, and splenium of corpus callosum. The population-wise average FA values are color coded on the skeleton of the tract. The location of the axial slices (the Z-coordinate) is provided in the Talairach reference frame. The three segment of Corpus Callosum are shown on the mid-sagittal slice (Talairach X = 0).
Hyperintensive WM lesion data were collected using a 3D, T2-weighted imaging using a high-resolution (isotropic 1 mm), turbo-spin-echo fluid attenuated inversion recovery (FLAIR) sequence with the following parameters: TR/TE/TI/Flip angle/ETL = 5 s/353 ms/1.8 s/180°/221. FLAIR images were preprocessed by removal of non-brain tissue, registration to the Talairach frame and correction for RF inhomogeneity. HWM regions were manually delineated in 3D-space using an in-house software2 by an experienced neuroanatomist with high (r2 > 0.9) test–retest reproducibility. HWM regions were coded as ependymal regions, contiguous with CSF structures, and subcortical in accordance with a technique described in (Henry Feugeas et al., 2005). The WB-HWM volume and the volumes of subcortical and ependymal HWM were measured for each subject.
In addition to whole-brain average measurements, regional GM thickness, FA values, and HWM volumes was calculated for 14 cortical areas, 10 major WM tracts and subcortical and ependymal (periventricular) white, respective, using the parecelation method described elsewhere (Kochunov et al., 2011b).
Gene Expression Measurements
Thirteen gene expression transcripts were analyzed for 12 genes located in a 2-Mb region of chromosome 1, between markers rs137915045 and rs111909575 (Turner et al., 2005; Chang et al., 2007; Rutherford et al., 2007; Figure 3; Table 1). Gene expression measures were derived from lymphocytes collected 16.6 ± 2.1 years prior to collection of imaging data. The details of gene expression measurements are described by Goring et al. (2007). In short, lymphocyte were obtained from blood samples collected in the morning after an overnight fast. Lymphocytes were isolated from a 10-ml sample using Histopaque (Sigma Chemical Co.), following the suggested protocol of the manufacturer. The isolated and washed lymphocytes were frozen and stored at −80°C overnight and then transferred into liquid nitrogen tanks. Total RNA was isolated from lymphocyte samples using a modified procedure of the QIAGEN RNeasy 96 protocol for isolating total RNA from animal cells using spin technology (QIAGEN, Inc.). Its integrity was verified and anti-sense RNA was synthesized, amplified, and purified. Hybridization of anti-sense RNA was carried out using Illumina’s BeadChip 6 × 2 protocol. Total isolated RNA was hybridized to Illumina Sentrix Human Whole Genome (WG-6) Series 1 BeadChips as previously described (Goring et al., 2007). These BeadChips simultaneously probes ∼48,000 transcripts, representing more than 25,000 annotated human genes. Processing of the sample was performed in a single batch, thereby eliminating the batch effect. Expression levels were z-normalized to make the expression phenotypes comparable among individuals and across transcripts (Goring et al., 2007). Finally, each transcript’s residual expression scores were normalized by using an inverse Gaussian transformation across individuals to ensure normality (Goring et al., 2007).
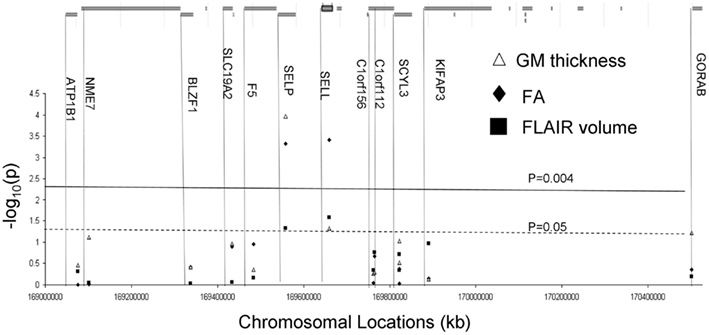
Figure 3. Genes located under the QTL flanked rs137915045 and rs111909575. Results (−log 10 of the p-value) of the correlation analysis for expression levels for the genes located under the linkage peak are plotted along the x-axis (bottom). The solid line corresponds to the significant evidence value of p = 4 × 10⁻³. The green line corresponds to the suggestive evidence value of p = 0.05.
Statistical Genetic Analyses
Variance components methods, as implemented in the Sequential Oligogenic Linkage Analysis Routines (SOLAR) software package3 (Almasy and Blangero, 1998), were used to estimate the degree of shared genetic variability between gene expression measurements and indexes of cerebral integrity. Briefly, the covariance matrix Ω for related individuals is given by Eq. 1
where is the genetic variance due to residual additive genetic factors, is the variance due to individual-specific environmental effects, and I is an identity matrix. Φ is the kinship matrix that is assembled based on the family relationships and confirmed with molecular parent-offspring genetic testing. This matrix summarizes the genetic relationships among all individuals. For additional explanation of the variance components approach using in SOLAR (see Almasy and Blangero, 1998; Blangero et al., 2001). Heritability (h2), the portion of the total phenotypic variance that is accounted for by additive genetic variance is assessed by contrasting the observed phenotypic covariance matrix with the covariance matrix predicted by kinship (Eq. 2).
Bivariate genetic analysis calculates the magnitude and significance of phenotypic correlation coefficient (ρP), and the proportion of variability due to shared genetic (ρG) and environmental (ρE) effects. The overall phenotypic correlation (ρP) between two traits A and B (Eq. 3) can be expressed using the correlation due to shared additive genetic effects (ρG) and the residual correlation (ρE) due to shared environmental effects.
Where, and denote the additive genetic heritability for each of the traits, i.e., the proportion of the total phenotypic variance that is explained by additive genetic factors. If the genetic correlation coefficient (ρG) is significantly different from zero, then the significant portion of the variance in two traits are considered to be influenced by shared genetic factors (Almasy et al., 1997). All genetic analyses were conducted with age, sex, age*sex, age2, and age2*sex included as covariates. The health screening data as shown in Table 2, were not used as covariates because of the loss of statistical power to detect genetic effects due to potential overlap in risk factors. Including covariates that potentially share both genetic and environmental variance may cause distortion of findings in unknown ways. Tests for P-selectin transcripts and cerebral integrity measures were considered statistically significant at p < 0.05 based on the a priori hypothesis. Tests for correlations with the other 12 transcripts were exploratory and only the Bonferroni corrected p values were considered significant. Significance of the bivariate genetic and environmental correlation analysis was based on p < 0.05.
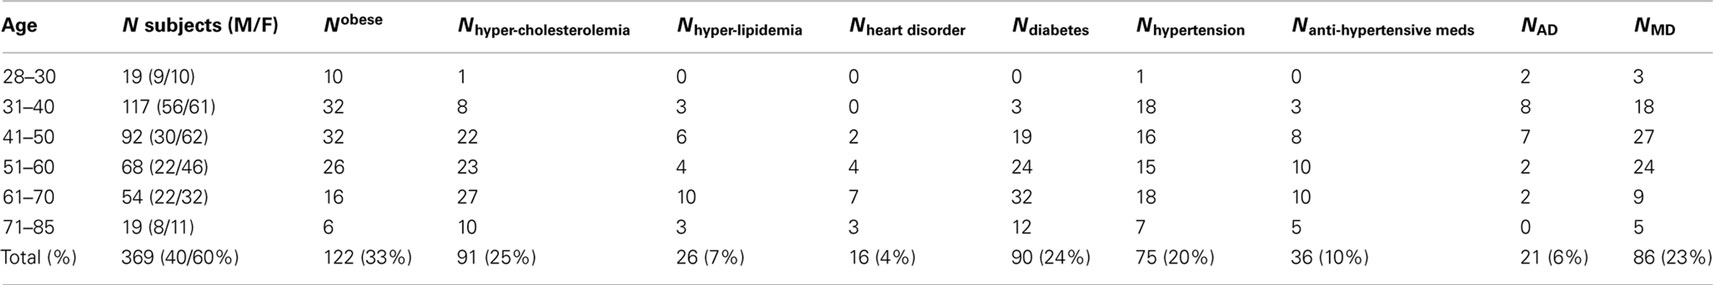
Table 2. Subjects’ demographic and health information including obesity (body mass index >30), the number of subjects with hypercholesterolemia (total cholesterol levels >200 mg/dL) and hyperlipidemia (blood lipids >150 mg/dL), the number of subjects diagnosed with coronary heart disorder, diabetes, hypertension, the number of subjects taking antihypertensive medications, the number of subjects with alcohol dependence (AD), and the number of subject with a lifetime major depression (MD) episode.
Results
Genetic analyses reported statistically significant phenotypic correlation coefficients (ρP) between mRNA expressions for P-selectin gene and all three measurements of cerebral integrity (Table 3). A statistically significant correlation (ρP) was also observed between L-selectin and FA values (p ≤ 0.004; Figure 3; Table 3). No significant correlations were observed for any other transcripts in this region (Figure 3). A significant genetic correlation (p ≤ 0.05) was only observed between P-selectin expression levels and GM thickness and FA values (Table 2). A significant environmental correlation (ρE;)(p ≤ 0.05) was observed between expression levels for L-selectin and GM thickness and FA values.
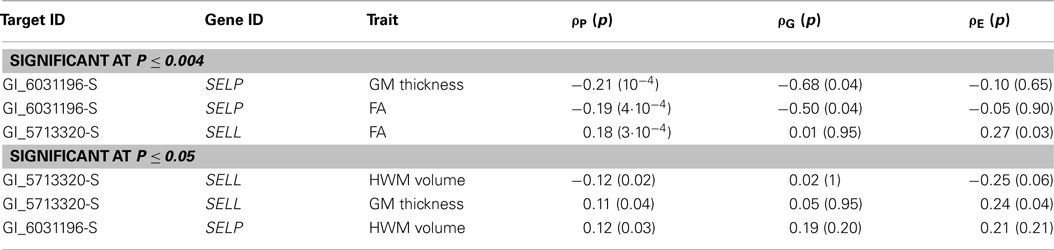
Table 3. Results of the bivariate genetic correlation analysis included phenotypic (ρP), genetic (ρG), and environmental (ρE) correlation coefficients and their significance (in parenthesis).
Phenotypic correlation coefficients between P-selectin expression and all regional GM thickness and FA measurements were significant (p ≤ 0.05) with exception of Sagittal Striatum (Table 4). The sign of phenotypic correlations indicated that higher P-selectin expressions were associated reduced GM thickness and FA throughout the brain. Phenotypic correlation coefficients were significant between L-selectin expression and six regional GM thickness and for all regional FA measurements, with exception of Splenium of Corpus Callosum (Table 4). These correlation coefficients were positive and driven by shared environmental factors (Table 4). The correlation coefficient for the L-selectin expressions and subcortical HWM volumes was significant (p = 0.01), negative and driven by shared environmental factors (ρE = −0.25; p = 0.05).
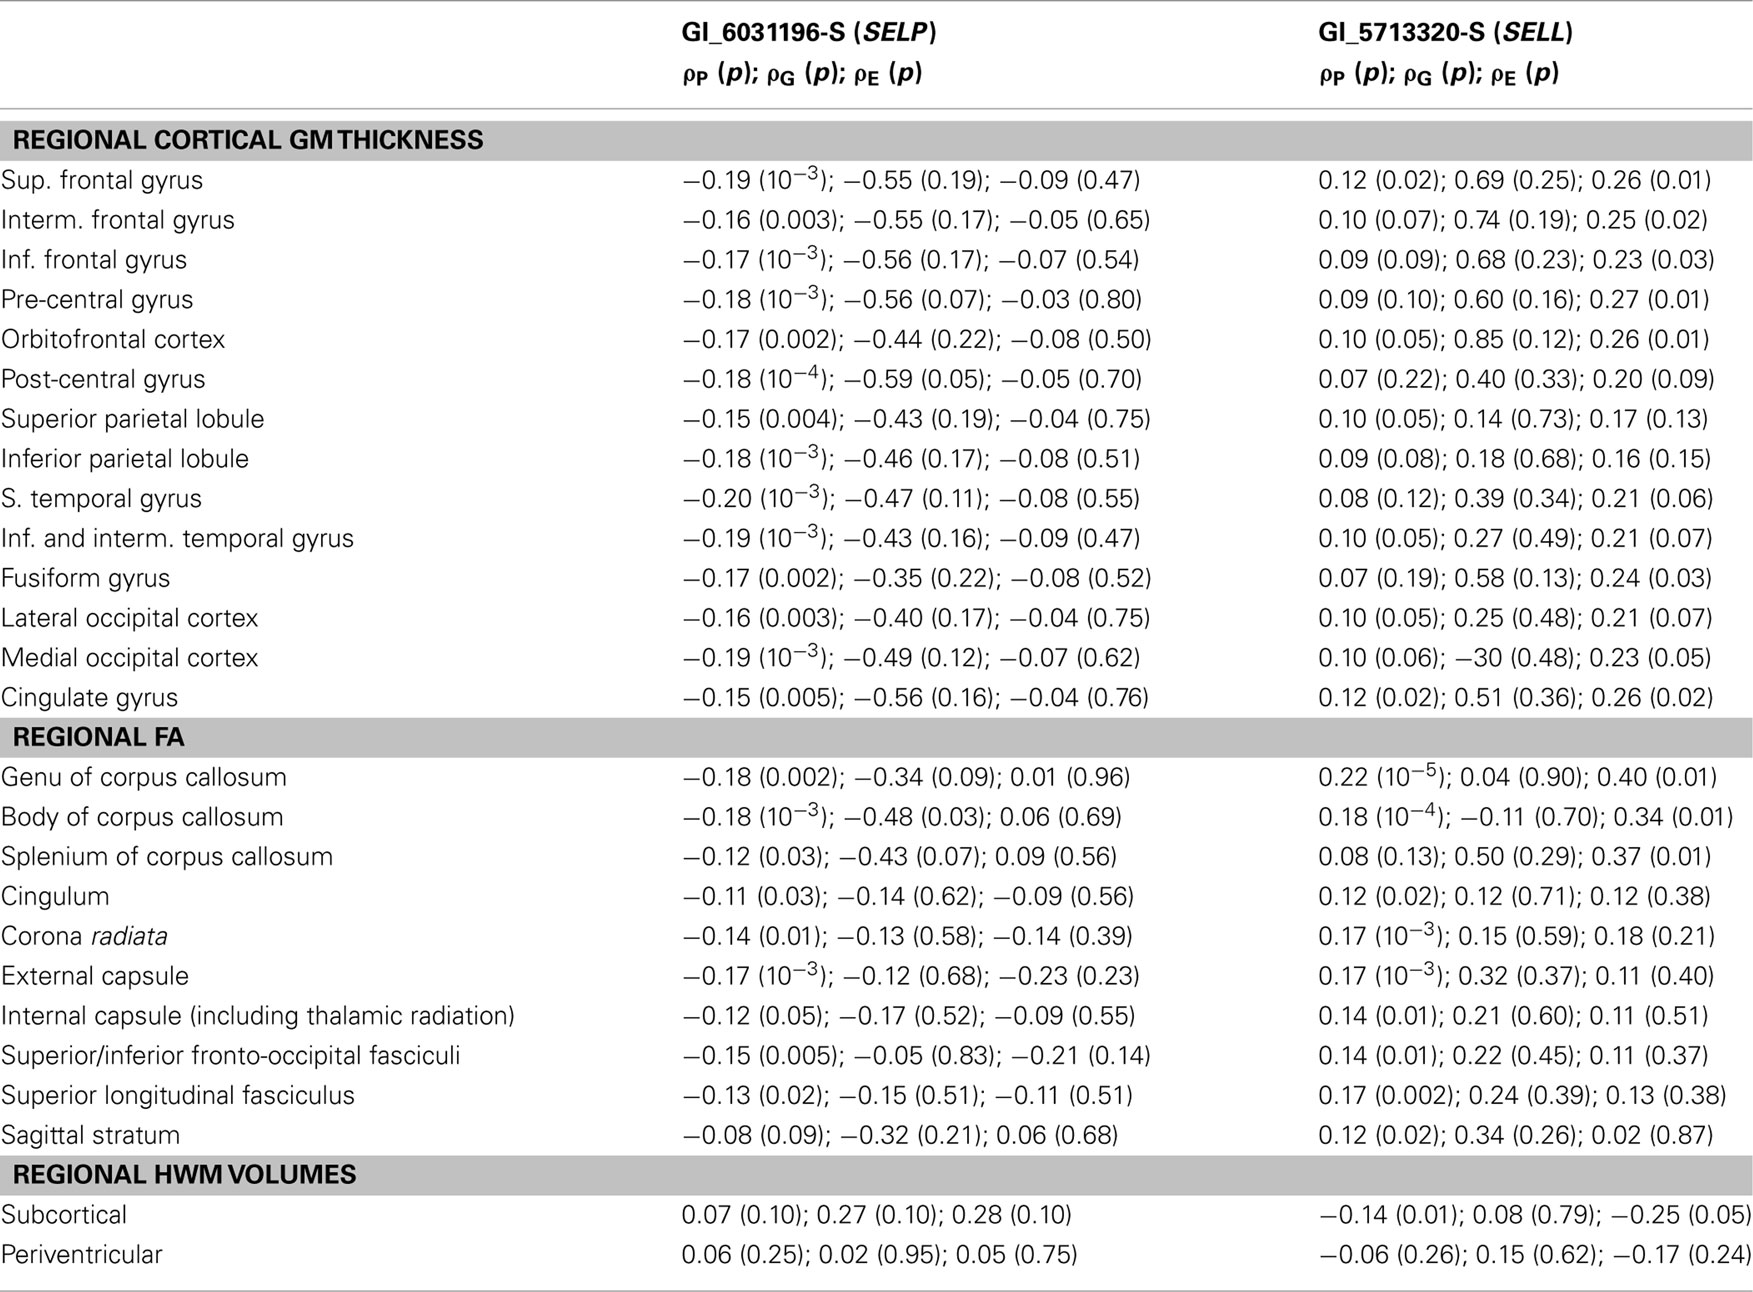
Table 4. Results of the bivariate genetic correlation analysis for regional measurement of cerebral integrity.
The correlation between the P- and L-selectin expressions were not significant ρP (p), ρG (p), and ρE (p) = −0.08 (0.12), 0.16 (0.60), and −0.22 (0.16), respectively.
Discussion
This study aimed to identify genes, located on chromosome 1q24, whose expression levels predicted brain atrophy in a population of well-characterized Mexican-Americans. Previous research in this population has demonstrated positive genetic relationships between P-selectin expressions and arterial hypertension (Goring et al., 2007) and between BP and pulse pressure and WM integrity (DeStefano et al., 2006; Rutherford et al., 2007). Here, we demonstrated that elevated mRNA expressions for P-selectin gene were prospectively associated with reduced cerebral integrity and this association was driven by shared genetic factors. In addition, we observed a positive phenotypic correlation between the L-selectin expression and cerebral FA values, which was driven by shared environmental factors. The blood samples used in this study were collected 16 years prior to the imaging assessments, minimizing the potential that these traits were influenced by stress associated with MR imaging (Tsankova et al., 2006). Overall, our finding supported the hypothesis that P-selectin is the likely to be involved in modulation of cerebral atrophy and that its mRNA expression level is a promising peripheral biomarker of cerebral health.
P-selectin is a cell adhesion protein, expressed by endothelial cells, that initiates adhesion to platelets and endothelial cells as the part of the inflammatory reaction. Elevated levels of soluble P-selectin protein in blood is a known risk factor for atherosclerosis (Csongradi et al., 2011), essential hypertension (Zee et al., 2004), cardiovascular disorders (Zakynthinos and Pappa, 2009), and stroke (Zee et al., 2004; Preston et al., 2007). Platelet derived P-selectin expression levels were shown to be positively correlated with blood levels of soluble P-selectin protein (Csongradi et al., 2011) and the diagnosis of the hypertension and atherosclerosis (Lee et al., 2008; Reiner et al., 2008; Nomura et al., 2009). Common SELP sequence variants, including rs2235302, rs6133, rs6136, and rs3917854, were demonstrated to explain a significant (5–13%) portion of individual variability in soluble P-selectin measured in plasma (Lee et al., 2008; Reiner et al., 2008). Our finding of significant negative correlation between P-selectin expression and cerebral integrity also replicates an observation in the Framingham heart study subjects where the blood level of P-selectin protein were negatively correlated with the brain volume (Preston et al., 2007). Further analyses, involving deep sequencing and functional variants will be necessary for the true identification of the specific polymorphisms that are associated with increased cerebral atrophy.
Significant phenotypic correlation was observed between L-selectin (SELL) expressions and FA of cerebral WM. The direction of the correlation indicated that increased L-selectin expression levels corresponded to higher FA values. The significance of the environmental correlation coefficient (ρE) suggested that this relationship was driven by shared environmental factors. L-selectin protein has both adhesive and signaling functions and its physiological role is different from that of P-selectin (Shigeta et al., 2008). The L-selectin levels do not increased during essential hypertension (Sanada et al., 2005) and do not predict development of vascular inflammation during vascular encephalomyelitis (Doring et al., 2007). Experiments in lab animals demonstrate that P-selectin expression is significantly up-regulated in inflamed CNS microvessels but no significant change was observed for L-selectin expression (Doring et al., 2007). Instead, L-selectin levels were shown to be essential for leukocytes’ recruitment into CNS in response to bacterial meningitis (Sulik et al., 2006), sepsis, and viral brain infections (Sulik et al., 2006) and were predictive of increased survival rates in patients with acute brain injury (Briassoulis et al., 2007). Additionally, L-selectin participates in the in vitro attachment of lymphocytes to WM with its ligand located on the actual myelin sheaths of CNS neurons (Huang et al., 1994). The shiverer mouse, which lacks compact myelin, has a greatly diminished density of L-selectin ligands (Huang et al., 1994). The positive relationship between the expression levels of L-selectin and FA values may, therefore, reflect upon the anti-inflammatory role of this gene in maintaining homeostasis of the cerebral WM.
This is the first study to empirically demonstrate the utility of lymphocyte-based P-selectin expression level measurements for a study of cerebral integrity phenotypes. Expression levels of P-selectin gene in the cerebral endothelial cells would be the ideal trait for this study. However, the impracticality of obtaining such measurements in large, genetically informative samples necessitates the use of a surrogate marker. On the other hand, P-selectin is highly expressed in human lymphocytes4 and P-selectin protein is critically involved in the migration of lymphocytes into brain tissue during ischemic stroke injury (Marquardt et al., 2009; Yilmaz and Granger, 2010) and modulation of cerebral inflammation in multiple sclerosis (Piccio et al., 2005; Engelhardt, 2008). Additionally, other expression levels in lymphocytes have already been demonstrated to be good surrogates for gene expression in several neurological and psychiatric disease-relevant genes (Borovecki et al., 2005; Tsuang et al., 2005; Glahn et al., 2012). For instance, the lymphocyte-based expressions ranked higher than any of the behavioral or neurocognitive assessment measurement for marking the risk of major depressive disorder, suggesting that lymphocyte-based transcriptional profiles is an important marker for psychiatric disease risks (Glahn et al., 2012).
We observed no significant correlations between measurements of cerebral integrity and expression levels for two other, ATP1B1 and F5, genes whose polymorphism were implicated as potential risk factors for essential hypertension BP in Caucasians (Kochunov et al., 2009). This could be due to ethnic differences as this study was focused on Mexican-Americans, a population with significant Native American admixture. Mexican-Americans are characterized by a higher rate of metabolic syndrome when compared with non-Hispanic whites in San Antonio (Mitchell et al., 1996). Elevated P-selectin expression levels are also observed in atherosclerosis, diabetes, obesity, and coronary artery disease (Zakynthinos and Pappa, 2009; Csongradi et al., 2011) and our findings may not be specific to hypertension, other than in the sense that hypertension is part of the metabolic syndrome. Therefore, the lack of finding of a significant correlation for ATP1B1 and F5 expression levels cannot be interpreted as conclusive evidence against the hypothesis that this relationship does not exists nor does it confirm the lack of the overall pleiotropic relationship.
Conclusion
Our findings in a cohort of normally aging, community-dwelling, Mexican-Americans demonstrated that P-selectin is likely candidate, responsible for the bivariate QTL between measures of BP and cerebral integrity in the 1q24 region. Our analyses demonstrated that P-selectin expression levels explained 3–4% of the variability in the measurements of cerebral integrity. This is smaller than the predictive power of BP measurements on cerebral integrity (10–20%; Kochunov et al., 2011a). However, it is similar to the prospective predictive power (∼5%) of the serum P-selectin levels on the intersubject variability in the carotid intima–media thickness measured 5 years later. Our findings also support the hypothesis of a direct genetic relationship between P-selectin expression and cerebral atrophy as proposed by two studies that demonstrated neurocognitive differences in the elderly carriers of 1087 allele of this gene (Mathew et al., 2007; Gunstad et al., 2009). However, allele-specific PCR validation will be necessary to name the specific genetic variants that are responsible for this association. Additional research is also needed to clarify if the lack of genetic association for the ATP1B1 and F5 genes, previously reported in Caucasians, may be due to ethnic differences in the Mexican-American population studied here.
Conflict of Interest Statement
The authors declare that the research was conducted in the absence of any commercial or financial relationships that could be construed as a potential conflict of interest.
Acknowledgments
This research was supported by National Institute of Biomedical Imaging and Bioengineering (K01 EB006395) grant to P. Kochunov, the National Heart Lung and Blood Institute (P01HL045522) to J. Blangero, and the National Institute of Mental Health (R37MH059490 and R01MH078111) to J. Blangero and (R01MH0708143 and R01MH083824) to D. C. Glahn. We are grateful to Dr. Christy Chang for the feedback she provided during the revision process.
Footnotes
References
Almasy, L., and Blangero, J. (1998). Multipoint quantitative-trait linkage analysis in general pedigrees. Am. J. Hum. Genet. 62, 1198–1211.
Almasy, L., Dyer, T. D., and Blangero, J. (1997). Bivariate quantitative trait linkage analysis: pleiotropy versus co-incident linkages. Genet. Epidemiol. 14, 953–958.
Blangero, J., Williams, J. T., and Almasy, L. (2001). Variance component methods for detecting complex trait loci. Adv. Genet. 42, 151–181.
Blangero, J., Williams, J. T., and Almasy, L. (2003). Novel family-based approaches to genetic risk in thrombosis. J. Thromb. Haemost. 1, 1391–1397.
Blann, A. D., Nadar, S. K., and Lip, G. Y. (2003). The adhesion molecule p-selectin and cardiovascular disease. Eur. Heart J. 24, 2166–2179.
Borovecki, F., Lovrecic, L., Zhou, J., Jeong, H., Then, F., Rosas, H. D., Hersch, S. M., Hogarth, P., Bouzou, B., Jensen, R. V., and Krainc, D. (2005). Genome-wide expression profiling of human blood reveals biomarkers for Huntington’s disease. Proc. Natl. Acad. Sci. U.S.A. 102, 11023–11028.
Briassoulis, G., Papassotiriou, I., Mavrikiou, M., Lazaropoulou, C., and Margeli, A. (2007). Longitudinal course and clinical significance of tgf-beta1, sl- and se-selectins and sicam-1 levels during severe acute stress in children. Clin. Biochem. 40, 299–304.
Chang, Y. P., Liu, X., Kim, J. D., Ikeda, M. A., Layton, M. R., Weder, A. B., Cooper, R. S., Kardia, S. L., Rao, D. C., Hunt, S. C., Luke, A., Boerwinkle, E., and Chakravarti, A. (2007). Multiple genes for essential-hypertension susceptibility on chromosome 1q. Am. J. Hum. Genet. 80, 253–264.
Csongradi, E., Nagy, B. Jr., Fulop, T., Varga, Z., Karanyi, Z., Magyar, M. T., Olah, L., Papp, M., Facsko, A., Kappelmayer, J., Paragh, G., and Kaplar, M. (2011). Increased levels of platelet activation markers are positively associated with carotid wall thickness and other atherosclerotic risk factors in obese patients. Thromb. Haemost. 106, 683–692.
DeStefano, A. L., Atwood, L. D., Massaro, J. M., Heard-Costa, N., Beiser, A., Au, R., Wolf, P. A., and DeCarli, C. (2006). Genome-wide scan for white matter hyperintensity: the framingham heart study. Stroke 37, 77–81.
Doring, A., Wild, M., Vestweber, D., Deutsch, U., and Engelhardt, B. (2007). E- and p-selectin are not required for the development of experimental autoimmune encephalomyelitis in c57bl/6 and sjl mice. J. Immunol. 179, 8470–8479.
Duggirala, R., Blangero, J., Almasy, L., Dyer, T. D., Williams, K. L., Leach, R. J., O’Connell, P., and Stern, M. P. (2000). A major susceptibility locus influencing plasma triglyceride concentrations is located on chromosome 15q in Mexican Americans. Am. J. Hum. Genet. 66, 1237–1245.
Engelhardt, B. (2008). Immune cell entry into the central nervous system: involvement of adhesion molecules and chemokines. J. Neurol. Sci. 274, 23–26.
Fazekas, F., Kleinert, R., Offenbacher, H., Schmidt, R., Kleinert, G., Payer, F., Radner, H., and Lechner, H. (1993). Pathologic correlates of incidental mri white matter signal hyperintensities. Neurology 43, 1683–1689.
Glahn, D. C., Curran, J. E., Winkler, A. M., Carless, M. A., Kent, J. W. Jr., Charlesworth, J. C., Johnson, M. P., Goring, H. H., Cole, S. A., Dyer, T. D., Moses, E. K., Olvera, R. L., Kochunov, P., Duggirala, R., Fox, P. T., Almasy, L., and Blangero, J. (2012). High dimensional endophenotype ranking in the search for major depression risk genes. Biol. Psychiatry. 71, 6–14.
Goring, H. H., Curran, J. E., Johnson, M. P., Dyer, T. D., Charlesworth, J., Cole, S. A., Jowett, J. B., Abraham, L. J., Rainwater, D. L., Comuzzie, A. G., Mahaney, M. C., Almasy, L., MacCluer, J. W., Kissebah, A. H., Collier, G. R., Moses, E. K., and Blangero, J. (2007). Discovery of expression qtls using large-scale transcriptional profiling in human lymphocytes. Nat. Genet. 39, 1208–1216.
Gunstad, J., Benitez, A., Hoth, K. F., Spitznagel, M. B., McCaffery, J., McGeary, J., Kakos, L. S., Poppas, A., Paul, R. H., Jefferson, A. L., Sweet, L. H., and Cohen, R. A. (2009). P-selectin 1087g/a polymorphism is associated with neuropsychological test performance in older adults with cardiovascular disease. Stroke 40, 2969–2972.
Henry Feugeas, M. C., De Marco, G., Peretti, II Godon-Hardy, S., Fredy, D., and Claeys, E. S. (2005). Age-related cerebral white matter changes and pulse-wave encephalopathy: observations with three-dimensional mri. Magn. Reson. Imaging 23, 929–937.
Huang, K., Kikuta, A., and Rosen, S. D. (1994). Myelin localization of a central nervous system ligand for l-selectin. J. Neuroimmunol. 53, 133–141.
Huttenlocher, P. R., and Dabholkar, A. S. (1997). Regional differences in synaptogenesis in human cerebral cortex. J. Comp. Neurol. 387, 167–178.
Kochunov, P., Glahn, D., Lancaster, J., Wincker, P., Smith, S., Thompson, P., Almasy, L., Duggirala, R., Fox, P., and Blangero, J. (2010a). Genetics of microstructure of cerebral white matter using diffusion tensor imaging. Neuroimage 15, 1109–1116.
Kochunov, P., Glahn, D., Lancaster, J., Winkler, A., Kent, J., Olvera, R., Cole, S., Dyer, T., Almasy, L., Duggirala, R., Fox, P., and Blangero, J. (2010b). Whole brain and regional hyperintense white matter volume and blood pressure: overlap of genetic loci produced by bivariate, whole-genome linkage analyses. Stroke 41, 2137–2142.
Kochunov, P., Glahn, D., Winkler, A., Duggirala, R., Olvera, R. L., Cole, S., Dyer, T. D., Almasy, L., Fox, P. T., and Blangero, J. (2009). Analysis of genetic variability and whole genome linkage of whole-brain, subcortical, and ependymal hyperintense white matter volume. Stroke 40, 3685–3690.
Kochunov, P., Glahn, D. C., Lancaster, J., Winkler, A., Karlsgodt, K., Olvera, R. L., Curran, J. E., Carless, M. A., Dyer, T. D., Almasy, L., Duggirala, R., Fox, P. T., and Blangero, J. (2011a). Blood pressure and cerebral white matter share common genetic factors in Mexican Americans. Hypertension 57, 330–335.
Kochunov, P., Glahn, D. C., Lancaster, J., Thompson, P. M., Kochunov, V., Rogers, B., Fox, P., Blangero, J., and Williamson, D. E. (2011b). Fractional anisotropy of cerebral white matter and thickness of cortical gray matter across the lifespan. Neuroimage 58, 41–49.
Kochunov, P., Williamson, D. E., Lancaster, J., Fox, P., Cornell, J., Blangero, J., and Glahn, D. C. (2012a). Fractional anisotropy of water diffusion in cerebral white matter across the lifespan. Neurobiol. Aging 33, 9–20.
Kochunov, P., Rogers, W., Mangin, J. F., and Lancaster, J. (2012b). A library of cortical morphology analysis tools to study development, aging and genetics of cerebral cortex. Neuroinformatics 10, 81–96.
Kochunov, P., Thompson, P. M., Coyle, T. R., Lancaster, J. L., Kochunov, V., Royall, D., Mangin, J. F., Riviere, D., and Fox, P. T. (2008). Relationship among neuroimaging indices of cerebral health during normal aging. Hum. Brain Mapp. 29, 36–45.
Lee, D. S., Larson, M. G., Lunetta, K. L., Dupuis, J., Rong, J., Keaney, J. F. Jr., Lipinska, I., Baldwin, C. T., Vasan, R. S., and Benjamin, E. J. (2008). Clinical and genetic correlates of soluble p-selectin in the community. J. Thromb. Haemost. 6, 20–31.
Lerch, J. P., and Evans, A. C. (2005). Cortical thickness analysis examined through power analysis and a population simulation. Neuroimage 24, 163–173.
Marquardt, L., Anders, C., Buggle, F., Palm, F., Hellstern, P., and Grau, A. J. (2009). Leukocyte-platelet aggregates in acute and subacute ischemic stroke. Cerebrovasc. Dis. 28, 276–282.
Mathew, J. P., Podgoreanu, M. V., Grocott, H. P., White, W. D., Morris, R. W., Stafford-Smith, M., Mackensen, G. B., Rinder, C. S., Blumenthal, J. A., Schwinn, D. A., and Newman, M. F. (2007). Genetic variants in p-selectin and c-reactive protein influence susceptibility to cognitive decline after cardiac surgery. J. Am. Coll. Cardiol. 49, 1934–1942.
Mitchell, B. D., Kammerer, C. M., Blangero, J., Mahaney, M. C., Rainwater, D. L., Dyke, B., Hixson, J. E., Henkel, R. D., Sharp, R. M., Comuzzie, A. G., VandeBerg, J. L., Stern, M. P., and MacCluer, J. W. (1996). Genetic and environmental contributions to cardiovascular risk factors in Mexican Americans. The San Antonio Family Heart Study. Circulation 94, 2159–2170.
Nomura, S., Inami, N., Shouzu, A., Urase, F., and Maeda, Y. (2009). Correlation and association between plasma platelet-, monocyte- and endothelial cell-derived microparticles in hypertensive patients with type 2 diabetes mellitus. Platelets 20, 406–414.
Piccio, L., Rossi, B., Colantonio, L., Grenningloh, R., Gho, A., Ottoboni, L., Homeister, J. W., Scarpini, E., Martinello, M., Laudanna, C., D’Ambrosio, D., Lowe, J. B., and Constantin, G. (2005). Efficient recruitment of lymphocytes in inflamed brain venules requires expression of cutaneous lymphocyte antigen and fucosyltransferase-VII. J. Immunol. 174, 5805–5813.
Preston, R. A., Coffey, J. O., Materson, B. J., Ledford, M., and Alonso, A. B. (2007). Elevated platelet p-selectin expression and platelet activation in high risk patients with uncontrolled severe hypertension. Atherosclerosis 192, 148–154.
Reiner, A. P., Carlson, C. S., Thyagarajan, B., Rieder, M. J., Polak, J. F., Siscovick, D. S., Nickerson, D. A., Jacobs, D. R. Jr., and Gross, M. D. (2008). Soluble p-selectin, selp polymorphisms, and atherosclerotic risk in European-American and African-African young adults: the coronary artery risk development in young adults (cardia) study. Arterioscler. Thromb. Vasc. Biol. 28, 1549–1555.
Rutherford, S., Cai, G., Lopez-Alvarenga, J. C., Kent, J. W., Voruganti, V. S., Proffitt, J. M., Curran, J. E., Johnson, M. P., Dyer, T. D., Jowett, J. B., Bastarrachea, R. A., Atwood, L. D., Goring, H. H., Maccluer, J. W., Moses, E. K., Blangero, J., Comuzzie, A. G., and Cole, S. A. (2007). A chromosome 11q quantitative-trait locus influences change of blood-pressure measurements over time in Mexican Americans of the San Antonio Family Heart Study. Am. J. Hum. Genet. 81, 744–755.
Sanada, H., Midorikawa, S., Yatabe, J., Yatabe, M. S., Katoh, T., Baba, T., Hashimoto, S., and Watanabe, T. (2005). Elevation of serum soluble e- and p-selectin in patients with hypertension is reversed by benidipine, a long-acting calcium channel blocker. Hypertens. Res. 28, 871–878.
Shigeta, A., Matsumoto, M., Tedder, T. F., Lowe, J. B., Miyasaka, M., and Hirata, T. (2008). An l-selectin ligand distinct from p-selectin glycoprotein ligand-1 is expressed on endothelial cells and promotes neutrophil rolling in inflammation. Blood 112, 4915–4923.
Sulik, A., Wojtkowska, M., Rozkiewicz, D., and Oldak, E. (2006). Increase in adhesion molecules in cerebrospinal fluid of children with mumps and mumps meningitis. Scand. J. Immunol. 64, 420–424.
Tsankova, N., Berton, O., Renthal, W., Kumar, A., Neve, R., and Nestler, E. (2006). Sustained hippocampal chromatin regulation in a mouse model of depression and antidepressant action. Nat. Neurosci. 9, 519–525.
Tsuang, M. T., Nossova, N., Yager, T., Tsuang, M. M., Guo, S. C., Shyu, K. G., Glatt, S. J., and Liew, C. C. (2005). Assessing the validity of blood-based gene expression profiles for the classification of schizophrenia and bipolar disorder: a preliminary report. Am. J. Med. Genet. B Neuropsychiatr. Genet. 133, 1–5.
Turner, S. T., Fornage, M., Jack, C. R. Jr., Mosley, T. H., Kardia, S. L., Boerwinkle, E., and de Andrade, M. (2005). Genomic susceptibility loci for brain atrophy in hypertensive sibships from the genoa study. Hypertension 45, 793–798.
Wakana, S., Jiang, H., Nagae-Poetscher, L. M., van Zijl, P. C., and Mori, S. (2004). Fiber tract-based atlas of human white matter anatomy. Radiology 230, 77–87.
Winkler, A. M., Kochunov, P., Blangero, J., Almasy, L., Zilles, K., Fox, P. T., Duggirala, R., and Glahn, D. C. (2010). Cortical thickness or grey matter volume? The importance of selecting the phenotype for imaging genetics studies. Neuroimage 53, 1135–1146.
Yilmaz, G., and Granger, D. N. (2010). Leukocyte recruitment and ischemic brain injury. Neuromolecular Med. 12, 193–204.
Zakynthinos, E., and Pappa, N. (2009). Inflammatory biomarkers in coronary artery disease. J. Cardiol. 53, 317–333.
Keywords: cerebral atrophy, genetics, DTI, aging, hypertension, gene expression, P-selectin
Citation: Kochunov P, Glahn DC, Hong LE, Lancaster J, Curran JE, Johnson MP, Winkler AM, Holcomb HH, Kent Jr. JW, Mitchell B, Kochunov V, Olvera RL, Cole SA, Dyer TD, Moses EK, Goring H, Almasy L, Duggirala R and Blangero J (2012) P-selectin expression tracks cerebral atrophy in Mexican-Americans. Front. Gene. 3:65. doi: 10.3389/fgene.2012.00065
Received: 30 December 2011; Accepted: 05 April 2012;
Published online: 01 May 2012.
Edited by:
Michael F. Miles, Virginia Commonwealth University, USAReviewed by:
Michael F. Miles, Virginia Commonwealth University, USAIgor Ponomarev, The University of Texas at Austin, USA
Copyright: © 2012 Kochunov, Glahn, Hong, Lancaster, Curran, Johnson, Winkler, Holcomb, Kent Jr., Mitchell, Kochunov, Olvera, Cole, Dyer, Moses, Goring, Almasy, Duggirala and Blangero. This is an open-access article distributed under the terms of the Creative Commons Attribution Non Commercial License, which permits non-commercial use, distribution, and reproduction in other forums, provided the original authors and source are credited.
*Correspondence: P. Kochunov, Department of Psychiatry, Maryland Psychiatric Research Center, University of Maryland School of Medicine, 55 Wade Avenue, Catonsville, Baltimore, MD, USA. e-mail:cGtvY2h1bm92QG1wcmMudW1hcnlsYW5kLmVkdQ==