

 Hui Huang1,2
- 1 School of Informatics, Indiana University, Indianapolis, IN, USA
- 2 Indiana Center for Systems Biology and Personalized Medicine, Indiana University, Indianapolis, IN, USA
In this work, we integrated prior knowledge from gene signatures and protein interactions with gene set enrichment analysis (GSEA), and gene/protein network modeling together to identify gene network signatures from gene expression microarray data. We demonstrated how to apply this approach into discovering gene network signatures for colorectal cancer (CRC) from microarray datasets. First, we used GSEA to analyze the microarray data through enriching differential genes in different CRC-related gene sets from two publicly available up-to-date gene set databases – Molecular Signatures Database (MSigDB) and Gene Signatures Database (GeneSigDB). Second, we compared the enriched gene sets through enrichment score, false-discovery rate, and nominal p-value. Third, we constructed an integrated protein–protein interaction (PPI) network through connecting these enriched genes by high-quality interactions from a human annotated and predicted protein interaction database, with a confidence score labeled for each interaction. Finally, we mapped differential gene expressions onto the constructed network to build a comprehensive network model containing visualized transcriptome and proteome data. The results show that although MSigDB has more CRC-relevant gene sets than GeneSigDB, the integrated PPI network connecting the enriched genes from both MSigDB and GeneSigDB can provide a more complete view for discovering gene network signatures. We also found several important sub-network signatures for CRC, such as TP53 sub-network, PCNA sub-network, and IL8 sub-network, corresponding to apoptosis, DNA repair, and immune response, respectively.
Introduction
High-throughput genomics technologies (e.g., gene expression microarrays) have been tremendously changing biomedical research nowadays, which allow researchers to simultaneously monitor the expression of tens of thousands of genes (Allison et al., 2006). Microarray data analysis has also become a common practice in many experimental laboratories. Numerous literatures describe the innovative insights within microarray data analysis (Slonim and Yanai, 2009; Reimers, 2010). It has been widely applied into many medical areas, including distinguishing disease subtypes (Sørlie et al., 2001), identifying candidate biomarkers (Giltnane and Rimm, 2004), and revealing the underlying molecular mechanisms of disease (Segal et al., 2005) or drug response (Potti et al., 2006).
Gene expression microarrays can take a snapshot of all the transcriptional activity in a biological sample, while it also generates a huge amount of data with intrinsic noise (sample or instrument noise), which is still quite a challenging task to interpret even by exploiting modern computational and statistical tools (Khatri and Draghici, 2005; Huang et al., 2009; Slonim and Yanai, 2009). This challenge no longer lies in the acquisition of gene expression profiles, but rather in the interpretation of the results to gain insights into biological mechanisms (Subramanian et al., 2005). In many cases, crucial genes show relatively slight changes, and many genes selected are also poorly annotated (Reimers, 2010). From a biological perspective, functionally related genes often display a coordinated expression to accomplish their roles in the cell (Glez-Pena et al., 2009). In order to translate such lists of differentially expressed genes to a functional profile, researchers presented many approaches for better understanding the underlying biological phenomena. One way to aid such interpretation is looking for changes in a group of genes with a common function (gene cluster; Reimers, 2010).
Accordingly, gene set analysis (GSA) methods aim to test the activity of such gene clusters instead of testing the activity of individual genes – individual gene analysis (IGA; Medina et al., 2009). In recent years, GSA approach has received a great deal of attention, since it is free from the problems of the “cutoff-based” methods. In this direction, GSA methods enable the understanding of cellular processes as an intricate network of functionally related components (Glez-Pena et al., 2009). Among these GSA methods, gene set enrichment analysis (GSEA) is one of the most widely used methods (Subramanian et al., 2005). GSEA analyzes pre-defined gene sets based on prior biological knowledge to determine whether this gene set as a whole exhibits differential expression. GSEA has many advantages as it does not employ an arbitrary cutoff to select significant genes. Instead, it uses all the information about every gene involved in the experiment (Huang et al., 2009). However, GSEA does rely on pre-defined gene sets (without gene interaction information), making IGA more beneficial when not much is known about the biological function being considered (Slonim and Yanai, 2009). Furthermore, GSEA still assumes that more differentially expressed genes are more crucial to the biology, which is not always true (Huang et al., 2009). In many cases, extensive upstream data processing, comprehensive gene selection statistics, and downstream pathway/network analysis cannot be replaced by GSEA (Huang et al., 2009). Therefore, gene expression signature analysis and pathway analysis (using tools such as DAVID; Dennis et al., 2003) remain two separate processes.
Network based gene expression analysis is proposed for candidate biomarker discovery by integrating disease susceptibility genes, their gene expressions, and their gene/protein interaction network (Chuang et al., 2007; Pujana et al., 2007). In 2007, Marc Vidal’s group at Harvard constructed a protein interaction network for breast cancer susceptibility using various bioinformatics data sets, and identified HMMR as a new susceptibility locus for the disease (Pujana et al., 2007). Later, Trey Ideker’s group at UCSD integrated protein network and gene expression data to improve the prediction of metastasis formation in patients with breast cancer (Chuang et al., 2007). The two studies marked the exciting beginning of a new paradigm which suggests networks and pathways, although drafty, error-prone, and incomplete, can serve as a roadmap to guide future microarray analysis.
Recent advances in genomics, trancriptomics, proteomics, epigenomics, and metabolomics have begun to help discover DNA/RNA-based prognostic and predictive markers for early and advanced colorectal cancer (CRC; Walther et al., 2009). Systems biology results show that cancer genes and proteins do not function in isolation; instead, they work in interconnected pathways and molecular networks (Goymer, 2007). However, systematically building disease-specific network models at two levels – transcriptome (mRNA-based signatures from microarray data) and proteome (protein–protein interaction, PPI markers from network data), has not yet been done in CRC biomarker discovery.
In this paper, we present a computational systems biology approach based on GSEA and gene/protein network modeling, which can identify gene network signatures from microarray data at transcriptome and proteome levels. Using CRC as a case study, we demonstrate how to apply this approach into discovering gene network signatures from a CRC-related microarray dataset from gene expression omnibus (GEO; Edgar et al., 2002). First, we used GSEA to analyze the microarray data through enriching differential genes in different CRC-related gene sets from two publicly available up-to-date gene set databases – Molecular Signatures Database (MSigDB; Subramanian et al., 2005) and Gene Signatures Database (GeneSigDB; Culhane et al., 2012). Second, we compared the enriched gene sets through enrichment score (ES), false-discovery rate (FDR) and nominal p-value. Third, we constructed an integrated PPI network through connecting these enriched genes by using a human annotated and predicted protein interaction (HAPPI) database (Chen et al., 2009), with a confidence score (CS) labeled for each interaction. Finally, we map differential expression values onto the constructed network to build a comprehensive network model containing visualized genome, transcriptome, and proteome data.
Materials and Methods
Microarray Data
From GEO1, we downloaded a CRC-related microarray dataset – GSE8671, which compared the transcriptome of 32 prospectively collected adenomas with those of the normal mucosa from the same individuals (Sabates-Bellver et al., 2007). Hence we had 32 CRC samples and 32 normal samples. We used maximal expression values for same proteins mapped from different Probe IDs. We used Affy package in BioConductor for Quantile normalization. For background correction, we used the built-in MicroArray Suite (MAS5). We used Limma in BioConductor for differential analysis.
Gene Sets
Gene sets were obtained from MSigDB2 and GeneSigDB3. MSigDB has almost 6769 gene sets and are divided in to five major collections, of which “C2” are curated gene sets collected from various sources such as online pathway databases, publications in PubMed, and knowledge of domain experts. We searched in that collection with keyword “colon” and obtained 73 gene sets. GeneSigDB is a manually curated database of gene expression signatures, and it shares minimum overlap between MSigDB C2 Category of around 8%. It provides the standardized gene list for different search criteria. Searching as “Colon” retrieved 36 gene sets.
Gene Set Enrichment Analysis
Though there are many variations on the GSEA method, we describe the version of the algorithm developed by Subramanian and colleagues (Subramanian et al., 2005), which we called the standard implementation of the method, since it is the most widely used form of the GSEA method. Suppose that a microarray dataset is obtained from two different phenotypes, phenotype 1 and phenotype 2 (e.g., control vs. experimental). This microarray dataset has expression values for the genes across the samples and each row has been identified by unique probe identification. Consider also a given gene set S, usually derived from some common biological category. The objective of the GSEA method is to see if the gene set S shows differential expression between the two phenotypes.
First, the GSEA method calculates an association score for each gene that measures the difference of that gene’s expression in the two phenotypes using any suitable metric. For example, the association score may be computed for each gene with an independent two-sample t-statistic between phenotype 1 and phenotype 2 or the difference between signal-to-noise ratios (mean divided by variance) in each phenotype. Then it places all the N genes involved into a list L = {g1, g2, …, gN} and sorts the list by each gene’s association score ri from most positive to most negative. Genes that appear toward the top of the list are more expressed in phenotype 1, and genes that appear toward the bottom of the list are more expressed in phenotype 2. Next, GSEA walks down the gene list and computes a running sum. Each time it hits a gene in the gene set S, it increases the sum and each time it hits a gene not in the gene set S, it decreases the sum. The degree to which the sum is increased or decreased is weighted and normalized so that the total sum after going through all the genes is 0. Let the ES to be the maximum deviation of the running sum from 0. More specifically, for some weighting parameter p, usually p = 1, let
Then ES is the maximum deviation of Phit − Pmiss from 0.
In order to determine the significance of the ES, the GSEA method creates a number of permutations and recalculates the ES for each permutation. Permutations of the phenotypes in the original microarray data are preferred over permutations of the genes in the gene list, since this preserves the structure between genes. The ES’s of the permutations generate a null distribution, and a nominal p-value is given by the number of permutations with a larger ES than the original data. This nominal p-value is then used to help identify whether this gene set is associated with the difference between the gene expression levels in the samples of the two phenotypes.
GSEA Software and Analysis Set-Up
The Broad Institute provides an easy to use standalone Java implementation of the GSEA method on their website4. All gene sets with more than 500 genes or less than 15 genes were automatically excluded, according to the default settings. The difference between signal-to-noise ratios was used as the association score. The number of phenotype permutations involved in the nominal p-value calculation was 1000. For each analysis, we report the number of gene sets with FDR <25%. Along with these gene sets with FDR <25%, we report the number of gene sets whose nominal p-values are <1% or 5%. There are some overlap between the three lists of gene sets, but neither FDR <25% nor nominal p-values <5% are necessarily subsets of each other. Of course, the collection of gene sets with nominal p-values <1% is a subset of that with nominal p-values <5%. Providing results based on all three criteria adds robustness of the findings, since each has its own merit.
Gene/Protein Network Modeling
To optimize computation time and information generation, we used a combined network construction strategy, based on the enriched genes from both MSigDB and GeneSigDB.
First, we connected the enriched MSigDB genes from GSE8671in HAPPI5 with CS (CI > = 0.75, i.e., both four-star and five-star rating) for high-quality interactions, to obtain a PPI network. The local topological property (e.g., node degree, cluster coefficient, betweenness centrality, neighborhood connectivity etc. (Wu and Chen, 2009) for each node was calculated based on this network. Then genes with absolute fold change |FC| > = 1.5, equals to Log2(FC) > = 0.585, were kept.
Second, we connected the enriched GeneSigDB genes from GSE8671 in HAPPI (see text footnote 5) with CS (CI > = 0.75, i.e., both four-star and five-star rating) for high-quality interactions, to obtain another PPI network. In the same way, the local topological property for each node was calculated based on this network. Then genes with absolute fold change |FC| > = 1.5, equals to Log 2(FC) > = 0.585, were kept.
Finally, we combined these two networks to build a node-weighted edge-scored CRC-specific PPI network model by using Cytoscape (Shannon et al., 2003), with node color representing the fold change for each gene, node size representing the local topological property for each gene/protein, edge color, and edge width representing CS for each protein interaction.
Results
Colorectal cancers arise predominantly from adenomas. We chose a microarray dataset (GSE8671) which compared the transcriptome of 32 prospectively collected adenomas with those of the normal mucosa from the same individuals. We searched in MsigDB with keyword “colon” and obtained 73 gene sets. We also searched in GeneSigDB with keyword “colon” and obtained 34 gene sets. We ran the GSEA analysis with default values for the microarray dataset-GSE8671 by using gene sets obtained from MSigDB and GeneSigDB separately. If the number of genes in a gene set falls below the threshold value of 15 in GSEA, we simply filled these gene sets out. PPI data is from HAPPI (foue-star and five-star data).
Enriched Gene Sets from MSigDB
The GSEA analysis using gene sets from MSigDB by applying the filter described above resulted 51 gene sets, of which, 22 gene sets were up-regulated in Normal vs. Cancer, and 29 gene sets were up-regulated in Cancer vs. Normal. Summary of the GSEA analysis result using gene sets from MSigDB are shown in Table 1.
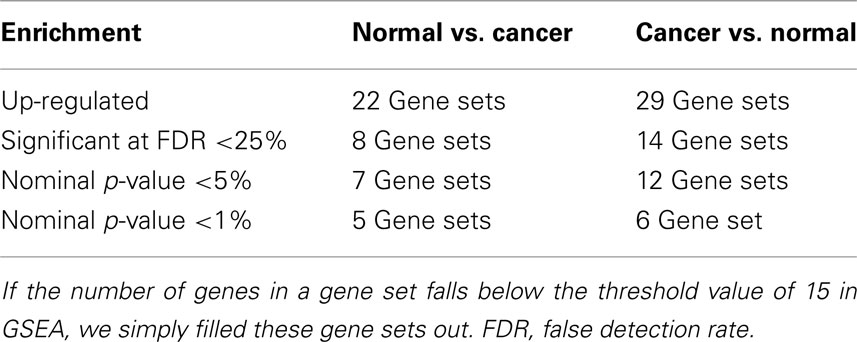
Table 1. Summary of gene set enrichment analysis (GSEA) results for the colorectal cancer (CRC) related microarray – GSE8671, based on the 73 gene sets searched from MSigDB by using query term – “colon.”
The gene set – GRADE_COLON_CANCER_DN tops the list with ES of 0.79 in Normal vs. Cancer, and the gene set – SANA_RESPONSE_TO_IFNG_DN tops the list in Cancer vs. Normal with the ES of −0.67. The enrichment plots of both the top gene sets are shown in Figure 1.
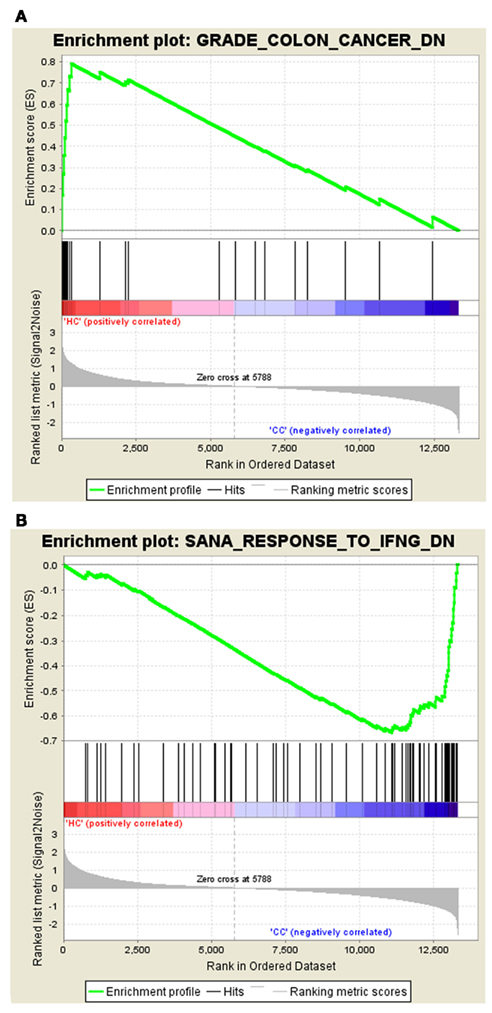
Figure 1. Profile of the running ES score and positions of MSigDB gene set members on the rank ordered list. (A) Enrichment plot for the gene signature – GRADE_COLON_CANCER_DN, (B) Enrichment plot for the gene set – SANA_RESPONSE_TO_IFNG_DN.
Enriched Gene Sets from GeneSigDB
The GSEA analysis using gene sets from GeneSigDB by applying the same filter results 22 gene sets, of which, 11 gene sets are up-regulated in Normal vs. Cancer, and 11 gene sets are up-regulated in Cancer vs. Normal. Summary of the GSEA analysis result using gene sets from MSigDB are shown in Table 2.
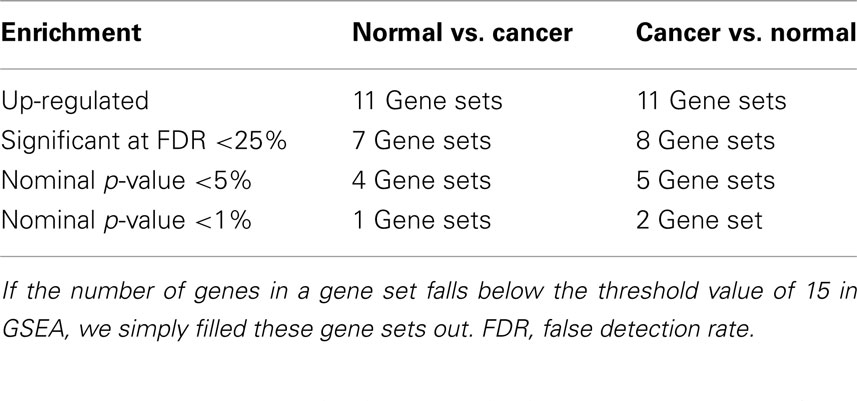
Table 2. Summary of gene set enrichment analysis (GSEA) results for the colorectal cancer (CRC) related microarray – GSE8671, based on the 36 gene sets searched from GeneSigDB by using query term – “colon.”
The gene set – 16091735-TABLE1 tops the list in Normal vs. Cancer with the ES of 0.52 and the gene set – 11906190-TABLE2B-2 tops the list with ES of −0.53 in Cancer vs. Normal. The enrichment plots of both the top gene sets are shown in Figure 2.
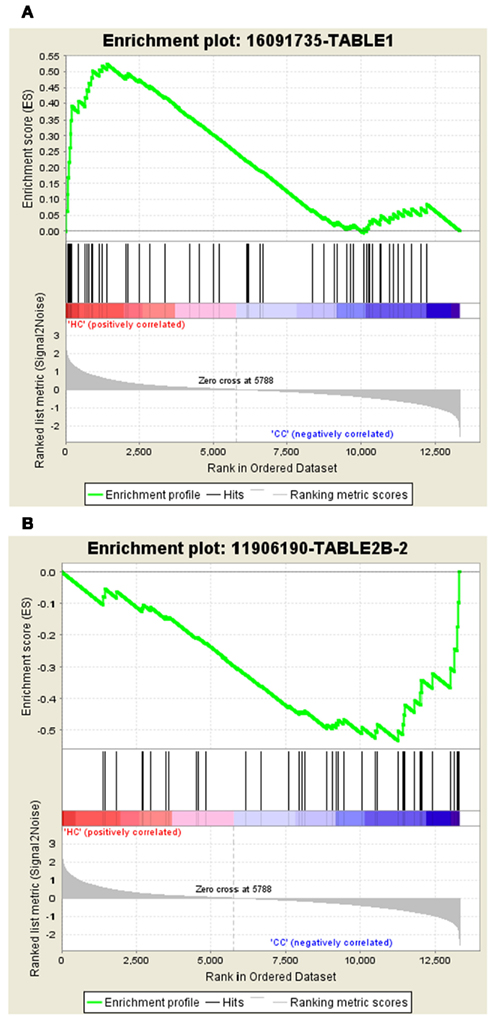
Figure 2. Profile of the running ES score and positions of GeneSigDB gene set members on the rank ordered list. (A) Enrichment plot for the gene signature – 16091735-TABLE1, (B) Enrichment plot for the gene set – 11906190-TABLE2B-2.
A PPI Network Based on Enriched Genes from MSigDB
We constructed a PPI network (325 genes and 686 interactions) with CI > = 0.75 based on the 694 enriched genes (mapped to 678 proteins) from MSigDB, and visualize the network layout by using spring embedded network layout in Cytoscape 2.8.1. After filtering out genes with |FC| < 1.5, there were 244 genes and 422 interactions. We also mapped the differential expression values onto the genes in the network by representing them as node colors. Since we also simply represented node degree as node size, we could easily access the relationship between differential expression value and topological property for each gene in the network. As shown in Figure 3, the gene sets from MSigDB connected very well. Most important genes associated with CRC, such as TP53, MDM2, PCNA, HMMR, CHEK2, and MSH2, related to apoptosis and DNA repair are included. It indicates that MSigDB is suitable for GSEA analysis, unsurprisingly, since MSigDB has been built by the group who also introduced standard GSEA approach (Subramanian et al., 2005).
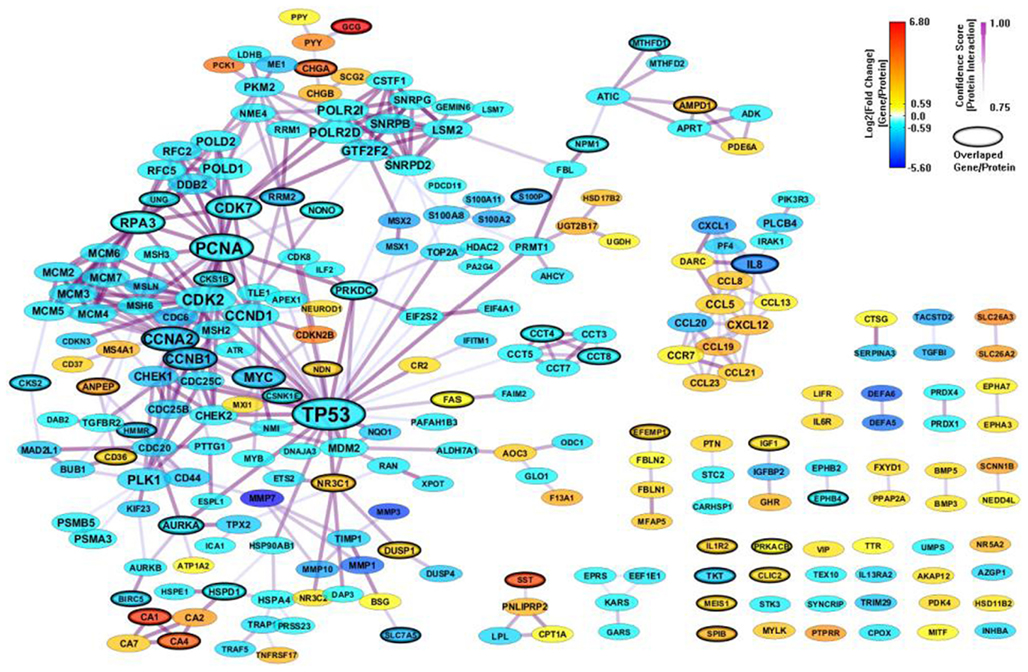
Figure 3. A PPI network based on the enriched genes from MSigDB by through analyzing GSE8671 by gene set enrichment analysis (GSEA). The genes/proteins in the network were obtained from GSEA analysis using “colon” related gene signatures searched from MSigDB. Node colors represent differential gene expressions, node size represents the local topological property, edge color, and edge width represents confidence score for each protein interaction. Black-circled genes represent the enriched genes from both MSigDB and GeneSigDB.
A PPI Network Based on Enriched Genes from GeneSigDB
We also constructed a PPI network (112 genes and 169 interactions) with CI > = 0.75 based on the 303 enriched genes (mapped to 301 proteins) from GeneSigDB, and visualize the network layout by using spring embedded network layout in Cytoscape 2.8.1. After filtering out genes with |FC| < 1.5, there were only 68 genes and 62 interactions (shown in Figure 4). Although the gene sets from GeneSigDB are directly from gene expression profile (most of them are microarray data) analysis, the scale of the PPI network built on the enriched genes from GeneSigDB is smaller than the one obtained from MSigDB. It implies that GeneSigDB may not be applicable for GSEA analysis, at least, cannot be used singly. Interestingly, although MSigDB contains more CRC-relevant gene signatures, GeneSigDB includes an important sub-network-IL18 sub-network, which relates to inflammation and immune response.
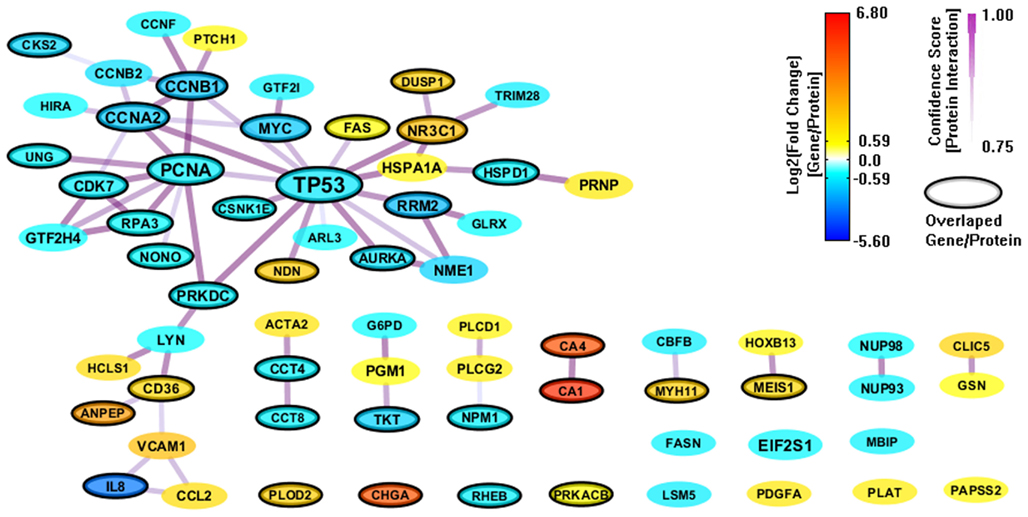
Figure 4. A PPI network based on the enriched genes from GeneSigDB by through analyzing GSE8671 by gene set enrichment analysis (GSEA). The genes/proteins in the network were obtained from GSEA analysis using “colon” related gene signatures searched from GeneSigDB. Node colors represent differential gene expressions, node size represents the local topological property, edge color and edge width represents confidence score for each protein interaction. Black-circled genes represent the enriched genes from both MSigDB and GeneSigDB.
An Integrated CRC-Specific Network Signature
There are only 85 genes (mapped to 84 proteins) overlapped between the 694 enriched genes from MSigDB and the 303 enriched genes from GeneSigDB. So we combine the two PPI network together to build an integrated network signature specific for CRC. We construct a PPI network (443 genes and 1070 interactions) with CI > = 0.75 based on the 895 enriched genes from both MSigDB and GeneSigDB. After filtering out genes with |FC| < 1.5, there are 311 genes and 541 interactions (shown in Figure 5). As we can see, the integrated network has more genes/proteins connected, especial for the gene sub-network surrounding IL8. This gene has been recognized playing an important role in regulates various aspects of immune response, cell death, and differentiation as well as cancer (Raskatov et al., 2012).
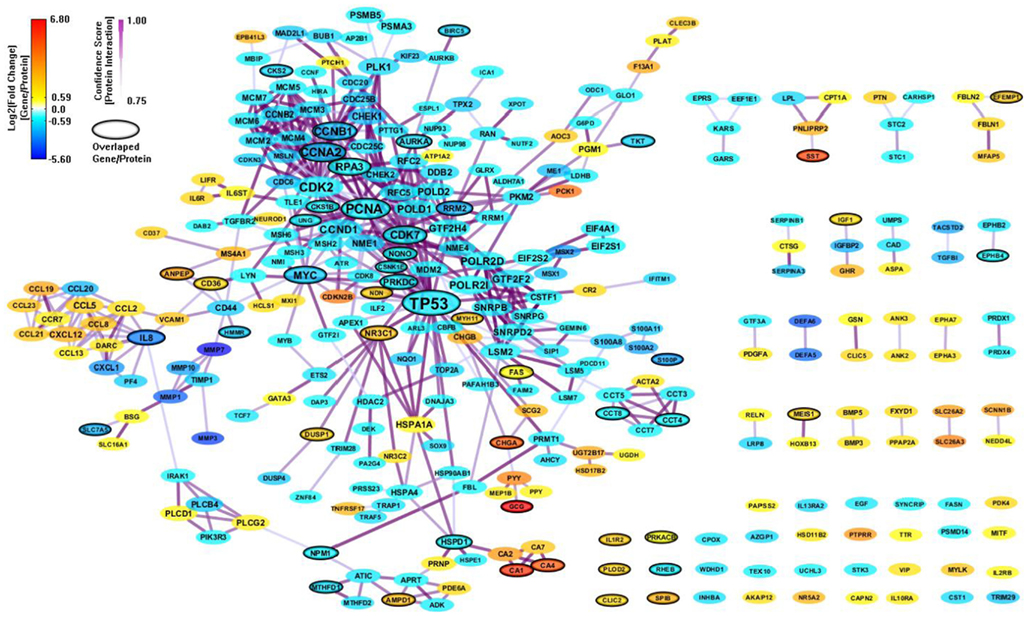
Figure 5. An integrated CRC-specific network signature based on the enriched genes from both MSigDB and GeneSigDB through analyzing GSE8671 by gene set enrichment analysis (GSEA). The genes/proteins in the network were obtained from GSEA analysis using “colon” related gene signatures searched from both MSigDB and GeneSigDB. Node colors represent differential gene expressions, node size represents the local topological property, edge color, and edge width represents confidence score for each protein interaction. Black-circled genes represent the enriched genes from both MSigDB and GeneSigDB.
Discussion
Pathway and GSEA has evolved in high-throughput functional genomics study over the last decade (Khatri et al., 2012). Due to the incomplete information and poor annotation of pathway data, researchers begin to combine gene set enrichment analysis and network module-based approaches together to identify more substantial molecular mechanisms. The third generation gene expression profile analysis (including gene set/pathway/network analysis) can be defined as a knowledge-guided data-driven method, which is not only based on the gene sets from prior knowledge, but also using topology in pathways/networks within or between gene sets (Khatri et al., 2012). Our work here is toward developing third generation approaches for identifying disease-specific network signatures.
In the final CRC network model developed in this paper, node colors represent differential gene expressions from a “CRC-related microarray” – transcriptome, node size represents the local topological property in a “CRC-specific PPI network” – proteome, edge color, and edge width represents CS for each protein interaction – proteome. Most importantly, all the genes/proteins in the network model are obtained from GSEA analysis using “colon”-related gene signatures from both MSigDB and GeneSigDB. Moreover, the overlapped genes between MSigDB and GeneSigDB are labeled out with black-circles. We can see that this integrated PPI network connecting the enriched genes from both MSigDB and GeneSigDB can provide more complete view for discovering gene signatures. This kind of network model for colon/CRC study has NOT been reported before.
However, gene-to-gene or gene-to-protein interaction may be even more accurately represented by a network. One limitation of our restrictive approach and of the GSEA method in general, is that it is not able to generate new hypotheses for unsuspected gene sets. This has proved to be a major limitation of the GSEA method in general, especially since one of the main goals of gene expression microarray analysis is to find new sets of relevant genes. Another disadvantage of the GSEA method is that genes that are more differentially expressed are assumed to be more crucial. However, this assumption has not been thoroughly tested.
Currently, it is important to realize that no single method of gene expression microarray analysis works best, but rather information generated by the different analyses should be integrated together with the knowledge from biological research. In future work, we aim to combine GSEA, gene ontology (GO) enrichment, network expanding/enriching methods together to identify biologically significant genes/proteins. We will use more gene expression microarray datasets to validate this integrated strategy. We will also use newly generated gene expression profiles by using RNA-sequencing (RNA-seq) technique to test our new hypothesis.
Conclusion
In this work, we integrated prior knowledge from gene signatures (curated gene sets from MSigDB and GeneSigDB databases) and protein interactions (high-quality interaction data from HAPPI) with GSEA, and gene/protein network modeling together to identify gene network signatures from gene expression microarray data. We demonstrated how to apply this approach into discovering gene network signatures for CRC from microarray datasets. The results showed: (1) The MSigDB database contained more CRC-relevant gene signatures than GeneSigDB database did; (2) GeneSigDB database included some important information which MSigDB database had not; (3) The integrated PPI network connecting the enriched genes from both MSigDB and GeneSigDB databases can provide a more complete view for discovering gene signatures. We also find several important sub-network signatures for CRC, such as TP53 sub-network, PCNA sub-network and IL8 sub-network, corresponding to apoptosis, DNA repair, and immune response respectively.
Conflict of Interest Statement
The authors declare that the research was conducted in the absence of any commercial or financial relationships that could be construed as a potential conflict of interest.
Acknowledgments
This work is partly supported by Department of Defense (DOD) Warfighter Cancer Care Engineering. We would also like to thanks for the support of Indiana University-Purdue University Indianapolis (IUPUI) Solution Center, Multidisciplinary Undergraduate Research Institute (MURI) for financial support.
Footnotes
References
Allison, D. B., Cui, X., Page, G. P., and Sabripour, M. (2006). Microarray data analysis: from disarray to consolidation and consensus. Nat. Rev. Genet. 7, 55–65.
Chen, J. Y., Mamidipalli, S., and Huan, T. (2009). HAPPI: an online database of comprehensive human annotated and predicted protein interactions. BMC Genomics 10(Suppl 1), :S16. doi: 10.1186/1471-2164-10-S1-S16
Chuang, H. Y., Lee, E., Liu, Y. T., Lee, D., and Ideker, T. (2007). Network-based classification of breast cancer metastasis. Mol. Syst. Biol. 3, 140–149.
Culhane, A. C., Schröder, M. S., Sultana, R., Picard, S. C., Martinelli, E. N., Kelly, C., Haibe-Kains, B., Kapushesky, M., St Pierre, A. A., and Flahive, W. (2012). GeneSigDB: a manually curated database and resource for analysis of gene expression signatures. Nucleic Acids Res. 40, D1060–D1066.
Dennis, G. Jr., Sherman, B. T., Hosack, D. A., Yang, J., Gao, W., Lane, H. C., and Lempicki, R. A. (2003). DAVID: database for annotation, visualization, and integrated discovery. Genome Biol. 4, R60.
Edgar, R., Domrachev, M., and Lash, A. E. (2002). Gene expression omnibus: NCBI gene expression and hybridization array data repository. Nucleic Acids Res. 30, 207.
Giltnane, J. M., and Rimm, D. L. (2004). Technology insight: identification of biomarkers with tissue microarray technology. Nat. Clin. Pract. Oncol. 1, 104–111.
Glez-Pena, D., Gomez-Lopez, G., Pisano, D. G., and Fdez-Riverola, F. (2009). WhichGenes: a web-based tool for gathering, building, storing and exporting gene sets with application in gene set enrichment analysis. Nucleic Acids Res. 37, W329–W334.
Goymer, P. (2007). Cancer genetics: networks uncover new cancer susceptibility suspect. Nat. Rev. Genet. 8, 823.
Huang, D. W., Sherman, B. T., and Lempicki, R. A. (2009). Bioinformatics enrichment tools: paths toward the comprehensive functional analysis of large gene lists. Nucleic Acids Res. 37, 1–13.
Khatri, P., and Draghici, S. (2005). Ontological analysis of gene expression data: current tools, limitations, and open problems. Bioinformatics 21, 3587–3595.
Khatri, P., Sirota, M., and Butte, A. J. (2012). Ten years of pathway analysis: current approaches and outstanding challenges. PLoS Comput. Biol. 8, e1002375. doi:10.1371/journal.pcbi.1002375
Medina, I., Montaner, D., Bonifaci, N., Pujana, M. A., Carbonell, J., Tarraga, J., Al-Shahrour, F., and Dopazo, J. (2009). Gene set-based analysis of polymorphisms: finding pathways or biological processes associated to traits in genome-wide association studies. Nucleic Acids Res. 37, W340–W344.
Potti, A., Dressman, H. K., Bild, A., Riedel, R. F., Chan, G., Sayer, R., Cragun, J., Cottrill, H., Kelley, M. J., and Petersen, R. (2006). Genomic signatures to guide the use of chemotherapeutics. Nat. Med. 12, 1294–1300.
Pujana, M. A., Han, J. D. J., Starita, L. M., Stevens, K. N., Tewari, M., Ahn, J. S., Rennert, G., Moreno, V., Kirchhoff, T., and Gold, B. (2007). Network modeling links breast cancer susceptibility and centrosome dysfunction. Nat. Genet. 39, 1338–1349.
Raskatov, J. A., Meier, J. L., Puckett, J. W., Yang, F., Ramakrishnan, P., and Dervan, P. B. (2012). Modulation of NF-κB-dependent gene transcription using programmable DNA minor groove binders. Proc. Natl. Acad. Sci. U.S.A. 109, 1023–1028.
Reimers, M. (2010). Making informed choices about microarray data analysis. PLoS Comput. Biol. 6, e1000786. doi:10.1371/journal.pcbi.1000786.
Sabates-Bellver, J., Van der Flier, L. G., de Palo, M., Cattaneo, E., Maake, C., Rehrauer, H., Laczko, E., Kurowski, M. A., Bujnicki, J. M., and Menigatti, M. (2007). Transcriptome profile of human colorectal adenomas. Mol. Cancer Res. 5, 1263.
Segal, E., Friedman, N., Kaminski, N., Regev, A., and Koller, D. (2005). From signatures to models: understanding cancer using microarrays. Nat. Genet. 37, S38–S45.
Shannon, P., Markiel, A., Ozier, O., Baliga, N. S., Wang, J. T., Ramage, D., Amin, N., Schwikowski, B., and Ideker, T. (2003). Cytoscape: a software environment for integrated models of biomolecular interaction networks. Genome Res. 13, 2498–2504.
Slonim, D. K., and Yanai, I. (2009). Getting started in gene expression microarray analysis. PLoS Comput. Biol. 5, e1000543. doi:10.1371/journal.pcbi.1000543
Sørlie, T., Perou, C. M., Tibshirani, R., Aas, T., Geisler, S., Johnsen, H., Hastie, T., Eisen, M. B., Van De Rijn, M., and Jeffrey, S. S. (2001). Gene expression patterns of breast carcinomas distinguish tumor subclasses with clinical implications. Proc. Natl. Acad. Sci. U.S.A. 98, 10869–10874.
Subramanian, A., Tamayo, P., Mootha, V. K., Mukherjee, S., Ebert, B. L., Gillette, M. A., Paulovich, A., Pomeroy, S. L., Golub, T. R., and Lander, E. S. (2005). Gene set enrichment analysis: a knowledge-based approach for interpreting genome-wide expression profiles. Proc. Natl. Acad. Sci. U.S.A. 102, 15545–15550.
Keywords: network biology, gene set enrichment analysis, gene expression signatures, microarray analysis, colorectal cancer
Citation: Sonachalam M, Shen J, Huang H and Wu X (2012) Systems biology approach to identify gene network signatures for colorectal cancer. Front. Gene. 3:80. doi: 10.3389/fgene.2012.00080
Received: 01 January 2012; Accepted: 25 April 2012;
Published online: 17 May 2012.
Edited by:
Firas H. Kobeissy, University of Florida, USAReviewed by:
Jian-Liang Li, Sanford Burnham Medical Research Institute, USAJoy Guingab, Banyan Biomarkers, Inc., USA
Copyright: © 2012 Sonachalam, Shen, Huang and Wu. This is an open-access article distributed under the terms of the Creative Commons Attribution Non Commercial License, which permits non-commercial use, distribution, and reproduction in other forums, provided the original authors and source are credited.
*Correspondence: Xiaogang Wu, Indiana University School of Informatics, Indiana University, 719 Indiana Avenue, Suite 190, Indianapolis, IN 46202-6151, USA. e-mail:d3UzM0BpdXB1aS5lZHU=
†Madhankumar Sonachalam and Jeffrey Shen have contributed equally to this work.