
- Institute for Medical Genetics and Human Genetics, Charité-Universitätsmedizin Berlin, Berlin, Germany
Genetic background of an individual can drastically influence an organism’s response upon environmental stress and pathological stimulus. Previous studies in inbred rats showed that compared to Brown Norway (BN), Dahl salt-sensitive (SS) rat exerts strong hypoxia susceptibility. However, despite extensive narrow-down approaches via the chromosome substitution methodology, this genome-based physiological predisposition could not be traced back to distinct quantitative trait loci. Upon the completion and public data availability of PhysGen SS-BN consomic (CS) rat platform, I employed systems biology approach attempting to further our understanding of the molecular basis of genetic background effect in light of hypoxia response. I analyzed the physiological screening data of 22 CS rat strains under normoxia and 2-weeks of hypoxia, and cross-compared them to the parental strains. The analyses showed that SS-9BN and SS-18BN represent the most hypoxia-resistant CS strains with phenotype similar to BN, whereas SS-6BN and SS-YBN segregated to the direction of SS. A meta-analysis on the transcriptomic profiles of these CS rat strains under hypoxia treatment showed that although polymorphisms on the substituted BN chromosomes could be directly involved in hypoxia resistance, this seems to be embedded in a more complex trans-chromosomal genetic regulatory network. Via information theory based modeling approach, this hypoxia relevant core genetic network was reverse engineered. Network analyses showed that the protective effects of BN chromosome 9 and 18 were reflected by a balanced activation of this core network centering on physiological homeostasis. Presumably, it is the system robustness constituted on such differential network activation that acts as hypoxia response modifier. Understanding of the intrinsic link between the individual genetic background and the network robustness will set a basis in the current scientific efforts toward personalized medicine.
Introduction
Hypoxia is a common environmental stressor, the effect of which depending on time and duration of hypoxia explosion. In mammals, the fetal, and newborn brain is particularly susceptible to hypoxia. In utero hypoxia can lead to inhibition of breathing movements, and increase the risk for neuronal developmental deficits (Cai et al., 1999). The period immediately after birth represents a critical time window in which hypoxia can cause long-term changes in the structural and functional properties of the respiratory systems (Teppema and Dahan, 2010). During the developmental period, hypoxia can cause a suppressed pituitary growth hormone level through increased action of somatostatin (Xu et al., 2004). At adulthood, exposure to chronic hypoxic paradigms induces a pathogenic increase in ventilation that may sustain (Teppema and Dahan, 2010).
Notably, the onset and severity of hypoxia response drastically differ within the population. Intermittent hypoxia treatment, for example, can significantly increase the risk of ventricular arrhythmias and myocardial infarction in some individuals, but lead to no detectable phenotype in other kinships (Kolar et al., 2005). Although physiological dynamics of the respiratory track, blood circulation, and hormonal response could play an important role, it is suspected that such personalized hypoxia response might be associated with unique allelic composition of the genome of each individual. In this regard, improved arterial oxygen saturation in Tibetan highlanders has been attributed to polymorphism of a hypothetical QTL (Beall et al., 1994). However, despite concerted efforts in either GWAS case-control studies or family-based linkage analysis, the responsible hypothetical QTL for hypoxia susceptibility could not yet be specified (Beall et al., 1997). New generation genome sequencing has the power to decipher the individual genetic constellation in ever faster paces that will soon become compatible for individual disease diagnosis and therapy. However, considering the high complexity of the genome, an open question concerns the specific genetic set-up which is responsible for the phenotypic variances.
Different inbred laboratory animal strains can simulate divergent genetic make-up of a normal human population. Like in human, data in rats showed that the same environmental stress can have completely different effects in different inbred animal strains (Todd and Wicker, 2001). For instance, Dahl salt-sensitive (SS) and Brown Norway (BN) are two inbred rat strains derived from wildtype Rattus norvegicus. While SS is highly sensitive to hypoxia, BN is rather robust (Malek et al., 2006). Obviously, as in human being, here the rat strain specific polymorphisms act as the physiological response modifier under hypoxia treatment.
In recent years, chromosome substitution (consomic, CS) platform have emerged, which offer an ideal system to cut down the allelic variations between two inbred rat strains into the level of individual chromosomes (Cowley et al., 2004). PhysGen, the National Heart, Lung, and Blood Institute (NHLBI)-funded genomic application has bred the whole panel of CS rats out of SS and BN rat strains. Heroically, they have also performed profound physiological phenotype and transcriptomic screenings under normoxia, hypoxia, and hypercapnia conditions (Kunert et al., 2006). Most appreciably, these scientists have made their data public, which provides an unprecedented opportunity to the entire scientific community for the investigation of cross-chromosome genotype-phenotype associations. Yet, despite concerted effort to hunt for modifier genes and multigenic polymorphisms relevant to hypoxia sensitivity on this CS rat platform, no candidate genes responsible for the hypoxia-protection have so far been percepted. Instead, as many as five chromosomes were loosely defined as potential QTL-holders, the single nucleotide polymorphisms (SNPs) and other polymorphic elements on which presumably having an impact on the organism’s hypoxia response (Forster et al., 2003).
At this juncture, we need to keep in mind that stress response, including hypoxia response, arguably belongs to multigenic complex traits, i.e., phenotypes that arise from complex molecular interaction across many genes and proteins. Taking the SNP as example, one SNP can influence many genes at the transcriptional and post-transcriptional level (especially for SNP on transcription factor). In the same sense, a gene or a regulatory locus that is involved in hypoxia response can be influenced by multiple SNPs and additional polymorphic elements simultaneously. Hence, the impact of a single polymorphic gene alone might only be marginal in many cases, or could even be compensated by other polymorphisms of the individual (Weiss and Terwilliger, 2000).
Here, making use of the extensive physiological screening and transcriptomic data on the comprehensive CS rat strains platform (Liang et al., 2004), I set out to uncover the true connection between rat genetic background and hypoxia resistance at the level of genetic interaction network. Through sophisticated handling of the experimental data via systems biological approach, I make the notion that individual polymorphism may modify the hypoxia resistance via differential activation of a cross-chromosomal genetic network that is involved in physiological homeostasis.
Materials and Methods
All experimental data used in this study were obtained from the PhysGen project website1. For clarify, I attempt to briefly review the major issues in the experimental design that are relevant to the current post hoc data analyses.
Chromosome Substitution Rat Panel
The SS-BN CS rat panel was generated and initially characterized as part of “PhysGen,” a NHLBI Programs for Genomic Applications (see text footnote 1; Cowley et al., 2001; Lagrange and Fournie, 2010). These are inbred rat strains otherwise of SS/JrHsdMcwi (ontology ID RS:0000811, shorten as SS) genetic background, but acquired one homologous chromosome pair from the BN inbred rat strain (BN/NHsdMcwi, ontology ID RS:0000145, shorten as BN), as confirmed by marker-assisted high density scan. The nomenclature SS-nBN is used to designate the CS strain in which both homologous chromosome n of the SS rat have been replaced by that of the BN strain. The CS rat strains were housed at the Medical College of Wisconsin Animal Resource Transgenic Barrier Facility by brother-sister mating (Cowley et al., 2001). As parental strains, BN and SS were obtained from the same laboratory. All rats received the same diet (Teklad 3075S, 0.4% NaCl) and water ad libitum.
Physiological Screening Under Normal and Hypoxia Conditions
Comprehensive physiological screenings of the SS-BN CS rat platform including the parental strains, were performed in the frame of PhysGen project (Kunert et al., 2006; Malek et al., 2006). These comprise the biochemical, cardiac, lung, and renal protocols, with a total of over 200 traits tested. Details regarding these phenotyping protocols are documented on the PhysGen website. For the investigation of hypoxia response, 10-week-old animals were conditioned for 2 weeks under hypoxia atmospheric condition (12% inspired oxygen), whereas normoxia control rats were kept under room air (21% oxygen). Physiological screening was performed at 12 weeks of animal age. Each group of animals (same strain, same gender, and same air oxygen condition) contained 17–114 animals (48 ± 34). Comparable numbers of male and female rats were always studied in each trait. Ventilatory response and blood oxygen saturation were measured additionally for rats between 2–3 and 9–10 min of hypoxia treatment. Conventionally, hypoxic sensitivity can be indexed by the ratio of difference between bodyweight normalized minute ventilation (VE) at hypoxic and at normoxic conditions over the log-difference of hemoglobin oxygen saturation between hypoxic and normoxic conditions (Eq. 1; Teppema et al., 2009):
For statistical data analyses, equality of variance between strains in each phenotype was first assessed by Levene’s test (Jobson, 1991). If Levene’s test for homoscedasticity was passed, one-way ANOVA with Dunnett’s post hoc test was used to compare phenotypical differences between parental and CSs (p < 0.05). It uses the information provided by conventional ANOVA to determine which groups are causing the significant difference in mean through pair-wise comparisons. Dunnett’s test takes into account the multiple comparisons made, thus there was no need for additional Bonferroni corrections. For datasets that do not comply with the variance homogeneity, non-parametric ANOVA, employing the Kruskal–Wallis test was performed (Zar, 1999). Analogously, if there was an among-group-mean difference, Turkey’s test was used to determine which groups were causing the significant differences in means via pair-wise comparisons.
Microarray Transcriptomic Profiling
Transcriptomic data were generated using Affymetrix slide type GeneChip 230_2.0 for rat. The chip contained 27,648 probe sets (excluding controls), corresponding to over 3000 non-redundant rat ESTs (Malek et al., 2006). The microarray data were available for heart, kidney, liver, and lung tissues of rats from the physiological screening, stratified by strains (CS or parental), conditions (normoxia or hypoxia), and gender. Six samples per group were used for each microarray experiment. Pre-processed microarray data of five CS strains (SS-2BN, SS-6BN, SS-9BN, SS-18BN, and SS-YBN) and both parental strains (BN and SS) were downloaded from the PhysGen website. Procedures of tissue collection, RNA extraction, cDNA generation, hybridization, and data pre-processing are described in previous literatures and on the PhysGen website (Liang et al., 2002, 2003). A small loop comparison strategy of the following schema was used in the two-color co-hybridization, each repeated with dye switching: Consomic normoxia (CS_normoxia) vs. SS normoxia (SS_normoxia); SS normoxia vs. SS hypoxia (SS_hypoxia); SS hypoxia vs. consomic hypoxia (CS_hypoxia); and consomic hypoxia vs. consomic normaxia. In addition, common reference RNAs, which was generated by mixing equal concentration of commercially available RNA from five rat tissues (brain, heart, kidney, liver, and lung) were used as internal controls for the whole study. This enables the indirect comparisons between microarray measurements to be made. All expression alterations were normalized to log2 ratio vs. SS_normoxia treatment as internal control. The cut-off value was set as 0.263 (20% up-regulation), or −0.322 (20% down-regulation). The significance threshold of differential expression was set as p < 0.05. FDR was controlled as 5% after Bonferroni correction for multiple testing. In addition, using the permutation-based Significance Analysis of Microarrays (SAM)2, FDR of less than 7% was controlled across the whole study.
Chromosome Representative Index Calculation
In order to determine the relative contribution of substituted chromosome on the gene expression alterations, chromosome representative index of the genes of altered expression was calculated for each substituted chromosome under given test conditions according to the following equation, as described in Eq. 2 (Liang et al., 2008):
For each CS strain and air oxygen condition, nchr is the number of differentially expressed non-redundant ESTs located on a given chromosome; n represents the total number of non-redundant ESTs with altered expression. Nchr is the ESTs located on a given chromosome in the entire microarray, whereas N = 5860 represents the total number of ESTs probed by the microarray chip.
Functional Annotation of Gene Expression Alterations
In order to investigate the functional impact of CS genetic polymorphisms on the cellular response to hypoxia treatment, variant transcripts in this study were subjected to functional characterization with the help of public databases. The “WebGestalt Gene Set Enrichment Toolkit” was employed3, which conducts Gene Ontology (GO)-term, gene set, cytogenetic band, and pathway enrichment analyses by cross-referencing downstream public genetic functional annotation databases such as GO, Kyoto Encyclopedia of Genes and Genomes (KEGG), and Reactome. The Affymetrix probe sets of rat whole genome (230_2.0) were employed as the reference gene set. Fischer’s exact test was used with statistical thresholding p < 0.01, except for the cytogenetic band enrichment analysis, which had p < 0.05. The Bonferroni–Holm method served as the multiple test adjustment. A minimum of three genes in the enrichment was set as an additional cut-off. The adjusted p-values were reported in the result section, as these are generally more stringent compared to the raw p-values.
Reverse Engineering of the Hypoxia Modifying Core Genetic Network
A data-driven information theory based network modeling approach was applied on the transcriptomic data to re-construct the parsimonious underlying interaction network in light of the hypoxia-induced gene expression co-regulation (Mao et al., 2011). As a conceptual model, a living unit can be considered as a system consisting of finite number of interrelating elements. From the systems biology perspective, these elements include proteins and genes, which can be quantitatively sampled at a given system state. In our experiment, the gene expression pattern of the parental control rat strain (SS) under normal condition can be considered as the basal output signals of each system element (gene) at the un-stimulated homeostatic state. The hypoxia treatment and chromosome substitution were further considered as distinct system perturbations that are able to quantitatively transform the basal gene expression pattern (transcriptome) via an underlying, meta-stable genetic network. According to this reductionism’s assumption, three different stimulated states of the rat transcriptome were measured in the current study. They are: SS_Hypoxia: the transformation of basal system state by hypoxia treatment; CS: the transformation of basal system state by a distinct BN CS chromosome, and CS_hypoxia: the concerted operations of chromosome polymorphism and hypoxia treatment. To further generalize the dataset and make it more robust, I attempted to increase the number of perturbations by integrating transcriptomic data of all four organs as well as both genders. This gave us an expanded protein expression alteration matrix relevant to our current experimental setting. Considering all these partial system perturbations, the most parsimonious underlying network relevant to hypoxia response and chromosome substitution can be reconstructed using the experimental data obtained from the transcriptomic analyses. This partial network is termed “hypoxia-associated core genetic network” in this manuscript. For this purpose, microarray data were normalized as log2 Ratio to that of SS_normoxia. Expression ratios of all probe sets bearing the same gene symbol were averaged by arithmetic mean.
Network analysis was performed for all genes underwent significant expression alteration under perturbation. Given a collection of N genes, their expression profiles in a pellet of m observations can be represented by a × N expression matrix. Each row vector of this expression matrix is the expression alteration of a given gene under different perturbations. Now, our subject is to perform a data dependency analysis on this spectrum of gene expression patterns under different perturbations, in order to reverse engineer the underlying genetic interaction network with the highest probability of giving rise to our experimentally observed protein expression alteration data (Lezon et al., 2006; Mao et al., 2011). This task is feasible under two major assumptions: First, the underlying genetic interaction network is meta-stable, i.e., its topology is not influenced by the system perturbations. A further assumption is that gene co-regulation is and only is caused by gene–gene interaction. “Mutual Information” (MI) has been proven to be a good measure of statistical correlation in this non-linear setting (Cover and Thomas, 1991). The “Algorithm for the Reconstruction of Accurate Cellular Networks” was employed, which implements the MI estimates deduced from the entropy theory to judge the importance of links between network nodes. This algorithm has been implemented in a software package Aracne (Margolin et al., 2006). Using the gene expression matrix as input, this tool generates a set of directed and weighted interdependence between genes, which can then be used to generate genetic interaction graph. Graphic representations of the network were realized using the freeware Cytoscape4 (Shannon et al., 2003). For the exploration of network topological properties, global, and local network properties of the resulted networks were analyzed by comparison to each other, and by comparison to randomly generated network null models of same graph constraints. This was achieved via a network analysis utility GraphCrunch2 (Milenkovic et al., 2008). The k-clique community finding tool “CFinder5” was used to grab the community structures (closely interlinked sub-graphs) in the core molecular network (k = 3). This method first locates all cliques of the network and then identifies the communities by carrying out component analysis of the clique–clique overlap matrix (Adamcsek et al., 2006). The calculation of cumulative probabilities using hypergeometric test were performed by the online hypergeometric distribution calculator: http://stattrek.com/online-calculator/hypergeometric.aspx.
Results
In this study, I first attempted to validate the differential hypoxia resistances of the SS and BN inbred rat strains using hypoxia sensitivity indexing. This was followed by a comprehensive phenotype investigation of the entire SS-BN CS rat platform under hypoxia and normoxia treatments, in order to identify indicative traits of hypoxic resistance. Hypoxia-resistant and hypoxia-susceptible CS rat strains were subsequently identified by a “phenotype rescue” assay. The transcriptomic data of these hypoxia-resistant and susceptible strains were then analyzed in order to assess the extent of direct effects of substituted chromosome, as well as the functional implementations of the hypoxia responses. Based on the transcriptomic datasets, a co-regulation based genetic interaction network was reversed engineered using an information theoretic network remodeling approach. Possible differential network activation under hypoxia treatment was accessed by network analysis. An overview of the study workflow is given in Figure 1.
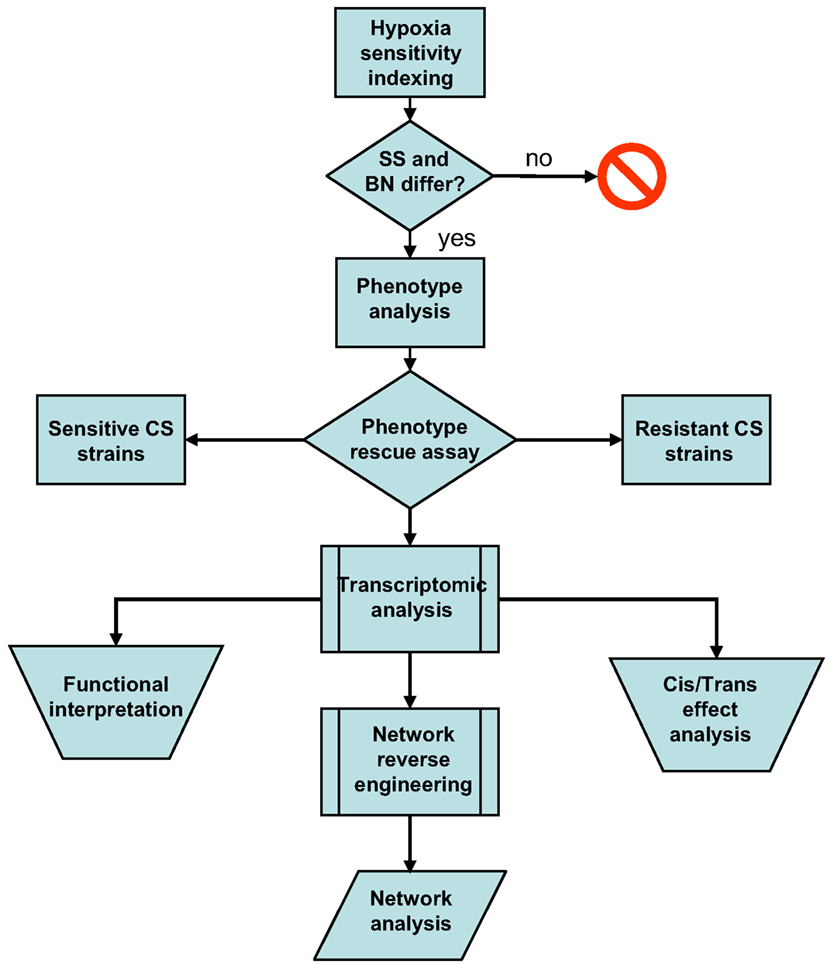
Figure 1. Workflow summary of the current post hoc data analysis. Differential hypoxia resistances of the SS-BN rat strains were assessed using hypoxia sensitivity indexing. This was followed by phenotype investigation in order to identify indicative traits of hypoxic response. Hypoxia-resistant and susceptible consomic rat strains were identified by phenotype rescue assay. Transcriptomic data were analyzed in order to assess the functional implementations of the hypoxia responses and the manifestation of cis/trans-effects. A co-regulation based genetic interaction network was reversed engineered using an information theoretic network remodeling approach.
Genetic Background Specific Hypoxia Sensitivity in BN-SS Consomic Rat Platform
In a comparison of the parental strains, the bodyweight normalized minute ventilation (VE) was significantly increased in both SS and BN strains after 3 min of hypoxia (p < 0.001). However, this increment was greater in SS than in BN (p < 0.038). At 10 min after hypoxia, BN rats showed greater decrease in their VE from three to 10 min of hypoxia, which indicates a greater hypoxic ventilatory roll-off in the BN rats (p < 0.012, Figure 2).
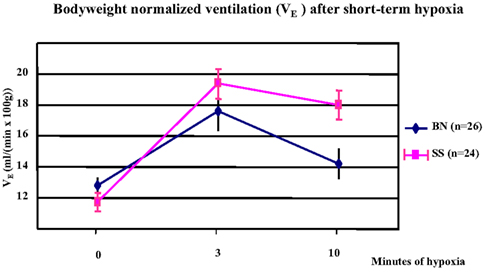
Figure 2. Alteration of bodyweight normalized minute ventilation (VE) under short-term hypoxia treatment in SS and BN parental strains. In both strains, VE was significantly increased after 3 min of hypoxia (p < 0.001). This increment was greater in SS than in BN (p < 0.038). After 10 min of hypoxia, BN rats showed greater hypoxic ventilatory roll-off than in SS rats (p < 0.012).
Based on reference data of VE and LogPO2 of BN and SS (Hodges et al., 2002), the hypoxia sensitivity indexes for both parental strains (SS and BN) as well as for CS strains (except for SS-1BN) between 9 and 10 min after hypoxia treatment were calculated. Note here that the hypoxia sensitivity of SS-1BN could not be calculated due to missing data point. As shown in Figure 3, BN has the lowest hypoxia sensitivity index among the whole CS platform, whereas SS resides the other pole of the spectrum. Other CS strains were located in between the two parental strains.
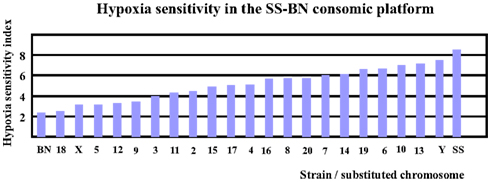
Figure 3. Hypoxia sensitivity index revealed that BN was most hypoxia-resistant, while SS was most sensitive to hypoxia among the SS-BN consomic rat platform.
Physiological Screening of Hypoxia Response Revealed 14 Indicative Traits for Hypoxia Resistance
The phenotyping protocol of PhysGen project comprised a total of 213 physiological measurements of heart, lung, vascular, and blood function. A BN-SS parental strain comparison was first conducted respecting all traits in order to out-select those hypoxia relevant physiological traits that are divergent in the two parental genetic backgrounds upon the action of hypoxia, irrespective of gender. By this means, 14 hypoxia-responsive phenotypic traits were selected, where the hypoxia-induced alteration significantly differ between SS and BN. Mostly, values of these selected traits did not differ in both parental strains under normoxia, but with a significant quantitative difference between SS and BN under hypoxia condition (Table 1).
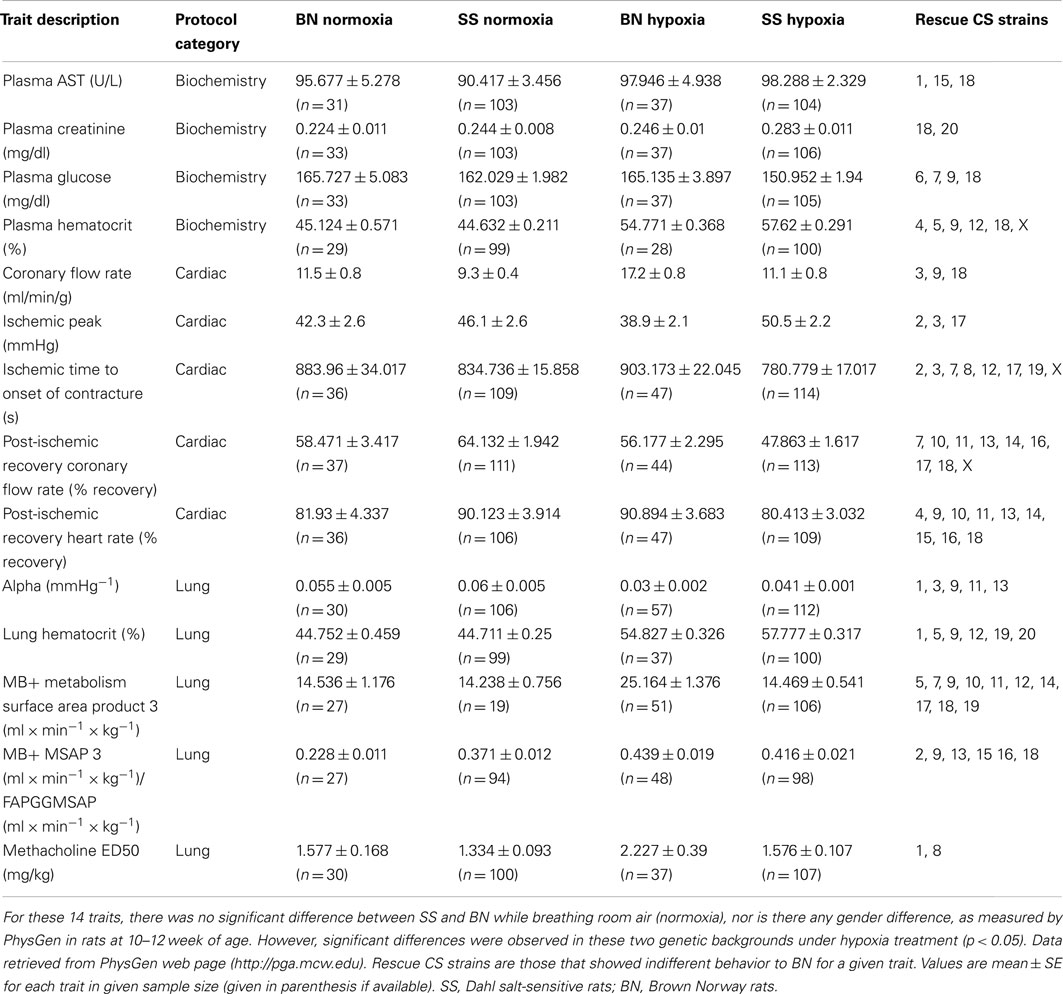
Table 1. Phenotypic responses of SS and BN parental strains in respect to O2 partial pressure (12 or 21% sO2).
The biochemistry protocol was used to characterize indices of clinical chemistry and hematology in normoxic and hypoxia-treated rats. The four biochemical traits that were included in this study which underwent hypoxia-induced alterations are: “plasma AST,” “plasma glucose concentration,” “plasma creatinine,” and “plasma hematocrit.” Respecting the plasma glutamat-oxalacetat-transaminase (AST) level, there was no significant difference between the two parental strains under normal air condition. However, after 2-weeks of hypoxia treatment, the plasma AST level was significantly increased in SS, whereas this measurement was not altered in hypoxia-treated BN. Among the CS panel, CS strains SS-1BN, SS-15BN, and SS-18BN showed comparable AST level to that of BN after hypoxia. Similarly, plasma glucose level of BN and SS parental strains were also comparable under normoxia condition. After hypoxia treatment, however, the plasma glucose level of SS decreased significantly, whereas no change was observed in BN after hypoxia. CS strains that showed comparable behavior to that of BN under hypoxia were SS-6BN, SS-7BN, SS-9BN, and SS-18BN.
The Cardiac protocol was intended to uncover phenotypic differences between CS and parental strains in the mechanical and electrical functions in the aerobically perfused, isolated heart and in the ability of the isolated heart to resist coronary ischemia. Five traits were selected for the current study. They are “ischemic time to onset of contracture,” “post-ischemic recovery heart rate,” “post-ischemic recovery coronary flow rate,” “coronary flow rate (CFR),” and “ischemic peak.” For instance, there was no change of the ischemic time leading to the onset of contracture in BN under normoxia or hypoxia. However, much shorter time period was sufficient for SS after hypoxia leading to contracture onset, suggesting SS’ vulnerability upon hypoxia treatment. Analogously, both the percent recovery rates of post-ischemic heart rate and the CFR were significantly lower in SS after hypoxia. Such alteration was absent in BN rats.
The lung protocol was intended to quantify the strain differences in airway methacholine sensitivity, pulmonary vascular mechanics, pulmonary endothelial angiotensin converting enzyme activity, and pulmonary endothelial redox status in normal and hypoxic condition. A total of five traits were out-selected. They are “Methacholine median effective dose (ED50),” “Alpha pressure,” “MB+ metabolism surface area product 3,” “MB+ MSAP 3/FAPGG MSAP,” and lung hematocrit. Increment in median effective dose of methacholine was registrated for BN after hypoxia (from 1.57 to 2.2 mg/kg). However, this value did not significantly increase in SS after hypoxia treatment. Here, SS-1BN and SS-8BN showed similar behavior to that of BN. Likewise, “MB+ metabolism surface area product 3” increased in BN after hypoxia, while no significant increase was measured in SS after hypoxia.
Identification of Hypoxia-Resistant and Susceptible CS Strains
Based on the findings in the physiological screening experiments, a given CS strain was denoted as a “rescued” phenotype if its physiological behavior was indifferent to that of BN. Respecting each of the 14 traits selected, the number of rescue incidences for each CS strain were counted. Those CS strains that demonstrated the highest incidences of “rescue” in regard to the panel of 14 phenotype traits were denoted as “hypoxia-resistant” CS strains. Analogously, those CS strains that showed lowest number of rescues were defined as “hypoxia sensitive” CS strains.
Based on findings in the physiological screening data, SS-9BN and SS-18BN were most robust to hypoxia treatment. In contrast, SS-6BN and SS-YBN were defined as hypoxia sensitive strains (Figure 4). SS-2BN represents one of the mid-way phenotypes that lie between the two parental strains. Together, these five CS strains were further subjected to transcriptomic analysis.
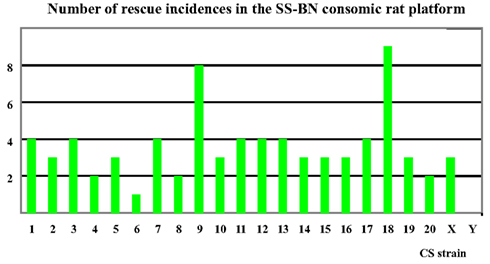
Figure 4. Number of “rescue” incidences in the SS-BN consomic platform. SS-9BN and SS-18BN showed the highest number of “rescues incidences, and were therefore defined as hypoxia-resistant CS strains. In contrast, SS-6BN and SS-YBN were termed hypoxia-susceptible strains.
Cis-Effect Dominated Under Normoxia, Whereas Trans-Effect Prevailed Under Hypoxia
Next, gene expression profiles in heart, lung, liver, and kidney tissues of rats with and without hypoxia treatment were analyzed. In order to access tissue-independent general hypoxia response, data from four tissue types in the same group were merged. In order to detect hypoxia-induced gene expression alterations in SS genetic background, transcriptomic profile of SS under hypoxia (SS_hypoxia) was compared to that of SS normoxia. The obtained list of gene expression alteration in this comparison was denoted as “Set A” gene expression alteration throughout this manuscript. Analogously, respecting each CS strain investigated, the hypoxia-induced transcriptomic alterations in CS background was accessed by the comparison of CS_hypoxia to CS_normoxia (designated as “Set B” gene expression alterations). To differentiate between hypoxia-induced gene expression alteration and possible BN chromosome induced basal genetic background effects, gene expression pattern comparisons between CS_normoxia and SS_normoxia were conducted, which resulted the “Set C” transcriptomic shift. “Set D” designates the transcriptomic difference between CS_hypoxia and SS_hypoxia (Figure 5). Details on differentially expressed transcripts and their fold differences are reported in Table S1 in Supplementary Material.
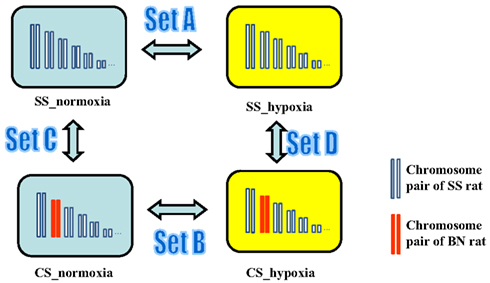
Figure 5. Experimental design for the microarray study of the transcriptomic shift in consomic rat platform induced by (i) Hypoxia treatment (Set A gene expression alterations), (ii) BN consomic chromosome substitution (Set C gene expression alteration), (iii) synergistic effects of hypoxia and consomic (Set B), and CS-chromosome induced effect under hypoxia condition (Set D).
As shown in Figure 6, hypoxia treatment induced very divergent numbers of gene expression alterations (transcriptomic shifts) under different genetic backgrounds. The biggest hypoxia-induced transcriptomic shifts were observed in SS-2BN and SS-YBN, whereas the smallest transcriptomic shifts were observed for SS and SS-18BN. Obviously, there was no correlation between the number of genetic expression variants and the organism’s hypoxia susceptibility.
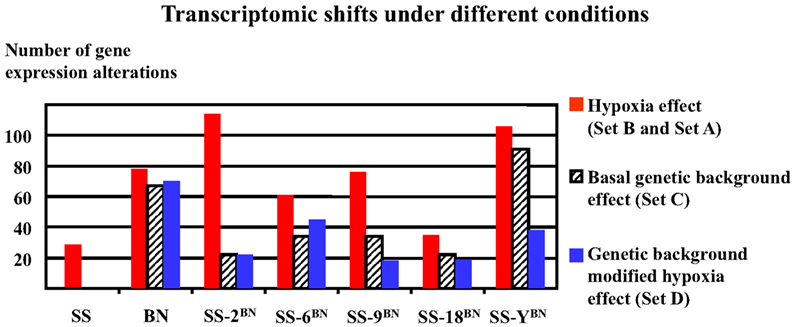
Figure 6. Hypoxia-induced divergent transcriptomic shifts in different strains. The biggest transcriptomic shifts (most profound gene expression alterations) were observed for SS-2BN and SS-YBN, whereas the smallest transcriptomic shifts were observed for SS and SS-18BN. There was no obvious correlation between transcriptomic shifts and the organism’s hypoxia susceptibility.
As a common concern, the direct effects of the substituted chromosome on the gene expression alterations under hypoxia and normoxia conditions were investigated. Generally, there is a “cis-effect,” if a significant number of genes that underwent expression alterations are located on the substituted CS chromosome. On the other side, “trans-effect” designates the phenomenon when the majority of genes that undergo expression alteration are located other than the CS chromosome. In this respect, the chromosome representation index can be used to signify the extent of the cis- and trans-effects. It was observed that none of the substituted chromosome reached the chromosome representation index of greater than one in either gene expression alteration sets (Set A, B, C, and D). This means that none of the substituted chromosome was overrepresented in their respective CS strain through out this study. Specifically, no transcript variants were located on chromosome Y in SS-YBN. This implies that the Y chromosome substitution has rendered the organism with high hypoxia sensitivity without noteworthy cis-effective gene expression alterations. This emphasizes the gender-related secondary effect in light of hypoxia, which is beyond the focus of the current study.
To be more differentiate, as can be deduced from Figure 7 showing the distribution of chromosome representation index in different CS strains, for all five CS strains investigated, the representation index of Set C genes were positioned above of the quarter of Set A, B, C, and D, indicating the slight tendency of cis-action of genetic background effect. In contrast, the representation indexes of Set B proteins lie below the mean quartile, indicating the dominance of trans-effect.
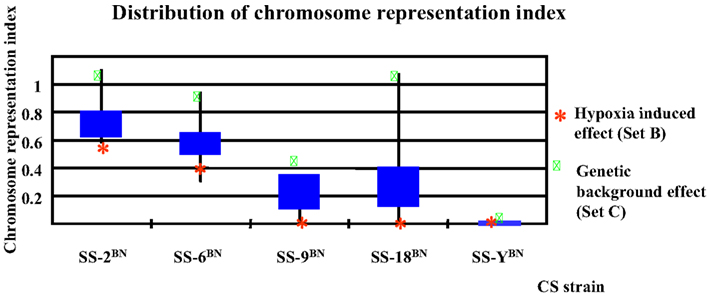
Figure 7. Chromosome representation indexes respecting the substituted chromosome for the genes differentially expressed under normoxia or hypoxia conditions in five consomic strains analyzed. The chromosome representation indexes of Set B genes (hypoxia-induced effect) are located at the lower quartile, whereas that of the Set C genes are of upper quartile, indicating a possible cis-effect in the genetic background induced transcription alterations, but a prevalence of trans-effect in hypoxia responses.
As hypoxia-induced very divergent protein expression alterations in different genetic backgrounds, I next set out to investigate detailed chromosomal localization of these protein expression alterations employing the cytogenetic band enrichment analysis (Table S2 in Supplementary Material). Interestingly, it was observed that the q-arm of chromosome 2 was the most enriched cytogenetic region in all CS strains under normoxia. Under hypoxia condition, chromosome 2 was not enriched except for in SS-2BN (SetB). However, there was no chromosome 6 cytogenetic enrichment in SS-6BN, neither is there any chromosome 9 enrichment in SS-9BN; nor chromosome 18 enrichment in SS-18BN under hypoxia treatment. Taken together, our finding from cytogenetic band analysis supports the lack of cis-effect under hypoxia treatment.
Functional Analysis of the Transcriptomic Alterations Suggest the Involvement of Homeostasis Regulations
It was next attempted to classify the functional involvement of genes altered under hypoxia treatment using the GO-term and the pathway enrichment analyses (Table S2 in Supplementary Material). The biological process (BP) term “homeostasis of body fluid” and the molecular function (MF) terms “nucleoside binding” and “kinase regulator activity” were significantly overrepresented in set C genes. Thus, such homeostasis regulations seem to be predominantly influenced by genetic background polymorphisms. On the other site, hypoxia-induced general tissue-level responses in both BN and in CS strains. This can be seen from the enrichment of cellular component (CC) terms “basement membrane” and “extracellular space,” the BP-term “cell adhesion” and “response to stress,” as well as the MF-term “extracellular matrix structural constituent.” Unlike the BN parental strain and most CS strains, there was a lack of enrichment of such GO-terms in SS under hypoxia, which indicates that SS failed to exert such cellular homeostasis regulations under hypoxia condition. In the pathway analysis, the KEGG pathways “ECM-receptor interaction” was significantly enriched for Set B genes. Moreover, one enriched gene set that is common to Set B genes was “insulin signaling pathway.” This suggests that regulation of extracellular matrix and metabolism belong to the basic aspects of hypoxia-induced general effect, irrespective of the organism’s hypoxia sensitivity or genetic background.
The GO-CC term “membrane fraction” was specific to SS-9BN and SS-18BN under hypoxia. In addition, the BP-terms “regulation of blood vessel size” was common for BN, SS-9BN, and SS-18BN. This could indicate that certain membrane-associated and vesicular responses contribute to the hypoxia resistance in these strains. Moreover, the CC term “mitochondria” was augmented in BN, SS-9BN, and SS-18BN under hypoxia treatment, but not enriched in SS-6BN and SS-YBN. This emphasizes the importance of the active involvement of mitochondria in hypoxia protectively. Likewise, the BP-terms “negative regulation of DNA replication” and “nucleotide-excision repair” were SS-18BN specific. This indicates that at least in SS-18BN, hypoxia treatment could have dampened the cell proliferation process, while at the same time stimulated cellular maintenance programs such as DNA repair.
On the other side, the BP-term “response to chemical stimulus,” “response to extracellular external stimulus,” and “response to endogenous stimulus” could be assigned exclusively to the hypoxia sensitive strains (SS, SS-6BN, and SS-YBN). KEGG pathways associated with hypoxia sensitivity comprise some major signaling pathways such as: “TGF-beta signaling pathway,” “Wnt signaling pathway,” “Drug/Xenobiotics metabolism – cytochrome P450,” and “Apoptosis.” A large range of functional enrichments were observed in SS-YBN. These include the BP-term “cell surface receptor linked signal transduction” and the MF-term “glycoprotein binding.” SS-YBN-specific KEGG pathways include “phenylalanine metabolism” and “complement and coagulation cascades.” Likewise, “Prostaglandin synthesis and regulation” and “IL-6 signaling pathway” were identified as SS-YBN-specific gene sets. Overall, these reflex an enhanced secondary effects including immuno-response in SS-YBN under hypoxia, which could explain the abundant gene expression alterations that were so prominent in SS-YBN.
Reverse Engineering of the Hypoxia-Associated Core Genetic Network
Finally, I set out to reverse engineer the underlying core molecular network contributing to the hypoxic response in this SS-BN CS rat platform. With the profound transcriptomic dataset, I first performed expression level averaging in order to reduce probe sets with redundant gene symbols. The arithmetic means were taken across all probe sets bearing the same gene symbol. Among the 5860 non-redundant ESTs, 1521 gene symbols have redundancy. Probe sets with no valid gene symbols were also ignored for further analysis. This reduced the data roles from over 27,000 to 2857 unique gene symbols. Gene pairs that exhibit correlated transcriptional responses were identified by the MI estimates. As an information theoretic measure of interaction, this pair-wise MI-value is equal to zero if and only if no statistical dependency exists between the variables. The threshold for the MI estimation was set as 0.3, with a p-value of 10E-7. The software tool Aracne2 has an additional function that eliminates those statistical dependencies that might be of an indirect nature by applying a well established “Data Processing Inequality measure” (DPI; Cover and Thomas, 1991). DPI threshold of 0.15 was employed (15% tolerance).
After some additional filtering, the final result was an adjacency matrix inferring potential gene–gene interaction. Based on this interdependency information, a core genetic network containing a total of 490 genes that reflects possible cellular actions upon hypoxia and/or genetic background were de novo derived from the transcriptomic data (Lezon et al., 2006; Dhadialla et al., 2009). Figure 8 shows the genetic core network that is most parsimonious for the observed gene expression alteration pattern in the current experimental setting. In this network representation, nodes represent genes; arcs represent interactions that connect pairs of nodes. The strength of interaction is positively correlated to the vicinity of the two nodes. The detailed network structure is given in Table S3 in Supplementary Material.
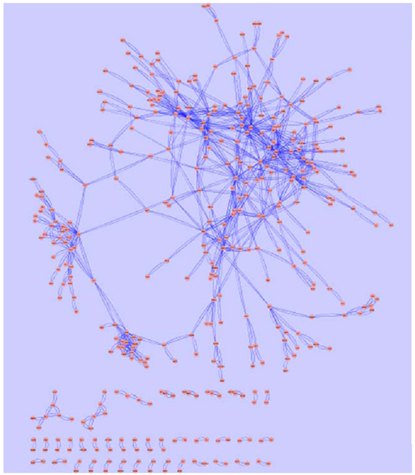
Figure 8. The core genetic network based on gene expression alteration data in the current study was generated using information theory based network modeling approach. Spring-embedded layout was used to demonstrate the arc weights. Graphic representation was generated with Cytoscape (http://www.cytoscape.org). The major network component is consisted of a closely connected kernel layer, a mesh-like intermediate layer, and an outer layer. A small number of distal nodes are separated from the major network component, as displayed at the lower part of the figure.
Network analysis using GraphCrunch2 showed that this genetic core network is non-random. A number of central hub genes build a kernel layer inside the core network, which contains a total of 216 genes. This is a densely interconnected multi-kernel core, which can be subdivided into two closely interconnected community structures employing the CFinder tool. The biggest community structure consisted of eleven hub genes (Table 2). They share the GO Slim-term of “biological regulation,” “developmental process,” and “response to stress.” The second community structure is enriched with ribosomal proteins.
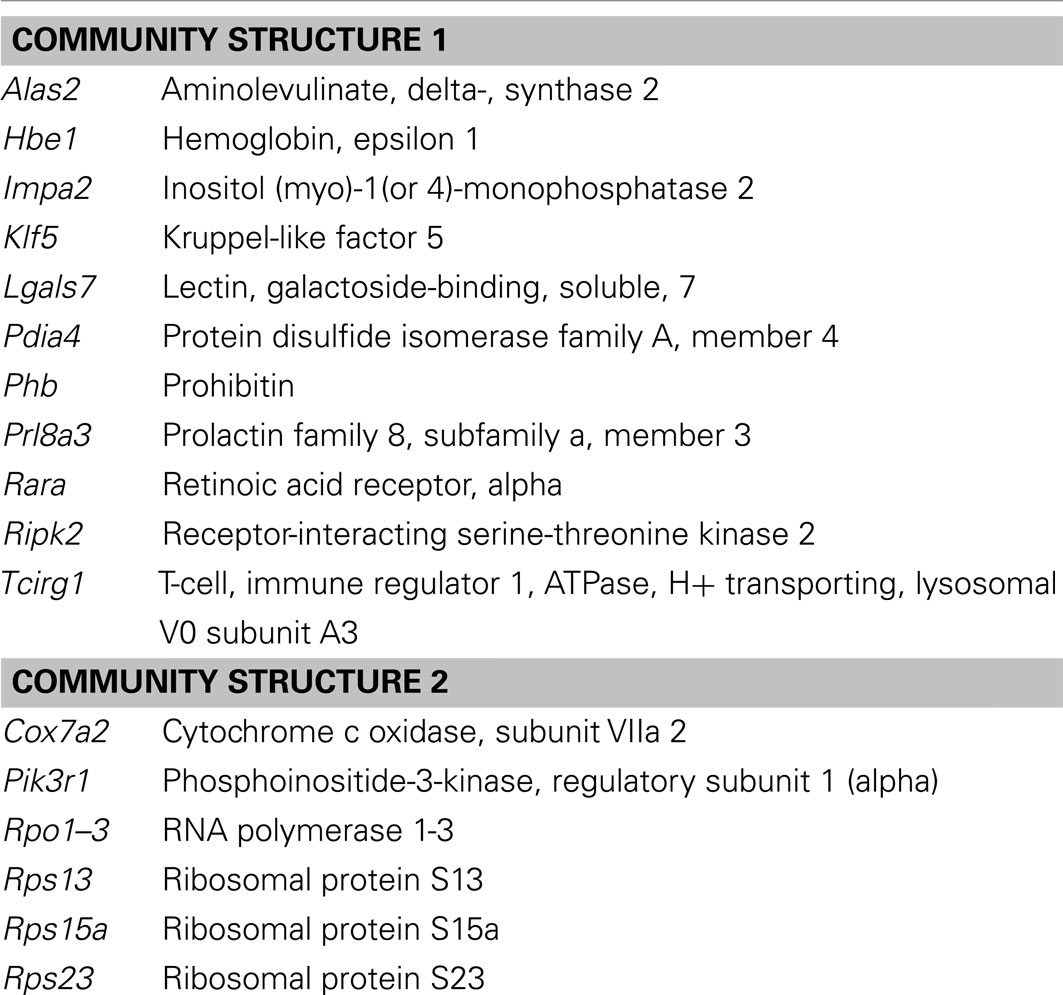
Table 2. Gene symbols and corresponding gene names of the two community structures that constitute the kernel layer of the hypoxia-associated genetic core network.
Outside of this core, 89 genes build an intermediate layer. Although the strengths of their interactions are not as strong as that of the kernel layer, they are gracefully interconnected into lattice-like structure. Moreover, 92 additional genes are distally positioned as the outer layer, but otherwise have no direct interconnection with the rest of the core network. In addition, 93 distal nodes are separated from the major network component, as displayed at the lower part of Figure 8.
Respecting the functional annotation of the core network, it was observed that the BP-terms: “metabolic process” and “biological regulation” were common for all three network layers. The kernel layer was enriched in CC terms “vacuole,” “chromosome,” “nucleoside and DNA.” The middle layer genes were associated with “cell localization,” “proliferation,” “cell component organization,” “death,” and “development.” From the CC perspective, the CC term “mitochondria” was middle layer specific. The outer layer genes were enriched in GO-terms “cell communication,” “growth,” and “response to stimulus.” In addition, the CC-slim terms “ribosome” and “cytoskeleton” were overlapping for kernel and outer layers. These terms were not enriched in the middle layer (Figure 9).
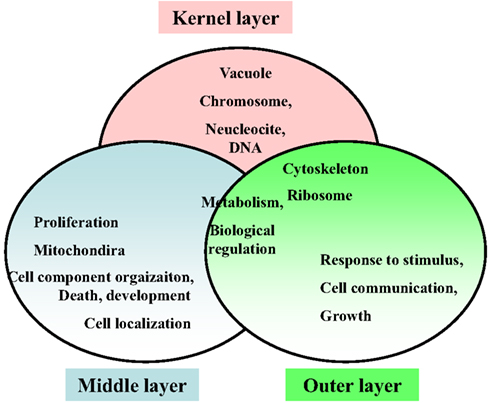
Figure 9. Enriched functional annotations in three layers of the hypoxia-associated genetic core network.
Hypoxia Resistance is Correlated with Balanced Network Activation
After the partition of the core genetic network into three network layers, the topological localization of genes under hypoxia-induced expression alterations was investigated. For this purpose, the hypergeometric probability analysis on the occurrence of nodes in the core network respecting three different layers was performed. In hypoxia sensitive strains (SS-6BN and SS-YBN), around 68% of the activated nodes concerns the kernel layer (hypergeometric probability p = 0.0003), whereas there was only around 25% of outer layer activation (p = 0.001) and 4–5% middle layer activation (p = 6.3E−5; Figure 10A). Similarly, under hypoxia condition, SS had 59% of kernel layer activation, but very little middle (28%) and outer layer activation (13%). In contrast, in the ameliorated hypoxia-induced effect of BN, SS-9BN, and SS-18BN, comparable numbers of activated nodes were positioned in the kernel layer (34 ± 2%), middle layer (35 ± 5%), and the outer layer (30 ± 6%), respectively (Figure 10B). Taken together, in the hypoxia-resistant strains (BN, SS-9BN, and SS-18BN), the synergistic effects of hypoxia and genetic background let to a more balanced core network activation respecting the three network layers.
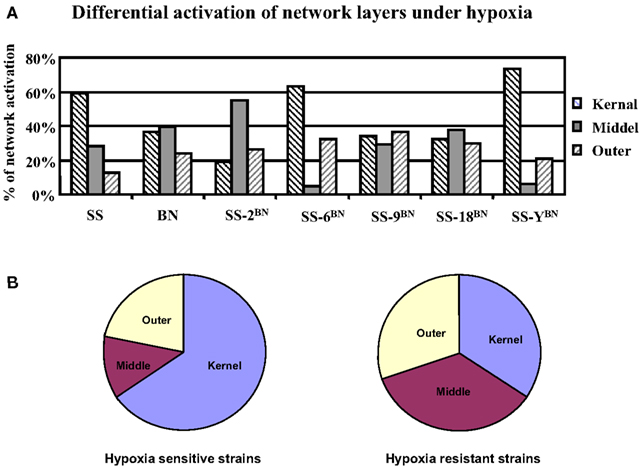
Figure 10. Differential activations of the core network layers under hypoxia in rats of different genetic backgrounds. (A) In SS and hypoxia sensitive CS strains (SS-6BN and SS-YBN), the kernel layer was predominantly activated. In BN and hypoxia-resistant strains (SS-9BN SS-18BN), more balanced core network activation among all three layers was observed. (B) This averaged network layer activation in hypoxia sensitive and resistant strains are summarized in a pie chart.
Discussion
The environmental stressor hypoxia is a critical contributor to cardiovascular diseases through its impact on blood pressure variability and cardiac function (Dumas et al., 2000). In this study, the resistance to hypoxia was used as a phenotypic trait to explore the effect of individual genetic background on physiology homeostasis. Rat has been the traditional model for the study of ventilatory response to hypoxia (Powell et al., 2000). Accompanied by its resolved genome and a broad base of supporting information regarding genetic polymorphism, rat represents a supreme model for the study of genetic background effect in respect to hypoxia (Twigger et al., 2008). Previous data showed that among the inbred rat strains, BN, but not SS, is robust against hypoxia (Hodges et al., 2002). Thus, the use of SS-BN CS rat panel provides a means to dissect the complexity of genome background by substituting individual BN chromosome into the genomic background of SS. Despite these concerted efforts, however, genes associated with specific chromosome-specific hypoxic response have not yet been reported.
In this scenarios, it has been previously reported that chromosome 13 and 18 of BN could exert protective effects against high-salt induced hypertension in SS (Stekiel et al., 2007; Liang et al., 2008; Gilibert et al., 2009). These authors showed that BN chromosome 13 has the effect to promote the normal vascular relaxation in cerebral arteries in the SS strain (Drenjancevic-Peric et al., 2005). This hypertension modifying effect of BN chromosome 13 was verified by another study employing proteomic methodology (Tian et al., 2008). However, In a follow-up report (Moreno et al., 2011), no genetic difference in the respective chromosome region between SS and BN rats could be found, that would alter the structure or function of any gene. On the other hand, these authors showed that two congenic strains can share significant pathway alteration in comparison to SS despite the lack of overlaps between congenic chromosomal segments (Lu et al., 2009). Although possible influences of non-coding regulatory regions were not taken into consideration, it still becomes apparent that such pathway alteration was not simply the result of polymorphism on substituted chromosome.
Taking another example, Munich Wistar Frömter (MWF) is an inbred rat strain (Sprague-Dawley) with high hypertensive predisposition, and age-dependent progressive albuminuria development. It has been documented that this trait is influenced by quantitative trait locus on chromosome 6 and 8 (Schulz et al., 2007; van Es et al., 2011). However, when the chromosome 6 of MWF was introduced into the hypertension-resistant HSR genetic background, it failed to induce the albuminuria phenotype even after nephron reduction (Schulz et al., 2010). This means that even if such trait-decisive QTL is valid, its proper action requires the complex assistance of a big part, if not the whole organism’s genetic background.
Based on my previous investigations (Mao et al., 2007, 2008), I hypothesize that “genetic polymorphisms” could act on disease susceptibility by affecting the balancing capacity of the cellular network. Thus, it is more important to identify the underlying regulatory network that constitute such system robustness (Liang et al., 2008). In order to further the hypothesis, I investigated data of CS rat strain platform produced from the SS-BN CS rat platform. On average, there is one SNP among every 1000 bp of sequences across the genome between BN and SS (Moreno et al., 2011). This wide spectrum of allelic variation between SS and BN potentially foster the organism’s hypoxia susceptibility. In the frame of PhysGen project, all 22 rat CS strains together with the parental strains were subjected to hypoxia treatment. Their differential resistances to hypoxia were measured by multiple phenotypic parameters of the biochemical, cardiac, lung, and renal categories. I analyzed the data from the PhysGen project by examining the physiology and transcriptome profiles of SS-BN CS rat platform. The aim of the current study was to, see how the allelic variability between individual genome at the level of a single chromosome is able to contribute to distinct phenotypes. Consensus to previous study, this phenotypic screening showed that the SS mice was much more susceptible to hypoxia compared to BN when exposed to hypoxic condition (Drenjancevic-Peric et al., 2005; Malek et al., 2006). This hypoxia sensitivity could be quantitatively indexed by at least 14 physiological traits.
Via a phenotype rescue analysis, the physiological data revealed a profound protective effect of BN chromosome 9 and 18 under hypoxic condition, whereas chromosome 6 and Y substitutions exacerbate the hypoxic effect. By this means, two hypoxia-resistant (SS-9BN and SS-18BN) and two hypoxia-susceptible CS strains (SS-6BN and SS-YBN) were confidently identified as those whose phenotype measurements segregate to either of the parental strains. This result is partially coherent to previous findings (Forster et al., 2003; Dwinell et al., 2005; Mattson et al., 2008). Contrary to my expectation, there was no biochemical alteration regarding either “plasma mean corpuscular hemoglobin content” or “plasma red blood cell” among parental strains or CS strains comparing hypoxia to normoxia condition. This indicates that the 2-week hypoxia treatment did not lead to constitutive change in red blood cell content, but rather represent temporary stress response.
Next, I set out to analyze the transcriptomic data on a selection of five rat CS strains with and without the hypoxia treatment. The central goal was to investigate the individual genetic network that may give rise to such personalized genetic background effect upon hypoxia (Tankersley and Broman, 2004; Dwinell et al., 2005). It was observed that hypoxia-induced very different gene expression changes depending on whether it is brought into the SS rat background or to CS backgrounds. At a first glance, the extents of gene expression alterations (transcriptomic shift) in the CS strains did not correlate to hypoxia sensitivity. Remarkably, although chromosome Y does not bear many genes, SS-YBN expressed the highest genetic background effects, as well as the highest hypoxia-induced transcriptomic shifts. The functional annotation of genes altered in SS-YBN suggests that this could be due to gender-associated immune and inflammatory secondary effects. In line with this, these secondary responses could have made SS-YBN especially vulnerable to hypoxia.
It is a conserved mechanism across the animal kingdom that hypoxia response is primarily orchestrated by the transcription regulation of hypoxia-inducible factor 1 (Hif1a, located on rat chromosome 6), which is known as a hypoxia master regulator (Teppema and Dahan, 2010). Upon hypoxia, Hif prolyl-hydroxylase, which utilizes oxygen as a co-substrate, is inhibited, thus leads to accumulation of Hif1-α protein. Stabilized by hypoxic condition, Hif1α in turn up-regulates several genes to promote survival in low-oxygen condition. This includes endogenous production of erythropoietin, glycolysis stimulation, and VEGF-mediated vascular growth (Powell, 2003). In comparison to SS, Hif1a expression level was slightly down-regulated in SS-9BN under normoxia, whereas no other alteration was observed in this gene throughout the whole transcriptomic dataset. Importantly, contrary to common expectation, SS-6BN, the CS strain with polymorphic Hif1a version from BN, represents one of the most hypoxia-susceptible CS strains in the whole CS panel.
Generally, “cis-regulatory effects” are defined as significant associations between the expression level of a given gene and the polymorphic sites within that gene region. On the other hand, “trans-regulatory effects” are defined as significant associations between the expression level of a gene and genetic modifiers not adjacent to that gene (Genissel et al., 2008). Regarding Hif1a, it seems that there was no clear-cut cis-effect operation. The effect of the master regulator effect of Hif1a, albeit strong, could have been submerged by the combined trans-chromosomal effect of the overall genetic background. Moreover, through the analysis on chromosome representation index, I made the observation that to some extent, cis-effect somewhat prevailed in genetic background effects (Set C genes), whereas trans-effect became dominant under hypoxia condition (Set B genes). This observation is partially consensus to previous reports (Schachter et al., 2005; Liang et al., 2008). Together, this and other findings showed that the expression profile variability under hypoxia was the result of the transactions of CS chromosome polymorphisms through complex interaction with polymorphisms distributed in the whole genome.
Overall, pathological phenotype results from perturbations of the cellular networks (Vidal et al., 2010). Constituted on this hypothesis, a core part of this study was a systems biology approach which allowed us to percept the fundamental principles of the underlying genetic network regulation. In another word, the aim was to decipher whether there is a category of genes acting in certain network constellation, that, under direct or indirect influence of polymorphisms, possibly act as a modifier of hypoxia response. Using an information theory based network modeling approach, the most parsimonious core genetic network under the current system stimulations was reverse engineered, though which the hypoxia response modifier effect could have been exerted. The functional annotation of the core genetic network comprise the general aspects of physiological homeostasis regulations such as energy metabolism, growth, development and death, cell localization, and communication, as well as response to stimuli.
According to the degree and interaction strength information, this core genetic interaction network could be loosely subdivided into three layers: the kernel layer, the middle layer, and the outer shell. Essentially, I made the observation that if a rat strain was sensitive to hypoxia, it showed predominant kernel activation under hypoxia. As such, hypoxia treatment in SS-6BN, SS-YBN, and SS induced predominantly gene expression alterations of the kernel layer. In contrast, upon hypoxia treatment, BN, SS-9BN, and SS-18BN launched a much balanced activation program of the core network with comparable number of nodes distributed in kernel, middle, and outer layers, respectively. Based on these findings, I advance the hypothesis here that the hypoxia resistance donated by BN chromosome 9 and 18 could be constituted on a more balanced activation of a core genetic network responsible for system homeostasis.
Of note that as an apparent constraint of the current study, differences in phenotype could as well be due to differences in the expression of regulatory and small RNA interactions in regulatory regions, which are not captured by microarray-based transcriptomic studies. In this respect, modern next-generation sequencing technique will provide even more comprehensive pictures. Moreover, I have chosen here to use data-driven de novo network modeling method make use of genetic co-regulation data. However, this brings about some main caveats of the current study: First, as a typical reductionism’s approach, such reverse engineering approach assumes that all the dependencies between variables are and only are due to the causal relationship contained inside of the network model (the so-called “guilty by association”). This denies any other possible latent causes, and thus could limit the predictive power of the current network model. In addition, it needs to be stated that in our network model, the underlying property of interaction could be very heterogeneous, spanning from cellular metabolic pathway, signaling pathway, or even of more general biophysical constraints (Mao et al., 2008). Such dynamic aspects of network interactions are not differentiated in the current study. However, “The power of such approach resides precisely in such simplification of molecular detail, which allows modeling at the scale of whole cells” (Vidal et al., 2010).
Conclusion
In summary, I studied the genetic interaction network structure underlying hypoxia responsiveness using an experimental design that involved a CS rat platform. Applying systems biological approach on the transcriptomic data, a core genetic network that might mediate the robustness to hypoxia was reverse engineered. From the functional perspective, this core genetic network is considerably involved in multiple physiological homeostasis regulations. Based on the observations regarding the differently activation of core network under different system perturbation, I conclude that the hypoxia-protective effect of polymorphisms on BN chromosome 9 and 18 is correlated with a balanced activation of the core network, thereby makes better use of the physiological homeostasis. Such personalized genetic network structure could represent a bridge between genetic background and the individualized development of multi-factorial diseases (Lu et al., 2009).
Conflict of Interest Statement
The author declares that the research was conducted in the absence of any commercial or financial relationships that could be construed as a potential conflict of interest.
Acknowledgments
The undertaken of this study was only possible due to generous data sharing of the PhysGen program with the whole scientific community. I heartily appreciate the fruitful communication with Professor Allen W. Cowley Jr., Dr. David L. Mattson, and Dr. Melinda R. Dwinell, Department of Physiology, Medical College of Wisconsin. I apologize for any potential misinterpretation of the experiments despite their never tiring consults regarding data structure and experimental design of the PhysGen project.
Supplementary Material
The Supplementary Material for this article can be found online at: http://www.frontiersin.org/Bioinformatics_and_Computational_Biology/10.3389/fgene.2012.00208/abstract
Table S1. Gene expression alterations in the SS-BN consomic rat panel (SS-2 BN, SS-6 BN, SS-9 BN, SS-18 BN, and SS-Y BN) under hypoxia treatment. Data were averaged across four tissues and both genders. Set A: SS_hypoxia vs. SS_normoxia; Set B: CS_hypoxia vs. CS_normaxia; Set C: CS_normoxia vs. SS_normoxia; Set D: CS_hypoxia vs. SS_hypoxia.
Table S2. Enriched Gene Ontology terms, KEGG pathways, gene set, and cytogenetic bands of protein expression alterations under different system conditions. The first number gives the number of genes belong to the given enriched term. Number in parenthesis indicates the multiple test adjusted p-value (Fisher’s exact Test).
Table S3. Structure of the hypoxia-associated genetic core network de novo generated by information theoretic network remodeling approach using the transcriptomic data. Node 1 and Node 2 are genes (indicated by gene symbol) that significantly co-regulate, and therefore potentially interact. The weight of interaction is given in the third column.
Abbreviations
BN, Brown Norway inbred rat strain; BP, biological process gene ontology term; CC, cellular component gene ontology term; CS, chromosome substitution (consomic) strain; EST, expressed sequence tag; FDR, false discovery rate; GO, gene ontology; GWAS, genome-wide association study; MF, molecular function gene ontology term; SS, Dahl salt-sensitive inbred rat strain; SS-nBN, SS rat consomic of BN chromosome n (n indicates the identity of substituted chromosome); VE, bodyweight normalized minute ventilation QTL, quantitative trait locus.
Footnotes
References
Adamcsek, B., Palla, G., Farkas, I. J., Derenyi, I., and Vicsek, T. (2006). CFinder: locating cliques and overlapping modules in biological networks. Bioinformatics 22, 1021–1023.
Beall, C. M., Blangero, J., Williams-Blangero, S., and Goldstein, M. C. (1994). Major gene for percent of oxygen saturation of arterial hemoglobin in Tibetan highlanders. Am. J. Phys. Anthropol. 95, 271–276.
Beall, C. M., Strohl, K. P., Blangero, J., Williams-Blangero, S., Decker, M. J., et al. (1997). Quantitative genetic analysis of arterial oxygen saturation in Tibetan highlanders. Hum. Biol. 69, 597–604.
Cai, Z., Xiao, F., Lee, B., Paul, I. A., and Rhodes, P. G. (1999). Prenatal hypoxia-ischemia alters expression and activity of nitric oxide synthase in the young rat brain and causes learning deficits. Brain Res. Bull. 49, 359–365.
Cover, T. M., and Thomas, J. A. (1991). Elements of Information Theory. New York: John Wiley and Sons.
Cowley, A. W. Jr., Roman, R. J., and Jacob, H. J. (2004). Application of chromosomal substitution techniques in gene-function discovery. J. Physiol. (Lond.) 554, 46–55.
Cowley, A. W. Jr., Roman, R. J., Kaldunski, M. L., Dumas, P., Dickhout, J. G., Greene, A. S., et al. (2001). Brown Norway chromosome 13 confers protection from high salt to consomic Dahl S rat. Hypertension 37, 456–461.
Dhadialla, P. S., Ohiorhenuan, I. E., Cohen, A., and Strickland, S. (2009). Maximum-entropy network analysis reveals a role for tumor necrosis factor in peripheral nerve development and function. Proc. Natl. Acad. Sci. U.S.A. 106, 12494–12499.
Drenjancevic-Peric, I., Phillips, S. A., Falck, J. R., and Lombard, J. H. (2005). Restoration of normal vascular relaxation mechanisms in cerebral arteries by chromosomal substitution in consomic SS.13BN rats. Am. J. Physiol. Heart Circ. Physiol. 289, H188–H195.
Dumas, P., Pausova, Z., Kren, V., Krenova, D., Pravenec, M., Dumont, M., et al. (2000). Contribution of autosomal loci and the Y chromosome to the stress response in rats. Hypertension 35, 568–573.
Dwinell, M. R., Forster, H. V., Petersen, J., Rider, A., Kunert, M. P., Cowley, A. W. Jr., et al. (2005). Genetic determinants on rat chromosome 6 modulate variation in the hypercapnic ventilatory response using consomic strains. J. Appl. Physiol. 98, 1630–1638.
Forster, H. V., Dwinell, M. R., Hodges, M. R., Brozoski, D., and Hogan, G. E. (2003). Do genes on rat chromosomes 9, 13, 16, 18, and 20 contribute to regulation of breathing? Respir. Physiol. Neurobiol. 135, 247–261.
Genissel, A., Mcintyre, L. M., Wayne, M. L., and Nuzhdin, S. V. (2008). Cis and trans regulatory effects contribute to natural variation in transcriptome of Drosophila melanogaster. Mol. Biol. Evol. 25, 101–110.
Gilibert, S., Bataillard, A., Nussberger, J., Sassard, J., and Kwitek, A. E. (2009). Implication of chromosome 13 on hypertension and associated disorders in Lyon hypertensive rats. J. Hypertens. 27, 1186–1193.
Hodges, M. R., Forster, H. V., Papanek, P. E., Dwinell, M. R., and Hogan, G. E. (2002). Ventilatory phenotypes among four strains of adult rats. J. Appl. Physiol. 93, 974–983.
Jobson, J. D. (1991). “Applied multivariate data analysis,” in Regression and Experimental Design, ed. S. E. Fienberg (New York: Springer), 425–429.
Kolar, F., Neckar, J., and Ostadal, B. (2005). MCC-134, a blocker of mitochondrial and opener of sarcolemmal ATP-sensitive K+ channels, abrogates cardioprotective effects of chronic hypoxia. Physiol. Res. 54, 467–471.
Kunert, M. P., Drenjancevic-Peric, I., Dwinell, M. R., Lombard, J. H., Cowley, A. W. Jr., Greene, A. S., et al. (2006). Consomic strategies to localize genomic regions related to vascular reactivity in the Dahl salt-sensitive rat. Physiol. Genomics 26, 218–225.
Lagrange, D., and Fournie, G. J. (2010). Generation of congenic and consomic rat strains. Methods Mol. Biol. 597, 243–266.
Lezon, T. R., Banavar, J. R., Cieplak, M., Maritan, A., and Fedoroff, N. V. (2006). Using the principle of entropy maximization to infer genetic interaction networks from gene expression patterns. Proc. Natl. Acad. Sci. U.S.A. 103, 19033–19038.
Liang, M., Briggs, A. G., Rute, E., Greene, A. S., and Cowley, A. W. Jr. (2003). Quantitative assessment of the importance of dye switching and biological replication in cDNA microarray studies. Physiol. Genomics 14, 199–207.
Liang, M., Cowley, A. W., and Greene, A. S. (2004). High throughput gene expression profiling: a molecular approach to integrative physiology. J. Physiol. (Lond.) 554, 22–30.
Liang, M., Lee, N. H., Wang, H., Greene, A. S., Kwitek, A. E., Kaldunski, M. L., et al. (2008). Molecular networks in Dahl salt-sensitive hypertension based on transcriptome analysis of a panel of consomic rats. Physiol. Genomics 34, 54–64.
Liang, M., Yuan, B., Rute, E., Greene, A. S., Zou, A. P., Soares, P., et al. (2002). Renal medullary genes in salt-sensitive hypertension: a chromosomal substitution and cDNA microarray study. Physiol. Genomics 8, 139–149.
Lu, L., Li, P., Yang, C., Kurth, T., Misale, M., Skelton, M., et al. (2009). Dynamic convergence and divergence of renal genomic and biological pathways in protection from Dahl salt-sensitive hypertension. Physiol. Genomics 41, 63–70.
Malek, R. L., Wang, H. Y., Kwitek, A. E., Greene, A. S., Bhagabati, N., Borchardt, G., et al. (2006). Physiogenomic resources for rat models of heart, lung and blood disorders. Nat. Genet. 38, 234–239.
Mao, L., De Cegli, R., Lauria, M., Nebrich, G., Delabar, J. M., Herault, Y., et al. (2011). “Tracking the structure of protein interaction network via multiple genetic perturbations on mouse embryonic stem cells – implementation of the entropy maximization principle,” in Embryonic Stem Cells ed. C. Atwood (Wien: InTech Open Access Publisher), 367–380.
Mao, L., Hartl, D., Nolden, T., Koppelstatter, A., Klose, J., Himmelbauer, H., et al. (2008). Pronounced alterations of cellular metabolism and structure due to hyper- or hypo-osmosis. J. Proteome Res. 7, 3968–3983.
Mao, L., Zabel, C., Herrmann, M., Nolden, T., Mertes, F., Magnol, L., et al. (2007). Proteomic shifts in embryonic stem cells with gene dose modifications suggest the presence of balancer proteins in protein regulatory networks. PLoS ONE 2, e1218. doi:10.1371/journal.pone.0001218
Margolin, A. A., Nemenman, I., Basso, K., Wiggins, C., Stolovitzky, G., Dalla Favera, R., et al. (2006). ARACNE: an algorithm for the reconstruction of gene regulatory networks in a mammalian cellular context. BMC Bioinformatics 7(Suppl. 1), S7.
Mattson, D. L., Dwinell, M. R., Greene, A. S., Kwitek, A. E., Roman, R. J., Jacob, H. J., et al. (2008). Chromosome substitution reveals the genetic basis of Dahl salt-sensitive hypertension and renal disease. Am. J. Physiol. Renal Physiol. 295, F837–F842.
Milenkovic, T., Lai, J., and Przulj, N. (2008). GraphCrunch: a tool for large network analyses. BMC Bioinformatics 9, 70. doi:10.1186/1471-2105-9-70
Moreno, C., Williams, J. M., Lu, L., Liang, M., Lazar, J., Jacob, H. J., et al. (2011). Narrowing a region on rat chromosome 13 that protects against hypertension in Dahl SS-13BN congenic strains. Am. J. Physiol. Heart Circ. Physiol. 300, H1530–H1535.
Powell, F. L. (2003). Functional genomics and the comparative physiology of hypoxia. Annu. Rev. Physiol. 65, 203–230.
Powell, F. L., Huey, K. A., and Dwinell, M. R. (2000). Central nervous system mechanisms of ventilatory acclimatization to hypoxia. Respir. Physiol. 121, 223–236.
Schachter, A. D., Ichimura, T., and Kohane, I. S. (2005). Chromosomes 18 and X are quantitative trait loci for nephrotic-range proteinuria in rats. Pediatr. Nephrol. 20, 1717–1723.
Schulz, A., Schutten, S., Schulte, L., Kossmehl, P., Nyengaard, J. R., Vetter, R., et al. (2010). Genetic locus on MWF rat chromosome 6 affects kidney damage in response to L-NAME treatment in spontaneously hypertensive rats. Physiol. Genomics 42, 126–133.
Schulz, A., Weiss, J., Schlesener, M., Hansch, J., Wehland, M., Wendt, N., et al. (2007). Development of overt proteinuria in the Munich Wistar Fromter rat is suppressed by replacement of chromosome 6 in a consomic rat strain. J. Am. Soc. Nephrol. 18, 113–121.
Shannon, P., Markiel, A., Ozier, O., Baliga, N. S., Wang, J. T., Ramage, D., et al. (2003). Cytoscape: a software environment for integrated models of biomolecular interaction networks. Genome Res. 13, 2498–2504.
Stekiel, T. A., Weber, C. A., Contney, S. J., and Bosnjak, Z. J. (2007). Differences in cardiovascular sensitivity to propofol in a chromosome substitution rat model. Croat. Med. J. 48, 312–318.
Tankersley, C. G., and Broman, K. W. (2004). Interactions in hypoxic and hypercapnic breathing are genetically linked to mouse chromosomes 1 and 5. J. Appl. Physiol. 97, 77–84.
Teppema, L. J., and Dahan, A. (2010). The ventilatory response to hypoxia in mammals: mechanisms, measurement, and analysis. Physiol. Rev. 90, 675–754.
Teppema, L. J., Van Dorp, E. L., and Dahan, A. (2009). Arterial [H+] and the ventilatory response to hypoxia in humans: influence of acetazolamide-induced metabolic acidosis. Am. J. Physiol. Lung Cell Mol. Physiol. 298, L89–L95.
Tian, Z., Greene, A. S., Usa, K., Matus, I. R., Bauwens, J., Pietrusz, J. L., et al. (2008). Renal regional proteomes in young Dahl salt-sensitive rats. Hypertension 51, 899–904.
Todd, J. A., and Wicker, L. S. (2001). Genetic protection from the inflammatory disease type 1 diabetes in humans and animal models. Immunity 15, 387–395.
Twigger, S. N., Pruitt, K. D., Fernandez-Suarez, X. M., Karolchik, D., Worley, K. C., Maglott, D. R., et al. (2008). What everybody should know about the rat genome and its online resources. Nat. Genet. 40, 523–527.
van Es, N., Schulz, A., Ijpelaar, D., Van Der Wal, A., Kuhn, K., Schutten, S., et al. (2011). Elimination of severe albuminuria in aging hypertensive rats by exchange of 2 chromosomes in double-consomic rats. Hypertension 58, 219–224.
Vidal, M., Cusick, M. E., and Barabasi, A. L. (2010). Interactome networks and human disease. Cell 144, 986–998.
Weiss, K. M., and Terwilliger, J. D. (2000). How many diseases does it take to map a gene with SNPs? Nat. Genet. 26, 151–157.
Keywords: personalized medicine, systems biology, consomic, hypoxia, homeostasis, network robustness
Citation: Mao L (2012) Genetic background specific hypoxia resistance in rat is correlated with balanced activation of a cross-chromosomal genetic network centering on physiological homeostasis. Front. Gene. 3:208. doi: 10.3389/fgene.2012.00208
Received: 21 August 2012; Accepted: 25 September 2012;
Published online: 15 October 2012.
Edited by:
Peng Jiang, University of Iowa, USACopyright: © 2012 Mao. This is an open-access article distributed under the terms of the Creative Commons Attribution License, which permits use, distribution and reproduction in other forums, provided the original authors and source are credited and subject to any copyright notices concerning any third-party graphics etc.
*Correspondence: Lei Mao, Institute for Medical Genetics and Human Genetics, Charité-Universitätsmedizin Berlin, Augustenburger Platz 1, D-13353 Berlin, Germany. e-mail:bGVpLm1hb0BjaGFyaXRlLmRl