 Matthew C. McClure1*
 Tad S. Sonstegard1
 George R. Wiggans2
 Alison L. Van Eenennaam3
 Kristina L. Weber3 Cecilia T. Penedo4
 Donagh P. Berry5 John Flynn6
 Jose F. Garcia7 Adriana S. Carmo8 Luciana C. A. Regitano9 Milla Albuquerque10 Marcos V. G. B. Silva11
 Marco A. Machado11 Mike Coffey12 Kirsty Moore12 Marie-Yvonne Boscher13 Lucie Genestout13 Raffaele Mazza14
 Jeremy F. Taylor15 Robert D. Schnabel15 Barry Simpson16 Elisa Marques16 John C. McEwan17 Andrew Cromie18 Luiz L. Coutinho19 Larry A. Kuehn20 John W. Keele20
 Emily K. Piper21
 Jim Cook22 Robert Williams23 Bovine HapMap Consortium Curtis P. Van Tassell1
- 1Bovine Functional Genomics Laboratory, BARC, Agriculture Research Service, United States Department of Agriculture, Beltsville, MD, USA
- 2Animal Improvement Programs Laboratory, BARC, Agriculture Research Service, United States Department of Agriculture, Beltsville, MD, USA
- 3Department of Animal Science, University of California-Davis, Davis, CA, USA
- 4Veterinary Genetics Laboratory, School of Veterinary Medicine, University of California-Davis, Davis, CA, USA
- 5Animal and Bioscience Research Department, Animal and Grassland Research and Innovation Centre, Teagasc, Moorepark, Ireland
- 6Weatherbys DNA Laboratory, Kildare, Ireland
- 7Sao Paulo State University/UNESP, Aracatuba, Brazil
- 8Deoxi Biotecnologia, Araçatuba, Brazil
- 9Embrapa Pecuária Sudeste, São Carlos, Brazil
- 10Department of Animal Science, College of Agriculture, University of Sao Paulo, Piracicaba, Brazil
- 11Embrapa Gado de Leite, Juiz de Fora, Brazil
- 12Animal and Veterinary Science, SRUC, Midlothian, Scotland
- 13LABOGENA, Jouy-en-Josas, France
- 14Coordinatore Laboratorio Genetica e Servizi, Associazione Italiana Allevatori - Italian Breeders Association, Roma, Italy
- 15Division of Animal Science, University of Missouri-Columbia, Columbia, MO, USA
- 16GeneSeek, Neogen Company, Lincoln, NE, USA
- 17AgResearch, Invermay Agricultural Centre, Mosgiel, New Zealand
- 18Irish Cattle Breeding Federation, Bandon, Ireland
- 19ESALQ – USP, Piracicaba, SP, Brazil
- 20Genetics, Breeding, and Animal Health Research Unit, U.S. Meat Animal Research Center, USDA-ARS, Clay Center, NE, USA
- 21Animal Genetics Laboratory, School of Veterinary Science, The University of Queensland, Gatton, QLD, Australia
- 22Animal Genetics and Breeding Unit, University of New England, Armidale, NSW, Australia
- 23American-International Charolais Association, Kansas City, MO, USA
To assist cattle producers transition from microsatellite (MS) to single nucleotide polymorphism (SNP) genotyping for parental verification we previously devised an effective and inexpensive method to impute MS alleles from SNP haplotypes. While the reported method was verified with only a limited data set (N = 479) from Brown Swiss, Guernsey, Holstein, and Jersey cattle, some of the MS-SNP haplotype associations were concordant across these phylogenetically diverse breeds. This implied that some haplotypes predate modern breed formation and remain in strong linkage disequilibrium. To expand the utility of MS allele imputation across breeds, MS and SNP data from more than 8000 animals representing 39 breeds (Bos taurus and B. indicus) were used to predict 9410 SNP haplotypes, incorporating an average of 73 SNPs per haplotype, for which alleles from 12 MS markers could be accurately be imputed. Approximately 25% of the MS-SNP haplotypes were present in multiple breeds (N = 2 to 36 breeds). These shared haplotypes allowed for MS imputation in breeds that were not represented in the reference population with only a small increase in Mendelian inheritance inconsistancies. Our reported reference haplotypes can be used for any cattle breed and the reported methods can be applied to any species to aid the transition from MS to SNP genetic markers. While ~91% of the animals with imputed alleles for 12 MS markers had ≤1 Mendelian inheritance conflicts with their parents' reported MS genotypes, this figure was 96% for our reference animals, indicating potential errors in the reported MS genotypes. The workflow we suggest autocorrects for genotyping errors and rare haplotypes, by MS genotyping animals whose imputed MS alleles fail parentage verification, and then incorporating those animals into the reference dataset.
Introduction
Single nucleotide polymorphism (SNP) are preferred to microsatellite (MS) markers for parentage verification and genomic selection due to their higher genotyping accuracies, speed of genotyping, lower overall cost per genotype, and ease of automation. While SNP genotypes per animal (N = 3000 to > 7,70,000) assayed on Illumina platforms are routinely > 99% for call rate and concordance (McClure et al., 2009; Rincon et al., 2011), individual MS are known to have a 1–5% genotyping error rate (Baruch and Weller, 2008). When individual genetic markers each have an error rate of 1%, the probability of having at least 1 genotype error in an individual genotyped for 11 MS markers is >10% (Weller et al., 2006). Also, we have observed that single nucleotide insertions or deletions within the amplified MS region can result in the rounding up or down of the called MS allele fragment size resulting in a 2 bp difference in the reported allele size. Therefore, the high inherent chance of genotyping errors has led several studies to suggest that 2 MS marker conflicts must exist for an animal to be excluded in parentage verification (Bonin et al., 2004; Weller et al., 2004; Baruch and Weller, 2008). In a comparison of a bovine parentage MS panel vs. a 32 SNP parentage panel (Heaton et al., 2002) employed for sire discovery for 287 calves from US beef and dairy farms, the SNP panel routinely outperformed the MS panel with the SNP panel assigning a sire at 100% probability 81.9% of the time vs. 38.3% of the time for the MS panel (Stewart Bauck, GeneSeek a Neogen Company, Pers. Commun. 3/10/2013). Recent work by Fernández et al. (2013) showed that even in a Brazilian inbred Angus herd that only 24 SNP were needed to obtain the equivalent matching probability (MP) for parental verification as 18 microsatellites. Similarly, 43 SNP provided 2–4 orders of magnitude grater MP than 11 MS in 6 Northern Ireland cattle breeds (Aberdeen Angus, Belgian Blue, Charolais, Holstein, Limousin, and Simmental) (Allen et al., 2010).
SNP technology is not only used in numerically large breeds, such as Holstein and Angus, but also by numerically mid-size and small breeds for the identification of genetic disease carriers and for genomic selection. Recently, it has also become more practical and cost effective to use SNP-based tools for parentage verification. Some cattle breed associations, such as the US Jersey Association have begun to solely use SNPs for parentage verification. However, most breeds are just beginning the transition from MS to SNP markers. Traditionally, when a livestock industry transitions to a new technology for parentage verification, the additional cost of re-genotyping the transition generation(s) with the newer technology is absorbed by the producer or breed association. In an effort to reduce the cost of SNP technology adoption across cattle breeds, we initially developed a method to impute MS alleles from dense SNP genotypes (McClure et al., 2012). Our initial report in 4 dairy breeds (Holstein, Brown Swiss, Jersey, and Guernsey) found that 17% of the SNP-MS haplotypes were preserved across 2–4 of the studied breeds, suggesting that while many haplotypes are breed specific, some are present in phylogenetically distant breeds, possibly because they are identical by descent (IBD) from the common breed ancestor.
The objective of this study was to develop a SNP-MS haplotype reference panel set that could be used globally across the majority of commercial Bos taurus breeds and the major B. indicus breeds. An additional objective was to provide a data set and workflow so that any lab or service provider could implement our results for the benefit of the world-wide cattle community.
Materials and Methods
Genotypes
Twenty-five groups, representing government, academic, and DNA service providers from the North American, South American, European, and Australian continents, including the International Bovine HapMap Project (International Bovine Hapmap Consortium, 2006) provided MS and partial Illumina BovineHD (Illumina Inc., 2010) (Illumina Inc., San Diego, CA, USA) genotypes on 16,564 animals representing 51 breeds plus 135 B. taurus crossbred animals (Table 1). All animals that were registered with their respective breed associations have accurate pedigree information which was available to this project. The provided genotypes were for SNP located within 500 kb (N = 3732) of 12 MS markers (BM1818, BM1824, BM2113, ETH3, ETH10, ETH225, INRA023, SPS115, TGLA53, TGLA122, TGLA126, TGLA227). These 12 MS loci comprise the International Society of Animal Genetics' (ISAG) recommended bovine parentage markers (http://www.isag.us/Docs/CattleMMPTest_CT.pdf) for inclusion in test panels used by service laboratories. All SNP data were captured and output in Illumina AB format. Genotypes for the ISAG-sanctioned MS bovine panel on the individuals and/or their parents were obtained from > 30 breed associations or their corresponding authorized data repositories. These MS genotypes were generated by multiple labs including GeneSeek (Lincoln, NE), MetaMorphix Inc. (Davis, CA), Maxxam (Mississauga, ON, Canada), UC Davis Veterinary Genetics Lab (Davis, CA), Zoetis (Kalamazoo, MI), Weatherbys DNA Laboratory (Kildare, Ireland), and Deoxi Biotecnologia (Araçatuba, São Paulo, Brazil), and LABOGENA (Jouy-en-Josas, France). Selected HapMap project individuals from less conventional or popular U.S. breeds were MS genotyped at UC-Davis Veterinary Genetics Lab, and Brahman individuals were MS genotyped by Zoetis according to ISAG genotyping standards.
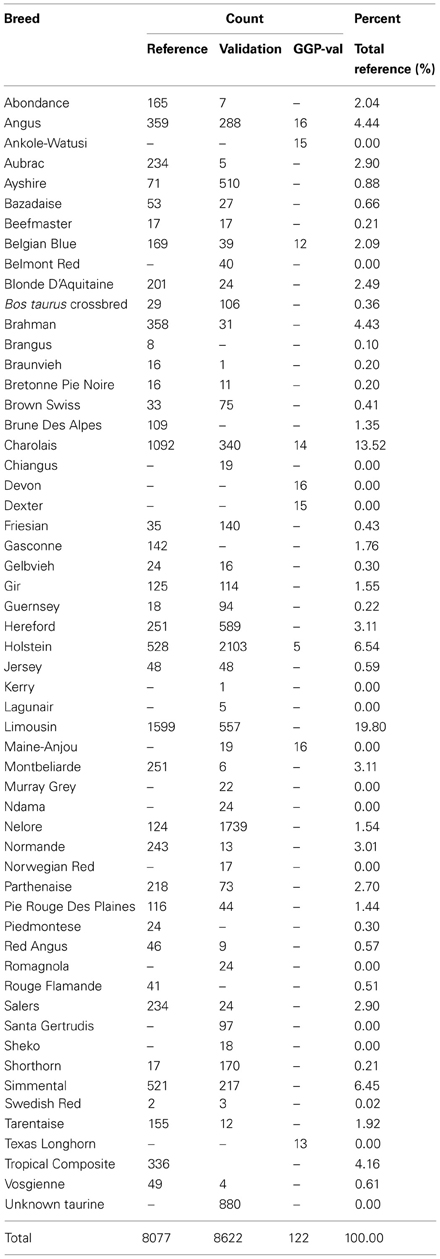
Table 1. Sample breed counts.
From these MS and SNP genotypes, two populations were generated (Table 1). The reference population contained 8077 individuals from 39 breeds as well as 29 B. taurus crossbred animals with both MS and SNP genotypes. Seven to 12 (average of 9) MS genotype records were provided for each animal in the reference population, resulting in each MS having 2403–8031 genotyped individuals in this group (Table 2). The validation population was based on animals with only SNP data and contained 8622 animals representing 45 breeds and 106 B. taurus crossbred animals. MS genotypes on 1301 of the validation animals' parents, mainly sires, were also available for the evaluation of imputation accuracy. Only 89 validation animals had a parent present in the reference population. Both populations contained B. taurus and B. indicus purebreds and composite animals. BEAGLE (Browning and Browning, 2007) was used to impute the <2% of missing SNP genotypes in the reference and validation population. This step was considered robust based on previous reports where SNP genotypes were imputed with >95% accuracy with only a few hundred reference animals (Pausch et al., 2013) and with 98–99% accuracy in multi-breed reference populations (Larmer et al., 2010).
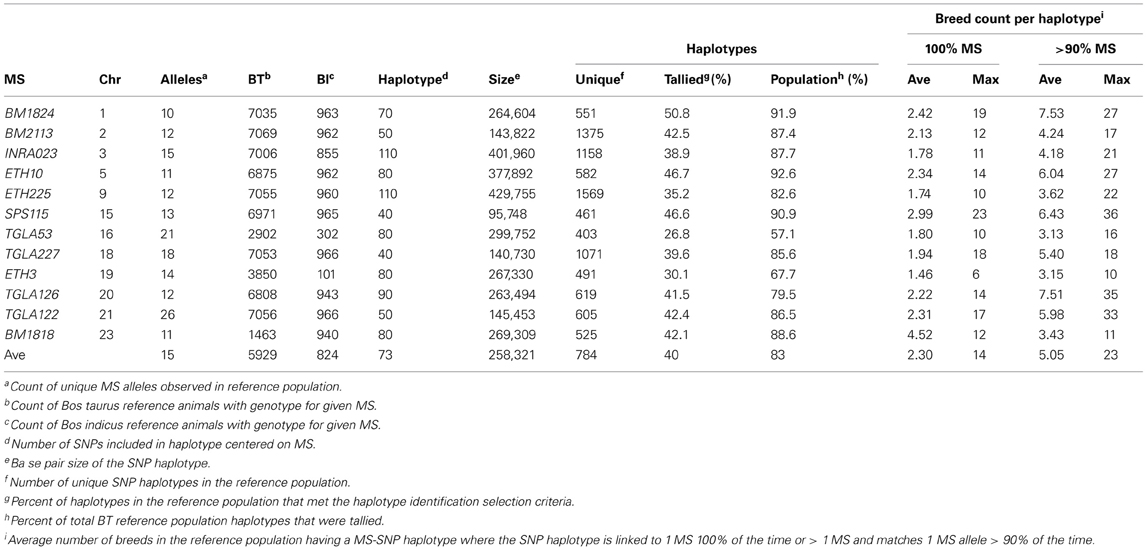
Table 2. Microsatellite (MS) imputation haplotype information.
A separate validation population (GGP-val) comprising of 122 animals from 9 breeds (Angus, Ankole-Watusi, Belgian Blue, Charolais, Devon, Dexter, Holstein, Maine-Anjou, and Texas Longhorn) was assembled to test MS imputation from the GGP-LD (GeneSeek Genomic Profiler Low Density) Beadchip (Neogen Corporation, 2012). While the GGP-LD contains ~80% of the original MS imputation SNP reported in McClure et al. (2012) these SNP genotypes were not imputed to the higher SNP density available in the reference population. These animals were also genotyped for the 12 MS at UC-Davis Veterinary Genetics lab.
Haplotype Estimation
BEAGLE input files for the reference population were created for each MS marker and flanking SNP within 500 kb. Animals were filtered on their MS genotypes so that for each MS the BEAGLE file contained only individuals with a MS genotype, thus 12 files were generated ranging from 2403 to 8031 animals (Table 2). All reference individuals were phased together using BEAGLE with 100 iterations. Williams et al., 2012 observed that phasing human ethnic groups together instead of separately resulted in increased phasing accuracy, as long as a single cohort did not dominate the dataset (>80% of the total population). Our reference population was fairly evenly distributed (Table 1) and each breed represented an average of 2.5% of the total population with only 2 breeds representing over 10% (Charolais at 13.5% and Limousin at 19.8%).
SNP haplotypes for MS imputation were identified using a similar process as reported in McClure et al. (2012). Optimal haplotype size for MS imputation was determined by analysing phased haplotypes, centered on the MS, using sliding windows that increased in size (10–20 flanking SNP increments). The number of unique reference population haplotypes that were linked to 1 MS allele 100% of the time and the number of haplotypes that were linked to >1 MS alleles but matched 1 MS allele ≥90% of the time were tallied. The optimal haplotype size was determined when either of the following criteria was met:
- The maximum number of unique haplotypes appearing ≥4 times and linked to only 1 MS allele 100% of the time or linked to 1 MS allele ≥905 of the time across all breeds was obtained.
- Increasing the haplotype size by 10 SNP resulted in ≤ 1% increase in the total number of tallied haplotypes.
Imputation Reference Population Creation
Two MS-SNP haplotype imputation reference populations were created from the full reference population using the optimal SNP haplotype size for each MS (Table 2). The B. taurus reference (BT-ref) population contained BT and BT crossbred animals with MS and SNP genotypes. The B. taurus + B. indicus imputation reference (BT + BI-ref) population contained BT, BT crossbred, and BI animals with MS genotypes and SNP genotypes. Each imputation reference population was then phased independently in BEAGLE as before.
Microsatellite Imputation
Two validation subpopulations, BT-val and BT + BI-val, were created from the validation population in the same manner as the imputation reference populations. Imputation was performed using either the 880 minimum SNP (min) panel (Table S1) from the optimal haplotype sizes identified above or all 3732 SNP within 500 kb of a MS marker (1 Mb). MS were imputed in BEAGLE using 11 different strategies:
- BT-val, BT-ref, min, 20
- BT-val, BT-ref, min, 100
- BT-val, BT-ref, 1 Mb, 20
- BT-val, BT + BI-ref, min, 20
- BT-val, BT + BI-ref, min, 100
- BT + BI-val, BT + BI-ref, min, 20
- BT + BI-val, BT + BI-ref, min, 100
- GGP-val, BT-ref, min, 20
- GGP-val, BT-ref, min, 100
- GGP-val, BT + BI-ref, min, 20
- GGP-val, BT + BI-ref, min, 100
where the first, second, third and fourth term represent: validation population, reference population, SNP panel used, number of BEAGLE iterations.
Mendelian Inheritance Conflicts of Microsatellite Alleles
For the 1301 validation population animals with submitted parental MS genotypes submitted, the animal's BEAGLE-imputed MS alleles were checked for Mendelian inheritance consistency against the MS genotype of its parents. Mendelian inheritance verification was also evaluated for 3457 reference population animals that had individual and parental MS genotypes submitted by the breed associations. An ANOVA was performed to determine statistical differences between the Mendelian consistencies of BT-val imputed MS and BT-ref reported MS genotypes, and between the different MS imputation parameter combinations. For the 122 GGP-val genotyped animals the concordance between their imputed and reported MS genotypes was determined. Both imputed MS alleles had to match the reported MS alleles to be considered concordant.
Results
MS Haplotype Imputation
The number of SNP used for haplotype imputation for each MS ranged from 40 to 110 (average 73), with 83.16% of the reference population haplotypes being linked to only 1 MS allele 100% of the time or 1 MS allele ≥ 90% of the time across all breeds (Table S2). Less than 6% of the SNP haplotypes were associated with >1 MS allele and when this occurred, the other MS alleles were often within 2 bp of the most commonly associated allele (Table S3). These associations are potentially caused by a combination of rare haplotypes and MS genotyping errors, insertions and deletions within the amplified MS region that caused a rounding up or down of the called MS allele fragment size, or SNP haplotypes present in multiple breeds that are associated with multiple MS alleles in each breed due to recombination. On average, a haplotype that was associated with only 1 MS allele 100% of the time was present in 2.3 breeds with some such haplotypes being common across up to 23 breeds. For haplotypes that were associated with >1 MS allele, the most common MS allele was present in an average of ~7 breeds with a maximum of 36 breeds (Table 2). The distribution of MS-SNP haplotypes present in ≥1 breed across the whole reference population is shown in Figure 1. The large number of MS-SNP haplotypes observed only once or twice within the reference population are considered rare MS-SNP haplotypes (Table S3). While the majority of the MS-SNP haplotypes, 74.5%, were bred specific, the occurrence of 25.5% of the MS-SNP haplotypes being observed 2–36 breeds indicates that MS haplotype data from one breed can be informative for the imputation of MS alleles in other breeds.
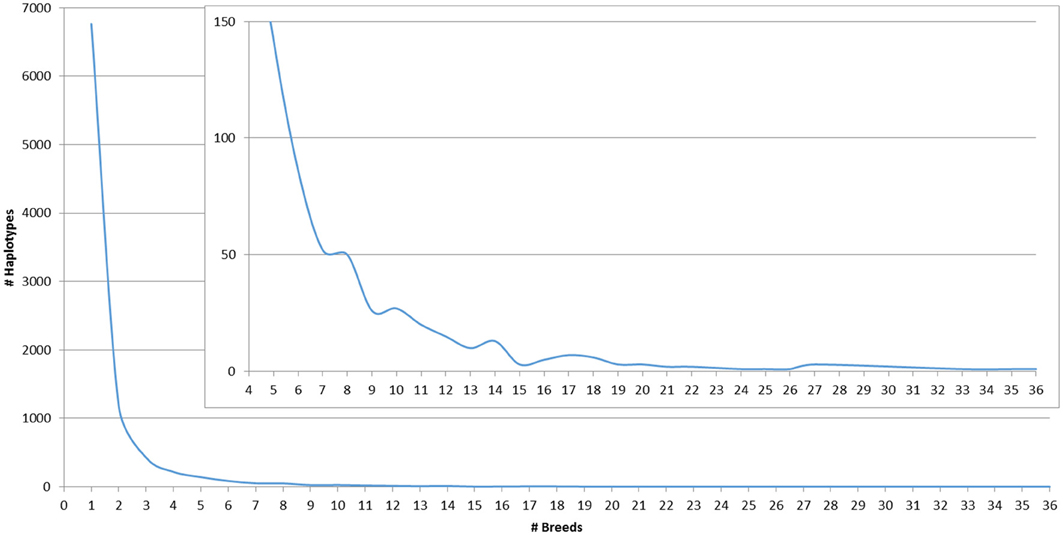
Figure 1. Count of MS-SNP haplotypes present in at least one breed across the whole reference population.
Imputation Accuracies
The concordance between imputed and reported MS for the GGP-val animals averaged 72.05% in the B. taurus breeds when either the BT or BT × BI reference populations were used. MS concordance in the breeds with indicine ancestry such as Texas Longhorn and the Ankole-Watusi (Reist-Marti et al., 2003; McTavish et al., 2013) was greater when the BT × BI ref was used (concordance = 54.42% and 55.00%, respectively) compared to when only the BT-ref was used (concordance = 43.27% and 30.28%, respectively) (Table 3).
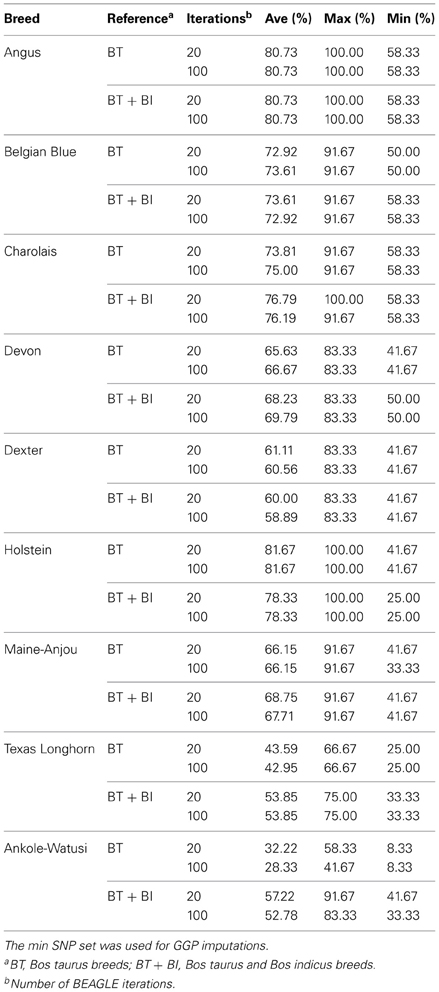
Table 3. Microsatellite genotype concordance accuracies for animals with microsatellite alleles imputed from GGP-LD SNP.
While the parameters used for MS imputation: reference population, SNP haplotype size, or number of imputation cycles had no statistical effect (P > 0.98) on the Mendelian inheritance conflicts of the imputed MS (Table 4), the average computing time required for the different parameters combinations differed greatly, ranging from under 1 min to over 3 h per MS (Table 5). A statistical difference (P ≤ 0.04) existed between the Mendelian inheritance consistencies of BT-val imputed MS (average 95.3%) and BT-ref reported MS (average 97.8%) (Table 4). On average, 68.09% of the 1291 BT-val animals with imputed MS had no Mendelian inheritance conflicts with their parents' MS genotype, 22.83% had only 1 conflict, 4.95% had only 2 conflicts and 4.13% had >2 conflicts. In comparison, the 3457 reference animals with parental MS data had 85.25% with no conflicts, 10.65% with 1 conflict, 2.34% with 2 conflicts, and 1.76% with >2 conflicts (Table 6). There was variability in the average Mendelian inheritance accuracy of imputed MS among breed and MS in the validation population with an average breed accuracy of 94% across all imputation strategies (Table 6).
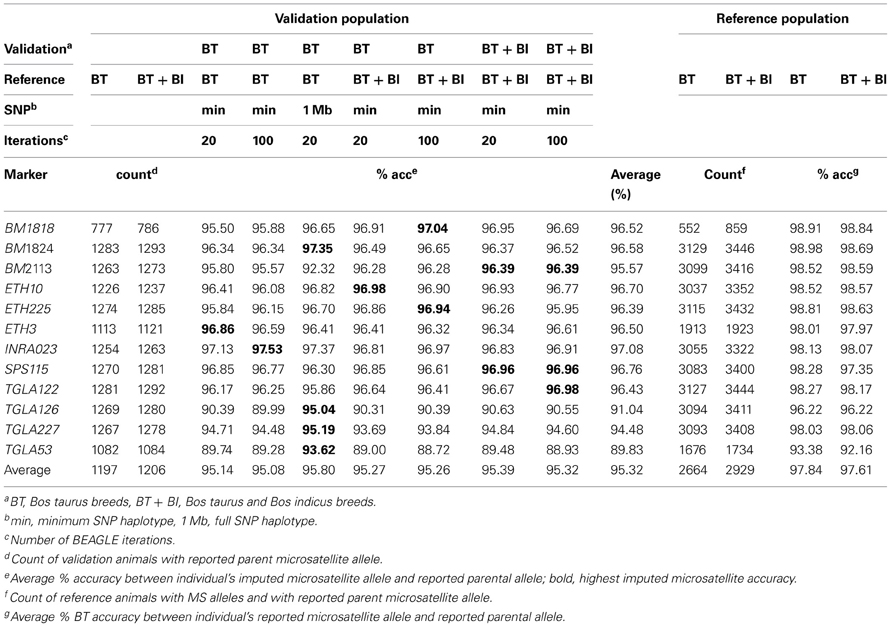
Table 4. Mendelian inheritance accuracy by microsatellite and imputation strategy.
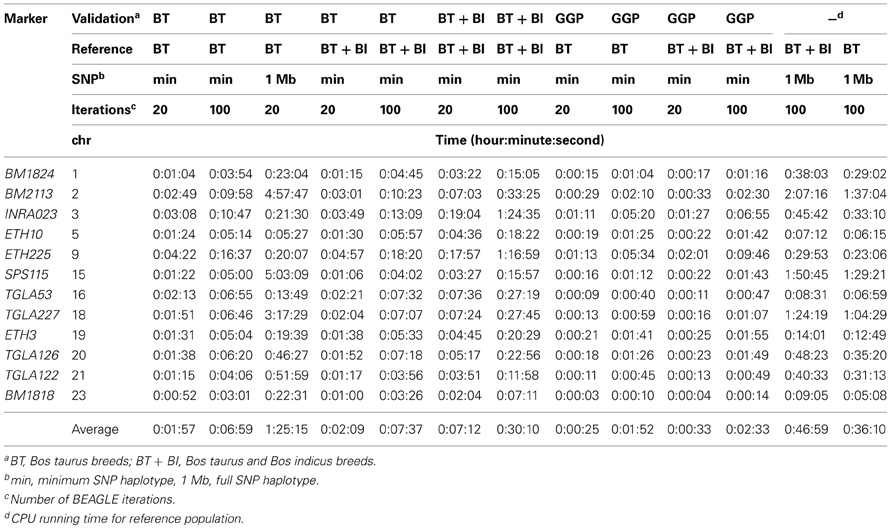
Table 5. BEAGLE running time for reference and validation populations.
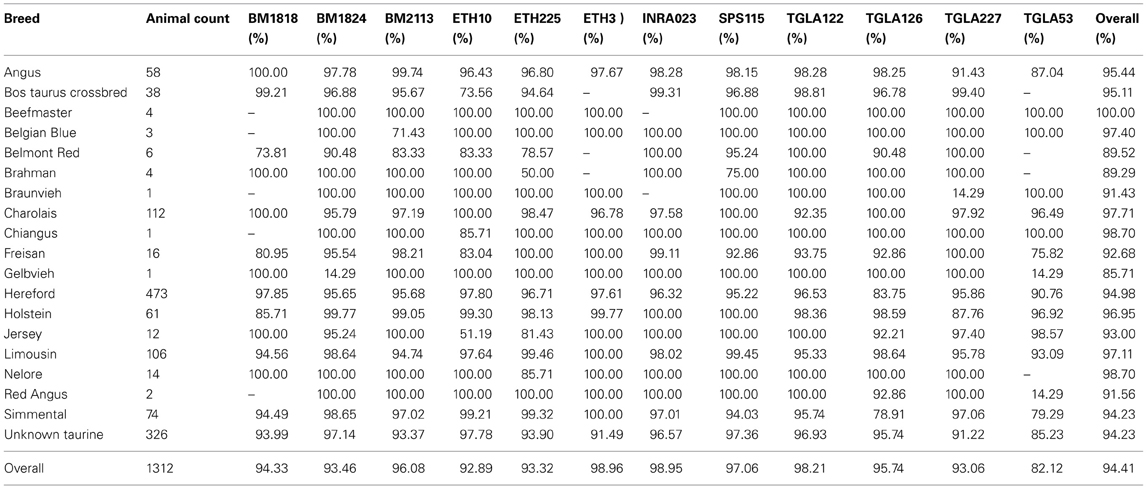
Table 6. Average Mendelian inheritance accuracy by microsatellite and breed across all imputation strategies.
For the 25 BT-val animals with a parent in the reference population and a MS conflict, if the matching SNP haplotypes are taken into consideration, 17 have 100% parent verification. Only 7 animals had 1 haplotype conflict (i.e., 1 MS conflict) and one animal had 2 haplotype conflicts. Taking the matching SNP haplotypes into consideration means that for the 89 validation animals with a parent in the reference population, 91% have no MS or SNP haplotype conflicts, 98.88% have ≤1 conflict and 100% have ≤2 conflicts. These conflict statistics are higher than the MS parent verification statistics for the BT- ref animals in Table 7.
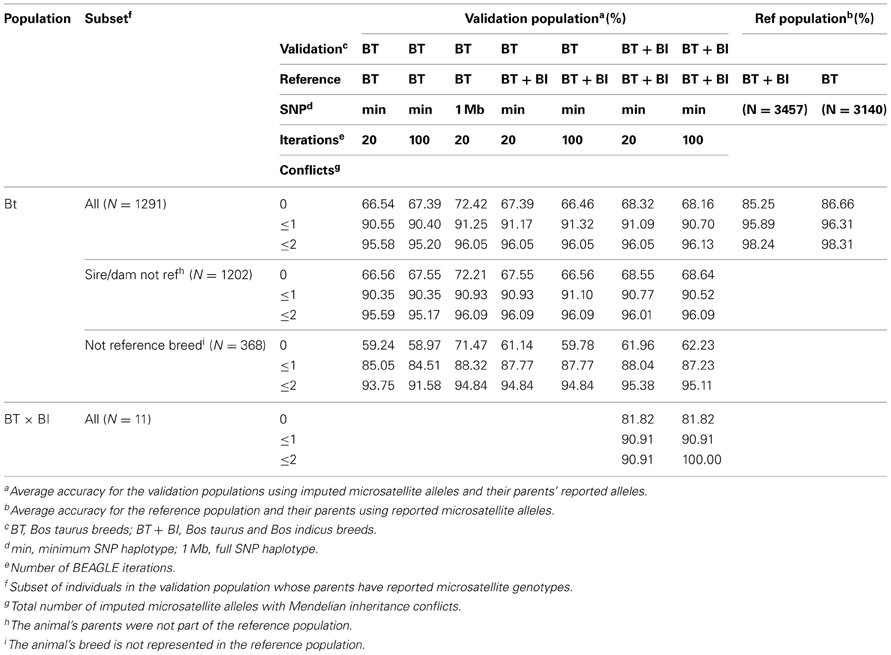
Table 7. Average Mendelian inheritance accuracy for different imputation methods.
Discussion
Imputation accuracy did not statistically differ among the combinations of imputation parameters, although the CPU time required for imputation was much greater when all SNPs flanking 500 kb each side of the MS were included in the imputation process compared to when the most parsimonious number of flanking SNPs were used (Tables 4, 5, 7). While the imputed MS alleles showed greater Mendelian inheritance conflicts than the reported MS alleles did, this was expected as previous research has documented that MS marker genotypes themselves have a 1–5% error rate and only 85% of the reference animals had no parentage MS conflicts.
An analysis of the SNP haplotypes for the 25 BT-val animals with Mendelian inheritance conflicts and with sires in the BT-ref population indicated that many of their SNP haplotypes were not in conflict (Table S4). In these cases, the sire haplotype may have harbored a mis-scored MS allele. For instance, Table S4 (Tab TGLA126) shows the TGLA126 SNP haplotypes for Simmental-679 and its sire (Simmental-334), the imputed MS genotypes for Simmental-679 (123/115) were in conflict with its sire's reported genotype (117/117), even though both animals share a common haplotype. When the shared SNP haplotype was examined in Table S3 (Tab chr20-TGLA126, column UP) the most common MS allele observed for this haplotype is 123. The haplotype was associated with the 123 allele 937 times (99.68%) across 17 breeds and the 117 allele only once (0.11%). While it is possible that the sire's reported MS genotype is correct, it appears to be more likely that the sire's genotype was incorrectly scored. This 0.11% error rate is within reported MS error rates found in literature (Baruch and Weller, 2008). Of note, the other TGLA126 SNP haplotype for this sire was associated with the 117 allele 301 times (88.79%) across 11 breeds (Table S3, tab chr20-TGLA126, column VI). It is possible that when this animal was genotyped the 123 allele failed to PCR amplify, amplified too weakly to be called, or simply failed to be called, such that the animal was genotyped as 117 homozygote, instead of 117/123.
Recommendations
The optimized SNP haplotypes reported here and the reference population data represent a robust standard data set that can be used to impute MS at high accuracy (Table 4, average 95%) for the loci within the ISAG recommended bovine parentage MS panel. This standard can be used in breeds that are not represented in the reference panel with only a small reduction in accuracy (Table 7).
For the research reported here to be implemented by the industry we suggest the following work flow:
1. Genotype animals with a SNP assay that contains our reported min SNP set (Table S1) and parentage SNP (Heaton et al., 2002; Werner et al., 2004) panels. These include the BovineHD, GeneSeek Genomic Profiler Bovine HD (GGP-HD), Super-GGP (Neogen Corporation, 2013), or the International Dairy and Beef (IDB) assays (Berry et al., 2013).
2. If the animal's parents have parentage SNP genotypes then parentage verify with SNP data.
3. If parents have no parentage SNP data then either:
A. Impute the animal's MS genotype via BEAGLE using the min SNP set and BT-ref as the reference population. If the animal is a B. indicus purebred or crossbred then use BT × BI as the reference population for haplotype reconstruction.
B. Phase the SNP with BEAGLE, fastphase (Scheet and Stephens, 2006), findhap (Vanraden, 2011), HAPI_UR (Williams et al., 2012), or other appropriate program. Then match the haplotype with the appropriate MS tab in Table S3 and return the most common MS allele to impute the animal's MS genotype.
4. Use the imputed MS genotypes for parentage verification.
5. If parentage verification fails, then genotype the animal with MS panel.
a. If the actual and imputed MS genotypes match, then consider retesting the parent with MS to correct the genotype error.
b. If the actual and imputed MS genotypes do not match, then phase the animal's SNPs and MS genotypes and add this animal to the reference population.
6. Generate an updated reference haplotype population by adding any new animal with actual MS and SNP genotype data to the reference population dataset and rephrase all of the SNP and MS genotypes.
7. Use the updated reference population at Step 3.
By MS genotyping the animal if a discrepancy occurs the process described above will self-correct for MS genotyping errors and capture rare MS-SNP haplotypes Generation of new reference panels (Step 6 above) will help: A) increase the imputation accuracy, and B) to identify rare or breed specific MS-SNP haplotypes. This process will also speed up the adoption of the accurate 101 SNP panel (Heaton et al., 2002) or derivative for parentage verification over the current MS panel.
For individuals that solely wish to parentally verify an individual and transition between MS and SNP genetic markers it currently would be most cost effective for one to genotype the animal with the ISAG MS panel ($15-€20) and a 116 SNP panel ($15) than to use a Super-GGP, GGP-HD, BovineHD, or IDB beadchip (€30-$185) (Jeremy Walker, GeneSeek, and John Flynn, Weatherbys, Pers. Commun., 22/07/2013). For those wishing to obtain genomic breeding values, select genetic disease status, and parentage SNP and MS genotypes on an animal than the listed beadchips and MS imputation do represent an economically viable option as one will not have to incur an additional cost to obtain MS genotypes.
As part of this international collaborative effort, the phased reference population data (BT-ref and BT + BI-ref) and marker (1 Mb and Min) BEAGLE files are available (Supplementary Data Sheets 1–3) to facilitate MS imputation in DNA service laboratories world-wide. Our results demonstrate the power of continued data sharing of MS and SNP genotypes from the BovineSNP, GGP-HD, Super-GGP, or IDB panels for the SNP genotypes within 500 kb of each MS to increase imputation accuracy. The haplotypes reported for these reference populations can be applied to accurately impute MS alleles with high accuracy on animals that have been genotyped for the flanking SNP, regardless of breed.
Conflict of Interest Statement
The authors declare that the research was conducted in the absence of any commercial or financial relationships that could be construed as a potential conflict of interest.
Acknowledgments
We thank Sue Denise and Avinash Baktula at Zoetis for their donation of MS genotypes on Brahman animals. We thank INRA and the French bovine breeding operations for their donation of genotypes on French cattle which were obtained from the ANR-10-GENM-014 project funded by Agence Nationale de la Recherche, Weatherbys DNA Laboratory for the donation of MS genotypes on Irish cattle, Cooperative Research Centre for Beef Genetic Technologies (Beef CRC) for providing genotypes on Australian cattle, and the UC-Davis Veterinary Genetics Laboratory staff for assistance in generating MS genotypes on HapMap and USDA-ARS-MARC animals. We thank the HapMap Breed Champions for granting permission to obtain MS genotypes from their respective breed association's records or by directly genotyping the animals, and Clare Gill (Texas A&M University) for providing DNA on selected HapMap animals. Finally, we thank the breed associations that provided MS genotypes, especially: Ayrshire Breeders' Association, USA Brown Swiss Association, American Guernsey Association, Holstein Association USA, American Jersey Cattle Association, Swedish Dairy Association, Red Angus Association of America, North American Limousin Foundation, French Limousin Society, British Limousin Cattle Society, American Angus Association, American Hereford Association, American Shorthorn Association, and the American Simmental Association. SNP genotypes from Ireland were funded by the Irish Cattle Breeding Federation, Teagasc, and the Research Stimulus Fund (11/S/112). Funding for this project was provided by USDA-ARS-1265-31000-104-00D, and USDA National Research Initiative Competitive Integrated Grant No. 2009-55205-05057 and 2009-65205-05635. Mention of trade names or commercial products in this article is solely for the purpose of providing specific information and does not imply recommendation or endorsement by the US Department of Agriculture. The USDA is an equal opportunity provider and employer.
Supplementary Material
The Supplementary Material for this article can be found online at: http://www.frontiersin.org/Livestock_Genomics/10.3389/fgene.2013.00176/abstract
References
Allen, A., Taylor, M., McKeown, B., Curry, A., Lavery, J., Mitchell, A., et al. (2010). Compilation of a panel of informative single nucleotide polymorphisms for bovine identification in the Northern Irish cattle population. BMC Genet. 11:5. doi: 10.1186/1471-2156-11-5
Baruch, E., and Weller, J. I. (2008). Estimation of the number of SNP genetic markers required for parentage verification. Anim. Genet. 39, 474–479. doi: 10.1111/j.1365-2052.2008.01754.x
Berry, D. P., McClure, M. C., Waters, S., Weld, R., Flynn, P., Creevey, C., et al. (2013). “Development of a custom genotyping panel for dairy and beef cattle breeding and research,” in Advances in Animal Biosciences, Vol. 4, eds S. Athanasiadou, A. S. Chaudhry, M. Denwood, D. P. Eckersall, J. Flockhart, D. A. Kenny, T. King, A. Mather, R. W. Mayes, D. M. Nash, R. I. Richardson, J. A. Rooke, M. T. Rose, C. Rymer, K. Sinclair, M. A. Steel, S. Waters, B. T. Wolf, and A. R. G. Wylie (Nottingham: Cambridge University Press), 249. doi: 10.1017/S2040470013000046
Bonin, A., Bellemain, E., Bronken Eidesen, P., Pompanon, F., Brochmann, C., and Taberlet, P. (2004). How to track and assess genotyping errors in population genetics studies. Mol. Ecol. 13, 3261–3273. doi: 10.1111/j.1365-294X.2004.02346.x
Browning, S. R., and Browning, B. L. (2007). Rapid and accurate haplotype phasing and missing-data inference for whole-genome association studies by use of localized haplotype clustering. Am. J. Hum. Genet. 81, 1084–1097. doi: 10.1086/521987
Fernández, M. E., Goszczynski, D. E., Lirón, J. P., Villegas-Castagnasso, E. E., Carino, M. H., Ripoli, M. V., et al. (2013). Comparison of the effectiveness of microsatellites and SNP panels for genetic identification, traceability and assessment of parentage in an inbred Angus herd. Genet. Mol. Biol. 36, 185–191. doi: 10.1590/S1415-47572013000200008
Heaton, M. P., Harhay, G. P., Bennett, G. L., Stone, R. T., Grosse, W. M., Casas, E., et al. (2002). Selection and use of SNP markers for animal identification and paternity analysis in U.S. beef cattle. Mamm. Genome 13, 272–281. doi: 10.1007/s00335-001-2146-3
Illumina Inc. (2010). BovineHD Genotyping Beadchip [Online]. Available online at: http://www.illumina.com/Documents/products/datasheets/datasheet_bovineHD.pdf (Accessed 7/12/2011).
International Bovine Hapmap Consortium. (2006). “An overview of the Bovine HapMap Project,” in 30th International Conference Animal Genetics. ISAG 2006, Colégio Brasileiro de Reprodução Animal (Belo Horizonte), 60.
Larmer, S., Sargolzaei, M., Ventura, R., and Schenkel, F. (2010). Imputation Accuracy From Low to High Density Using Within and Across Breed Reference Populations in Holstein, Guernsey and Ayrshire Cattle [Online]. Available online at: http://www.cdn.ca/Articles/GEBMAR2012/Imputation%20accuracy%20from%20low%20to%20high%20density%20-%20Larmer.pdf (Accessed 3/8/2013).
McClure, M., Sonstegard, T., Wiggans, G., and Van Tassell, C. P. (2012). Imputation of microsatellite alleles from dense SNP genotypes for parental verification. Front. Genet. 3:140. doi: 10.3389/fgene.2012.00140
McClure, M. C., McKay, S. D., Schnabel, R. D., and Taylor, J. F. (2009). Assessment of DNA extracted from FTA(R) cards for use on the Illumina iSelect BeadChip. BMC Res. Notes 2:107. doi: 10.1186/1756-0500-2-107
McTavish, E. J., Decker, J. E., Schnabel, R. D., Taylor, J. F., and Hillis, D. M. (2013). New world cattle show ancestry from multiple independent domestication events. Proc. Natl. Acad. Sci. U.S.A. 110, E1398–E1406. doi: 10.1073/pnas.1303367110
Neogen Corporation. (2012). GeneSeek Genomic Profiler for Dairy Cattle [Online]. Available online at: http://www.neogen.com/GeneSeek/pdf/Catalogs/DairyGenomicProfiler.pdf (Accessed August 31, 2012).
Neogen Corporation. (2013). GeneSeek Genomic Profiler Bovine HD [Online]. Available online at: www.neogen.com/Corporate/PR2013/2013-02-07.pdf (Accessed March 1, 2013).
Pausch, H., Aigner, B., Emmerling, R., Edel, C., Götz, K. U., and Fries, R. (2013). Imputation of high-density genotypes in the Fleckvieh cattle population. Genet. Sel. Evol. 45:3. doi: 10.1186/1297-9686-45-3
Reist-Marti, S. B., Simianer, H., Gibson, J., Hanotte, O., and Rege, J. E. O. (2003). Weitzman's approach and conservation of breed diversity: an application to african cattle breeds [El Método de Weitzman y la Conservación de la Diversidad de Razas: una Aplicación a Razas de Ganado Africano]. Conserv. Biol. 17, 1299–1311. doi: 10.1046/j.1523-1739.2003.01587.x
Rincon, G., Weber, K. L., Eenennaam, A. L., Golden, B. L., and Medrano, J. F. (2011). Hot topic: performance of bovine high-density genotyping platforms in Holsteins and Jerseys. J. Dairy Sci. 94, 6116–6121. doi: 10.3168/jds.2011-4764
Scheet, P., and Stephens, M. (2006). A fast and flexible statistical model for large-scale population genotype data: applications to inferring missing genotypes and haplotypic phase. Am. J. Hum. Genet. 78, 629–644. doi: 10.1086/502802
Vanraden, P. M. (2011). findhap.f90 [Online]. Available online at: http://aipl.arsusda.gov/software/findhap/ (Accessed September 17 2012).
Weller, J. I., Feldmesser, E., Golik, M., Tager-Cohen, I., Domochovsky, R., Alus, O., et al. (2004). Factors affecting incorrect paternity assignment in the israeli holstein population. J. Dairy Sci. 87, 2627–2640. doi: 10.3168/jds.S0022-0302(04)73389-5
Weller, J. I., Seroussi, E., and Ron, M. (2006). Estimation of the number of genetic markers required for individual animal identification accounting for genotyping errors. Anim. Genet. 37, 387–389. doi: 10.1111/j.1365-2052.2006.01455.x
Werner, F. A. O., Durstewitz, G., Habermann, F. A., Thaller, G., Krämer, W., Kollers, S., et al. (2004). Detection and characterization of SNPs useful for identity control and parentage testing in major European dairy breeds. Anim. Genet. 35, 44–49. doi: 10.1046/j.1365-2052.2003.01071.x
Keywords: microsatellite, STR, SNP, imputation, parentage verification
Citation: McClure MC, Sonstegard TS, Wiggans GR, Van Eenennaam AL, Weber KL, Penedo CT, Berry DP, Flynn J, Garcia JF, Carmo AS, Regitano LCA, Albuquerque M, Silva MVGB, Machado MA, Coffey M, Moore K, Boscher M-Y, Genestout L, Mazza R, Taylor JF, Schnabel RD, Simpson B, Marques E, McEwan JC, Cromie A, Coutinho LL, Kuehn LA, Keele JW, Piper EK, Cook J, Williams R, Bovine HapMap Consortium and Van Tassell CP (2013) Imputation of microsatellite alleles from dense SNP genotypes for parentage verification across multiple Bos taurus and Bos indicus breeds. Front. Genet. 4:176. doi: 10.3389/fgene.2013.00176
Received: 27 June 2013; Accepted: 22 August 2013;
Published online: 18 September 2013.
Edited by:
Peng Xu, Chinese Academy of Fishery Sciences, ChinaReviewed by:
Ikhide G. Imumorin, Cornell University, USAPrashanth R. Boddhireddy, Zoetis (Pfizer), USA
Copyright © 2013 McClure, Sonstegard, Wiggans, Van Eenennaam, Weber, Penedo, Berry, Flynn, Garcia, Carmo, Regitano, Albuquerque, Silva, Machado, Coffey, Moore, Boscher, Genestout, Mazza, Taylor, Schnabel, Simpson, Marques, McEwan, Cromie, Coutinho, Kuehn, Keele, Piper, Cook, Williams, Bovine HapMap Consortium and Van Tassell. This is an open-access article distributed under the terms of the Creative Commons Attribution License (CC BY). The use, distribution or reproduction in other forums is permitted, provided the original author(s) or licensor are credited and that the original publication in this journal is cited, in accordance with accepted academic practice. No use, distribution or reproduction is permitted which does not comply with these terms.
*Correspondence: Matthew C. McClure, Irish Cattle Breeding Federation, Bandon, Ireland e-mail:bW1jY2x1cmVAaWNiZi5jb20=