 Jørgen Ødegård
 Thomas Moen
 Nina Santi
 Sven A. Korsvoll
 Sissel Kjøglum
 Theo H. E. Meuwissen
- 1Breeding and Genetics, AquaGen AS, Trondheim, Norway
- 2Research and Development, AquaGen AS, Trondheim, Norway
- 3Department of Animal and Aquacultural Sciences, Norwegian University of Life Sciences, Aas, Norway
Reliability of genomic selection (GS) models was tested in an admixed population of Atlantic salmon, originating from crossing of several wild subpopulations. The models included ordinary genomic BLUP models (GBLUP), using genome-wide SNP markers of varying densities (1–220 k), a genomic identity-by-descent model (IBD-GS), using linkage analysis of sparse genome-wide markers, as well as a classical pedigree-based model. Reliabilities of the models were compared through 5-fold cross-validation. The traits studied were salmon lice (Lepeophtheirus salmonis) resistance (LR), measured as (log) density on the skin and fillet color (FC), with respective estimated heritabilities of 0.14 and 0.43. All genomic models outperformed the classical pedigree-based model, for both traits and at all marker densities. However, the relative improvement differed considerably between traits, models and marker densities. For the highly heritable FC, the IBD-GS had similar reliability as GBLUP at high marker densities (>22 k). In contrast, for the lowly heritable LR, IBD-GS was clearly inferior to GBLUP, irrespective of marker density. Hence, GBLUP was robust to marker density for the lowly heritable LR, but sensitive to marker density for the highly heritable FC. We hypothesize that this phenomenon may be explained by historical admixture of different founder populations, expected to reduce short-range lice density (LD) and induce long-range LD. The relative importance of LD/relationship information is expected to decrease/increase with increasing heritability of the trait. Still, using the ordinary GBLUP, the typical long-range LD of an admixed population may be effectively captured by sparse markers, while efficient utilization of relationship information may require denser markers (e.g., 22 k or more).
Introduction
Aquaculture populations are characterized by high male and female fecundity, typically resulting in large full-sib families. For invasive traits, traditional aquaculture selection programs involve sib-testing, which has limited reliability under classical selection schemes, as selection candidates are evaluated based on mid-parent means. Furthermore, this also leads to increased co-selection among close relatives, and enforcing restrictions on inbreeding will therefore hamper selection on such traits more than selection for individually evaluated traits. For individually evaluated traits, the sizeable family groups of aquaculture species give a substantial potential for within-family selection.
Marker-assisted selection can be used to select directly for favorable QTL alleles, a method that allows individual selection of genotyped animals even in absence of phenotyping. This requires that the QTL effects are known and that carriers of the favorable alleles can be identified through the markers. For Atlantic salmon, the method has been utilized with great success in selection for reduced incidence of infectious pancreatic necrosis (IPN), for which a single QTL explains (nearly) all genetic variation (Moen et al., 2009). In situations where several QTL underlie the trait, MAS will be more complex, and power of QTL detection lower as each QTL explains a smaller fraction of the total genetic variance. For such traits genomic selection (GS) is a viable alternative, utilizing information from numerous genome-wide marker loci jointly in the genetic analysis (Meuwissen et al., 2001). The GS methods facilitates computation of individual breeding values for all genotyped animals and do not require any prior knowledge of the underlying QTL. In simulated aquaculture populations, superior performance of GS models compared with classical models has been documented in several publications (e.g., Nielsen et al., 2009; Ødegård et al., 2009; Ødegård and Meuwissen, 2014), while documentation from real aquaculture data has been largely absent so far.
The original idea behind GS was that the genome-wide markers would capture linkage disequilibrium between marker loci and QTL (Meuwissen et al., 2001). However, accuracy of GS has been shown to be non-zero even in absence of linkage disequilibrium (LD) (Habier et al., 2007), and the actual reliability of GS models can thus be explained by three types of quantitative-genetic information sources contained in the genomic data (Habier et al., 2013):
(1) Pedigree;
(2) Co-segregation (linkage analysis information);
(3) Population-wide linkage disequilibrium (LD).
The ancestry (pedigree) is indeed reflected through inheritance of marker loci and is thus implicitly included in the dense marker information, although pedigree is not used directly. Co-segregation is the deviation from independent segregation of alleles as a result of linkage (i.e., deviations between relationships estimated from pedigree and linkage analysis), while LD is the statistical dependency between alleles at different loci in the base generation (i.e., the generation with unknown parents). Information on (1) and (2) can thus explain the non-zero reliability of GS even in absence of LD. Furthermore, in populations of strong relationship structure (e.g., livestock and aquaculture populations) LD may not even be the most important of these factors under GS; Wientjes et al. (2013) showed that the level of family relationship between selection candidates and the reference population had a higher effect on reliability of GS than LD per se.
There are currently numerous available GS methodologies. The most widely used methods are GS models using identity-by-state (IBS) information on dense genome-wide SNP markers, including the so-called genomic BLUP (GBLUP) and Bayesian methods (e.g., BayesA, BayesB, BayesC, BayesD) (Meuwissen et al., 2001; Habier et al., 2011). Other methods involve use of SNP haplotypes (combining multiple SNPs), that also take identity-by-descent (IBD) information into account (Calus et al., 2008). Finally, GS may be performed based on linkage analysis of genome-wide markers, producing an IBD genomic relationship matrix (IBD-GS), completely ignoring LD information (Villanueva et al., 2005; Luan et al., 2012).
In the following, we will focus on two of these methodologies for use in aquaculture breeding: Ordinary GBLUP and IBD-GS. GBLUP can be implemented by ridge-regression on genome-wide marker genotypes (Meuwissen et al., 2001) or by an animal model using a realized genomic relationship matrix estimated from marker genotype similarities across the genome (Hayes et al., 2009). The latter method will be used here. The advantage of the IBD-GS model lies in its ability to utilize realized IBD relationships rather than expected relationships estimated through the pedigree, e.g., full-sibs (which are numerous in aquaculture) are no longer necessarily related by a coefficient of ½, but their relationships depend on the actual length of shared IBD chromosome segments, which are traced by the markers through linkage analysis. Compared with other GS methods, IBD-GS has the advantage that it can be successfully implemented even at extremely low marker densities. This is due to the fact that number of recombinations from parent to offspring is usually low (i.e., averaging one per Morgan), and inheritance of long chromosomal blocks can thus be traced accurately even with a few genome-wide markers. A recent simulation study on an aquaculture-like population indicated that IBD-GS works effectively at densities where IBS-based methods are expected to fail, e.g., with 10–20 SNPs/Morgan (Vela-Avitúa et al., in press). Thus, there is no need for dense marker panels, making IBD-GS attractive for cost-effective GS implementation. For dairy cattle, IBD-GS models have been shown to give similar reliability as ordinary GBLUP models with dense markers (Luan et al., 2012). Hence, for livestock populations with large family sizes, realized close relationships (pedigree and co-segregation) are essential for the reliability of any GS model, and GS methodology may thus have large potential even in absence of strong LD structures. Aquaculture populations typically have strong relationship structures, with selection candidates having numerous full-sibs and potentially both maternal and paternal half-sib groups.
The Norwegian AquaGen Atlantic salmon population originates from the first family-based selective breeding program on Atlantic salmon, going back to the 1970'ies, based on crossing of wild founders from numerous wild Norwegian river strains (Gjedrem et al., 1991). Originally, four parallel populations were created, one for each year class in a 4 year generation interval. Although as much as 41 river strains were originally included, contributions of the different rivers vary considerably, both between the original base populations of the 4 year classes and as result of subsequent selection. Hence, the original farmed populations were indeed heavily admixed. The year-class strains were selected for a common breeding goal, but kept largely separate for 7 generations until 2005, when they were merged into a single population. Hence, the AquaGen population can be regarded as an admixed/synthetic population comprised of genetic material from many wild subpopulations, which likely have been separated for a long time in nature.
Admixture between genetically distinct populations increases LD between all loci (linked and unlinked) that have different allele frequencies in the founding populations (Pfaff et al., 2001). However, LD between unlinked loci will quickly be removed through recombinations, while LD between linked loci will be more persistent, e.g., for loci separated by 1 or 10 cM, respectively 90 and 35% of the admixture-induced LD (ALD) is expected to remain even after 10 generations, while 82 and 12% remain after 20 generations. However, admixture will not only introduce long-range ALD, it will also reduce the short range LD, i.e., the LD existing in the original founder populations. The short-range LD will decrease as phase associations between marker and QTL alleles can differ depending of the origin of the chromosome segments (Thomasen et al., 2013), and haplotype segments with strong LD are thus shorter in admixed populations (Toosi et al., 2010). This can be illustrated by the following example, assuming two sub-populations for simplicity: The frequency of a M1N1haplotype is (p + κ)(q + λ) + DI in population I, where (p + κ) and (q + λ) are the frequencies of the alleles M1 and N1, expressed as deviations from the across population frequencies (p and q), with frequency deviations κ and λ, and DI is the LD in population I. Similarly, (p − κ)(q − λ) + DII is the haplotype frequency in population II. The haplotype frequency in their crossbred-offspring (F1) is thus: (p + q + D), where D is the average of DI and DII. The LD in the F1 cross is (κλ + D), which comprises a ALD term κλ due to the crossbreeding (depends on frequency differences and is independent of distances between the loci), and the average of the original population-specific LD coefficients between the loci. D is on average smaller than either DI or DII since they may have opposite signs in the two populations, resulting in a reduced short-range LD in the admixed population.
The reduced short-range LD originating from founder populations may challenge accurate genomic prediction. Still, long-range ALD (the κλ term) can be effectively captured even by sparse markers, but may explain a limited fraction of the genetic variance, depending on the degree of differentiation between the founding populations.
Hence, effectiveness of GS in admixed populations depends on several layers of information: remaining LD from the founder populations, long-range ALD, and the relationship structure within the existing population. Furthermore, the relative importance of these factors likely depends on genetic architecture, marker density, heritability and the GS methodology used.
The aim of the study was to quantify the importance of marker density on the reliability of ordinary GBLUP models and to compare these estimates with IBD-based models completely ignoring LD, i.e., classical pedigree-based models and IBD-GS models. To this end, two traits measured on Atlantic salmon [fillet color (FC) and salmon lice resistance], with high and low heritability, using alternative GS models and marker densities were studied. So far, no QTL of large effect has yet been found for lice resistance, but major QTL have been found for FC, still these do not explain all genetic variance (Baranski et al., 2010).
Materials and Methods
Data
The fish used in the material were from the AquaGen population year-class first-fed in 2011. In total, 157 full-sib families (offspring of 99 dams and 97 sires) were sampled for salmon lice (Lepeophtheirus salmonis) challenge testing, and 30–40 fish from each of these families were transferred to Nofima at Averøy, Norway and put into sea net-cages in October 2011. Two separate lice tests were conducted the following year, with all families being represented in both tests. Test 1 was conducted in the period July 16–18, 2012 and Test 2 in the period October 17–19, 2012. The total number of challenge-tested fish was 5198, with 2850 and 2348 fish in Test 1 and 2, respectively. Lice challenge testing of the fish was approved by the Norwegian Animal Research Authority (S-2012/148773).
Challenge testing was conducted by closing the net cages with tarpaulins prior to adding L. salmonis copepodites to the water. The copepodites attach immediately to the fish and the test aimed at 10–20 copepodites per fish 10–15 days after infection, when number of lice per fish was recorded at the end of chalimus II stage (Hamre et al., 2013). Lice count (LC) on the surface of the skin was recorded by manual counting. Average LC per fish was ~21 lice in Test 1 and ~13 in Test 2. However, the distribution of LC was highly skewed (Figures 1, 2), with some animals having extremely high infestations (up to 238 parasites on a single fish). Skewness in distribution of parasite abundance traits are frequently observed, and such traits are thus often analyzed on the log-scale (e.g., Robert et al., 1990; Morand and Guegan, 2000; Rozsa et al., 2000; Davies et al., 2006). Hence, LC was normalized through log-transformation (LogLC), defined as:

Figure 1. Density plots of lice count (LC) and log of lice density (LogLD) in Test 1. A normal density is given with the blue line.
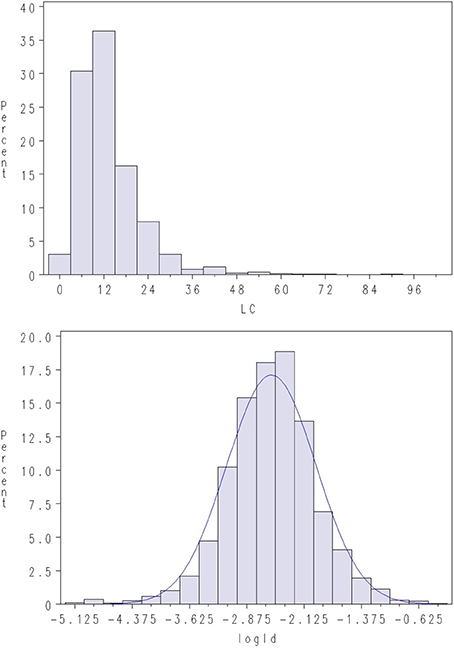
Figure 2. Density plots of lice count (LC) and log of lice density (LogLD) in Test 2. A normal density is given with the blue line.
Lice counts were added a constant value of 1 to avoid computing errors due to fish with zero recorded lice. Furthermore, there is a tendency toward increasing LC with increasing body size (i.e., body surface) of the fish. Hence, Gjerde et al. (2011) developed an alternative measure of lice resistance, defined as estimated LiceD on the skin:
where BW is body weight (g) at time of recording, and is an approximate measure for the surface skin area of the fish. Still, considerable skewness was also observed for LiceD in the current dataset, while log-transformed LiceD (LogLD) was approximately normal (Figures 1, 2), indicating an approximate lognormal distribution of the trait:
Using the latter trait definition increased the estimated heritability (i.e., the fraction of variance explained by additive genetic effects) increased substantially compared with a linear model applied to untransformed LiceD (results not shown).
FC was recorded in a subsequent slaughter test in April 2013, where fish originating from both lice challenge tests were jointly recorded for FC (majority of the recorded fish originated from Test 1). The trait FC was defined as the pigmentation (redness) of the fillet and was automatically measured using image analysis with PhotoFish equipment and software (Photofish AS, Ås, Norway). The recorded FC was found to be approximately normally distributed (Figure 3).
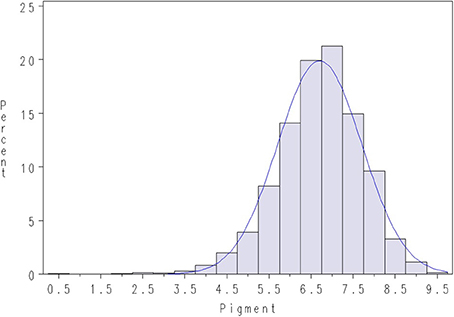
Figure 3. Density plot of pigmentation in salmon fillets (FC) in the slaughter test, April 2013. A normal density is given with the blue line.
More descriptive statistics are shown in Tables 1–3.
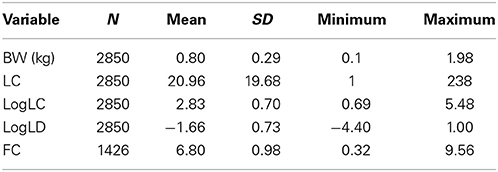
Table 1. Descriptive statistics of data from fish participating in lice challenge test 1.
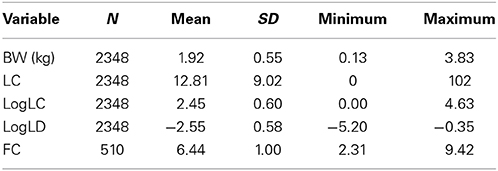
Table 2. Descriptive statistics of data from fish participating in lice challenge test 2.

Table 3. Within-test Pearson correlation coefficient between the traits BW, LC, LogLD and LogLD, with coefficients for the tests 1 and 2 are given, respectively, above and below the diagonal.
Genotyping
A total of 1963 phenotyped individuals were genotyped with a 220 k Affymetrix genome-wide SNP-chip. About half the individuals in Test 1 were genotyped (1444 individuals), but a smaller fraction in Test 2 (519 individuals). The genotyping strategy was supposed to serve two purposes: (1) Application of GS; and (2) a genome-wide association study, potentially followed by marker-assisted selection (MAS) for the most significant SNP(s). The aim was to establish two experimental selection lines for, respectively, high and low sea lice resistance, using a combination of pedigree-based selection, GS and MAS. Hence, genotyping was not completely random, but particularly focused on the most extreme families (in both directions) with respect to lice resistance. Of the 1963 genotyped animals, 1869 had phenotype for FC.
Statistical Models
A preliminary analysis showed that there was no significant genetic correlation between logLD and FC, and the two traits were therefore analyzed separately in subsequent analyses.
For logLD, an initial quantitative genetic analysis was run, treating phenotypes of the two lice tests as two correlated genetic traits. A bivariate linear animal model was used for analysis of the data:
where y1 and y1 are vectors of LogLD phenotypes from Test 1 and 2, respectively, β1 and β2 are vector of fixed effects (overall means of the two tests, and effect of observing person, nested within each effect), genetic effects are given in , residual effects are given in , Z1 and Z1 are appropriate incidence matrices (assigning animal genetic effects to phenotypes), I is an identity matrix of appropriate size, A is the pedigree−based numerator relationship matrix, and G0 is the additive genetic (co)variance matrix for the two genetic traits. As the two tests were performed on different individuals, the residual covariance between the two traits was assumed to be zero.
As the genetic correlation between logLD of the two tests was lower than unity (results shown below) and the majority of the genotyped animals came from lice challenge test 1, predictive ability of the genomic models for lice resistance was performed using phenotypes of the first test only. The FC was recorded on a later stage with fish originating both lice challenge tests, recorded at same age within the same slaughter test. FC of all fish was therefore analyzed jointly as a single genetic trait. Hence, predictive abilities of the different classical and genomic models for logLD (test 1) and FC were assessed using univariate animal models, with the following general characteristics:
Where y is a vector of phenotypes (logLD or FC), a~ N (0, Gσ2g) is a vector of random additive genetic effects, where G is a given relationship matrix (model dependent), and e~ N (0, Iσ2e) is a vector of random residuals. The fixed effects (b) included person (responsible for counting) by day for logLD, and gender of fish for FC. Common environmental effects of family were also tested, but these effects were small and not significantly different from zero (P > 0.20) for both traits, and were thus dropped in the final model.
Univariate sub-models
The different models differed solely with respect to their specification of the relationship matrix G:
PED: Classical pedigree-based analysis, i.e., G = A (numerator relationship matrix).
IBD-GS: Identity-by-descent GS, using a linkage-based IBD relationship matrix for the genotyped animals. The matrix was calculated from a sparse marker set containing 5590 mapped genome-wide SNP markers, using the LDMIP software (Meuwissen and Goddard, 2010). The number of mapped SNPs per chromosome varied from 52 to 396, and relationship matrices were thus computed for each chromosome separately and subsequently averaged over chromosomes to produce G.
GBLUP: Identity-by-state GS (ordinary GBLUP), calculating the G directly from genome-wide SNP markers using the second method by Vanraden (2007). Alternative G matrices were tested by extracting random sub-sets from the complete marker data set, including either (a) 1100 (1 K), (b) 2200 (2 k), (c) 4400 (4 k), (d) 22 000 (22 k), (e) 55 000 (55 k), or (f) all 220 000 (220 k) SNP markers, respectively. For (a) to (d) at total of 10 non-overlapping replicates (sub-sets of marker genotypes) were generated, while (e) was replicated 4 times. Results were averaged over replicates.
All models utilizing genomic information (IBD-GS and GBLUP) used one-step estimation of EBVs (Legarra et al., 2009; Christensen and Lund, 2010), combining relationships from genotyped and ungenotyped individuals into a unified relationship matrix H. Furthermore, the G matrices were adjusted to the same average rate of inbreeding and relationship as the numerator relationship matrix, using the ADJUST option in DMU (Christensen et al., 2012; Madsen and Jensen, 2013). Identical variance components were used in all models. These were estimated with the PED model using all phenotypic data.
Model comparison
Reliabilities of the different models were assessed through predictive ability, using five-fold cross-validation, i.e., individuals being both phenotyped and genotyped were randomly sampled into five validation sets, which were predicted one at a time, masking the phenotypes of the validation animals and using all the remaining phenotypes and genotypes as training data. Reliability was estimated as:
where R2EBV,y is the squared correlation between EBVs of a given model (predicted from the training data, without the phenotype of the animal itself) and the recorded phenotype (y), while h2 is the estimated heritability of the trait.
Results
Estimated Heritabilities and Genetic Correlations
Heritability of lice resistance (logLD) was estimated for the two tests using a bivariate PED model, as described in the above section. The estimated heritabilities for the two tests were low to moderate (0.14 ± 0.03 and 0.13 ± 0.03 for July and October, respectively), and the estimated genetic correlation between lice resistance in the two tests was high (0.72 ± 0.12). The estimated heritability of FC, based on an univariate PED model, was high (0.43 ± 0.06). Based on likelihood ratio tests, genetic effects were highly significant for both traits (P < 0.001).
Reliability of Different Models and Marker Densities
Based on the five-fold cross validation, the reliability of the PED model was slightly higher for FC (0.36) than for lice resistance (0.34), the relative increases in reliabilities for the different GS models (compared with PED) are presented in Figures 4, 5 for lice resistance and FC, respectively. In general, all GS models outperformed the classical PED model, but the relative improvement varied considerably between models and traits. For lice resistance, the relative increase in reliability using GS was substantial (up to 52% for GBLUP with 220 k), but moderate for FC (21% for IBD-GS and 22% for GBLUP with 220 k).
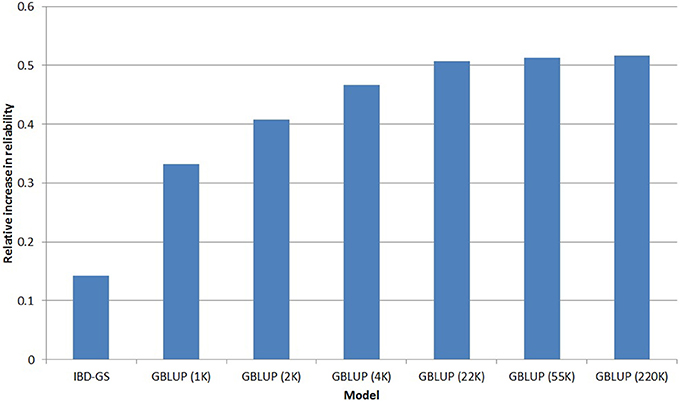
Figure 4. Relative increase in reliability1 of genomic selection models for LR compared with a classical pedigree-based model.

Figure 5. Relative increase in reliability2 of genomic selection models for FC compared with a classical pedigree-based model.
Using GBLUP, higher marker densities were always favorable, but the relative advantage was considerably more expressed in FC than in lice resistance. For example, the relative increase in reliability of GBLUP for FC was 39% when going from 4 to 220 k, while the corresponding increase for lice resistance was only 11%. Nevertheless, GBLUP was superior to PED for both traits, even at the lowest marker densities (1 k). For both traits, going from 22 to 220 k SNPs increased reliability by only ~1%. Hence, increasing SNP density beyond 22 k would have little practical effect on selection.
Another striking result was the enormous difference between the traits with respect to the relative reliability of the IBD-GS model. For the lowly heritable lice resistance the relative improvement compared with a classical pedigree-based model was considerably lower for IBD-GS than (220 k) GBLUP (14 and 52% for IBD-GS and GBLUP, respectively). In contrast, for the more highly heritable FC, increases in reliability for the two models were similar (21and 22% for IBD-GS and 220 k GBLUP, respectively).
Discussion
The estimated heritabilities (0.14 ± 0.03 and 0.13 ± 0.03) for lice resistance (measured as log of LD) obtained in the current study was lower than recent estimates (0.26 ± 0.05) obtained for similar trait definitions (untransformed LD) and testing methods in a previous study on lice resistance in a different salmon population (Gjerde et al., 2011). It should be noted, however, that the previous test was conducted in tanks, while the current test was performed in sea-cages, with copepidids being added directly to the sea-cage.
As one of the aims of the project was to produce extreme high/low lines with respect to lice resistance, families with high/low lice resistance were over-represented among the genotyped animals, which may have some effect on the reliability of the PED and GS models for this trait. The analysis was in all cases validated based on genotyped animals, and extreme families for lice resistance are thus overrepresented among the validation animals, which is expected to inflate the between-family variation in the sample. In the PED model, predicted breeding values for animals with masked phenotypes is simply a function of the mid-parent means, and an inflation of the between-family variance in the training sample may thus increase the apparent reliability of the model. This may explain the relative small difference in reliabilities of the PED model for LR and FC (0.34 and 0.36, respectively), despite the considerable difference in heritability of the two traits (0.14 and 0.43, respectively). Despite this, the relative improvement of the reliability through GS was substantial for LR (up to 52%). For FC, selective genotyping with respect to LR had likely little impact, due to the low correlation between the traits.
The models used in this study utilize the sources of information contained in genomic data differently. The GBLUP model utilizes pedigree (implicitly contained in the genomic data), linkage analysis (animals sharing IBD chromosome segments will necessarily share marker alleles) as well as LD. However, its ability to utilize the different sources of information depends on marker density. IBD-GS utilizes pedigree and linkage analysis and is robust to marker density, while PED, by definition, utilizes the pedigree relationships only. For the GBLUP model, high marker density would be needed to capture both short-range LD and (tiny) variations in co-segregation among relatives. In contrast, the IBD-GS model will utilize linkage analysis information accurately, even at very low marker densities. Furthermore, the relative importance of the different types of information depends on several factors such as structure of the dataset (i.e., number of close relatives in the population), historical Ne (i.e., amount of LD), as well as the heritability of the traits involved. In general, it is expected that for a lowly heritable trait, genetic effects estimated over larger groups of individuals, such as LD-associated effects (general association between marker genotypes and phenotypes) and mid-parent means would be more robust and thus relatively more important for the reliability, while linkage-analysis based deviations from pedigree relationships (i.e., largely minor individual deviations) would be relatively more important at higher heritabilities. Thus, the relative advantage of the GBLUP model may be largest at low heritability (e.g., lice resistance), while IBD-GS would be expected to perform relatively better at higher heritability (e.g., FC), which is consistent with results of this study. Another contributing factor may be the genetic architecture of the two traits; A major QTL has been published for FC (Baranski et al., 2010), and two more has recently been identified in the AquaGen population. All three QTL on FC were also detected in a genome-wide association study of the current data set, while, in contrast, no major QTL for lice resistance has been found (unpublished results). The GBLUP model assumes that genetic variance is uniformly distributed over the entire genome, which may fit better for lice resistance than FC. For this reason, more advanced Bayesian variable selection models (BayesB, BayesC, etc.) may have a larger potential in FC than LR.
Still, the factors discussed above do not explain the favorable performance of GBLUP for lice resistance at extremely low marker densities (e.g., 4 k), for which limited LD is usually expected (in homogenous populations), and linkage-based deviations from the expected relationships are unlikely to be accurately captured by IBS information. The explanation may thus lie in the selection history of farmed Atlantic salmon. As described in the introduction, admixture from several distinct wild strains is expected to introduce long-range LD, and simultaneously reduce the short-range LD in the population. This will likely reduce the relative advantage of dense SNP data, as a relatively larger fraction of the available LD may be captured even by sparse marker panels, potentially explaining the good performance of GBLUP for lice resistance even at extremely low marker densities. Current terrestrial livestock populations may also have been formed by admixtures of old populations, but these admixture events occurred longer ago and may have been less extreme than in Atlantic salmon. Still, some admixture effects on the LD structure may also be seen in terrestrial livestock species, and thus contribute to the rather small increases observed in accuracy of GS as marker density increases (Vanraden et al., 2011). A high marker density in GBLUP will be favorable for utilization of linkage analysis information, which is mainly an advantage at higher heritabilities and strong relationship structures (Ødegård and Meuwissen, 2014), i.e., as seen with FC.
The number of genotyped animals was rather limited in the current study. Genotyping larger fractions of the population would be expected to increase the reliability of GS models even further.
Conflict of Interest Statement
The authors declare that the research was conducted in the absence of any commercial or financial relationships that could be construed as a potential conflict of interest.
Acknowledgments
The study was supported by the Norwegian Research Council through projects no. 200511/S40, 226266/E40 and 225181, and by Regionale Forskningsfond Midt-Norge through project no. ES486711. We would also thank Bjarne Gjerde and Sissel Nergaard, Nofima for taking responsibility of the sea lice challenge tests.
Footnotes
1. ^Reliability of LR using the PED model was 0.34.
2. ^Reliability of FC using the PED model was 0.36.
References
Baranski, M., Moen, T., and Våge, D. (2010). Mapping of quantitative trait loci for flesh colour and growth traits in Atlantic salmon (Salmo salar). Genet. Sel. Evol. 42:17. doi: 10.1186/1297-9686-42-17
Pubmed Abstract | Pubmed Full Text | CrossRef Full Text | Google Scholar
Calus, M. P. L., Meuwissen, T. H. E., De Roos, A. P. W., and Veerkamp, R. F. (2008). Accuracy of genomic selection using different methods to define haplotypes. Genetics 178, 553–561. doi: 10.1534/genetics.107.080838
Pubmed Abstract | Pubmed Full Text | CrossRef Full Text | Google Scholar
Christensen, O., and Lund, M. (2010). Genomic prediction when some animals are not genotyped. Gen. Sel. Evol. 42:2. doi: 10.1186/1297-9686-42-2
Pubmed Abstract | Pubmed Full Text | CrossRef Full Text | Google Scholar
Christensen, O. F., Madsen, P., Nielsen, B., Ostersen, T., and Su, G. (2012). Single-step methods for genomic evaluation in pigs. Animal 6, 1565–1571. doi: 10.1017/S1751731112000742
Pubmed Abstract | Pubmed Full Text | CrossRef Full Text | Google Scholar
Davies, G., Stear, M. J., Benothman, M., Abuagob, O., Kerr, A., Mitchell, S., et al. (2006). Quantitative trait loci associated with parasitic infection in Scottish blackface sheep. Heredity 96, 252–258. doi: 10.1038/sj.hdy.6800788
Pubmed Abstract | Pubmed Full Text | CrossRef Full Text | Google Scholar
Gjedrem, T., Gjøen, H. M., and Gjerde, B. (1991). Genetic origin of Norwegian farmed Atlantic salmon. Aquaculture 98, 41–50. doi: 10.1016/0044-8486(91)90369-I
Pubmed Abstract | Pubmed Full Text | CrossRef Full Text | Google Scholar
Gjerde, B., Ødegård, J., and Thorland, I. (2011). Estimates of genetic variation in the susceptibility of Atlantic salmon (Salmo salar) to the salmon louse Lepeophtheirus salmonis. Aquaculture 314, 66–72. doi: 10.1016/j.aquaculture.2011.01.026
Habier, D., Fernando, R., Kizilkaya, K., and Garrick, D. (2011). Extension of the bayesian alphabet for genomic selection. BMC Bioinformatics 12:186. doi: 10.1186/1471-2105-12-186
Pubmed Abstract | Pubmed Full Text | CrossRef Full Text | Google Scholar
Habier, D., Fernando, R. L., and Dekkers, J. C. M. (2007). The impact of genetic relationship information on genome-assisted breeding values. Genetics 177, 2389–2397. doi: 10.1534/genetics.107.081190
Pubmed Abstract | Pubmed Full Text | CrossRef Full Text | Google Scholar
Habier, D., Fernando, R. L., and Garrick, D. J. (2013). Genomic BLUP decoded: a look into the black box of genomic prediction. Genetics 194, 597–607. doi: 10.1534/genetics.113.152207
Pubmed Abstract | Pubmed Full Text | CrossRef Full Text | Google Scholar
Hamre, L. A., Eichner, C., Caipang, C. M. A., Dalvin, S. T., Bron, J. E., Nilsen, F., et al. (2013). The salmon louse Lepeophtheirus salmonis (Copepoda: Caligidae) life cycle has only two chalimus stages. PLoS ONE 8:e73539. doi: 10.1371/journal.pone.0073539
Pubmed Abstract | Pubmed Full Text | CrossRef Full Text | Google Scholar
Hayes, B. J., Visscher, P. M., and Goddard, M. E. (2009). Increased accuracy of artificial selection by using the realized relationship matrix. Genet. Res. 91, 47–60. doi: 10.1017/S0016672308009981
Pubmed Abstract | Pubmed Full Text | CrossRef Full Text | Google Scholar
Legarra, A., Aguilar, I., and Misztal, I. (2009). A relationship matrix including full pedigree and genomic information. J. Dairy Sci. 92, 4656–4663. doi: 10.3168/jds.2009-2061
Pubmed Abstract | Pubmed Full Text | CrossRef Full Text | Google Scholar
Luan, T., Wooliams, J. A., Ødegård, J., Dolezal, M., Roman-Ponce, S. I., Bagnato, A. et al. (2012). The importance of identity-by-state information for the accuracy of genomic selection. Genet. Sel. Evol. 44:28. doi: 10.1186/1297-9686-44-28
Pubmed Abstract | Pubmed Full Text | CrossRef Full Text | Google Scholar
Madsen, P., and Jensen, J. (2013). DMU: A User's Guide. A Package for Analysing Multivariate Mixed Models. Available online at: http://dmu.agrsci.dk/DMU/Doc/Current/dmuv6_guide.5.2.pdf
Meuwissen, T. H. E., and Goddard, M. E. (2010). The use of family relationships and linkage disequilibrium to impute phase and missing genotypes in up to whole-genome sequence density genotypic data. Genetics 185, 1441–1449. doi: 10.1534/genetics.110.113936
Pubmed Abstract | Pubmed Full Text | CrossRef Full Text | Google Scholar
Meuwissen, T. H. E., Hayes, B. J., and Goddard, M. E. (2001). Prediction of total genetic value using genome-wide dense marker maps. Genetics 157, 1819–1829.
Moen, T., Baranski, M., Sonesson, A. K., and Kjøglum, S. (2009). Confirmation and fine-mapping of a major QTL for resistance to infectious pancreatic necrosis in Atlantic salmon (Salmo salar): population-level associations between markers and trait. BMC Genomics 10:368. doi: 10.1186/1471-2164-10-368
Pubmed Abstract | Pubmed Full Text | CrossRef Full Text | Google Scholar
Morand, S., and Guegan, J. F. (2000). Distribution and abundance of parasite nematodes: ecological specialisation, phylogenetic constraint or simply epidemiology? Oikos 88, 563–573. doi: 10.1034/j.1600-0706.2000.880313.x
Nielsen, H. M., Sonesson, A. K., Yazdi, H., and Meuwissen, T. H. E. (2009). Comparison of accuracy of genome-wide and BLUP breeding value estimates in sib based aquaculture breeding schemes. Aquaculture 289, 259–264. doi: 10.1016/j.aquaculture.2009.01.027
Ødegård, J., and Meuwissen, T. (2014). Identity-by-descent genomic selection using selective and sparse genotyping. Genet. Sel. Evol. 46:3. doi: 10.1186/1297-9686-46-3
Pubmed Abstract | Pubmed Full Text | CrossRef Full Text | Google Scholar
Ødegård, J., Yazdi, M. H., Sonesson, A. K., and Meuwissen, T. H. E. (2009). Incorporating desirable genetic characteristics from an inferior into a superior population using genomic selection. Genetics 181, 737–745. doi: 10.1534/genetics.108.098160
Pubmed Abstract | Pubmed Full Text | CrossRef Full Text | Google Scholar
Pfaff, C. L., Parra, E. J., Bonilla, C., Hiester, K., McKeigue, P. M., Kamboh, M. I., et al. (2001). Population structure in admixed populations: effect of admixture dynamics on the pattern of linkage disequilibrium. Am. J. Hum. Genet. 68, 198–207. doi: 10.1086/316935
Pubmed Abstract | Pubmed Full Text | CrossRef Full Text | Google Scholar
Robert, F., Boy, V., and Gabrion, C. (1990). Biology of parasite populations: population dynamics of bothriocephalids (Cestoda-Pseudophyllidea) in teleostean fish. J. Fish Biol. 37, 327–342. doi: 10.1111/j.1095-8649.1990.tb05863.x
Rozsa, L., Reiczigel, J., and Majoros, G. (2000). Quantifying parasites in samples of hosts. J. Parasitol. 86, 228–232. doi: 10.1645/0022-3395(2000)086[0228:QPISOH]2.0.CO;2
Pubmed Abstract | Pubmed Full Text | CrossRef Full Text | Google Scholar
Thomasen, J. R., Sørensen, A. C., Su, G., Madsen, P., Lund, M. S., and Guldbrandtsen, B. (2013). The admixed population structure in Danish Jersey dairy cattle challenges accurate genomic predictions. J. Anim. Sci. 91, 3105–3112. doi: 10.2527/jas.2012-5490
Pubmed Abstract | Pubmed Full Text | CrossRef Full Text | Google Scholar
Toosi, A., Fernando, R. L., and Dekkers, J. C. M. (2010). Genomic selection in admixed and crossbred populations. J. Anim. Sci. 88, 32–46. doi: 10.2527/jas.2009-1975
Pubmed Abstract | Pubmed Full Text | CrossRef Full Text | Google Scholar
Vanraden, P., O'connell, J., Wiggans, G., and Weigel, K. (2011). Genomic evaluations with many more genotypes. Genet. Sel. Evol. 43:10. doi: 10.1186/1297-9686-43-10
Pubmed Abstract | Pubmed Full Text | CrossRef Full Text | Google Scholar
Vanraden, P. M. (2007). Efficient estimation of breeding values from dense genomic data. J. Dairy Sci. 90, 374–375. doi: 10.3168/jds.2007-0980
Vela-Avitúa, S., Meuwissen, T. H. E., Luan, T., and Ødegård, J. (in press). Accuracy of genomic selection for a sib-evaluated trait using identity-by-state and identity-by-descent relationships. Genet. Sel. Evol.
Villanueva, B., Pong-Wong, R., Fernández, J., and Toro, M. A. (2005). Benefits from marker-assisted selection under an additive polygenic genetic model. J. Anim. Sci. 83, 1747–1752.
Wientjes, Y. C. J., Veerkamp, R. F., and Calus, M. P. L. (2013). The effect of linkage disequilibrium and family relationships on the reliability of genomic prediction. Genetics 193, 621–631. doi: 10.1534/genetics.112.146290
Pubmed Abstract | Pubmed Full Text | CrossRef Full Text | Google Scholar
Keywords: Atlantic salmon, genomic selection, reliability, admixture, genetics
Citation: Ødegård J, Moen T, Santi N, Korsvoll SA, Kjøglum S and Meuwissen THE (2014) Genomic prediction in an admixed population of Atlantic salmon (Salmo salar). Front. Genet. 5:402. doi: 10.3389/fgene.2014.00402
Received: 01 September 2014; Accepted: 31 October 2014;
Published online: 21 November 2014.
Edited by:
José Manuel Yáñez, University of Chile, ChileReviewed by:
Jiuzhou Song, University of Maryland, USARoger Vallejo, United States Department of Agriculture, USA
Ignacy Misztal, University of Georgia, USA
Copyright © 2014 Ødegård, Moen, Santi, Korsvoll, Kjøglum and Meuwissen. This is an open-access article distributed under the terms of the Creative Commons Attribution License (CC BY). The use, distribution or reproduction in other forums is permitted, provided the original author(s) or licensor are credited and that the original publication in this journal is cited, in accordance with accepted academic practice. No use, distribution or reproduction is permitted which does not comply with these terms.
*Correspondence: Jørgen Ødegård, Department of Animal and Aquacultural Sciences, Norwegian University of Life Science, Arboretveien 6, PO Box 5003, Aas, NO-1432, Norway e-mail:am9yZ2VuLm9kZWdhcmRAYXF1YWdlbi5ubw==