 Mona K. Saadeldin
 Heba Shawer
 Ahmed Mostafa2
 Asma Amleh
 Rania Siam
- 1Biotechnology Department, American University in Cairo, New Cairo, Egypt
- 2National Cancer Institute, Cairo University, New Cairo, Egypt
- 3Clinical Pathology Department, Cairo University, New Cairo, Egypt
- 4Biology Department, American University in Cairo, New Cairo, Egypt
- 5YJ-Science and Technology Research Center, American University in Cairo, New Cairo, Egypt
LATS1, the large tumor suppressor 1 gene, encodes for a serine/threonine kinase protein and is implicated in cell cycle progression. LATS1 is down-regulated in various human cancers, such as breast cancer, and astrocytoma. Point mutations in LATS1 were reported in human sarcomas. Additionally, loss of heterozygosity of LATS1 chromosomal region predisposes to breast, ovarian, and cervical tumors. In the current study, we investigated LATS1 genetic variations including single nucleotide polymorphisms (SNPs), in 28 Egyptian patients with either urinary bladder or colon cancers. The LATS1 gene was amplified and sequenced and the expression of LATS1 at the RNA level was assessed in 12 urinary bladder cancer samples. We report, the identification of a total of 29 variants including previously identified SNPs within LATS1 coding and non-coding sequences. A total of 18 variants were novel. Majority of the novel variants, 13, were mapped to intronic sequences and un-translated regions of the gene. Four of the five novel variants located in the coding region of the gene, represented missense mutations within the serine/threonine kinase catalytic domain. Interestingly, LATS1 RNA steady state levels was lost in urinary bladder cancerous tissue harboring four specific SNPs (16045 + 41736 + 34614 + 56177) positioned in the 5′UTR, intron 6, and two silent mutations within exon 4 and exon 8, respectively. This study identifies novel single-base-sequence alterations in the LATS1 gene. These newly identified variants could potentially be used as novel diagnostic or prognostic tools in cancer.
Introduction
The large tumor suppressor gene (LATS1), encodes for a serine/threonine protein kinase. It was first identified in Drosophila melanogaster and later two mammalian homologs LATS1 and LATS2 were identified (Yabuta et al., 2000, 2007). LATS1 shares functional and structural similarities with LATS2. They are core components of the Hippo signaling pathway that promotes tissue growth and regulates cell proliferation. Mutations in the Hippo signaling pathway have been associated with tissue overgrowth and development of tumors. In mammals, the activation of the Hippo signaling inhibits cell proliferation through activation of the mammalian Ste20-like serine/threonine kinases 1 and 2 (MST1/2) that phosphorylates LATS1/2. Phosphorylated LATS1 in turn activates selected oncogenes such as yes-associated protein (YAP) or its paralog, the transcriptional co-activator with PDZ-binding motif (TAZ) (Hao et al., 2008). The phosphorylated form of YAP gets sequestered in the cytoplasm resulting in suppression of cell proliferation (Harvey and Tapon, 2007; Oka et al., 2008).
LATS1 regulate cell cycle by inhibiting the activity of CDC2 kinases during mitosis. The N-terminus of the phosphorylated LATS1 protein binds to CDC2 and reduces the activity of H1 histone kinase (Tao et al., 1999) leading to G2-M arrest (Xia et al., 2002). The phosphorylated LATS1 was reported to inhibit actin polymerization by binding to F-actin (Visser-Grieve et al., 2011). In agreement with LATS1 role as a tumor suppressor, its overexpression was observed to induce apoptosis by up-regulating Bcl-2-associated X (BAX) protein and caspase-3 pro-apoptotic proteins independent of P53 (Xia et al., 2002). The tumor suppressor LATS1 is down regulated in various soft tissue sarcomas (Hisaoka et al., 2002), and LATS1 down-regulation was shown to be a poor prognostic factor in glioma cases (Ji et al., 2012). Moreover, Lats1 knockout mice induced the formation of ovarian tumors and soft tissue sarcomas (St John et al., 1999). Down-regulation of LATS1 expression due to its promoter hyper-methylation was also observed in breast cancer, colorectal cancer and astrocytoma (Takahashi et al., 2005; Jiang et al., 2006; Wierzbicki et al., 2013). Loss of heterozygosity in the LATS1 chromosomal region was reported in ovarian tumors, breast tumors and adenoid cystic carcinoma (Hansen et al., 2002; Takahashi et al., 2005; Rutherford et al., 2006).
The human LATS1 gene is 57.3 Kb in length and is located at chromosome 6q24–25.1 (Nishiyama et al., 1999). Large-scale genome sequencing studies have identified various mutations within this chromosomal region (Koed et al., 2005). Chromosome 6 was shown to be a region that is frequently subjected to allelic imbalances in bladder tumors (Koed et al., 2005). High heterozygosity regions and nucleotide diversity were observed on chromosome 6 and a total of 96,317 SNPs were mapped to chromosome 6, with SNPs density about a single SNP every 3.07 Kb (Sachidanandam et al., 2001). Particular SNPs in this region were correlated with certain diseases. For instance, a genome-wide association study (GWAS) of 19,091 cases with breast cancer and 20,606 controls has identified the SNP rs9485372 in chromosome 6q25.1 near the LATS1 gene, and associated it with risk to breast cancer (Long et al., 2012).
The genomic instability of the LATS1 chromosomal region and the LATS1 down-regulation that was associated with various types of tumors intrigued a study of SNPs and insertions/deletions (indels) within the LATS1 gene, as well as to assess the effect of these single-base-sequence alterations on LATS1 expression in urinary bladder. Because of regional prevalence of urinary bladder and colon cancer and the latter has been previously reported to be associated with LATS1 promoter hypermethylation (Wierzbicki et al., 2013), we selected these particular tissues. The aim of this study was achieved by scanning genomic LATS1 for SNPs and indels in urinary bladder and colon tissues from Egyptian patients. A total of 29 variants were identified, including 18 novel variants and 11 SNPs previously identified in the LATS1 gene (NCBI dbSNP Human Build 141, Released: 05/21/2014)1.
Materials and Methods
Patients and Tissue Samples
Tissue samples were collected from 28 patients (25 males and 3 females). Informed consent to use tissue excised from patients by the Pathology Department of Cairo University for the current study was obtained from the 28 patients' who voluntarily joined the study. Data of the collected specimen were analyzed anonymously. The Institutional Review Board (IRB) of the National Cancer Institute and the IRB of the American University in Cairo approved all research protocols, followed in this study. The patients mean age were 56.6 ± 12.8 (S.D) years. Based on patients histopathology records, the 28 patients were categorized into 4 groups; 3 normal urinary bladder tissues, 25 urinary bladder cancer tissues, 1 normal colon tissue and 3 Colon cancer tissues. The normal tissues were excised from the tissue surrounding tumor tissue and were used as control. All the 28 samples were used for SNPs detection and assessing microindels (≤10 nucleotides).
RNA Extraction, cDNA Synthesis, and PCR for Checking LATS1 Expression
Total RNA was extracted from tissues using Trizol reagent. DNase digestions were done for all samples using RQ1 RNase-Free DNase enzyme (Promega) to eliminate DNA contamination. One-step cDNA were performed using Access RT-PCR system (Promega) and GAPDH amplifications were performed to ensure that the extracted RNA was sufficient for PCR amplification following DNase digestion. This was followed by a two steps cDNA, using RevertAid H Minus First Strand cDNA Synthesis Kit (Fermentas), using random hexamer primers.
PCR was performed and the RNA steady state levels of LATS1 were normalized to GAPDH. Forward and reverse PCR primers were LATS1 Forward primer within exon 1, 5′- GCCTGGTGTTAAGGGGAGAG-3′, and reverse primer within exon 2, 5′- CAAGTCTTGAAGCATTTGTGGA-3′, and GAPDH Forward primer, 5′-TTAGCACCCCTGGCCAAGG-3′, and reverse primer, 5′CTTACTCCTTGGAGGCCATG-3′ (Lin et al., 2000). Expected PCR products sizes are LATS1 660 bp and GAPDH 541 bp.
DNA Extraction and PCR Amplification
Genomic DNA was extracted from all tissue samples using the DNeasy Blood & Tissue Kit (QIAGEN). Seven sets of primers were used to amplify the exons and the adjacent intronic region (~7000 bp). The primers utilized and the regions amplified are illustrated in Figure 1 and supplemental Table 1. Multiple PCR amplifications were done using FastStart High Fidelity PCR System (5 U/aphic data μL) (ROCHE). The PCR products were resolved on 1% agarose gels and purified using QIA quick Gel Extraction Kit (QIAGEN).
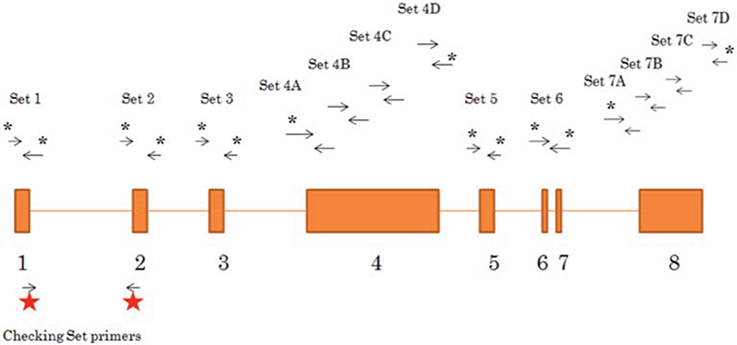
Figure 1. Schematic representation of primers sets used to amplify the LATS1 gene. 13 sets of primers were designed (sequence details shown in Supplemental Table 1) to amplify and sequence LATS1. Primer sets with an asterisk are the sets used for amplification and sequencing of the LATS1 8 exon and the adjacent 5′ and 3′ intronic region. The sets without an asterisk are used in the sequencing only. The primer sets used to assess LATS1 expression are presented with the red stars.
Restriction Fragment Length Polymorphism (RFLP) for PCR Amplicons
Prior to sequencing PCR products, RFLP was performed to confirm the LATS1 PCR amplified product. We used restriction digestion enzymes that didn't overlap with reported mutations retrieved from the NCBI LATS1 SNPs database. TAQαI, EcoRI, EcoRV, and EcoRI were used on PCR products of primer sets 1, 3, 5, and 6, respectively. DpnI was used with primer set 6 PCR amplicons that failed to digest with EcoRI, because DpnI restriction enzyme cuts fully-adenomethylated DNA. Primer sets 2, 4, and 8 PCR amplicons were directly sequenced. Products confirmed by RFLP (data not shown) were sequenced.
Sequencing
Sequencing was done using the BigDye Terminator v3.1 Cycle Sequencing Kit from Applied Biosystems. Each fragment from the 13 amplified portions of each sample (28 samples) was sequenced at least twice (using the forward and reverse primers). The sequences generated by the same primer pairs were assembled for each of the four-histopathology patient group. This would allow us to confirm single-base-sequence alterations in the sequence, from the Forward and Reverse sequence.
Data Analysis, Analysis Software: Polyphred
The LATS1 sequences of each sample, in each of the 4 groups; 1- Urinary Bladder Cancer, 2- normal peritumoral urinary Bladder, 3- colon cancer, and 4- normal peritumoral colon were assembled. Each group of sequences was aligned together and analyzed using PolyPhred software program Version 6.15 Beta. Only SNPs of rank 1 (97% for true positive SNP) and rank 2 (75% for true positive SNP) were considered. All SNPs identified by PolyPhred were compared to the NCBI LATS1 SNP database (Sherry et al., 2001). SNP identified in our study and match the NCBI LATS1 SNPs (NCBI dbSNP Human Build 141, Released: 05/21/2014) were considered an old SNP and those not matching the SNP database were considered new variants.
Codon found to have SNPs were checked manually for the amino acid it encodes and compared to the wild type version. single-base-sequence alterations were checked for biological significance to determine overlap with the Serine/Threonine kinases catalytic domain. Additionally small indels (insertions/deletions) of length 10 base pairs or less were analyzed using PolyPhred.
Bioinformatic Analysis
TRANSFAC Database Match tool (Kel et al., 2003; Matys et al., 2006) was used to annotate the potential transcription factor (TF) binding sites within the LATS1 gene using the positional weight matrices database derived from the experimentally-proven binding sites. Genome Trax™ (www.biobase-international.com/genome-trax) analysis from BIOBASE Corporation was used to map the SNPs/variants to the potential regulatory regions in the LATS1 gene. Softberry-SNP-effect1 (Softberry Inc., www.softberry.com) was used to predict the potential impact of the SNPs/variants on the protein structure.
Results
LATS1 Amplification and Sequencing
Peritumoral urinary bladder tissues, urinary bladder cancer tissues, peritumoral colon tissue and colon cancer tissues were collected from 28 patients suffering from urinary bladder cancer or colon cancer. Table 1 summarizes patients' clinical characteristics. The genomic DNA from the tissues were extracted, fragments of LATS1 were amplified and sequenced followed by analysis of SNPs and indels and microindels. Primers used to amplify the LATS1 gene are listed in supplemental Table 1 and presented in Figure 1. RFLP was utilized to confirm the amplicons of exons 1, 3, 5, 6, and 7 prior to sequencing (Supplemental Table 2). Alignment of LATS1 amplicon/sequences to previously reported LATS1 gene was performed and all LATS1 amplicon/sequences aligned to their respective position.
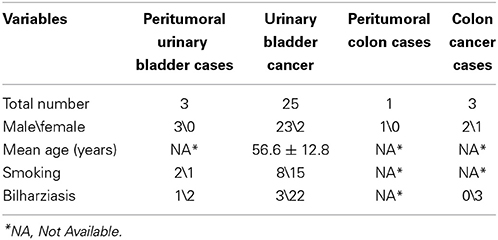
Table 1. The clinical characteristics of patients in the study.
Identification of the LATS1 Variants Including Single Nucleotide Polymorphisms (SNPs)
A total of 29 SNPs/variants were identified in the LATS1 gene. Among these 29 SNPs, 18 were novel variants and 11 SNPs were previously identified in the LATS1 gene in earlier studies (Table 2). Seven SNPs/variants were identified in the coding region of the LATS1 gene (Table 2). While, the other 22 SNPs/variants were in the non-coding region of the gene, including 5′UTR, introns and 3′UTR. Interestingly certain SNPs/variants were associated with a particular type of tissue; two variants were only found in the LATS1 gene of the urinary bladder cancer tissues, six peritumoral specific variants were found in the LATS1 of the peritumoral urinary bladder tissues, another six peritumoral specific SNPs/variants were found only in the peritumoral colon cancer tissues and four variants were identified in the colon cancer tissues (Table 2). Other SNPs/variants were not tissue-specific, and were common between different tissue types. For instance, 4 SNPs were identified in the urinary bladder cancer as well as peritumoral urinary bladder tissues and 5 SNPs/variants were identified in the peritumoral and cancerous colon tissues.
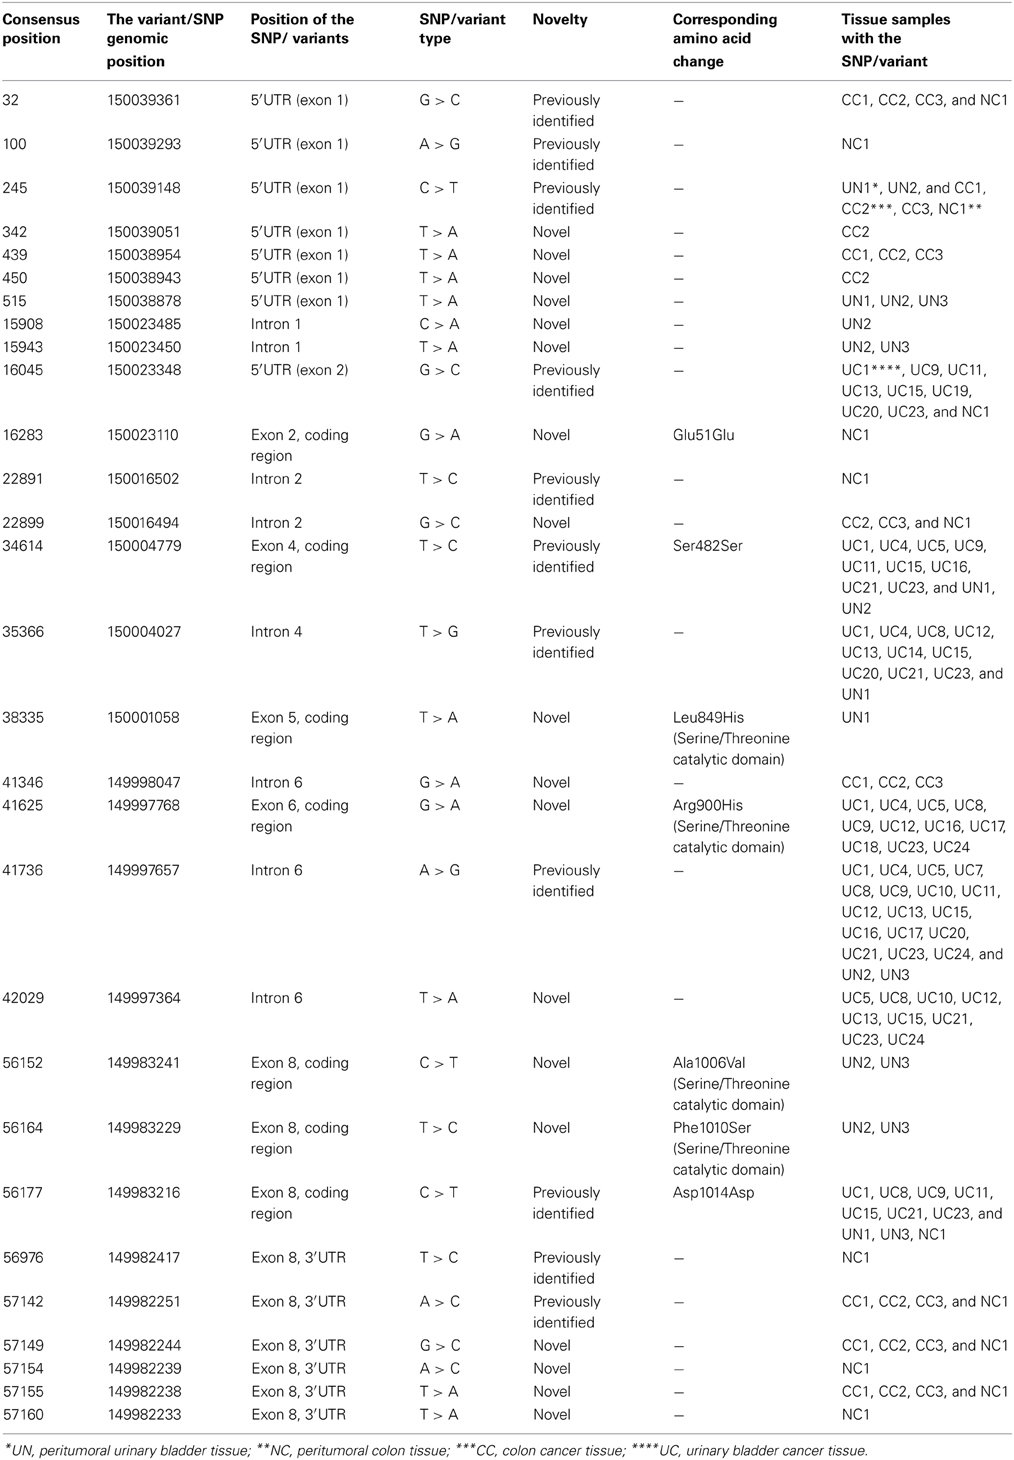
Table 2. Summary of the SNPs/variants detected in the LATS1 gene.
The seven SNPs/variants identified in the coding region of LATS1, comprise 3 SNPs/variants encoding silent mutations and 4 variants encoding missense mutations (Table 2). The missense variants result in alteration of 4 different amino acids within the Serine/Threonine catalytic domain of the LATS1 protein. The novel variant at consensus position 38335, within exon 5, was identified only in a peritumoral urinary bladder tissue (UN1). This variant resulted in the replacement of leucine amino acid with a histidine amino acid, at amino acid position 849, within the Serine/Threonine catalytic domain. On the other hand, the novel variant at consensus position 41625, located at exon 6 of the LATS1 gene, was only detected in urinary bladder cancer tissues. This resulted in alteration of an arginine amino acid into histidine at the amino acid position 900, located at the Serine/Threonine catalytic domain of the LATS1 protein. The peritumoral urinary bladder tissues showed another two novel variants at exon 8 that resulted in two missense mutations within the LATS1 protein. These Serine/Threonine catalytic domain variants mutates alanine to valine at amino acid position 1006, and phenylalanine to serine at amino acid position 1010 (Table 2).
The three SNPs/variants within the coding region that caused silent mutations includes a novel variant found in the peritumoral colon tissue at consensus 16283 in exon 2 (G > A) and encodes for glutamic acid (Table 2). The two other silent SNPs include a previously identified SNP at exon 4, detected in urinary bladder cancer and peritumoral urinary bladder tissues, and a previously identified SNP at exon 8 detected in the cancerous, peritumoral urinary bladder tissues as well as peritumoral colon tissue. These single-base-sequence alterations at consensus 34614 in exon 4 (T > C) and consensus 56177 in exon 8 (C > T) encode for serine and aspartic acid, respectively (Table 2).
Majority of the 22 SNPs/variants identified within the non-coding region of the LATS1 gene were located in both the 5′ and 3′UTRs. There were 8 SNPs/variants detected within exon 1 and 2 that corresponds to the 5′ UTR region, 6 SNPs/variants within the 3′UTR within exon 8 and 8 SNPs/variants within the introns 1, 2, 4, and 6 of the LATS1 gene (Table 2). Among the eight SNPs/variants at the 5′UTR, 3 newly identified variants were only detected in the colon cancer tissues (Table 2). Of the eight SNPs/variants identified in the intronic regions (Table 2), only three SNPs were previously reported. Two SNPs located within intron 1 of the LATS1 gene were only detected in the peritumoral urinary bladder tissues. Five new variants were found in the 3′UTR region (exon 8) and were only detected in colon cancer and peritumoral colon tissue groups suggesting that they could be tissue specific.
Sequence Transposition within the LATS1 Gene
Primer set 5P (shown in Supplemental Table 1), designed to align to exon 4 at consensus position 34481–34965 on the genomic DNA, aligned to intron 5 to intron 7 of the LATS1 gene in one of the three examined colon cancer tissues. This suggests that in this sample exon 4 of the LATS1 gene was shifted to a new position between intron 5 to intron 7 of the LATS1 gene in this colon cancer sample. Note that the remaining 25 urinary bladder cancer tissues and two colon cancer tissues amplified the intended exonic region.
The Expression of LATS1 Gene Harboring Different SNPs/Variants
To assess if the various SNPs/variants alter the expression of the LATS1 gene, we examined the RNA steady state levels of LATS1 in the different urinary bladder cancer tissues utilized in this study (Figure 2). The LATS1 gene was differentially expressed in the different tissues. A urinary bladder cancer tissue sample (UC13) showed higher levels of the LATS1 expression compared with peritumoral tissue and urinary bladder cancer tissue without any variation within the LATS1 gene (UC6) (Figure 2). Nevertheless, LATS1 RNA steady state levels were not observed in 3 urinary bladder cancer tissue samples (UC1, UC11, and UC15). The urinary bladder tissue samples examined, comprises LATS1 gene with different SNPs/variants, showed different levels of LATS1 gene expression.
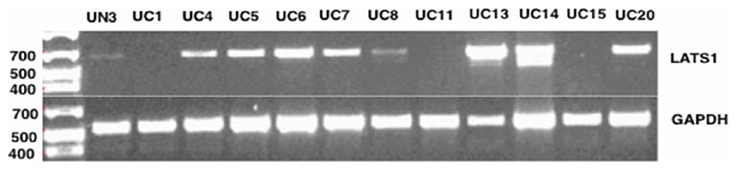
Figure 2. LATS1 expressions analysis using PCR. LATS1 expression was examined in urinary bladder cancer tissues (UC), peritumoral urinary bladder (UN). UC6 did not contain any SNP in the LATS1 gene. UC7 showed SNP at 41736; UC14 harbors SNP at 35366; UC1 has SNPs/variants at 16045, 34614, 35366, 41625, 41736, and 56177; UC4 has SNPs/variants at 34614, 35366, 41625, and 41736; UC5 has SNPs/variants at 34614, 41625, 41736, and 42029; UC8 has SNPs/variants at 35366, 41625, 41736, 42029, and 56177; UC11 has SNPs at 16045, 34614, 41736, and 56177; UC13 harbors SNPs/variants at 16045, 35366, 41736, and 42029; UC 15 harbors SNPs/variants at 16045, 34614, 35366, 41736, 42029, and 56177; UC 20 harbors SNPs at 16045, 35366, and 41736. UN3 harbors SNPs/variants at 515, 15943, 41736, 56177, 56152, and 56164. GAPDH was used as an endogenous control. Generuler 1 Kb Plus DNA Ladder (Fermentas®) was used as a size marker.
A total of seven SNPs/variants were identified in the urinary bladder cancerous tissues (Table 3). All of these SNPs/variants have a representative sample that was examined for the LATS1 expression. The urinary bladder cancerous tissue (UC6), that did not comprise any variation within the LATS1 gene, expressed LATS1. Three urinary bladder cancerous tissues (UC1, 11, and 15) did not express the LATS1 gene. These three samples were the only samples that contained the combination of four previously identified SNPs at positions 16045, 34614, 41736, and 56177. The SNPs at consensus position 16045 and 41736 are located within the 5′UTR and intron 6, respectively. The other two SNPs (positions 34614 and 56177) represented missense mutations located at exon 4 and exon 8, respectively.
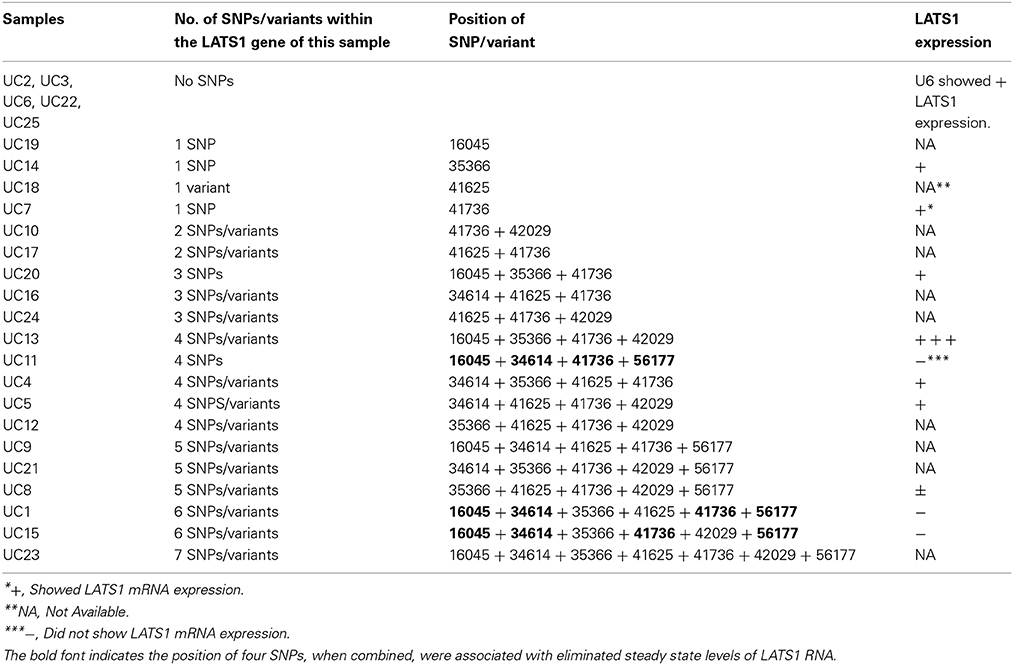
Table 3. Summary of the SNPs/variants detected in the LATS1 of the urinary bladder cancerous tissues.
Identification of the Potential Regulatory Regions within the LATS1 Gene
The differential expression of the LATS1 mRNA in the urinary bladder cancer tissues that shared LATS1 SNPs/variants suggested a role for the SNPs/variants (in non-coding regions) in LATS1 expression. In silico analysis of the LATS1 sequence using Transfac database identified TF binding including GEN_INI, AP-2alphaA, ZNF263, p53, ZF5, CDP CR1, and Nanog, that overlap with five SNPs/variants (5′UTR), located at positions 100, 342, 439, 450, and 16045 (Table 4). Using Genome Trax to map the SNPs/variants to potential regulatory regions in the LATS1 sequence revealed CpG_islands that overlap with seven SNPs/variants (5′UTR) (Table 4). The position of other non-coding SNPs/variants at intron-2, 4, and 6 as well as at 3′UTR overlap with potential binding sites for several TFs including FAC1, GR, HNF-3beta, ardi5a, Zfp105, RBP-Jkappa, Xvent-1, RREB-1, Sp1, RREB-1, GKLF, Churchill, GKLF, CPBP, SF-1, Nanog, RUSH-1alpha, SOX10, and SRY (Table 4).
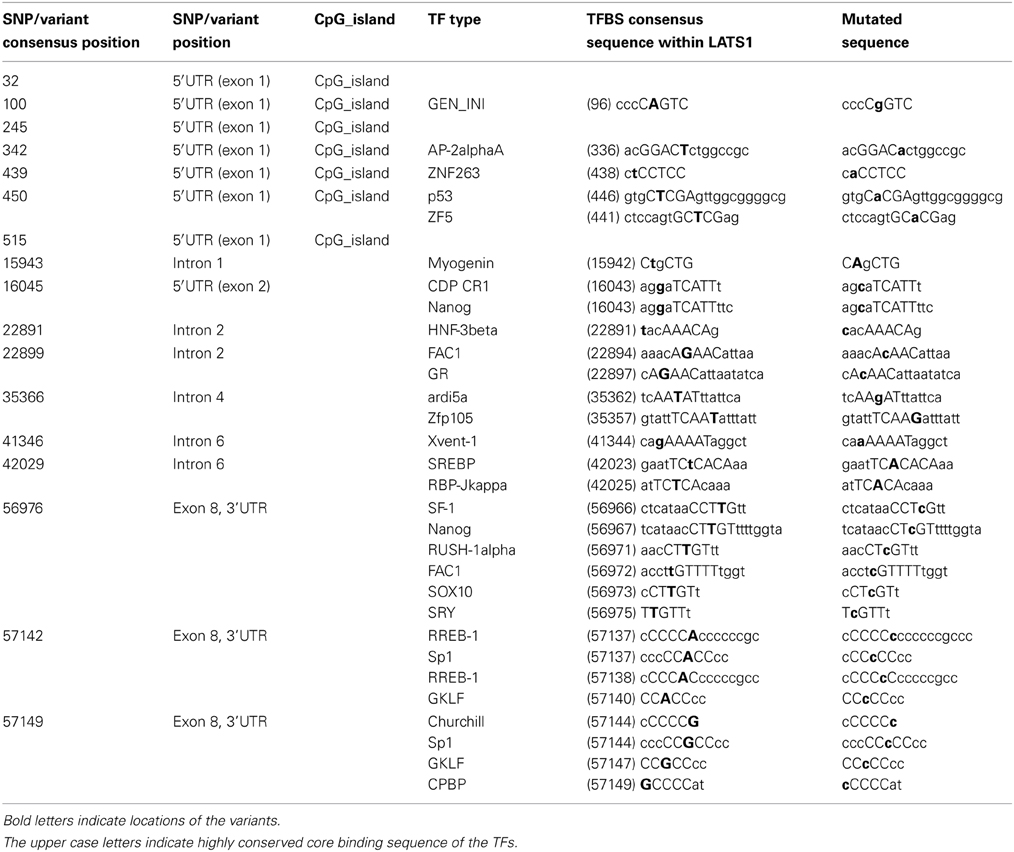
Table 4. The reported LATS1 SNPs/variants that were mapped to the TF-binding regions predicted by Transfac database (Kel et al., 2003; Matys et al., 2006).
To predict the effect of the SNPs/variants, located at the coding regions, on the LATS1 protein structure, we used Softberry-SNP-effect in silico tool to assess the impact of amino-acid alterations. Four missense mutations and a single silent mutation were reported in the serine-threonine catalytic domain. These five single-base-sequence alterations, which are Leu849His, Arg900His, Ala1006Val, Phe1010Ser, and Asp1014Asp, were predicted to produce a damaged protein. On the other hand, the two silent mutations, Glu51Glu, and Ser482Ser, that are located at LATS Conserved Domain-1 and LATS Conserved Domain-2, respectively, were predicted to be tolerated sequences for the protein.
Discussion
The large tumor suppressor 1 (LATS1) is inactivated in various tumor types encompassing soft tissue sarcomas, and adenoid cystic carcinoma, as well as, breast, lung, prostate and esophageal cancers. The inactivation of the LATS1 could be initiated by allelic loss of heteozygosity, gene deletion, point mutation or hyper-methylation of the promoter region. However, LATS1 mutations and biological significance in cancers remain unidentified. This study examines the genomic LATS1 region for single-base-sequence alterations in urinary bladder and colon cancer tissues.
We have therefore designed 13 primer sets to amplify and sequence the genomic LATS1 fragments including the eight exons of the LATS1 gene, the adjacent intronic region, the exon-intron boundaries, the 5′UTR and the 3′UTR (Figure 1). This allowed us to screen for single-base-sequence alterations that could disrupt the regulatory regions, the alternative splicing sites or the coding regions in urinary bladder and colon tumors. The sequenced 13 amplified fragments of the 28 tissue samples were assembled and compared to the LATS1 sequence on the NCBI (NC_000006.1). We detected 29 variants/SNPs within the LATS1 gene in urinary bladder and colon tumors, including 18 novel variants and 11 previously identified SNPs (Table 2). Certain SNPs/variants were specifically detected in either urinary bladder or colon tissues and other were detected in both tissue types.
Among these 29 SNPs/variants, there were 22 SNPs/variants within the non-coding region (introns and UTRs) and seven SNPs/variants located within the coding region of the LATS1 gene including three silent and four missense SNPs/variants. All the reported missense variants are located within the Serine/Threonine catalytic domain of the LATS1 protein (Table 2). These four missense variants altered four amino acids at amino acid position L849H, R900H, at A1006V and at F1010S within the Serine/Threonine catalytic domain at amino acid position 708–1130 on the LATS1 protein (Table 2). The missense mutation L849H was also detected in stomach cancer (data not shown). These variants are likely to influence the activity of the tumor suppressor gene LATS1 through changing the amino acid sequence of its' catalytic domain. Although the functionality of the LATS1 protein with the genotyped SNPs/variants remains unidentified, the results reveal an association of these missense variants with the peri-tumoral and tumor tissues that may impact the tumor suppressor activity of LATS1. The other three SNPs/variants at the exons region of exon 2 (A/G), exon 4 (C/T), and exon 8 (T/C) were silent and did not alter the amino acid sequence of the encoded LATS1 protein.
We identified 22 SNPs/variants at the LATS1 non-coding region including eight at the 5′UTR, six at the 3′UTR, and eight at intronic regions. We scanned the intron-exon boundaries and the possible SNPs/variants that may affect the alternative splicing. However, none of the reported SNPs/variants were located at splice sites. SNPs/variants at non-coding regions may alter LATS1 expression and affect the consequent post-transcription regulation of the downstream genes. These SNPs/variants could have interrupted an essential regulatory region of LATS1. Therefore, we examined the RNA steady state levels of LATS1 in the urinary bladder cancer tissues as representatives of different SNPs/variants within the LATS1 gene. However, further studies are desirable to analyze the consequences of the LATS1 non-coding SNPs/variants on the LATS1 activity. That being said, in the present study we observe an association of these SNPs/variants with the differential expression of LATS1 in urinary bladder tumors (Figure 2).
Moreover, a transposition of exon 4 into another position at intron 5 to intron 7 of the LATS1 gene was observed in a colon cancer tissue. This transposition within the LATS1 gene alters the amino acid sequence of the Serine/Threonine catalytic domain of LATS1 protein and may result in LATS1 inactivation in colon cancer. The steady state levels of LATS1 RNA was examined using PCR primers that cover the region from second half of exon 1 to first half of exon 2, which allows detection of the two isoforms of the LATS1 mRNA (Figure 1). One limitation in this study is the lack of information on LATS1 expression levels for the entire cohort. However, a total of seven different SNPs/variants were reported in urinary bladder cancerous tissues and all of them had representative tissue that was examined for the RNA steady state levels of LATS1 (Table 3). A urinary bladder cancerous tissue (UC6) that did not encompass any SNPs/variants showed LATS1 expression (Figure 2). On the other hand, the urinary bladder cancerous tissues (UC1, 11, and 15) that shared SNPs at 16045, 34614, 41736, and 56177, appear to have similar LATS1-gene-expression-profile alteration (Figure 2). The results suggested that these combined SNPs likely contribute to the disruption of LATS1 RNA steady state levels. On the other hand, the urinary bladder cancer tissue (UC13) that encompass four SNPs/variants at 16045, 35366, 41736, and 42029, which are located at the 5′UTR and introns regions, showed high expression levels of the LATS1 gene compared to the urinary bladder cancer tissue without LATS1 SNPs/variants (UC6). The urinary bladder cancerous tissue (UC8) showed remarkably low levels of LATS1 mRNA (Figure 2). Five SNPs/variants were reported within the LATS1 of UC8 at position 35366, 41625, 41736, 42029, and 56177, resulting in three SNPs/variants in the introns 4 and 6, besides a silent SNP within exon 8 and a missense variant within exon 6 that encodes for the catalytic domain. Moreover, we observed that the examined samples that encompass the SNP at position 56177 within exon 8 of LATS1, which resulted in silent mutation in the LATS1 catalytic domain, showed very low or no LATS1 expression, including the peritumoral urinary bladder tissue UN3 as well as the urinary bladder cancerous tissues UC1, UC8, UC11, and UC15. These observations emphasize the impact of each single single-base-sequence alterations may have on the tumor suppressor LATS1 gene expression in cancer, as well as the contribution of these SNPs/variants in LATS1 inactivation and the subsequent increased risk of urinary bladder and colon malignancies.
The differential expression of the LATS1 mRNA in the urinary bladder cancer tissues that shared LATS1 SNPs/variants urged us to assess potential roles for SNPs/variants in the non-coding regions of LATS1 on its expression. In silico analysis of the LATS1 sequence using Transfac database revealed that the SNPs/variants interrupt several consensus TFs binding sites (Table 4). Such SNPs/variants may disrupt the binding of the cognate TF. TRANSFAC identified five SNPs/variants to overlap with predicted binding sites of various TFs. Genome Trax identified CpG_islands, which were mapped to seven SNPs/variants at the 5′UTR (Table 4). The analysis identified SNPs/variants that disrupted the TF recognition sequence of one TF but maintained the binding of another TF. For instance the SNP at 35366, allowed Zfp105 TF binding but resulted in loss of the ardi5a binding site, a TF that stimulates histone acetylation. The variant at 15943, which is located within LATS1 intron 1, did not interrupt a regulatory region. However, this mutation generated the core sequence (CAgCTG) for the binding of Myogenin TF, which is a TF that regulates cell cycle and stem cell proliferation and was associated with various types of tumors including rhabdo-myosarcoma, liver neoplasms, soft tissues neoplasms, and neuroectodermal tumors (Figure 3A) (Wang et al., 1995; Meyer and Brinck, 1997; Kumar et al., 2000; Kobayashi et al., 2004). Likewise, a variant at intron 6, located at consensus position 42029, created the consensus sequence for the binding of the TF SREBP (Figure 3B). The effect of this variant could have contributed to LATS1 over-expression observed with the urinary bladder cancer tissue (UC13), at which the variant at 42029 was reported. Therefore, such SNPs/variants may be the aberrant building blocks that disrupt cellular mechanisms and contribute to the urinary bladder and colon malignances.
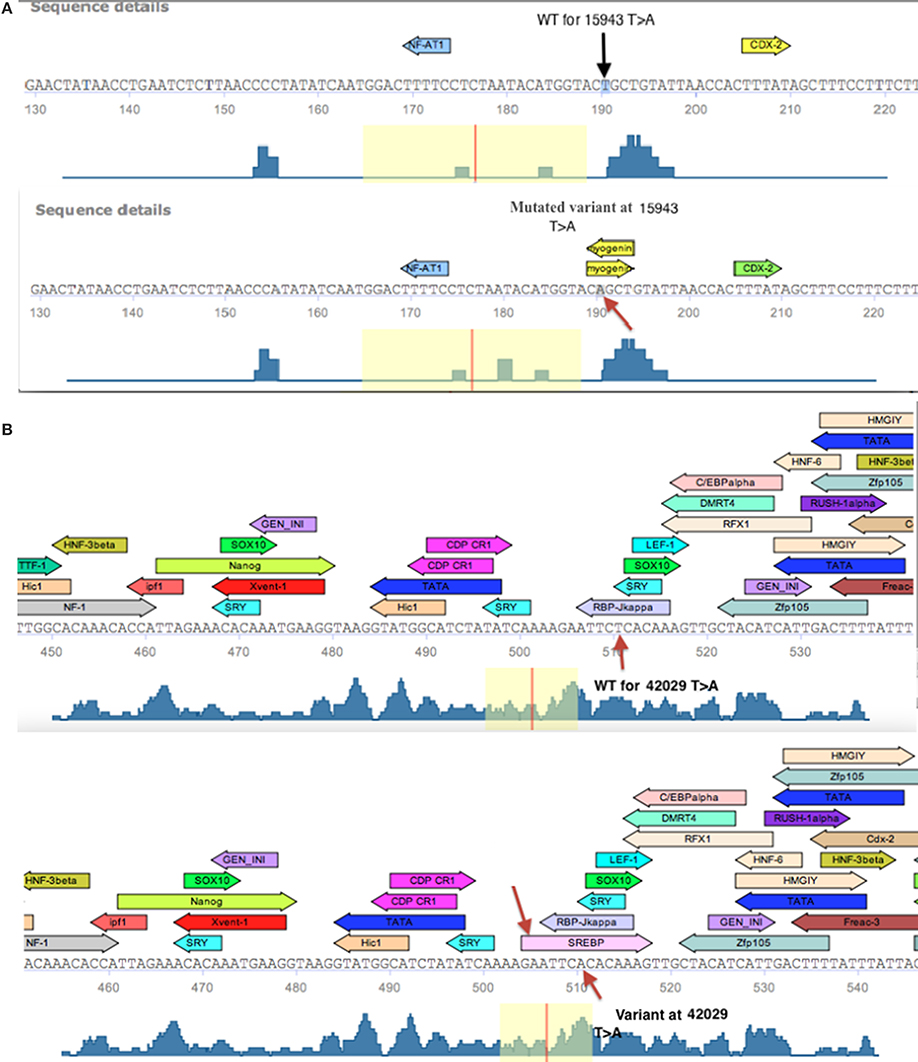
Figure 3. Schematic diagram of the Transfac predicted TF binding sites within a fragment of LATS1 gene. (A) Transfac diagram of the wild type (WT) fragment of LATS1 intron-1 that depicts the myogenin transcription factor-binding site as created by the variant at consensus position 15943. (B) Diagram of the depicted SREBP TF binding site that is generated by the variant at 42029 (indicated by an arrow) at LATS1 intron-6 as well as the predicted TF binding sites that were interrupted by the variant (Kel et al., 2003; Matys et al., 2006).
We report alterations of single base pairs in the LATS1 gene, of Egyptian patients with urinary bladder and colon cancer tissues. Additionally, we identified novel variants within the LATS1 gene that contributed to the down regulation of its mRNA expression in urinary bladder tissues. LATS1 variants and its' relationship to ethnicity hasn't been previously addressed. Therefore, we cannot deduce that the novel variants identified would be different from other racial populations. However, this study reveals the significance of the tumor suppressor activity of LATS1 and highlights the association of LATS1 single-base-sequence alterations with urinary bladder and colon tumors. Nonetheless, further studies need to be conducted with relatively larger sample size and evaluate the functionality of the LATS1 protein with the detected SNPs/variants.
Author Contributions
Mona K. Saadeldin carried out the molecular studies, data analyses and participated in drafting the manuscript. Heba Shawer carried out the proteomic studies, participated in data analyses and drafting the manuscript. Ahmed Mostafa provided/collected specimens that were used to accumulate data. Neemat M. Kassem participated in the experimental design. Rania Siam and Asma Amleh conceived the study, participated in its design, data analyses and drafted the manuscript to a publishable form. All authors read and approved the final manuscript.
Conflict of Interest Statement
The authors declare that the research was conducted in the absence of any commercial or financial relationships that could be construed as a potential conflict of interest.
Acknowledgments
This work was supported by an American University in Cairo Internal Faculty Research Grant to Rania Siam and a Graduate Student Research Grant to Mona K. Saadeldin. We thank Rasha Elreedy for technical discussions and Peter Refki for technical assistance and advice and Mustafa Adel for computational analysis.
Supplementary Material
The Supplementary Material for this article can be found online at: http://www.frontiersin.org/journal/10.3389/fgene.2014.00425/abstract
Footnotes
1. ^Database of Single Nucleotide Polymorphisms (dbSNP). Bethesda, MD: National Center for Biotechnology Information, National Library of Medicine. Available online at: http://www.ncbi.nlm.nih.gov/SNP/
Abbreviations
SNPs, single nucleotide polymorphisms; LATS, large tumor suppressor gene; MST1/2, mammalian Ste20-like serine/threonine kinases 1 and 2; YAP, yes-associated protein; BAX, Bcl-2-associated X; GWAS, genome-wide association study; Indels: insertions/deletions; UN, urinary bladder peritumoral tissue; NC, peritumoral colon tissue; CC, colon cancer tissue; UC, urinary bladder cancer tissue; CDC2, Cell Division Control; TF, transcription factor.
References
Hansen, L. L., Jensen, L. L., Dimitrakakis, C., Michalas, S., Gilbert, F., Barber, H. R., et al. (2002). Allelic imbalance in selected chromosomal regions in ovarian cancer. Cancer Genet. Cytogenet. 139, 1–8. doi: 10.1016/S0165-4608(02)00620-9
Pubmed Abstract | Pubmed Full Text | CrossRef Full Text | Google Scholar
Hao, Y., Chun, A., Cheung, K., Rashidi, B., and Yang, X. (2008). Tumor suppressor LATS1 is a negative regulator of oncogene YAP. J. Biol. Chem. 283, 5496–5509. doi: 10.1074/jbc.M709037200
Pubmed Abstract | Pubmed Full Text | CrossRef Full Text | Google Scholar
Harvey, K., and Tapon, N. (2007). The salvadorÄìWartsÄìHippo pathwayÄîan emerging tumour-suppressor network. Nat. Rev. Cancer 7, 182–191. doi: 10.1038/nrc2070
Pubmed Abstract | Pubmed Full Text | CrossRef Full Text | Google Scholar
Hisaoka, M., Tanaka, A., and Hashimoto, H. (2002). Molecular alterations of h-warts/LATS1 tumor suppressor in human soft tissue sarcoma. Lab. Invest. 82, 1427–1435. doi: 10.1097/01.LAB.0000032381.68634.CA
Pubmed Abstract | Pubmed Full Text | CrossRef Full Text | Google Scholar
Ji, T., Liu, D., Shao, W., Yang, W., Wu, H., and Bian, X. (2012). Decreased expression of LATS1 is correlated with the progression and prognosis of glioma. J. Exp. Clin. Cancer Res. 31:67. doi: 10.1186/1756-9966-31-67
Pubmed Abstract | Pubmed Full Text | CrossRef Full Text | Google Scholar
Jiang, Z., Li, X., Hu, J., Zhou, W., Jiang, Y., Li, G., et al. (2006). Promoter hypermethylation-mediated down-regulation of LATS1 and LATS2 in human astrocytoma. Neurosci. Res. 56, 450–458. doi: 10.1016/j.neures.2006.09.006
Pubmed Abstract | Pubmed Full Text | CrossRef Full Text | Google Scholar
Kel, A. E., Gössling, E., Reuter, I., Cheremushkin, E., Kel-Margoulis, O. V., and Wingender, E. (2003). MATCH: A tool for searching transcription factor binding sites in DNA sequences. Nucleic Acids Res. 31, 3576–3579.
Kobayashi, M., Sakai, H., Hirata, A., Yonemaru, K., Yanai, T., Watanabe, K., et al. (2004). Expression of myogenic regulating factors, myogenin and MyoD, in two canine botryoid rhabdomyosarcomas. Vet. Pathol. 41, 275–277. doi: 10.1354/vp.41-3-275
Pubmed Abstract | Pubmed Full Text | CrossRef Full Text | Google Scholar
Koed, K., Wiuf, C., Christensen, L.-L., Wikman, F. P., Zieger, K., Møller, K., et al. (2005). High-density single nucleotide polymorphism array defines novel stage and location-dependent allelic imbalances in human bladder tumors. Cancer Res. 65, 34–45.
Kumar, S., Perlman, E., Harris, C. A., Raffeld, M., and Tsokos, M. (2000). Myogenin is a specific marker for rhabdomyosarcoma: an immunohistochemical study in paraffin-embedded tissues. Mod. Pathol. 13, 988–993. doi: 10.1038/modpathol.3880179
Pubmed Abstract | Pubmed Full Text | CrossRef Full Text | Google Scholar
Lin, K.-I., Lin, Y., and Calame, K. (2000). Repression of c-myc is necessary but not sufficient for terminal differentiation of B lymphocytes in vitro. Mol. Cell. Biol. 20, 8684–8695. doi: 10.1128/MCB.20.23.8684-8695.2000
Pubmed Abstract | Pubmed Full Text | CrossRef Full Text | Google Scholar
Long, J., Cai, Q., Sung, H., Shi, J., Zhang, B., Choi, J.-Y., et al. (2012). Genome-wide association study in East Asians identifies novel susceptibility loci for breast cancer. PLoS Genet. 8:e1002532. doi: 10.1371/journal.pgen.1002532
Pubmed Abstract | Pubmed Full Text | CrossRef Full Text | Google Scholar
Matys, V., Kel-Margoulis, O. V., Fricke, E., Liebich, I., Land, S., Barre-Dirrie, A., et al. (2006). TRANSFAC¬Æ and its module TRANSCompel¬Æ: transcriptional gene regulation in eukaryotes. Nucleic Acids Res. 34, D108–D110. doi: 10.1093/nar/gkj143
Pubmed Abstract | Pubmed Full Text | CrossRef Full Text | Google Scholar
Meyer, T., and Brinck, U. (1997). Expression of myogenic marker proteins in human leiomyosarcoma. APMIS 105, 793–800. doi: 10.1111/j.1699-0463.1997.tb05085.x
Pubmed Abstract | Pubmed Full Text | CrossRef Full Text | Google Scholar
Nishiyama, Y., Hirota, T., Morisaki, T., Hara, T., Marumoto, T., Iida, S.-I., et al. (1999). A human homolog of Drosophila warts tumor suppressor, h-warts, localized to mitotic apparatus and specifically phosphorylated during mitosis. FEBS Lett. 459, 159–165. doi: 10.1016/S0014-5793(99)01224-7
Pubmed Abstract | Pubmed Full Text | CrossRef Full Text | Google Scholar
Oka, T., Mazack, V., and Sudol, M. (2008). Mst2 and Lats kinases regulate apoptotic function of Yes kinase-associated protein (YAP). J. Biol. Chem. 283, 27534–27546. doi: 10.1074/jbc.M804380200
Pubmed Abstract | Pubmed Full Text | CrossRef Full Text | Google Scholar
Rutherford, S., Yu, Y., Rumpel, C. A., Frierson, Jr. H. F., and Moskaluk, C. A. (2006). Chromosome 6 deletion and candidate tumor suppressor genes in adenoid cystic carcinoma. Cancer Lett. 236, 309–317. doi: 10.1016/j.canlet.2005.05.049
Pubmed Abstract | Pubmed Full Text | CrossRef Full Text | Google Scholar
Sachidanandam, R., Weissman, D., Schmidt, S. C., Kakol, J. M., Stein, L. D., Marth, G., et al. (2001). A map of human genome sequence variation containing 1.42 million single nucleotide polymorphisms. Nature 409, 928–933. doi: 10.1038/35057149
Pubmed Abstract | Pubmed Full Text | CrossRef Full Text | Google Scholar
Sherry, S. T., Ward, M.-H., Kholodov, M., Baker, J., Phan, L., Smigielski, E. M., et al. (2001). dbSNP: the NCBI database of genetic variation. Nucleic Acids Res. 29, 308–311. doi: 10.1093/nar/29.1.308
Pubmed Abstract | Pubmed Full Text | CrossRef Full Text | Google Scholar
St John, M. A., Tao, W., Fei, X., Fukumoto, R., Carcangiu, M. L., Brownstein, D. G., et al. (1999). Mice deficient of Lats1 develop soft-tissue sarcomas, ovarian tumours and pituitary dysfunction. Nat. Genet. 21, 182–186. doi: 10.1038/7741
Pubmed Abstract | Pubmed Full Text | CrossRef Full Text | Google Scholar
Takahashi, Y., Miyoshi, Y., Takahata, C., Irahara, N., Taguchi, T., Tamaki, Y., et al. (2005). Down-regulation of LATS1 and LATS2 mRNA expression by promoter hypermethylation and its association with biologically aggressive phenotype in human breast cancers. Clin. Cancer Res. 11, 1380–1385. doi: 10.1158/1078-0432.CCR-04-1773
Pubmed Abstract | Pubmed Full Text | CrossRef Full Text | Google Scholar
Tao, W., Zhang, S., Turenchalk, G. S., Stewart, R. A., St John, M. A., Chen, W., et al. (1999). Human homologue of the Drosophila melanogaster lats tumour suppressor modulates CDC2 activity. Nat. Genet. 21, 177–181. doi: 10.1038/5960
Pubmed Abstract | Pubmed Full Text | CrossRef Full Text | Google Scholar
Visser-Grieve, S., Zhou, Z., She, Y.-M., Huang, H., Cyr, T. D., Xu, T., et al. (2011). LATS1 tumor suppressor is a novel actin-binding protein and negative regulator of actin polymerization. Cell Res. 21, 1513. doi: 10.1038/cr.2011.122
Pubmed Abstract | Pubmed Full Text | CrossRef Full Text | Google Scholar
Wang, N. P., Marx, J., McNutt, M. A., Rutledge, J. C., and Gown, A. M. (1995). Expression of myogenic regulatory proteins (myogenin and MyoD1) in small blue round cell tumors of childhood. Am. J. Pathol. 147, 1799–1810.
Wierzbicki, P. M., Adrych, K., Kartanowicz, D., Stanislawowski, M., Kowalczyk, A., Godlewski, J., et al. (2013). Underexpression of LATS1 TSG in colorectal cancer is associated with promoter hypermethylation. World J. Gastroenterol. 19:4363. doi: 10.3748/wjg.v19.i27.4363
Pubmed Abstract | Pubmed Full Text | CrossRef Full Text | Google Scholar
Xia, H., Qi, H., Li, Y., Pei, J., Barton, J., Blackstad, M., et al. (2002). LATS1 tumor suppressor regulates G2/M transition and apoptosis. Oncogene 21, 1233–1241. doi: 10.1038/sj.onc.1205174
Pubmed Abstract | Pubmed Full Text | CrossRef Full Text | Google Scholar
Yabuta, N., Fujii, T., Copeland, N. G., Gilbert, D. J., Jenkins, N. A., Nishiguchi, H., et al. (2000). Structure, expression, and chromosome mapping of LATS2, a mammalian homologue of the Drosophila tumor suppressor gene lats/warts. Genomics 63, 263–270. doi: 10.1006/geno.1999.6065
Pubmed Abstract | Pubmed Full Text | CrossRef Full Text | Google Scholar
Yabuta, N., Okada, N., Ito, A., Hosomi, T., Nishihara, S., Sasayama, Y., et al. (2007). Lats2 is an essential mitotic regulator required for the coordination of cell division. J. Biol. Chem. 282, 19259–19271. doi: 10.1074/jbc.M608562200
Pubmed Abstract | Pubmed Full Text | CrossRef Full Text | Google Scholar
Keywords: urinary bladder cancer, colon cancer, LATS1, genetic variants, tumor suppressor
Citation: Saadeldin MK, Shawer H, Mostafa A, Kassem NM, Amleh A and Siam R (2015) New genetic variants of LATS1 detected in urinary bladder and colon cancer. Front. Genet. 5:425. doi: 10.3389/fgene.2014.00425
Received: 25 July 2014; Accepted: 19 November 2014;
Published online: 13 January 2015.
Edited by:
Ashani Weeraratna, The Wistar Institute, USAReviewed by:
R. Krishna Murthy Karuturi, The Jackson Laboratory, USAMichael O'Connell, The Wistar Institute, USA
Copyright © 2015 Saadeldin, Shawer, Mostafa, Kassem, Amleh and Siam. This is an open-access article distributed under the terms of the Creative Commons Attribution License (CC BY). The use, distribution or reproduction in other forums is permitted, provided the original author(s) or licensor are credited and that the original publication in this journal is cited, in accordance with accepted academic practice. No use, distribution or reproduction is permitted which does not comply with these terms.
*Correspondence: Asma Amleh, Biotechnology Department and Biology Department, American University in Cairo, AUC Avenue, New Cairo 11835, Egypt e-mail:YWFtbGVoQGF1Y2VneXB0LmVkdQ==;
Rania Siam, Biotechnology Department, Biology Department and YJ-Science and Technology Research Center, American University in Cairo, AUC Avenue, New Cairo 11835, Egypt e-mail:cnNpYW1AYXVjZWd5cHQuZWR1