 M. Doroteia Campos1
 Amaia Nogales1
 Hélia G. Cardoso1*
 Sarma R. Kumar1,2
 Tânia Nobre1
 Ramalingam Sathishkumar3
 Birgit Arnholdt-Schmitt1*
- 1EU Marie Curie Chair, ICAAM – Instituto de Ciências Agrárias e Ambientais Mediterrânicas, IIFA-Instituto de Formação e Investigação Avançada, Universidade de Évora, Évora, Portugal
- 2Molecular Plant Biology and Biotechnology Division, Council of Scientific and Industrial Research–Central Institute of Medicinal and Aromatic Plants Research Centre, Bangalore, India
- 3Plant Genetic Engineering Laboratory, Department of Biotechnology, Bharathiar University, Coimbatore, India
Stress-adaptive cell plasticity in target tissues and cells for plant biomass growth is important for yield stability. In vitro systems with reproducible cell plasticity can help to identify relevant metabolic and molecular events during early cell reprogramming. In carrot, regulation of the central root meristem is a critical target for yield-determining secondary growth. Calorespirometry, a tool previously identified as promising for predictive growth phenotyping has been applied to measure the respiration rate in carrot meristem. In a carrot primary culture system (PCS), this tool allowed identifying an early peak related with structural biomass formation during lag phase of growth, around the 4th day of culture. In the present study, we report a dynamic and correlated expression of carrot AOX genes (DcAOX1 and DcAOX2a) during PCS lag phase and during exponential growth. Both genes showed an increase in transcript levels until 36 h after explant inoculation, and a subsequent down-regulation, before the initiation of exponential growth. In PCS growing at two different temperatures (21°C and 28°C), DcAOX1 was also found to be more expressed in the highest temperature. DcAOX genes’ were further explored in a plant pot experiment in response to chilling, which confirmed the early AOX transcript increase prior to the induction of a specific anti-freezing gene. Our findings point to DcAOX1 and DcAOX2a as being reasonable candidates for functional marker development related to early cell reprogramming. While the genomic sequence of DcAOX2a was previously described, we characterize here the complete genomic sequence of DcAOX1.
Introduction
Plant breeding makes use of in vitro systems for plant propagation, but these systems are also ideal to isolate scientific questions related to stress responsiveness for later up-scaling of the knowledge to plant level. Especially, early molecular plant responses during cell reprogramming upon abiotic stress can easily be targeted (Arnholdt-Schmitt, 1993a; Arnholdt-Schmitt et al., 1995 and references in: Arnholdt-Schmitt, 2004; Arnholdt-Schmitt et al., 2006; Frederico et al., 2009b; Zavattieri et al., 2010). In recent years, considerable progress has been made regarding the development and isolation of stress tolerant genotypes by using in vitro techniques (Pérez-Clemente and Gómez-Cadenas, 2012). Phenotypic variability shown in in vitro culture systems is due to high genotype dependence, going from species level to the level of cultivar/variety and individual genotypes. It can vary between organs/tissues and developmental stages (Cardoso et al., 2010 and references therein). This variability in response, known as in vitro recalcitrance, could be described as varying capacity for plant cells to adapt to new environmental conditions, i.e., the capacity to develop and express new cell programs. This general capacity is important at plant level when environmental conditions are changing. For example, efficient transformation of trichoblasts (see Arnholdt-Schmitt, 2004) to fine root hairs is important under changing phosphorus availability in the soil to guarantee access to the nutrient. Plant adaptive plasticity was recently proposed as a new trait in plant breeding (Nicotra et al., 2010; Cardoso and Arnholdt-Schmitt, 2013), since it influences the stability of plant biomass and yield production. Plant research for robust phenotypes that show stability in growth performance is crucial, but also the most critical and most expensive step in breeding. Efficient marker systems and reliable screening tools that can assist in identifying and selecting superior robust genotypes with differential adaptive plasticity are still important bottlenecks (Arnholdt-Schmitt et al., 2014, 2015a).
In molecular plant breeding, candidate gene approaches for marker-assisted selection are considered a promising strategy (Collins et al., 2008). Good candidate genes for multi-stress tolerance and yield stability are genes involved in cell coordination and decision making in target cells. AOX is increasingly getting into the focus of research on stress acclimation and adaptation and seems to play a key role in regulating the process of cell reprogramming by ameliorating metabolic transitions related with the cellular redox state and flexible carbon balance (Arnholdt-Schmitt et al., 2006, 2015a; Rasmusson et al., 2009). AOX is supposed to provide the respiratory system with built-in flexibility regarding the degree of coupling between carbon metabolism pathways, electron transport chain activity, and ATP turnover (Vanlerberghe, 2013). For this reason, AOX genes were proposed and adopted as candidate genes for functional marker development related to multi-stress tolerance and plant adaptive plasticity (Arnholdt-Schmitt et al., 2006; Polidoros et al., 2009; Cardoso and Arnholdt-Schmitt, 2013). AOX genes were found to be differentially transcribed in various systems early during in vitro culture –induced morphogenic responses. This includes de novo growth from quiescent root phloem tissue (Campos et al., 2009) and somatic embryogenesis (Frederico et al., 2009a) in carrot and adventitious rooting in olive (Macedo et al., 2009; Macedo et al., 2012).
Nogales et al. (2013) developed calorespirometry as a new tool for breeding in a carrot in vitro PCS. This in vitro system, originated from quiescent secondary tap root phloem, was first established by Steward et al. (1952) and later proposed by Arnholdt-Schmitt (1999) as a mean for carrot yield prediction. Calorespirometry has been shown to be useful to accurately monitor temperature dependent growth performance in terms of metabolic rates, respiratory rates, efficiency of biomass acquisition, and growth rates over 21 days of in vitro cultures (Nogales et al., 2013). Those data showed a drastic increase in structural biomass formation until around the 4th day after inoculation during the lag phase of growth.
In this paper, we expanded the number of cultures tested by Nogales et al. (2013) and first demonstrate that the increase in structural biomass formation, showing an early peak during the lag phase of growth, is present in all the five primary cultures tested. We report that both carrot AOX genes, DcAOX1, and DcAOX2a, previously demonstrated as the ones with major expression in the PCS (Campos et al., 2009), showed increased levels of transcripts until the 4th day of culture and subsequent down-regulation before exponential growth starts. As a first attempt to transpose these findings to plant level, we also show an early transcript accumulation for both AOX genes in a chilling plant pot experiment prior to the induction of a specific AFP. This study identifies DcAOX1 and DcAOX2a as being reasonable candidates for functional marker development on efficient cell reprogramming under changing environments in general. The isolation and characterization of the complete genomic sequence of DcAOX1 is further reported.
Materials and Methods
Establishment of a Primary Culture System (PCS)
Ten weeks-old plants of D. carota L. cv. Rotin grown in pots, containing commercial soil mixture maintained under greenhouse conditions were used. Five explants from the secondary tap root phloem of each plant were inoculated per Erlenmeyer containing 20 mL of NL liquid medium (Neumann, 1966) supplemented with kinetin (1 mgL-1) and indoleacetic acid (2 mgL-1). The cultures were incubated under continuous rotation (90 rpm) and continuous light (95–100 μmol m-1 s-1, Philips) at 21°C and/or 28°C. During culture, tissue dedifferentiation and subsequent callus formation and growth is induced. After the lag-phase of 6–8 days exponential callus growth starts mainly as a result of cell division activity, and typically, callus continues to proliferate during 28 days in culture. At day 14, the linear phase of callus growth is running and a mixotrophic nutritional system is established (Arnholdt-Schmitt, 1999). Due to a supplementation of cytokinin in the culture medium, no organogenesis is initiated during the experiment. In cells of initial explants taken from secondary phloem of mature tap roots usually only carotene-containing chromoplasts appear to be present and neither chloroplasts nor other plastid structures were found. However, during the first 8 days in culture, restructuring of chromoplasts to chloroplasts is initiated via an intermediate state as amylo-chloroplasts (Kumar et al., 1983).
Calorespirometry Measurements
In order to calculate specific growth rates (i.e., structural biomass formation rate, Rstruct_biomass) and efficiencies of biomass acquisition as described in Nogales et al. (2013), the respiratory metabolic heat rates and CO2 emission rates were measured in PCS by calorespirometry, at different time points. To confirm reproducibility of the early peak for structural biomass formation reported by these authors in two PCS, we additionally performed new measurements in three PCS growing at two different incubation temperatures (21°C and 28°C). The total of five PCS measurements are presented.
DcAOX1 and DcAOX2a Expression Analysis
AOX Response During Tissue Dedifferentiation and Callus Growth
We studied DcAOX1 and DcAOX2a mRNA levels in an in vitro PCS by:
(i) Semi-quantitative PCR (RT-sqPCR) on both AOX genes, in order to shed light on transcript changes during the earliest events related to cell reprogramming and also in the later growth phase. Explants from 4 individual carrot plants (four biological replicates) grown at 21°C were collected at different time points: 0 h, 4 h, 8 h, 12 h, 36 h, 4, 8, 14, 21, and 28 days post inoculation (hpi/dpi). From 0 hpi until 4 dpi, 30 explants were taken per time point. For the remaining time points, a maximum of 15 explants were taken. Samples were collected as bulked samples. FW of each callus was also determined at 0, 4, 8, 12, 14, 18, 21, and 28 dpi.
(ii) Quantitative real-time PCR (RT-qPCR), to compare the transcript changes of AOX on PCS under two incubation temperatures (21°C and 28°C, as in see Calorespirometry Measurements). Explants from five individual plants (five biological replicates) were collected at 0 and 14 dpi (T0 and T14). Samples consisted of bulked samples of about 50 explants. The five plants used on expression analysis (n = 5) resulted from a previous selection of 12 individual plants based on their callus growth behavior under the two temperatures tested.
AOX Response to Chilling Exposure of Carrot Plants
Seeds of D. carota cv. Rotin were sowed in pots containing commercial soil mixture and maintained at controlled conditions for 1 month (23°C, 70–75% of air humidity and 16 h photoperiod with 200 ± 20 μmol m-1 s-1 light intensity).
Two chilling exposure (CE) experiments were conducted by:
(i) Semi-quantitative PCR (RT-sqPCR), to study the effect of CE on AOX expression of seedlings growing under controlled conditions (as described above), and exposed to 4°C for 5 days. Samples were collected at different time points: 0, 1, 2, 3, 4, and 5 dpce. Samples consisted of young leaves taken as bulked samples from three individual plants. Three bulked samples (biological replicates) were considered in a total of 54 plants.
(ii) Quantitative real-time PCR (RT-qPCR), to evaluate early AOX transcript levels on seedlings exposed to 4°C for 24 h. Samples were collected at 0 h, 10 min, 45 min, 4 h, 6 h, and 24 h post CE (mpce or hpce) and at 24 and 48 h after transferring the plants back to the initial growth conditions, as described above (recovery period). Samples consisted of young leaves taken from single plants. Four plants (four biological replicates) were considered per time point. Additionally, the expression of carrot antifreezing protein (DcAFP) was evaluated in this experiment at the referred time points.
Sample Processing
Total RNA from all samples was extracted using RNeasy Plant Mini Kit (Qiagen, Hilden, Germany), with on-column digestion of DNA using RNase-Free DNase Set (Qiagen, Hilden, Germany), according to manufacturer’s instruction. DNase-treated total RNA (1 μg) were reverse transcribed with random decamer primer (PCS experiments) or the oligo d(T) primer (CE experiments), using the RETROscript® kit (Ambion, Austin, TX, USA) according to manufacturer’s instruction. The maximum number of time points chosen to collect plant material for RNA extraction and for growth curve analysis was restricted by nature of root sizes.
Expression Analyses
(i) RT-sqPCR: all RT-sqPCR experiments were performed using Ready-To-Go PCR Beads (GE Healthcare, Little Chalfont, England), 2 μL of cDNA (diluted 1:10) as template and 0.2 μM of each specific primer (Table 1). DcEF1α was previous selected (results not shown) as the reference gene for all RT-sqPCR experiments. PCR for DcEF1α and DcAOX1 (for primers sequences see Table 1) was carried out for 32 cycles, each one consisting of 30 s at 94°C, 15 s at 60°C, and 15 s at 72°C. For DcAOX2a the PCR was of 35 cycles consisting in 30 s at 94°C, 30 s at 55°C, and 30 s at 72°C. An initial step at 94°C for 5 min and a final extension at 72°C for 5 min were performed in both cases. A previous experiment confirmed that disinfection did not have influence on AOX transcript levels in PCS (data not shown). RT-sqPCR products were analyzed by electrophoresis in 2% (w/v) agarose gel. For PCS, image analysis was carried out to normalize the expression level of AOX cDNA with the reference DcEF1α gene, by density band analyses using ImageJ 1.47v software1 (Schneider et al., 2012). The results were expressed as mean ± SE of four individual plants. The initial time (0 h) was used as calibrator and was set to 1.00 of RE. Differences between time points were examined by one-way ANOVA using the STATISTICA 8.0 statistical package (StatSoft Inc.).
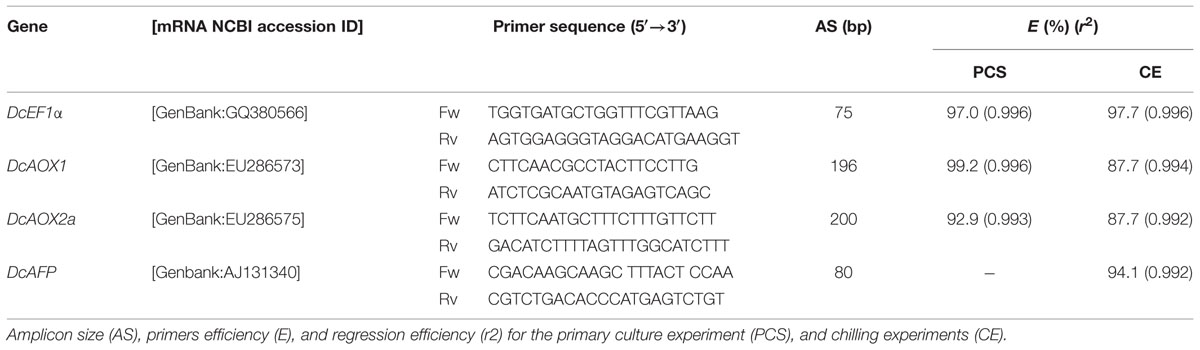
TABLE 1. Primers used in RT-sqPCR and RT-qPCR.
(ii) RT-qPCR: Transcript abundances of DcAOX1, DcAOX2a, and DcAFP (Table 1) were determined by RT-qPCR on a 7500 Real Time PCR System (Applied Biosystems, Foster City, USA) using Maxima SYBR Green q-PCR Master Mix (Fermentas, ON, Canada). Reaction (15 μL) consisted in 2 μL of first-strand cDNA (previously diluted 1:10) and 0.3 μM of each specific primer. DcEF1α was selected for data normalization based on previous experiments involving 12 candidate genes (Campos et al., 2015; data for PCS not shown). Amplicons of all genes were previously confirmed by direct sequencing. Standard curves of a fourfold dilution series (1:1–1:125) (run in triplicate) of pooled cDNA from all samples were used for primer efficiency determination. Minus reverse transcriptase and no template controls were included to assess contaminations. RT-qPCR was performed for 40 cycles, each consisting of 15 s at 95°C followed by 1 min at 60°C. To analyze the dissociation curve profiles, an additional step at 95°C during 15 s was added, followed by a constant increase of temperature between 60 and 95°C. The 2-ΔΔCT methodology (Livak and Schmittgen, 2001) was used to normalize expression data. Samples collected at initial times (0 h in CE or T0 in PCS) were used as calibrators.
For PCS experiment (i) and CE experiment (ii), a One-way analysis of variance (ANOVA) with Tukey’s post hoc test was used to search for significant differences in gene expression between time points. Regarding the PCS experiment at different temperatures (ii), differences in transcript levels between temperatures at T14 were analyzed by Student’s t-test (n = 5). A Pearson’s product–moment correlation (Zar, 2010) was used to compare normalized expression data of DcAOX1 versus DcAOX2a. All statistical analyses were performed using the STATISTICA 8.0 statistical package (StatSoft Inc., Tulsa, Ok, USA). Significance levels were set at P < 0.05.
DcAOX1 Gene Isolation
Plant Material
Seeds of D. carota L. cv. Rotin were germinated in vitro in MS basal media (Murashige and Skoog, 1962) and maintained under controlled conditions (25 ± 1°C, 16 h photoperiod with 34 μmolm-2s-1 light intensity). Eight-week-old in vitro grown seedlings were used for gDNA and total RNA extraction. For gene identification, mixtures of several plants were used; for complete gene isolation at gDNA and cDNA level, single plants were taken.
Identification of DcAOX1
gDNA extraction was performed using DNeasy Plant Mini Kit (Qiagen, Hilden, Germany) following the manufacturer’s instructions. For DcAOX1 gene identification (previously named DcAOX1a, Costa et al., 2009), degenerate primers (P1/P2, annealing at 60°C for 2 min and extension at 72°C for 2 min, Table 2), designed based on A. thaliana (Saisho et al., 1997) were used. PCR was performed with Ready-To-Go PCR Beads (GE Healthcare, Little Chalfont, England) using 10 ng of gDNA as template and 0.2 μM of each primer.
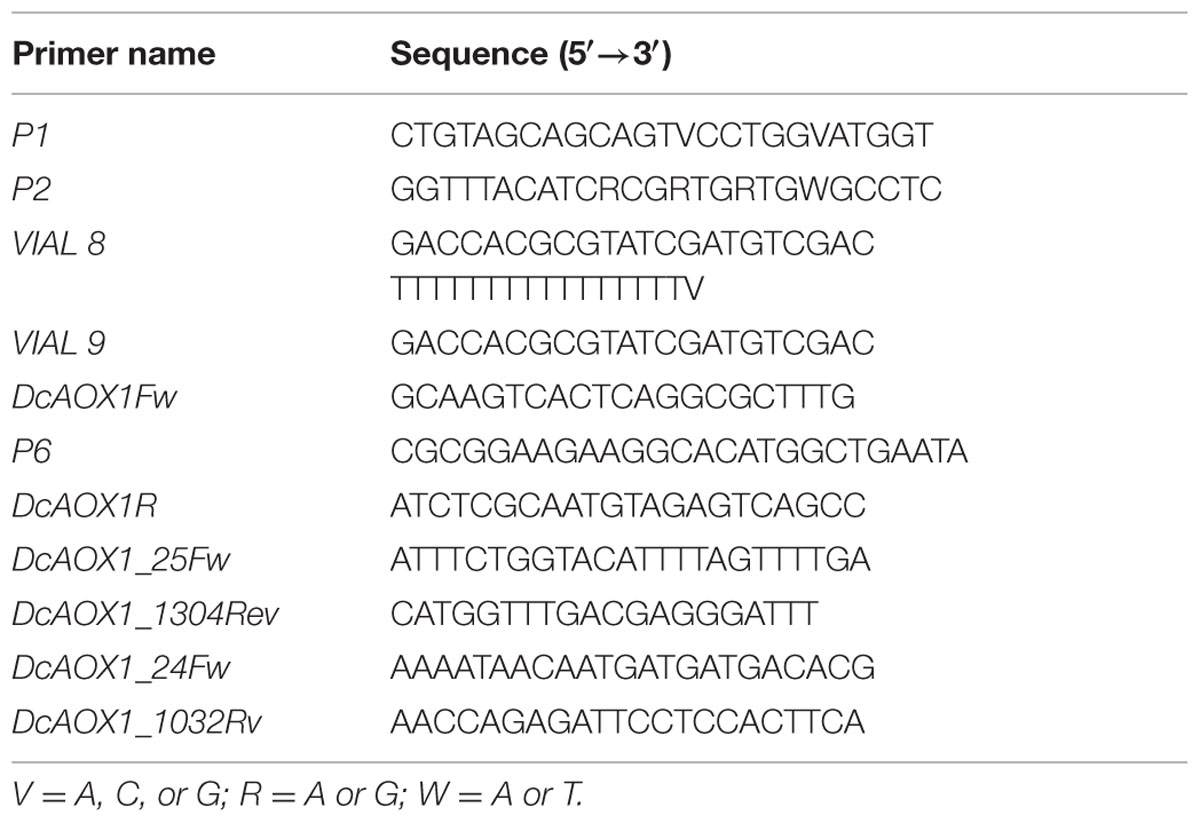
TABLE 2. Primers used for DcAOX1 gene isolation.
Isolation of DcAOX1 Complete Sequence
To determine the 5′ and 3′ ends of the isolated DcAOX1 fragment, 5′ and 3′ RACE-PCRs were performed. Total RNA was isolated using RNeasy Plant Mini Kit (20) (Qiagen, Hilden, Germany), with on-column digestion of DNA with the RNase-Free DNase Set (Qiagen, Hilden, Germany) according to the manufacture’s protocol.
For 3′RACE-PCR, single cDNA strand was produced using the enzyme RevertAidTM HMinus M-MuLV Reverse (Fermentas, ON, Canada), with oligo (dT) primer VIAL 8 (Roche, Mannheim, Germany) (Table 2), according to the manufacturer’s instruction. For the synthesis of the second cDNA strand and subsequent 3′end amplification, the reverse primer VIAL 9 (Roche, Mannheim, Germany) (Table 2) was used in combination with gene-specific forward primer (DcAOX1Fw, annealing at 55°C for 30 s, extension 72°C for 60 s, see Table 2) designed based on previously isolated AOX1 P1/P2 sequence. One moicro liter of a 1:10 cDNA dilution of first strand PCR product was used as template for amplification.
To isolate the 5′ end, a cDNA library of D. carota L. cv. ‘Marktgaertner’ M853 (kindly provided by Dr. Bettina Linke, Humboldt University of Berlin, Germany) cloned into a Lambda gt22a phage vector (Invitrogen, Karlsruhe, Germany) was generated (Linke et al., 2003). 5′ RACE-PCR was carried out using 1 μL of cloned library as template and vector specific forward primer P6 (Table 2), combined with a gene-specific reverse primer designed based on the sequence previously isolated with P1/P2 (DcAOX1R, annealing at 55°C for 30 s and extension at 72°C for 2 min, see Table 2).
RACE-PCRs were performed using 0.5 U of Taq DNA polymerase (Thermo Scientific, Wilmington, DE, USA) with 1X manufacturer supplied (NH4)2SO4 buffer, 1.5 mM MgCl2, 0.2 mM of each dNTPs (Fermentas, ON, Canada) and 0.2 μM of each primer.
For complete gene (cDNA) isolation, a gene-specific primer set (DcAOX1_25Fw and DcAOX1_1304Rv, annealing at 52°C for 20 s and extension at 72°C for 2 min, Table 2) was designed based on 5′ and 3′-UTR sequences previously isolated with RACE-PCRs. For gDNA complete gene isolation, another gene-specific primer set (DcAOX1_24Fw and DcAOX1_1032 Rv, annealing at 64°C for 30 s and extension at 72°C for 2 min, Table 2) was designed. Ten ng of gDNA and a 1:10 cDNA dilution from a single plant were used as templates. PCRs were performed using PhusionTM High-Fidelity DNA Polymerase (Finnzymes, Espoo, Finland) according to the manufacturer’s instruction, using 0.2 μM of each specific primer. All PCR products were analyzed in 1.4% (w/v) agarose gel.
Cloning and Sequence Analysis
All PCR fragments were purified using GFX PCR DNA and Gel Band Purification Kit (GE Healthcare, Little Chalfont, England) according to the manufacture’s protocol, and cloned into pGEM®-T Easy vector (Promega, Madison, WI, USA). Reaction products were transformed to E. coli JM109 (Promega Madison, WI, USA) competent cells. Plasmid DNA was extracted from putative recombinant clones (Bimboim and Doly, 1979) and confirmed by using EcoRI restriction enzyme (Fermentas, ON, Canada). Selected recombinant clones were sequenced2 (Macrogen, Seoul, Korea) using T7 and SP6 primers (Promega, Madison, WI, USA). Sequence homology was confirmed in NCBI GenBank database3 (National Center for Biotechnology Information, Bethesda, MD, USA) using BLASTn and BLASTp algorithm (Karlin and Altschul, 1993).
SeqMan and EditSeq softwares (LASERGENE 7, GATC Biotech, Konstanz) were used to edit the obtained AOX sequence. Phylogenetic studies included data retrieved from public web-based databases, freely available (NCBI)3, Plaza4; e!EnsemblPlants5 and IPK Barley Blast Server6. Non-annotated AOX sequences used for phylogenetic studies were previously identified (Cardoso et al., 2015).
Sequences were aligned using MAFFT software7 (online version) under the model G-INS-1 (Slow; progressive method with an accurate guide tree), all other variables left as default. The best-fit model of amino acid replacement was selected by Akaike Information Criterion (AIC) according to the software ProtTest (Darriba et al., 2011). The selected model of protein evolution (probability of change from a given amino acid to another over a period of time, given some rate of change) was JTT+I+G [the JTT empirical model (Jones et al., 1992), considering an invariable fraction of amino acids (+I) and assigning each site a probability to belong to a different category of rate change (Darriba et al., 2011)]. Phylogenetic reconstruction was done through maximum likelihood (ML) as implemented in the software MEGA v 0.6, under the above referred model, and bootstrapped with 1000 replicates. The phylogenetic tree was rooted with Chlamydomonas reinhardtii AOX1 sequence.
MITOPROT software (Claros and Vincens, 1996) was used to predict mitochondrial targeting sequence and cleavage site. Gene draw was performed in FancyGene 1.4 (Rambaldi and Ciccarelli, 2009). For intron identification, the Spidey software8 was used.
Results
Calorespirometry in Primary Cultures
Figure 1 shows the results for Rstruct_biomass calculated from calorimetrically measured Rq and RCO2, from day 0 to day 21 after inoculation. An increase on Rstruct_biomass could already be observed at day 2 in all PCS, and in most cases reached a maximum at day 4. In PCS1 and PCS4 grown at 21°C the peak on Rstruct_biomass is reached at day 7, since the speed (slope when a linear regression is fitted between two data points) of increase is slower.
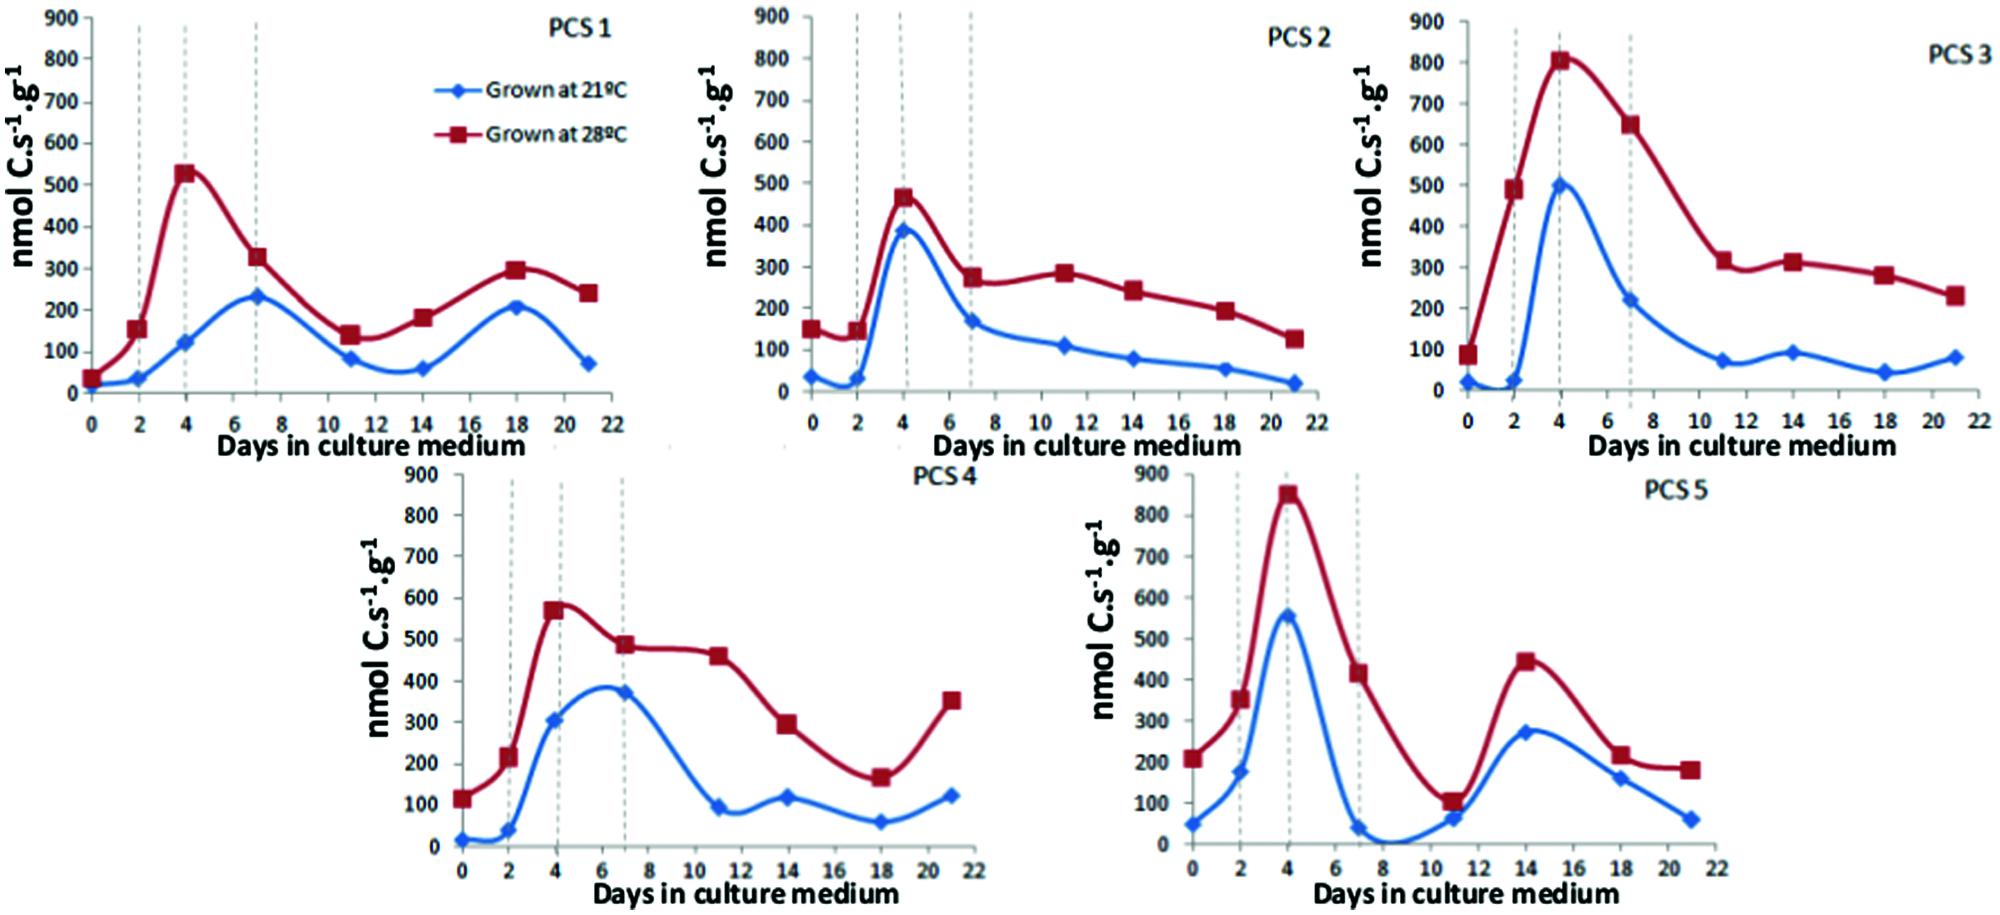
FIGURE 1. Rstructural biomass in callus grown at 21°C and 28°C in primary cultures during 21 days. Each data point represents the average of three measurements performed using 200–300 mg of callus.
Expression of Carrot AOX Genes
PCS de novo Differentiation
The growth curve and aspect of callus along the 28 days of in vitro culture can be observed in Supplementary Figure S1. During the first 8 days in culture (lag-phase), growth of the explants was not visible. Then, exponential cell division started and callus proliferated until 28 days. During growth, callus lost the original orange color of the explants and progressively acquired a green color (Supplementary Figure S1).
Transcript levels for both AOX genes were found to slightly increase from the early beginning (4 hpi) of the lag-phase until 36 hpi (Figure 2). The time points showing highest level of transcripts (P > 0.05) were 4 hpi until 4 dpi for DcAOX1, and 8 hpi until 36 hpi for DcAOX2a. However, it was also observed that the timings of higher or lower expression were somewhat unphased between individual explants (not shown), thus reducing the possibility of observing significant differences between time points. At 4 dpi (lag phase), while the level of expression was still high for DcAOX1, DcAOX2a was already down regulated to values near the ones measured at 0 hpi. At the end of the lag phase and at initiation of exponential growth (8 dpi), expression of both genes achieved the lowest levels and remained relatively stable until 28 dpi, with values similar to the original, quiescent tissue (0 h). Expression patterns of DcAOX1 and DcAOX2a significantly correlated (P = 0.01).
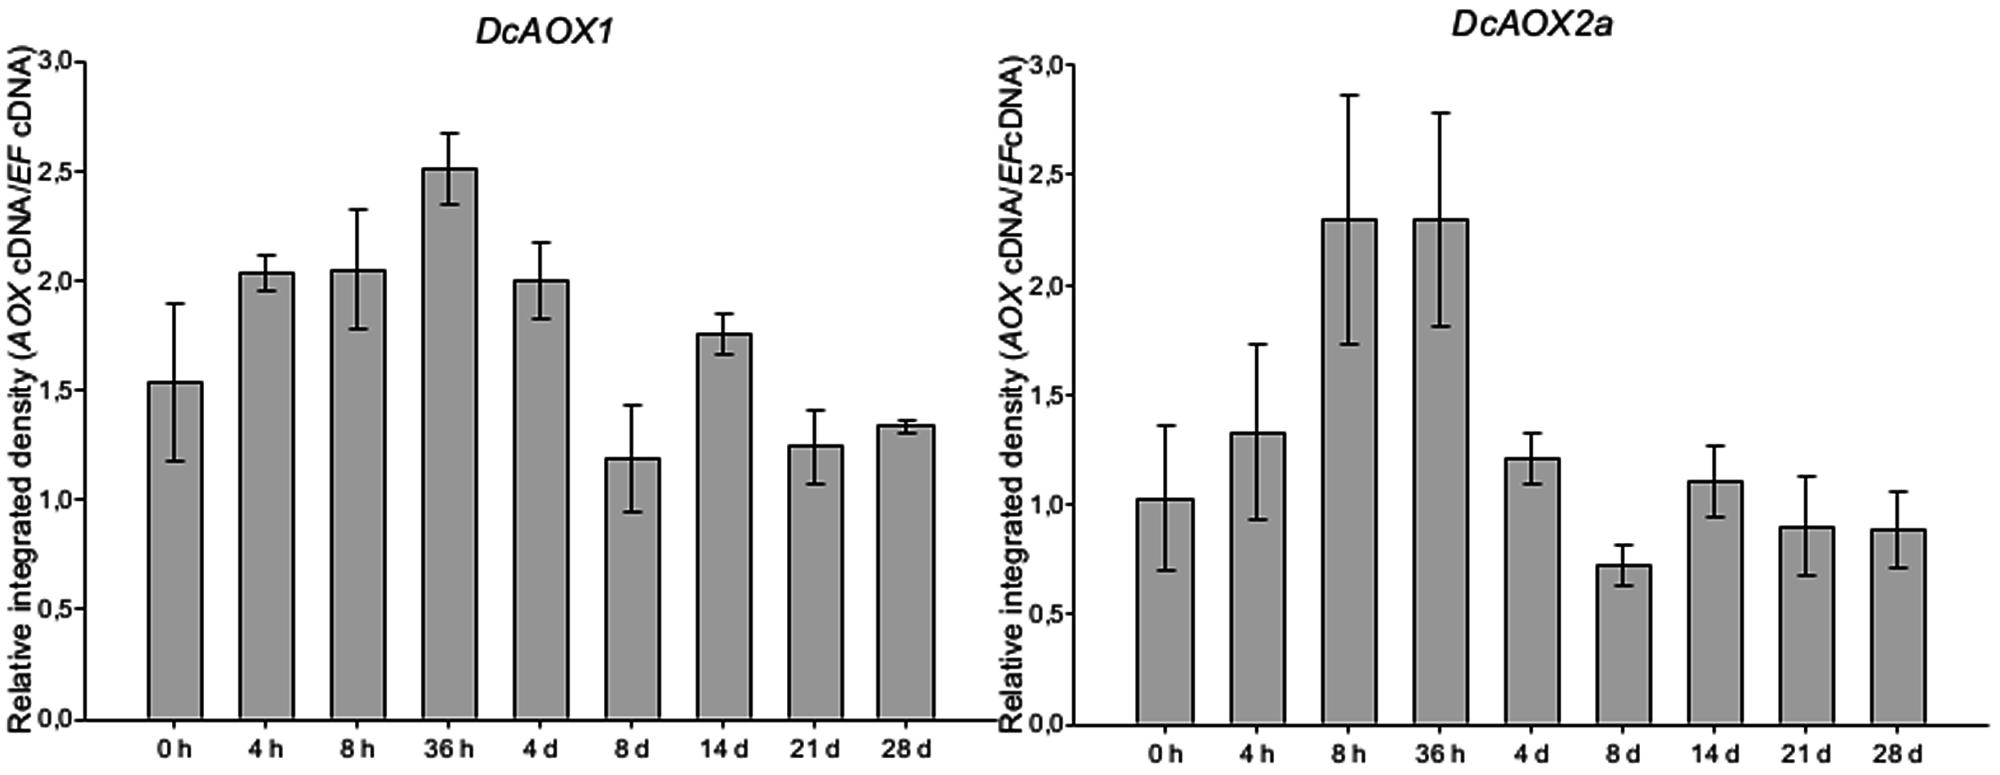
FIGURE 2. Transcript levels of DcAOX1 and DcAOX2a in primary cultures from secondary phloem of carrot roots. Samples were collected at 0 h, 4 h, 8 h, 36 h, 4, 8, 14, 21, and 28 days post in vitro inoculation. Cultures were maintained at 21°C. Transcript levels were analyzed by RT-sqPCR using DcEF1α as reference gene. Normalization of the quantity of DcAOX transcripts was performed through the ratio of integrated densities DcAOX cDNA and DcEF1α cDNA bands. Data are the mean values ± SE of four individual plants.
PCS Response to Temperature
Figure 3 shows expression levels for both DcAOX genes during exponential growth, at 14 dpi (T14), at two different growing temperatures (21°C and 28°C), in five explants with independent origins. DcAOX1 was significantly higher expressed (fivefold) at 28°C than at 21°C (P < 0.05). No significant differences were observed for DcAOX2a between temperatures, and this gene showed low expression levels at both temperatures (Figure 3). These five plants had been selected for these studies on AOX gene expression variation from a larger group of 12 plants, because they showed variation in growth (not shown). Two showed significantly higher callus biomass at 28°C (R2 and R5), two had no significant differences between both temperatures (R1 and R3) and one showed a significantly higher callus FW at 21°C (R4). R3 was also characterized by low growth at both temperatures. However, concerning AOX transcript accumulation, at T14 during the exponential growth phase no direct link was detected between callus FW and individual DcAOX1 or DcAOX2a transcript accumulation (not shown).
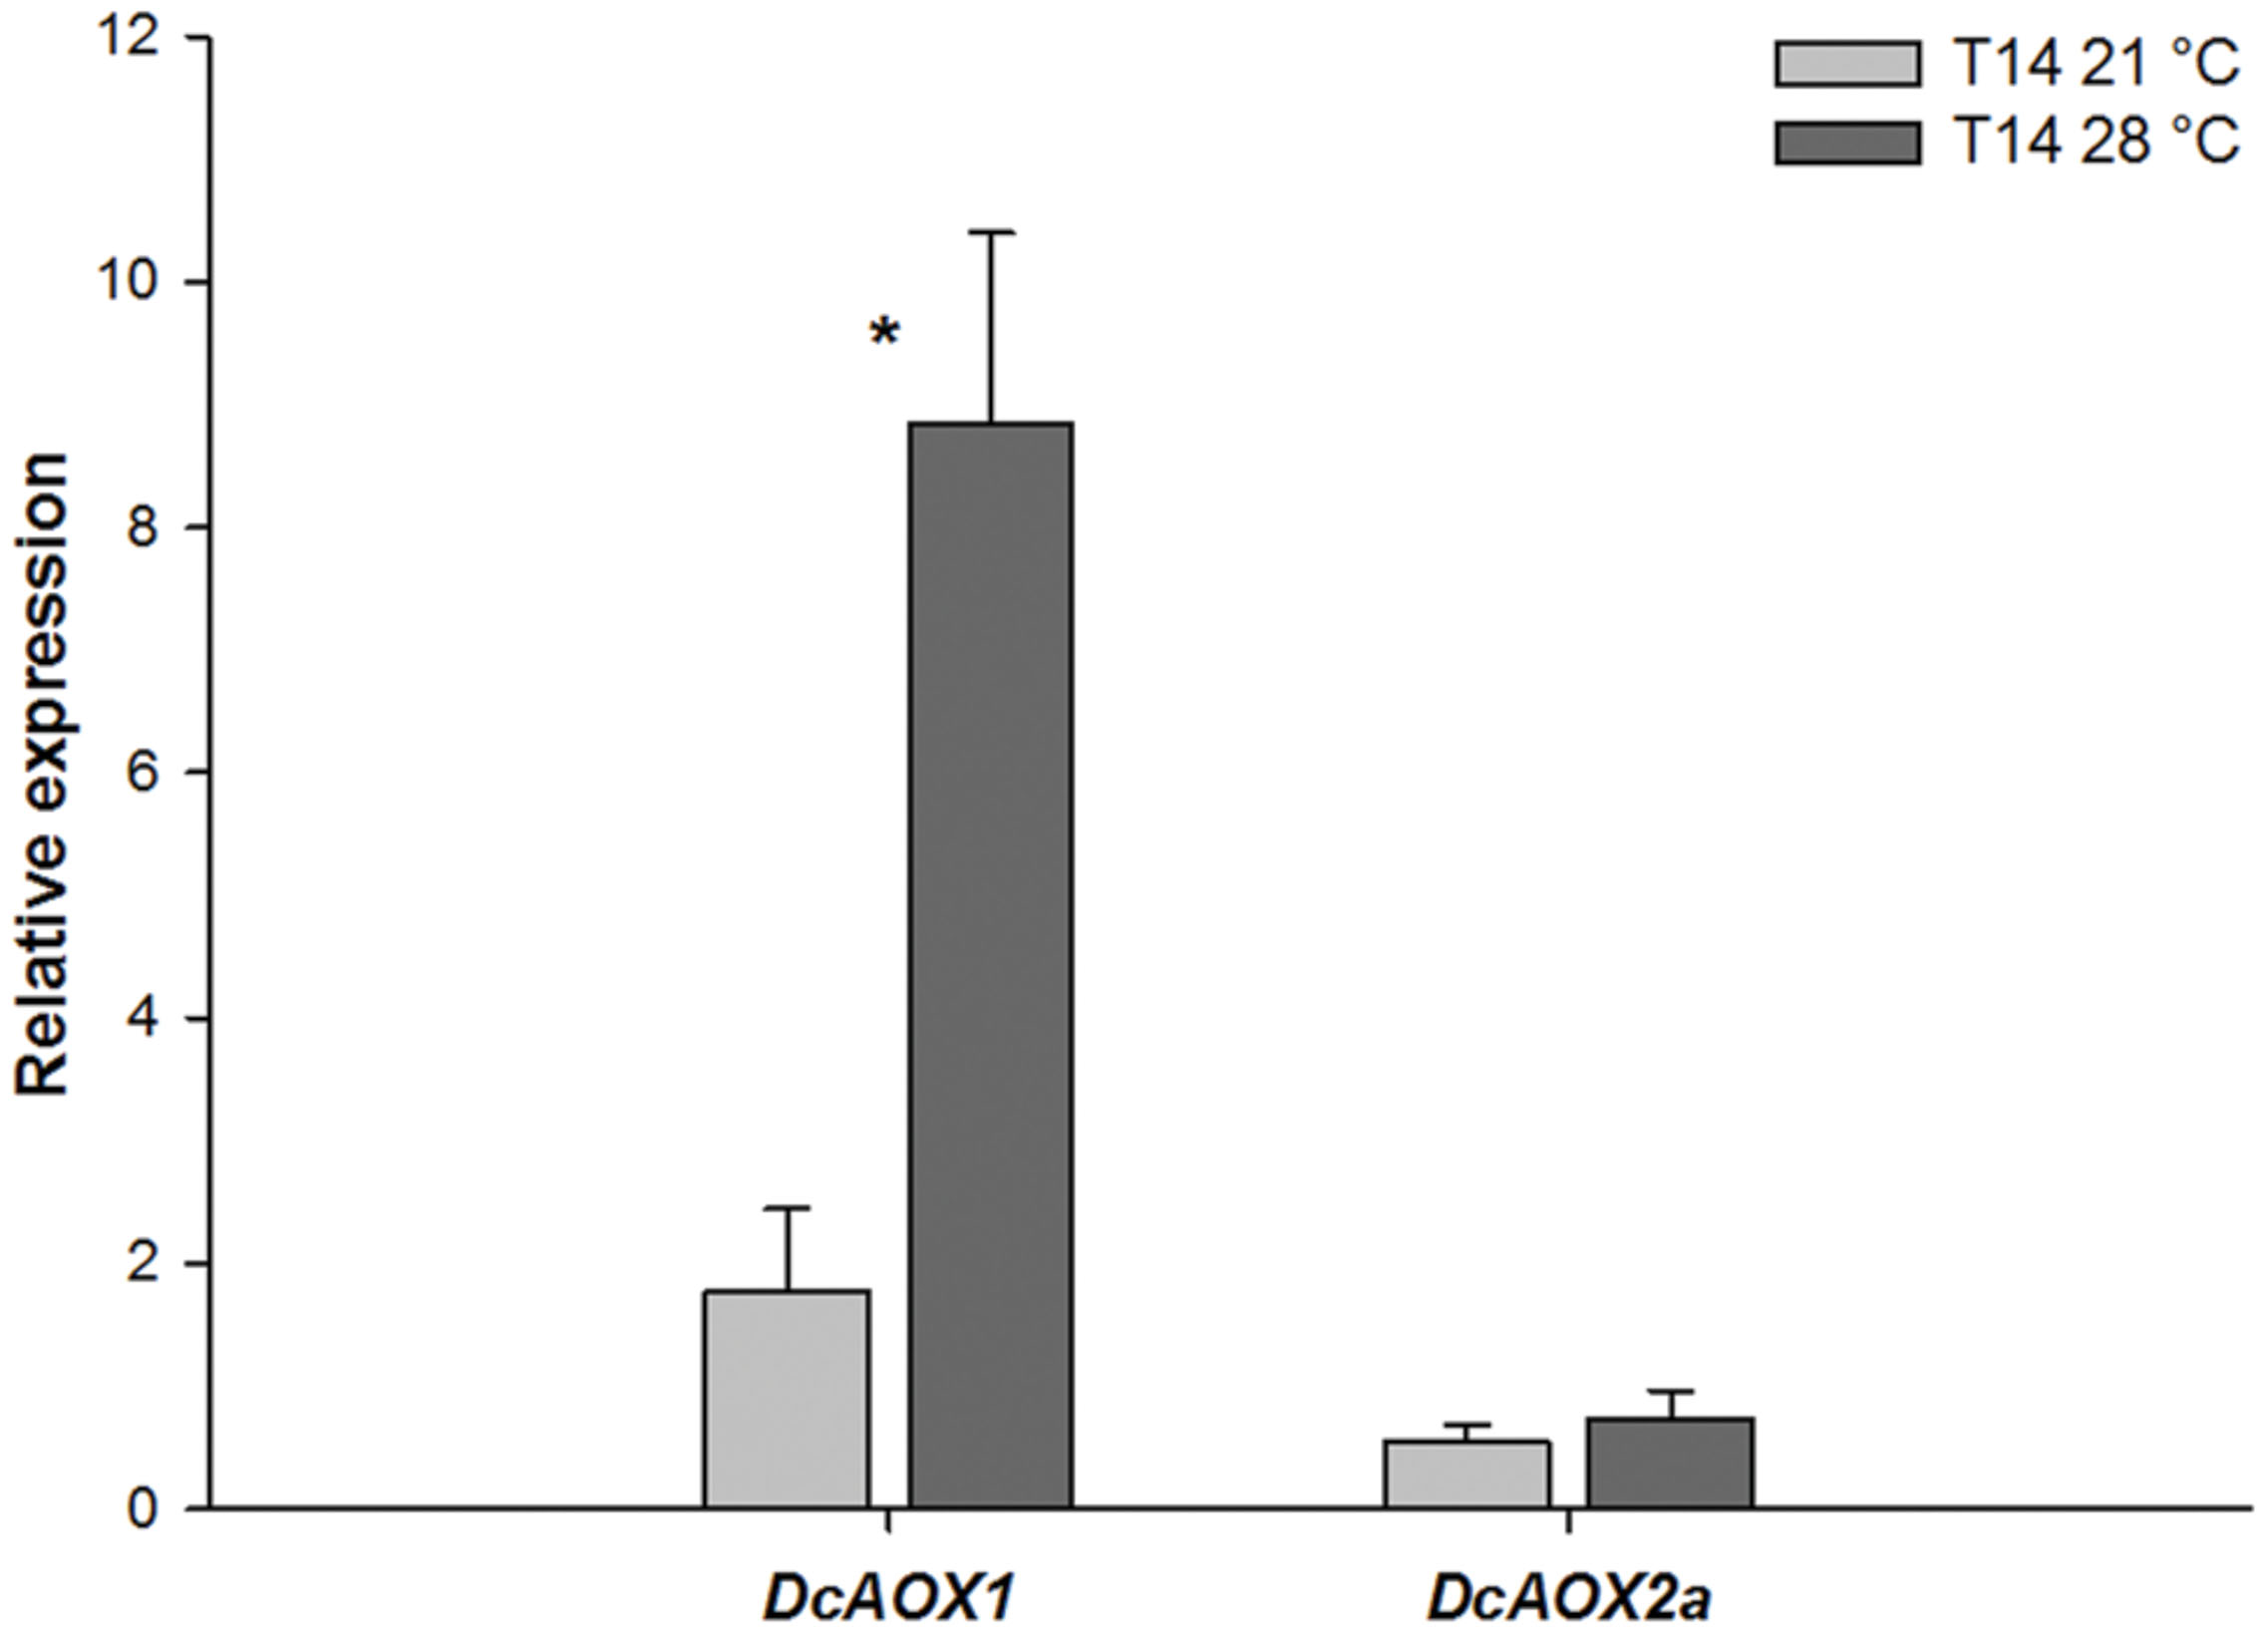
FIGURE 3. Transcript levels of DcAOX1 and DcAOX2a in primary cultures from secondary phloem of carrot roots grown at different temperatures. The expression was normalized with DcEF1α. T14–21°C: explants after 14 days in culture, growing at 21°C; T14–28°C: explants after 14 days in culture, growing at 28°C. T0 (explants before inoculation) was used as calibrator. Data are the mean values ± SE of five individual plants. Student’s t-test was applied to test differences between temperatures for each gene. Significant differences are marked with ∗.
Plant Response to Chilling
One month-old carrot seedlings exposed to 4°C for 5 days showed a similar induction pattern between both DcAOX1 and DcAOX2a (Figure 4). The level of transcripts detected in DcAOX1 was clearly higher than that of DcAOX2a. Expression levels of DcAOX1 were high from day 1 to day 3 and decreased from day 4 to 5.
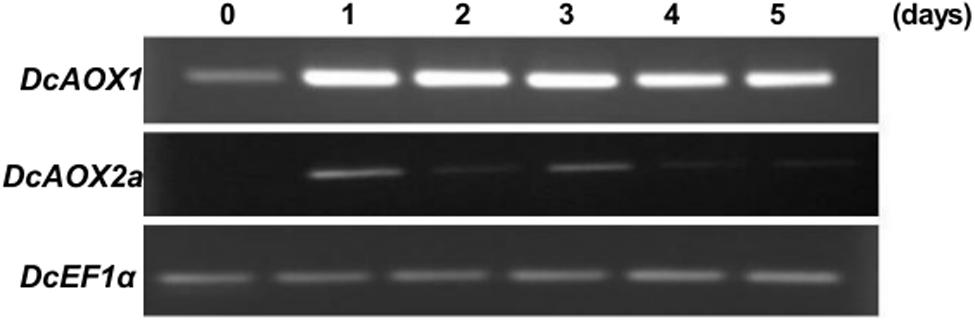
FIGURE 4. Transcript level of DcAOX1 and DcAOX2a genes in leaves of Daucus carota cv Rotin seedlings exposed to chilling (4°C) for 5 days. EF1α cDNA was used as reference gene and the gel profiles are representative of three independent RT reactions from three biological replicates.
When RT-qPCR analysis was performed with a higher time resolution until 24 hpce, both AOX genes showed very early responses to CE, since significantly higher mRNA levels were found at 45 min comparing to 0 hpce (P < 0.05) (Figure 5). In case of DcAOX1, an increase was observed immediately after 10 min of exposure with 2.2-fold difference in RE, followed by a 2.5-fold increment after 45 min. A slight transcript level reduction was observed, followed by a significant increase until 24 hpce (P < 0.05) (Figure 5). DcAOX2a increased 3.4-fold at 45 min of cold exposure relatively to 0 hpce (P < 0.05) (Figure 5). Transcript levels of DcAOX2a then decreased, showing constant levels until the 24 h of the recovery phase. By 48 h of recovery, a further reduction in mRNA levels was observed (Figure 5). Expression patterns of DcAOX1 and DcAOX2a significantly correlated (P < 0.001).
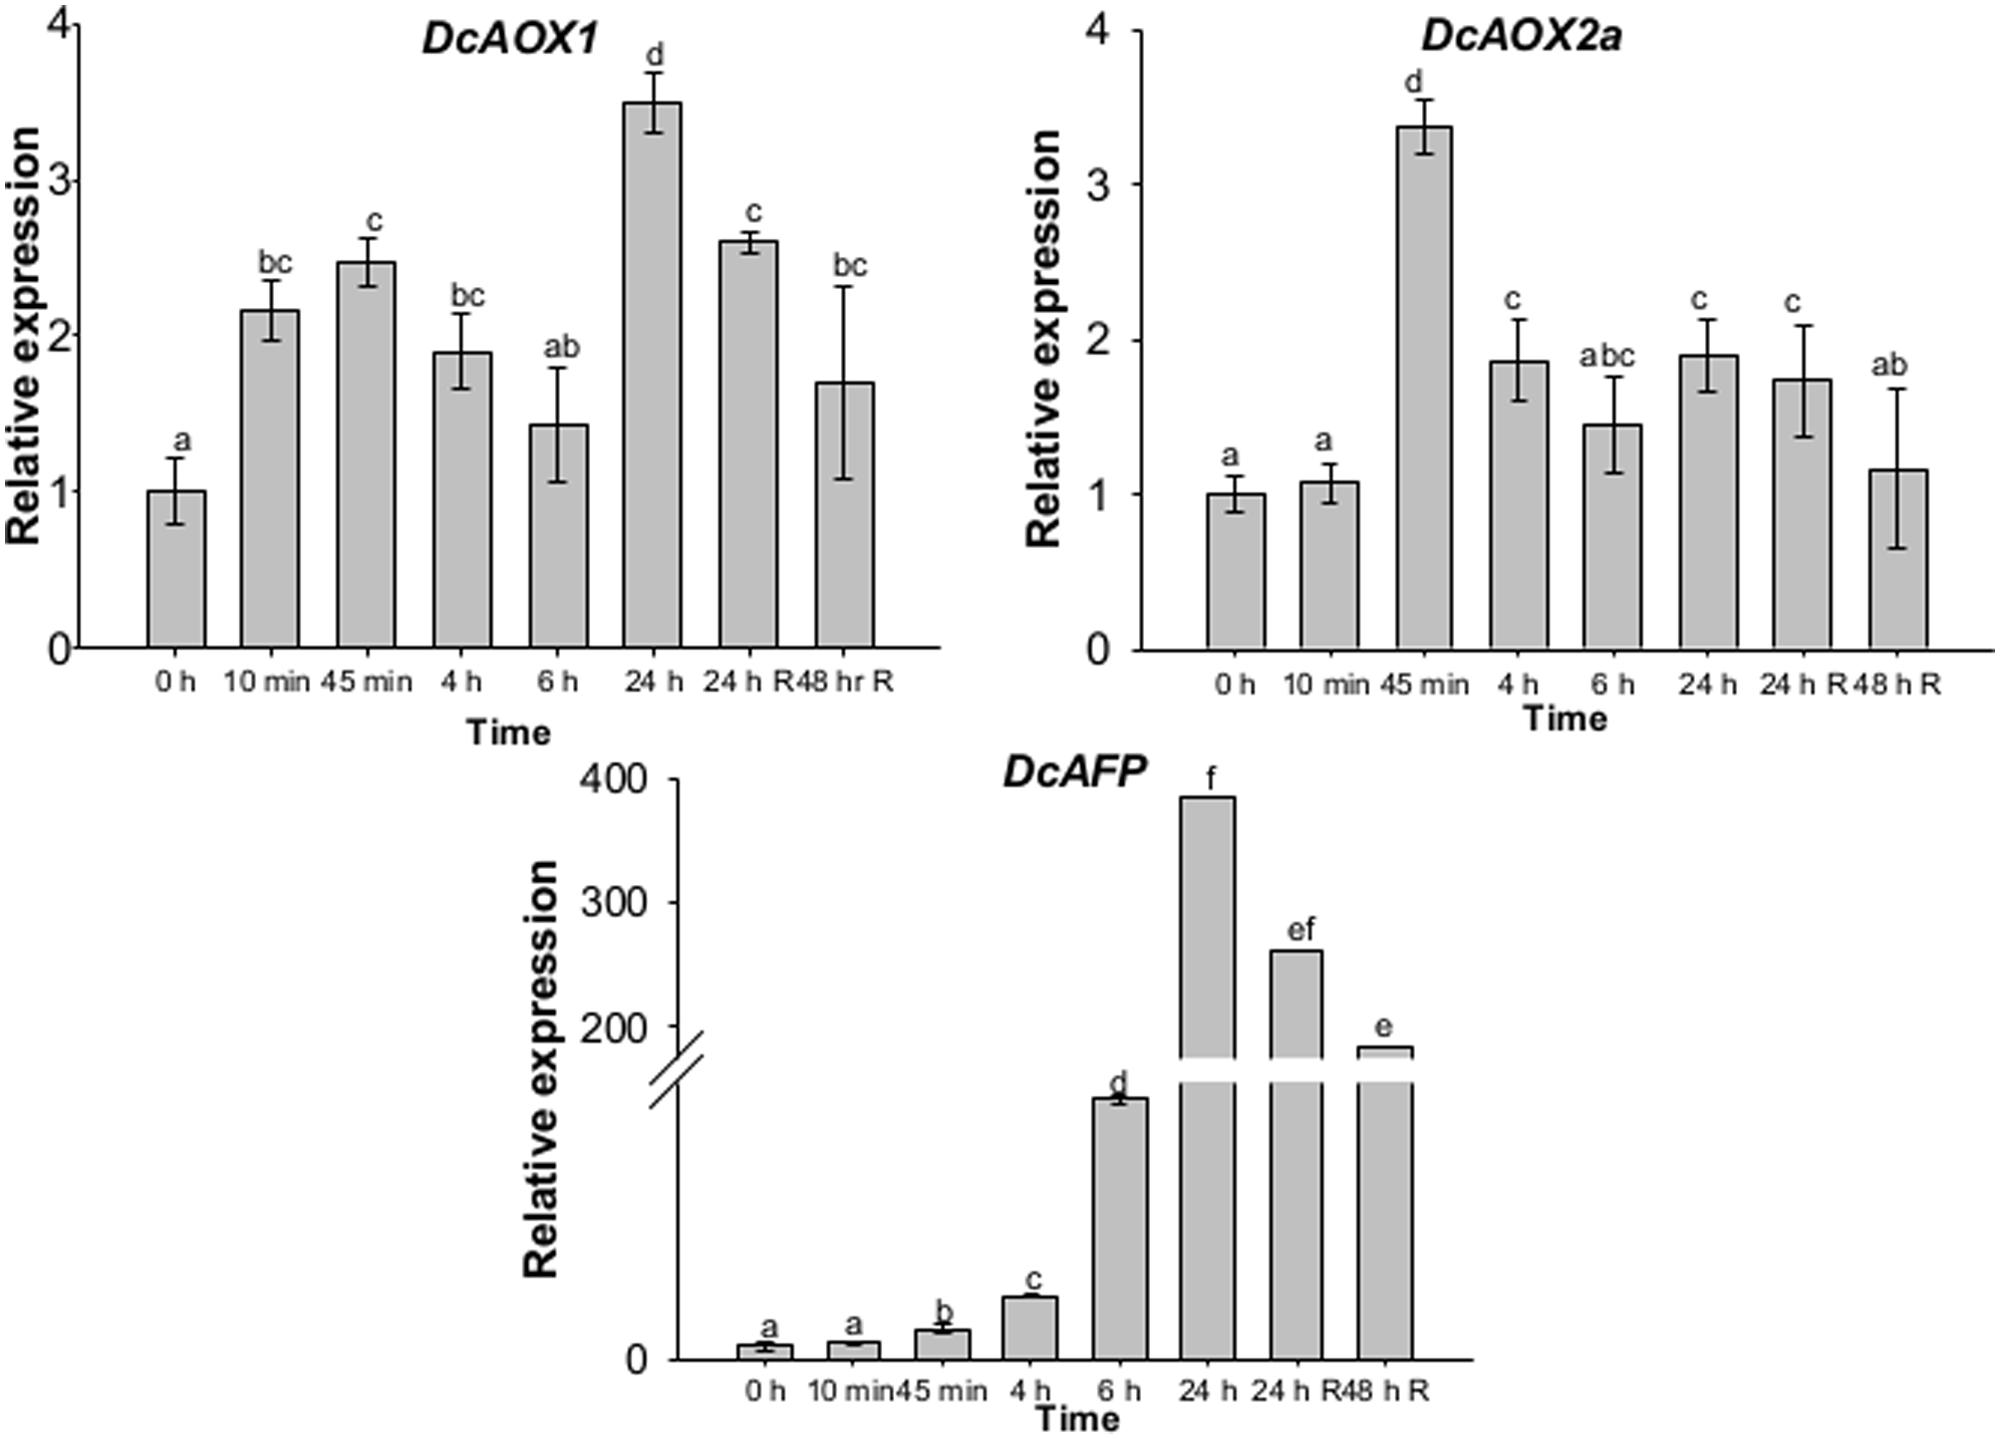
FIGURE 5. Transcript levels of DcAOX1, DcAOX2a, and DcAFP during CE in 1-month-old carrot (Daucus carota L. cv. Rotin) seedlings. Samples were harvested at 0 hpce (immediately before CE) and after 10 min, 45 min, 4, 6, and 24 h of exposure at 4°C and after 24 and 48 h after transferring plants back to the initial growth conditions (recovery period). Expression data was analyzed by RT-qPCR using DcEF1α as reference gene. Data are the mean values ± SE of four plants considered per time point. Statistical analysis (one-way ANOVA with Tukey’s post hoc test) was applied to each gene separately. Different superscript letters indicate significant differences between sampling points
Compared to both AOX genes, cold-responsive gene AFP in carrot showed a later but much higher level of transcripts in plants subjected to chilling stress. After 10 and 40 min of cold stress, the increase was only of 1.15 and 2.17-fold difference in RE from the 0 hpce, respectively, (Figure 5). However, DcAFP expression then highly increased, particularly at 24 hpce, showing an almost 400-fold difference comparing to 0 hpce (Figure 5).
Analysis of Complete DcAOX1 Sequences
A single band of expected size (ca. 450 bp) was obtained with primer combination P1/P2 and identified as D. carota AOX1 based on high similarity with AOX gene sequences from other plant species available at NCBI database. Sequenced clones obtained were of 444 bp, and showed similarity between 75 and 99% with AOX from different plant species. For 5′-end isolation, reverse specific primer was used in combination with vector specific primer, which led to the amplification of a fragment near 1000 bp. For 3′-end isolation, the use of a forward specific primer in combination with the oligo d(T) primer, led to the amplification of fragments between 670 and 827 bp (described below). Based on match of 5′ and 3′-UTR sequences with initial partial exon 3 sequence, in silico full-length cDNA of D. carota AOX1 (DcAOX1) was predicted.
At genomic level, DcAOX1 of D. carota L. cv. Rotin has 1812 bp, consisting of three exons (exon 1: 432 bp, exon 2: 489 bp, and exon 3: 57 bp) interrupted by two introns (intron 1: 630 bp and intron 2: 173 bp) (Figure 6). Gene structure of DcAOX1 and structure of previously identified AOX1 genes in several other plant species are shown in Supplementary Table S1. At transcript level, it has 1366 bp in length with a continuous open reading frame (ORF) of 981 bp, which encodes a putative polypeptide of 326 amino acid residues. The homologous identity score performed in NCBI with deduced amino acid residues showed that DcAOX1 shares a high degree of similarity with AOX1 proteins from other plant species such as Nicotiana benthamiana (78%), Brassica juncea (73%), Gossypium hirsutum (72%), and Arabidopsis lyrata (70%). Different lengths of 3′-UTR were identified on DcAOX1 cDNA sequences (3′ end isolation), varying between 185 and 344 bp (data not shown).
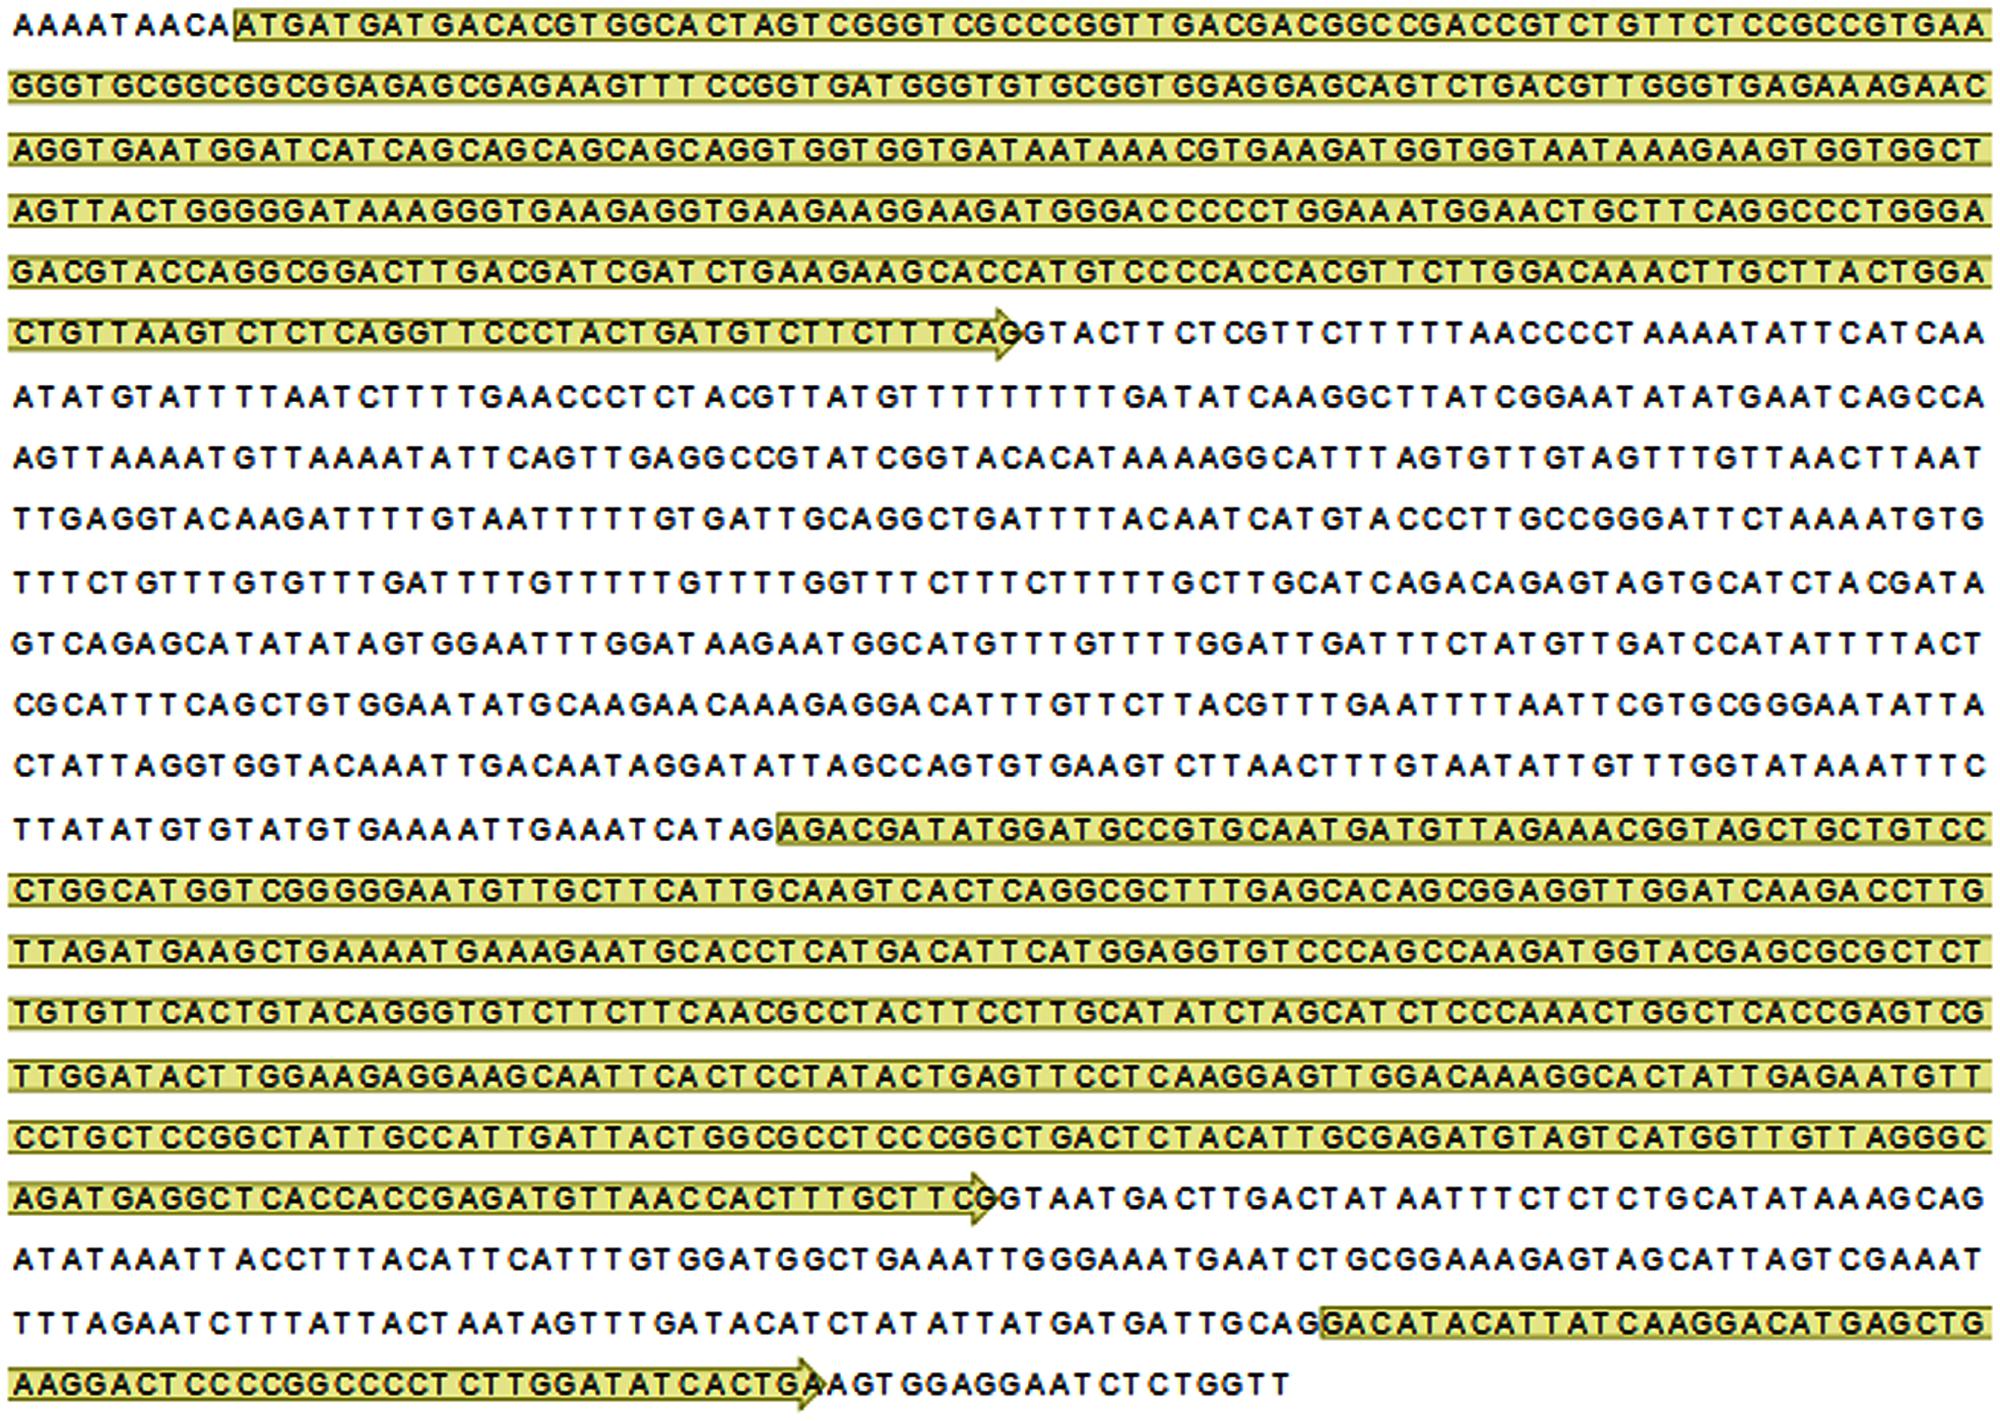
FIGURE 6. Nucleotide sequence of gDNA encoding Daucus carota L. cv. Rotin AOX1 (DcAOX1) (GenBank acc. no. KJ669723). Exons are indicated in yellow.
DcAOX1 revealed structural features usually found in AOX1 sub-family members, with highly variable N-terminal region. DcAOX1 also showed two conserved cysteines (CystI and CystII) and di-iron-binding sites (Figure 7). DcAOX1 protein was predicted to be localized in mitochondria (mTP score of 0.868). The predicted length of the cleavage site of the mitochondrial targeting sequence is of 14 amino acids. Prediction of mitochondrial transit peptide for sequences used in the alignment of Figure 7 shows no conservation across protein sequences and species, with DcAOX1 presenting the smallest predicted length. AOX1 sequences from O. sativa showed a predicted length of the mitochondrial targeting peptide of 67 (BGIOSGA008063), 58 (BGIOSGA005788), 54 (BGIOSGA014422), or 51 (BGIOSGA014421) amino acids. A. thaliana AOX1 predicted length of mitochondrial targeting peptide displayed 52 (AT3G22360), 63 (AT3G22370), 53 (AT3G27620), or 50 (AT1G32350) amino acids.
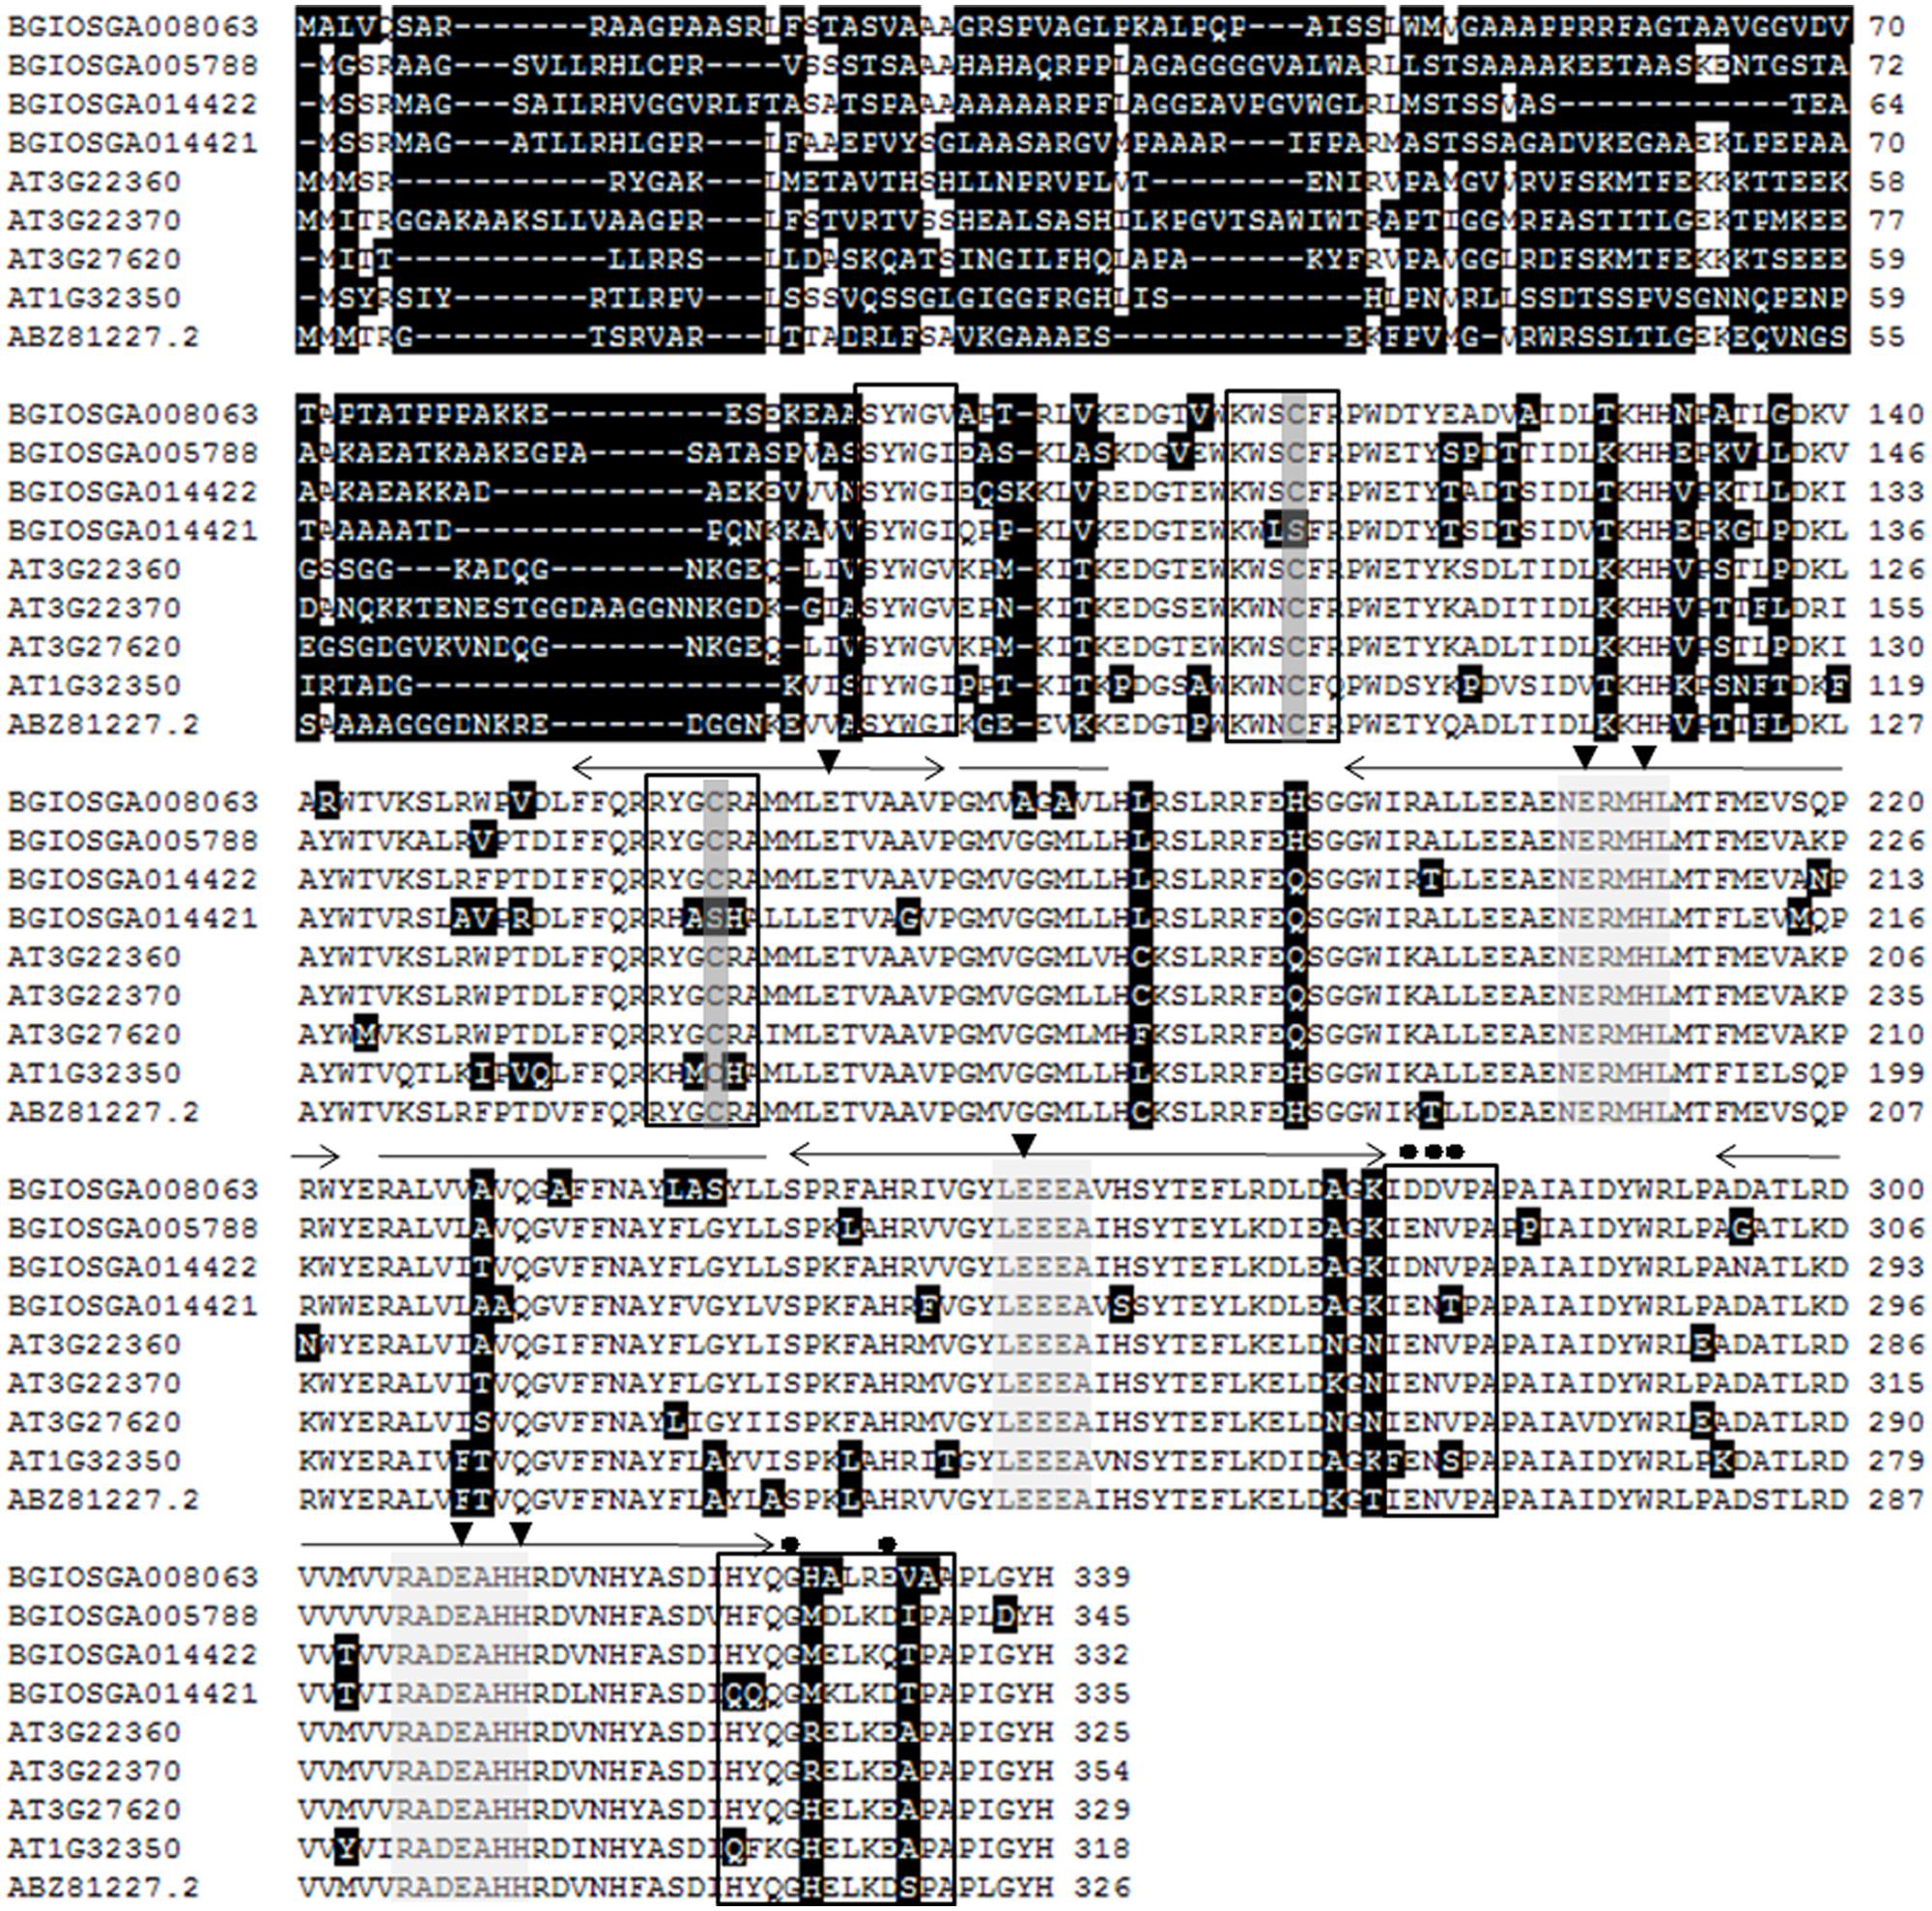
FIGURE 7. Multiple alignment of translated amino acid sequences of previously reported AOX1 proteins from Oryza sativa (BGIOSGA008063, BGIOSGA005788, BGIOSGA14422, BGIOSGA14421), A. thaliana (AT3G22360, AT3G22370, AT3G27620, AT1G32350) (Cardoso et al., 2015) and DcAOX1 (ABZ81227.2). Data retrieved from public web-based databases, freely available (Plaza: http://bioinformatics.psb.ugent.be/plaza/; e!EnsemblPlants: http://plants.ensembl.org/Multi/Search/New?db=core; and NCBI :http://www.ncbi.nlm.nih.gov/). Amino acid residues differing are shown on a black background, deletions are shown by minus signs. The sites of two conserved cysteins (CysI and CysII) involved in dimerization of the AOX protein by S–S bond formation (Umbach and Siedow, 1993) are indicated in dark gray boxes. Amino acid in light gray boxes are three regions defined by Berthold et al. (2000) as highly conserved in AOX. E (glutamate) and H (histidine) amino acid residues involved in iron-binding are indicated by filled triangles. Black boxes indicate the structural elements proposed to influence AOX regulatory behavior (Crichton et al., 2005), residues potentially involved in regulation of AOX activity are indicated by filled circles. Helical regions assumed to be involved in the formation of a hydroxo-bridged binuclear iron center (Andersson and Nordlund, 1999; Berthold et al., 2000) are shown by two-headed arrows above the amino acid sequences. Possible membrane-binding domains center (Andersson and Nordlund, 1999; Berthold et al., 2000) are shown with a line above amino acid sequences. The peptide sequences presented in this figure refer to the ORF translation of the sequences given in Figure 6.
The identified D. carota AOX1 sequence clearly nests within the AOX1 clade, and within the eudicots (Figure 8). Indeed, AOX1 sequences could be separated into two different groups: one including all eudicots sequences and other with the monocots (Figure 8A). Both within eudicots and monocots, the AOX1d clade was identified although not in an ancestral position (see Costa et al., 2014 for details). Within the eudicots, the Solanaceae, the Brassicaceae and the Fabaceae formed distinct monophyletic groups (Figure 8B).
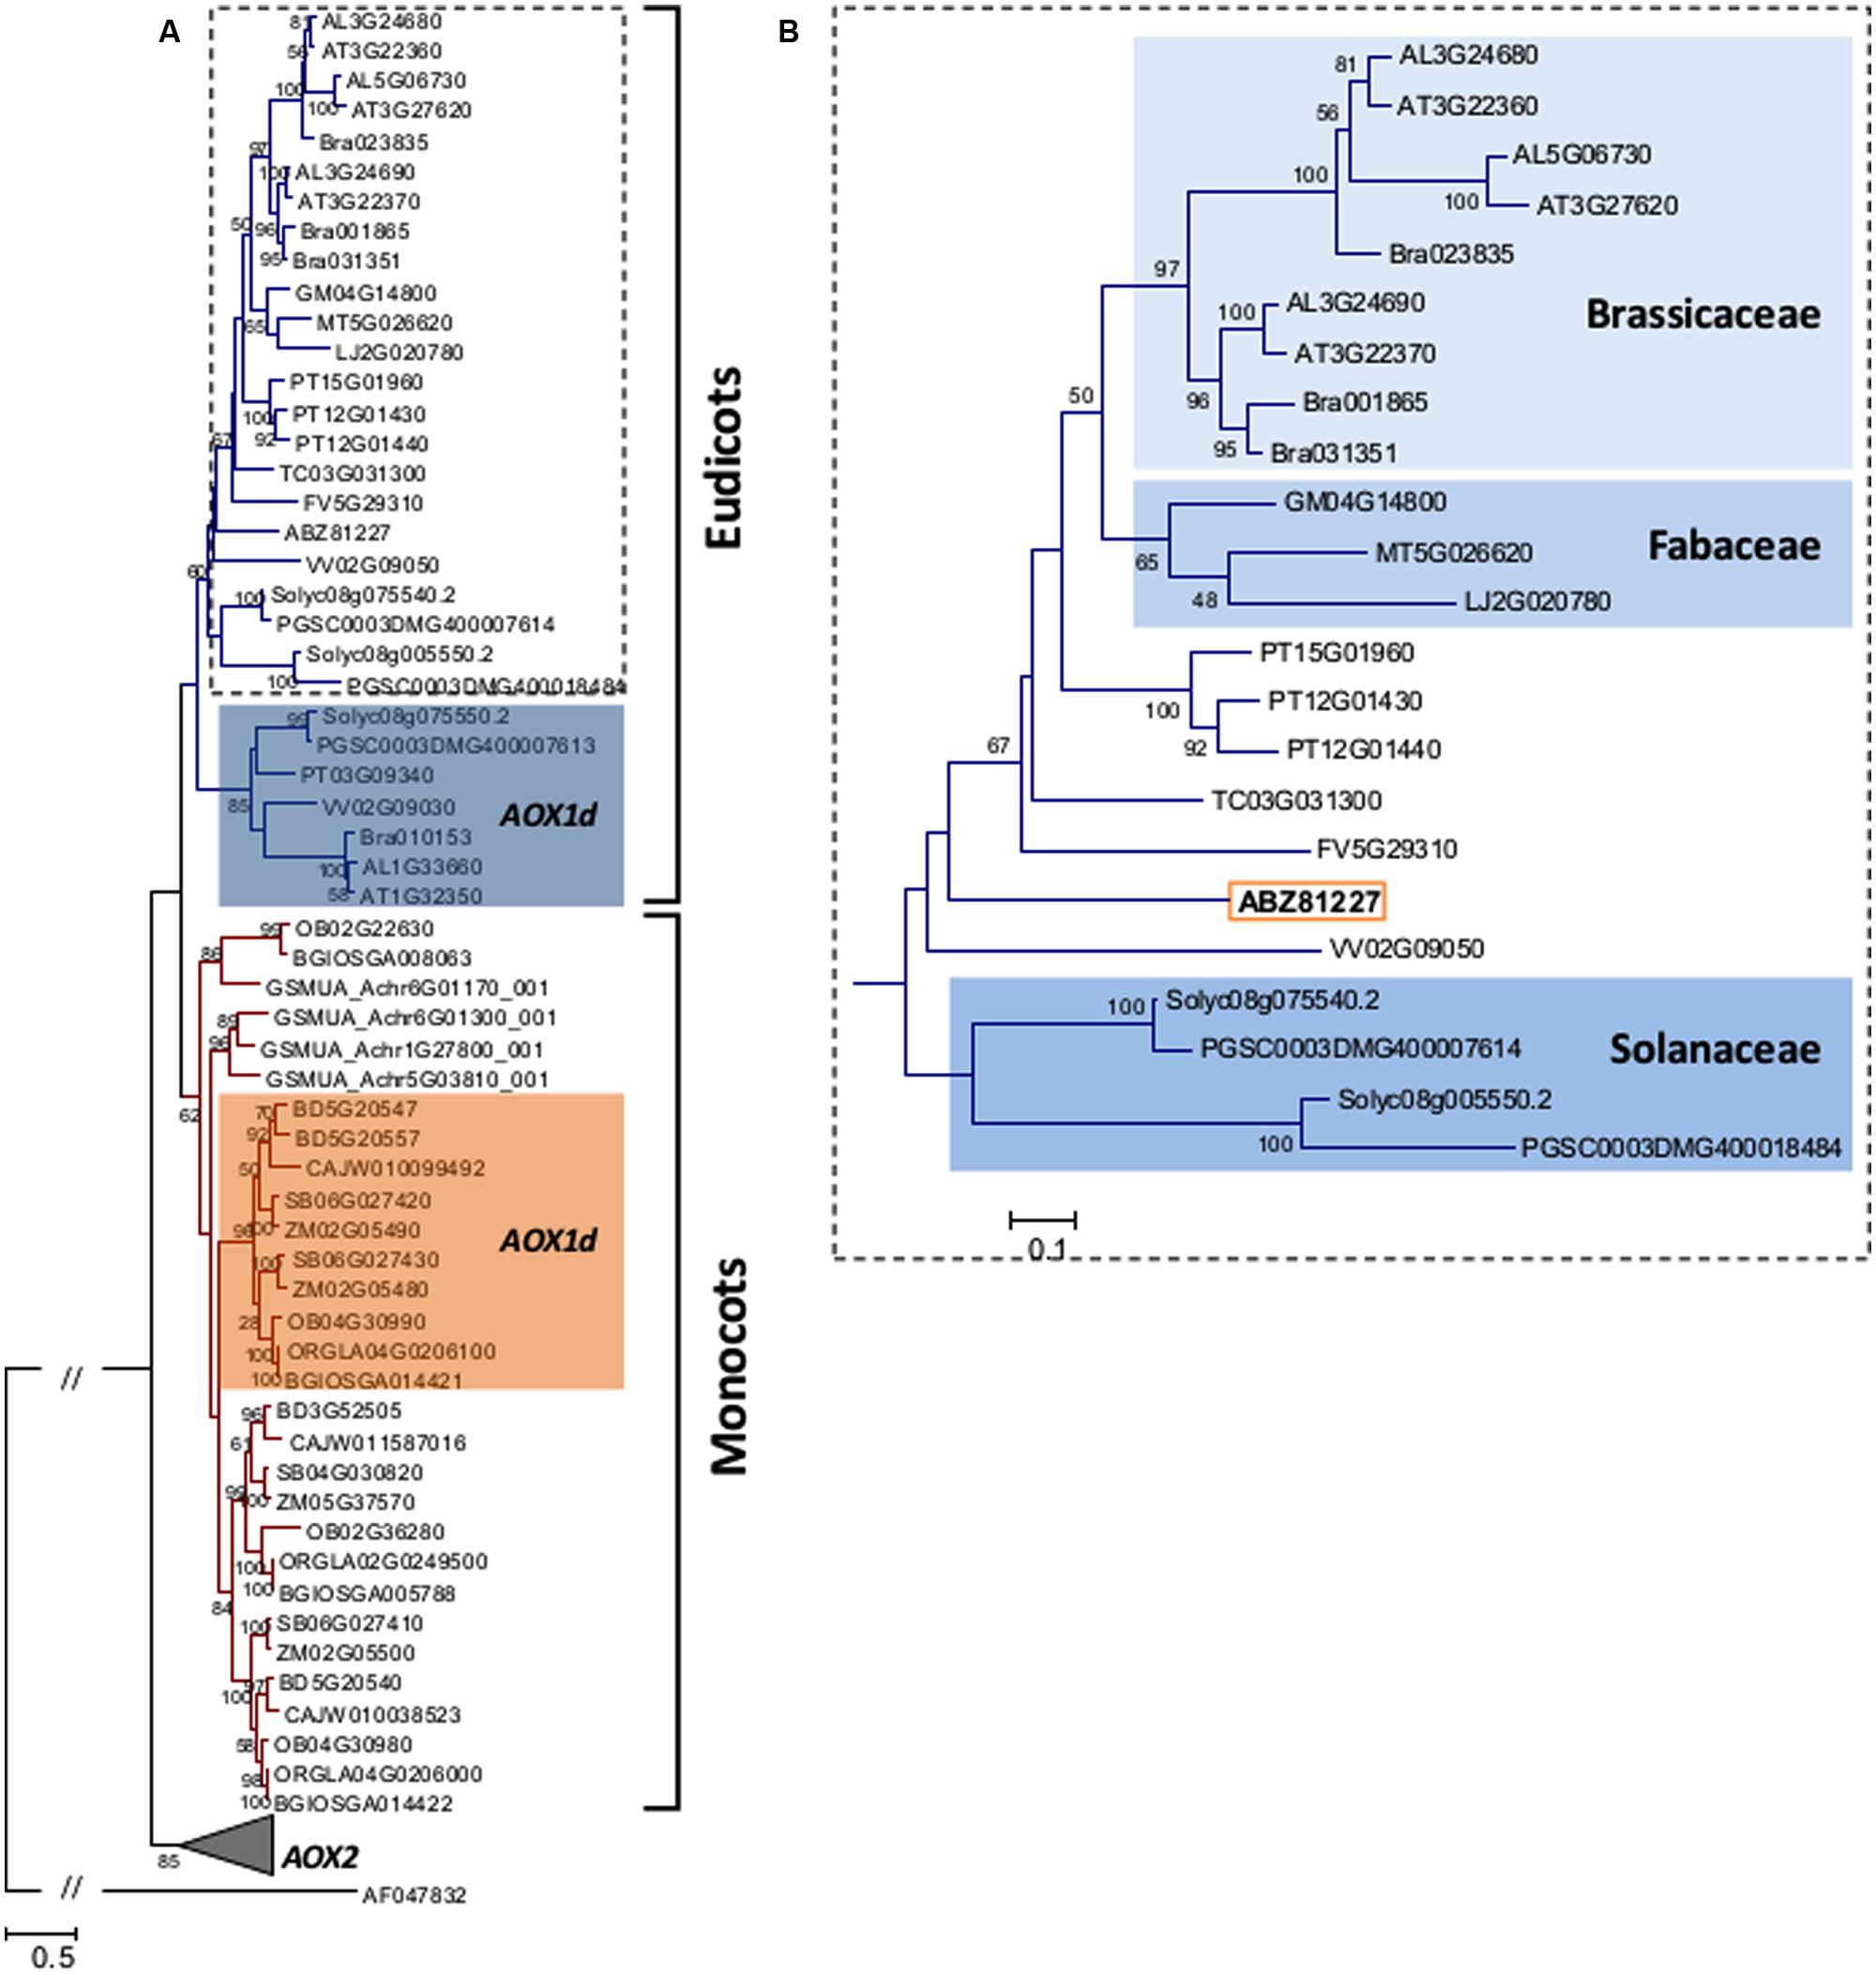
FIGURE 8. (A) Maximum likelihood (ML) tree showing the relationships among translated amino acid sequences of previously reported AOX1 proteins from plants, including the DcAOX1 sequence (ABZ81227.2) of D. carota L. cv. Rotin. Phylogeny reconstruction was done following the parameters described in the Section “Material and Methods”. Data retrieved from public web-based databases, freely available (Plaza: http://bioinformatics.psb.ugent.be/plaza/; e!EnsemblPlants: http://plants.ensembl.org/Multi/Search/New?db=core; and NCBI: http://www.ncbi.nlm.nih.gov/). AOX sequences were annotated by Cardoso et al. (2015) and AOX1 sequences are identified in Supplemental Table S1. (B) AOX eudicot clade, without AOX1d representatives, showing the position of DcAOX1 sequence (ABZ81227.2).
Discussion
AOX, Cell Reprogramming, and Temperature-Dependent Growth
Cell reprogramming upon external stress initiates cascades of events including dedifferentiation and de novo differentiation (see Nagl, 1987, 1989, 1992; Arnholdt-Schmitt, 2004; Fehér, 2015 and references there in; Grafi and Barak, 2015). Dedifferentiation can be rapidly induced as shown by severe stress through protoplastation (within 24 h) (Fehér, 2015 and references therein). Since its beginning, plant tissue culture has substantially contributed to the current understanding of inducibility of differentiation events and the role of associated stress (e.g., Bassi, 1990; Arnholdt-Schmitt, 2001; Zavattieri et al., 2010; Grafi et al., 2011). The carrot PCS used for our experiments was first described by Steward et al. (1952) to study mechanisms of growth, and was later improved and maintained as an experimental system for studies on cell reprogramming (see review in Arnholdt-Schmitt, 1993b, 1999). In PCS, tissue dedifferentiation is induced in cells from the secondary phloem followed by callus growth initiation, mainly due to cell divisions (Arnholdt-Schmitt, 1993b). Cells from secondary phloem are quiescent adult cells that recently had developed by switching fate from meristem to phloem cells. The cambial root cells are considered target cells for both yield formation and environmental responses (Arnholdt-Schmitt, 1999). New meristem nests in the callus are unregularly distributed across the explant, beneath the periphery. Such cell fate switching can happen via stress-induced endogenous hormone regulation directly in perivascular stem cells, or indirectly via dedifferentiation in differentiated, competent cells, as it was shown for the well-studied process of somatic embryogenesis (e.g., Grieb et al., 1997).
The efficiency by which cell reprogramming can occur is of special interest, as this process is important for applied systems such as in breeding or commercial propagation. In a given system, efficiency might be limited during phase of induction or during initiation, or both. Fehér (2015) pointed that genetic differences for efficiency are more likely to be found during initiation. The usefulness of calorespirometry to study morphogenic responses (i.e., cell reprogramming) in in vitro cultures was first demonstrated by Kim et al. (2006) and later, this system was also used by Nogales et al. (2013) in D. carota cv. Rotin PCS to study temperature-dependent growth performance at 21°C and 28°C. In their study, an early peak around day 4 for Rstruct_biomass was observed, which was coincident with the cell reprogramming process that happens in this system. In the present work, using this same system, we studied potential genotype differences on the early increase of Rstruct_biomass associated with cell reprogramming process, and we found that the peak appeared homogeneously in all five tested PCS. However, the different slopes found in the curve of Rstruct_biomass from day 0 to day 4 were indeed plant dependent. Genotype differences that can be measured by calorespirometry are supposed to differ in carbon use efficiencies, which in turn depend in plants essentially on the ratio of alternative and cytochrome oxidase respiration activity.
AOX genes seem to have a role during earliest events of cell reprogramming upon environmental changes (Arnholdt-Schmitt et al., 2006). For somatic embryogenesis, Frederico et al. (2009a) showed an early expression of AOX genes during initiation of the embryonic development (‘realization phase’ after depletion of auxin in the medium), being DcAOX1 gene the one responding at higher level than DcAOX2a. In olive microshoots that were induced to rooting, callus growth that originated from cells close to the xylem and preceded rooting could not be inhibited by salicylhydroxamic acid (SHAM), a known inhibitor of AOX, while in the same system at the identical plants and morphologic region root induction was suppressed by SHAM (Macedo et al., 2012). This observation suggests that AOX is not required for callus growth per se. However, the induction of root organogenesis seemed to be linked to AOX activity. Therefore, a role for AOX may be seen in the early control of signaling and metabolic homeostasis for carbon and energy metabolism as a prerequisite for later balancing growth and development according to the available environmental conditions. This view confirms the proposal of Vanlerberghe (2013) and seems also to fit to the observations of Petrussa et al. (2009), who pointed the role of AOX as an anti-apoptotic factor in neighbor cells that have critical role for the reprogramming to somatic embryogenesis in Abies alba (see also Smertenko and Bozhkov, 2014; Arnholdt-Schmitt et al., 2015b). In carrot PCS, our results suggest a role of DcAOX1 and DcAOX2a genes during the 1st hours of induced de novo differentiation of secondary phloem explants. These genes showed a modest though consistent increase in transcript levels until 36 h after inoculation and subsequent down-regulation before the beginning of the exponential growth. Due to the a priori unknown high intrinsic variability of the explants, future experiments must, however, include a higher number of samples.
AOX has been shown to be especially active in meristematic tissues (Hilal et al., 1997) and several studies have indicated links between AOX activity and plant growth (Arnholdt-Schmitt et al., 2006; Vanlerberghe, 2013 and references therein). Strong support for this view was found by experiments performed under various nutrient conditions in transgenic tobacco cells with silenced AOX1a. Sieger et al. (2005) demonstrated that AOX1a-knockdown led to the incapacity of the cells for down-regulating growth under P- and N-deficiency, and concluded that AOX activity provides a mechanism for adjusting growth and counteracting nutrient imbalance. When maintaining the knockdown of AOX1a, tobacco cell growth was connected to more stable carbon use efficiency. Arnholdt-Schmitt et al. (2006) also hypothesized on the importance of considering down-regulation of AOX as a potential tool for molecular breeding on higher nutrient efficiency. This led us to explore the hypothesis that differential AOX gene regulation relates to growth rates, with expected higher levels of AOX connected to suppressed growth or to lower growth rates, which indeed seems to fit to our observations during the lag phase of PCS growth, particularly until 8 days, where a dynamic behavior of both AOX genes but no increase in FW (although substantial amounts of nutrients were provided) were found. During lag phase, cells are thought to be prepared for the new fate and in PCS, first cells are reported to enter into the S-phase of cell cycling from 12 hpi to 24 hpi (Gartenbach-Scharrer et al., 1990). According to its known effect on cell homeostasis (Vanlerberghe et al., 2009; Vanlerberghe, 2013), AOX could have contributed to suppressing growth during lag phase.
Because temperature is a major environmental constraint and can influence the molecular mechanisms controlling growth, we have looked at the effect of temperature on AOX gene expression during exponential growth phase. Previous studies in PCS demonstrated that callus growth was significantly increased at 28°C compared to 21°C (Arnholdt-Schmitt, 1999), and our results showed that DcAOX1 responded to a higher growing temperature in the exponential phase of the PCS. However no direct link was detected between callus FW and individual AOX genes expression (not shown).
In a first attempt to transpose these findings to plant level, we investigated both AOX genes in a chilling plant pot experiment, and compared it with the expression of the gene encoding the AFP. Interestingly, the two AOX genes were co-regulated in both PCS and pot experimental systems, which is in agreement with previous findings (Campos et al., 2009; Van Aken et al., 2009; Vanlerberghe, 2013). Clifton et al. (2005) analyzed the response of plant cells from A. thaliana at 3 h and up to 24 h post exposure upon various treatments designed to induce abiotic stress, and identified alternative respiration pathway components as the most important ones for early responses. The components of normal respiration were shown to be more stable during early times of acclimation without pronounced variations in transcript abundance. Low temperature stress – either chilling or freezing – is one of the most important abiotic stresses, with plants showing reduced yield (Beck et al., 2004). Our results indicated DcAOX1 as the highest/rapidly responsive AOX gene during cold stress in carrot (Figures 4 and 5). Nevertheless, the patterns of transcript abundance over time course also revealed a further prevalent response of DcAOX2a, which was basal in control conditions (Figure 4). In general, AOX1 is reported as a stress-responsive gene, whereas AOX2 sub-family members were considered during long time as housekeeping genes or related to developmental events (Considine et al., 2002). Later on, AOX2 members were found also to be involved in plastid-dependent signaling (Clifton et al., 2005) and in response upon several stress factors, including cold stress (Costa et al., 2010). AOX2 stress response during chilling was also seen in the present study. In A. thaliana, Fiorani et al. (2005) reported a significantly lower leaf area in an AOX1a anti-sense line growing upon low temperature when comparing with the wild type. This phenotype was associated with reduced amount of AOX transcripts (almost entirely suppressed) and consequently low level of AOX protein. The authors suggested that the lower level of AOX1a protein could point to a reduced ability of the plant to cope with low temperature throughout the whole vegetative growth period. Taken these results together, it can be concluded that differential expression and co-regulation of diverse AOX family member genes might contribute to fine-tuning the metabolic-physiological cell responses upon stress toward deciding for growth and/or development.
DcAOX1 Sequence and Phylogenetic Analyses
Plant plasticity allows coping with stressful environmental conditions. Rapid acclimation and adaptation are desired plant characteristics, and target traits for which we aim to develop functional markers. It was thus our interest to look for genetic variability in a target gene, which could be linked with the desired trait. In this frame, the existence of polymorphisms in AOX gene sequences (alleles, haplotypes) is an essential basis for association studies to find links to achieve breeding goals (Arnholdt-Schmitt, 2015). Nevertheless, the measurement of the final effect of selected gene polymorphisms on complex traits such as abiotic stress tolerance must be performed following case-sensitive physiological approaches (Nogales et al., 2015). A system that involves the heterologous expression of AOX in the yeast Schizasaccharomyces pombe-that naturally does not have AOX genes (Albury et al., 1996) – is a potential candidate system for the study of the functionality of selected polymorphisms in AOX genes. The study of the effect of selected polymorphisms putatively linked to growth under different environmental conditions (e.g., high or low temperatures, salinity) can be aided by the use of specific technologies such as oxygraphy, stable oxygen isotope analysis and calorespirometry (Arnholdt-Schmitt et al., 2015a). With these technologies, AOX capacity, AOX in vivo activity and metabolic growth rates can be measured. This would enable finding the link between selected polymorphisms and the final effect on growth potential. These pre-screenings would help reducing significantly the number of plants to test in field trials to identify and validate candidate functional markers. Complete information about gene sequences is essential, since it is known that important/relevant differences between genotypes often occur not only in the coding region, but also in introns or UTRs. DcAOX2a gene isolation and variability in intronic regions among genotypes was already described (Campos et al., 2009; Cardoso et al., 2009). DcAOX1 gene sequence and structural organization were still unknown and are here reported for the first time. However, although AOX genes could be general candidate markers related to diverse types of abiotic and biotic stress reactions, the role of AOX can differ between species and needs to be validated at species as well as at target tissue or cell level depending on the crop and breeding goals (Arnholdt-Schmitt, 2005, Arnholdt-Schmitt et al., 2006; Vanlerberghe, 2013). Future analyses on DcAOX protein content and activity will be essential for a better understanding of the involvement of DcAOX in response to stress conditions.
At transcript level, DcAOX1 is 1366 bp in length, encoding a putative polypeptide of 326 amino acid residues. Variability on the DcAOX1 3′-end was observed, ranging from 185 to 344 bp, with 294 bp as the average size. The involvement of alternative polyadenylation (production of mature transcripts with 3′-ends of variable length) in oxidative stress response in plants has been pointed out (Xing and Li, 2011). AOX genes members present variability at the 3′-end, with a length ranging between 111 and 313 bp in maize (Polidoros et al., 2005) and between 76 and 301 bp in olive (Macedo et al., 2009). In AOX1 genes, previous transcript analysis highlighted also the existence of length variation between Arabidopsis and O. sativa (Loke et al., 2005; Shen et al., 2008).
Analysis of the deduced amino acid sequence revealed structural features usually found in most of the higher plant AOXs (Figure 6). The role of some of these residues in AOX activity have been previously studied using site-directed mutagenesis in plants and other organisms such as protists, which revealed that many residues are critical for activity (Ajayi et al., 2002; Albury et al., 2002; Berthold et al., 2002; Crichton et al., 2005, 2010; Nakamura et al., 2005; Moore et al., 2013). Multiple sequence alignment showed a highly variable N-terminus of AOX1 sub-family as a result of low similarity amongst exon 1 sequences. Lack of homology in mitochondrial targeting signals is common and typical for proteins which require N-terminal signals for mitochondrial import (Finnegan et al., 1997). Despite the variability in length of the transit peptide, its presence is vital for targeting the peptide to mitochondria.
The conserved cysteine residues assumed to be involved in post-translational regulation of AOX activity (Umbach and Siedow, 1993; Rhoads et al., 1998; Grant et al., 2009) were also identified in DcAOX1. In some plant species, the conserved CysI in the N-terminal region of protein is replaced by SerI (Umbach and Siedow, 1993; Costa et al., 2009). This leads to regulation by succinate instead of pyruvate (Holtzapffel et al., 2003; Grant et al., 2009). Substitution of CysII by SerII can be observed in the alignment presented in the present work (Figure 6). However, physiological consequences of such changes are still unknown. Within AOX1 family monocots can be separated from eudicots and within the last ones, some groups form separated clades highlighting their common evolutionary history. Differential regulation on AOX gene subfamilies described by several authors may come from different positions in the plant genomes related to chromosomal territories (Arnholdt-Schmitt, 2004; Costa et al., 2009). The common distribution of AOX members is on at least two different chromosomes, at one gene per chromosome, occurring either in sense or antisense orientation (Cardoso et al., 2015). Furthermore, the presence of iron-binding motifs within four helical regions suggests that AOX might be a member of di-iron carboxylate protein family (Berthold et al., 2002; Berthold and Stenmark, 2003; Moore et al., 2008). Four conserved α-helical regions rich in histidine and glutamate were identified in DcAOX1, involved in the formation of hydroxyl bridged binuclear iron center (Siedow et al., 1995).
The predominant structure of genomic AOX sequences, including also both carrot DcAOX2 genes (DcAOX2a and DcAOX2b), consists of four exons interrupted by three introns at well-conserved positions (Campos et al., 2009; Cardoso et al., 2015). Genes sharing this structure usually show exon size conservation for last three exons (Campos et al., 2009). Although not conserved, exon 1 presents a size around 300 bp (Campos et al., 2009; Cardoso et al., 2015). This feature is responsible for the formation of similar AOX proteins across different plant species. However, in DcAOX1 loss of intron 1 was identified (Supplementary Table S1). Hence, a fusion of exon 1 and 2 could have consequently resulted in increase in exon size (432 bp) as compared to the common size of around 300 bp for exon 1 in genes showing the 4 exon structure. Nevertheless, it was observed that the last two exons showed a conserved size of 489 bp and 57 bp, respectively. Evolutionary intron loss and gain have resulted in the variation of intron numbers in some AOX members, with alterations in exons size (Considine et al., 2002; Polidoros et al., 2009; Cardoso et al., 2015; Supplementary Table S1). For instance, Cardoso et al. (2015) reported the existence of an AOX gene of Oryza brachyantha with six exons and five introns and showed the existence of an Hordeum vulgare AOX gene completely devoid of introns. Recent findings also showed the absence of introns in an AOX gene member of Triticum urartu (EnsemblPlants acc. n° TRIUR3_12374) (data not shown).
Conclusion
With this study, calorespirometry arises as a suitable technology for the identification of cell reprogramming events related to metabolic and respiratory activity in carrot and shows a great potential to be used for phenotyping yield stability in in vitro systems. Our results are comparable with previous results showing an early peak in structural biomass formation during the lag phase of growth in the PCS, and show that DcAOX1 and DcAOX2a were co-expressed in the earliest events in cell reprogramming upon environmental changes (inoculation or chilling). DcAOX1 responded also to higher growing-temperature in the exponential phase of the PCS. For a better understanding of these results, the complete gene sequence of DcAOX1 and its structural organization are analyzed. High-throughput genotype screening on complete DcAOX1 and DcAOX2a genes could help on future identification of important within-gene motifs for co-regulation and differential transcript accumulation in view of novel resources for functional marker identification.
Author Contributions
MC performed the PCS experiments and respective data processing and analysis, isolation of DcAOX1 gene, and was driving writing of the manuscript. AN performed the calorespirometry measurements and respective data analysis. HC supervised RT-qPCR analysis, isolation of the DcAOX1 gene and CE experiments. SRK performed the CE experiment and respective data processing. TN performed the phylogenetic analysis. RS was involved in CE experiment design. BA-S supervised responsibly AOX research, overall experiments design and writing of the manuscript. All authors read, critically revised and approved the manuscript.
Funding
This work was funded by FEDER Funds through the Operational Program for Competitiveness Factors – COMPETE and National Funds through FCT – Foundation for Science and Technology under the Strategic Project PEst-C/AGR/UI0115/2011 and PEst-OE/AGR/UI0115/2014, and by the project FCOMP-01-0124-FEDER-027385 (ref. FCT: EXCL/AGR-PRO/0038/2012). The authors are thankful to the Portuguese FCT – Foundation for Science and Technology for the support provided to MC (SFRH/BD/65354/2009) and given under the program POPH – Programa Operacional Potencial Humano to BA-S and HC (Ciência, 2007, 2008: C2008-UE/ICAM/06). TN was supported by a Marie Curie fellowship (FP7-PEOPLE-2012-CIG Project Reference 321725) and by the Portuguese Foundation for Science and Technology –FCT- (SFRH/BCC/52187/2013). We further acknowledge fellowships provided to SRK within the project PTDC/EBB-BIO/099268/2008 and to AN within the project PTDC/AGR-GPL/111196/2009.
Conflict of Interest Statement
The authors declare that the research was conducted in the absence of any commercial or financial relationships that could be construed as a potential conflict of interest.
Acknowledgments
The authors want to thank Bettina Linke from Humboldt University, Berlin, Germany for providing the cDNA library used for gene isolation, and appreciate language corrections and important comments by Catarina Campos (Universidade de Évora, Portugal).
Supplementary Material
The Supplementary Material for this article can be found online at: http://journal.frontiersin.org/article/10.3389/fgene.2016.00001
FIGURE S1 | (A) Growth curve of primary cultures system of D. carota L. cv. Rotin during 28 days in culture at 21°C in four individual plants. Data are shown as callus FW values and represented as mean ± SD. (B) Explants from the secondary phloem of carrot tap roots PCS. Aspect of the explants (1) before (T0), (2) 14 days, and (3) 28 days after in vitro inoculation.
Abbreviations
AFP, anti-freezing protein; AOX, alternative oxidase; cDNA, complementary DNA; CE, chilling exposure; EF1α, Elongation factor 1 alpha; FW, fresh weight; gDNA, genomic DNA; hpce/mpce/dpce, hours/minutes/days post chilling exposure; hpi/dpi, hours/days post inoculation; PCS, primary culture system; RE, relative expression; ROS, reactive oxygen species; RT-sqPCR, reverse transcription semi-quantitative real time polymerase chain reaction; RT-qPCR, reverse transcription quantitative real time polymerase chain reaction.
Footnotes
- ^ http://imagej.nih.gov/ij/
- ^ www.macrogen.com
- ^ http://www.ncbi.nlm.nih.gov/
- ^ http://bioinformatics.psb.ugent.be/plaza/
- ^ http://plants.ensembl.org/Multi/Search/New?db=core
- ^ http://webblast.ipk-gatersleben.de/barley/
- ^ http://mafft.cbrc.jp/alignment/server/
- ^ http://www.ncbi.nlm.nih.gov/spidey/
References
Ajayi, W. U., Chaudhuri, M., and Hill, G. C. (2002). Site-directed mutagenesis reveals the essentiality of the conserved residues in the putative diiron active site of the trypanosome alternative oxidase. J. Biol. Chem. 277, 8187–8193. doi: 10.1074/jbc.M111477200
Albury, M. S., Affourtit, C., Crichton, P. G., and Moore, A. L. (2002). Structure of the plant alternative oxidase. Site-directed mutagenesis provides new information on the active site and membrane topology. J. Biol. Chem. 277, 1190–1194. doi: 10.1074/jbc.M109853200
Albury, M. S., Dudley, P., Watts, F. Z., and Moore, A. L. (1996). Targeting the plant alternative oxidase to Schizosaccharomyces pombe mitochondria confers cyanide-insensitive respiration. J. Biol. Chem. 271, 17062–17066. doi: 10.1074/jbc.271.29.17062
Andersson, M. E., and Nordlund, P. (1999). A revised model of the active site of alternative oxidase. FEBS Lett. 449, 17–22. doi: 10.1016/S0014-5793(99)00376-2
Arnholdt-Schmitt, B. (1993a). Rapid changes in amplification and methylation pattern of genomic DNA in cultured carrot root explants (Daucus carota L.). Theor. Appl. Genet. 85, 793–800. doi: 10.1007/BF00225021
Arnholdt-Schmitt B. (1993b). Hormonsensitivitaet und Genomische DNS - Variabilitaet in Ihrem Bezug zur Ertragsbildung bei Daucus carota L. ssp. sativus: ein Beitrag zur Zellbiologie pflanzlichen Wachstums. Ph.D. thesis, Justus-Liebig-University Giessen, Gießen.
Arnholdt-Schmitt, B. (1999). On the physiology of yield production in carrots. – Implications for breeding towards nutrient efficiency. Gartenbauwissenschaft 64, 26–32.
Arnholdt-Schmitt, B. (2001). Genomic Instabilities in Tissue Culture – A Physiological Normality? Available at: http://bibd.uni-giessen.de/gdoc/2001/uni/p010012/genomic_instabil.pdf
Arnholdt-Schmitt, B. (2004). Stress-induced cell reprogramming. A role for global genome regulation? Plant Physiol. 136, 2579–2586. doi: 10.1104/pp.104.042531
Arnholdt-Schmitt, B. (2005). Efficient cell reprogramming as a target for functional-marker strategies? Towards new perspectives in applied plant-nutrition research. J. Plant Nutr. Soil Sci. 168, 617–624.
Arnholdt-Schmitt, B. (2015). “From AOX diversity to functional marker development,” in Alternative Respiratory Pathways in Higher Plants, eds K. J. Gupta, L. A. J. Mur, and B. Neelwarne (Oxford: John Wiley & Sons, Inc.).
Arnholdt-Schmitt, B., Costa, J. H., and de Melo, D. F. (2006). AOX - a functional marker for efficient cell reprogramming under stress? Trends Plant Sci. 11, 281–287. doi: 10.1016/j.tplants.2006.05.001
Arnholdt-Schmitt, B., Hansen, L. D., and Nogales, A. (2015a). Calorespirometry, oxygen isotope analysis and functional-marker-assisted selection (’CalOxy-FMAS’) for genotype screening: a novel concept and tool kit for predicting stable plant growth performance and functional marker identification. Brief Funct. Genomics doi: 10.1093/bfgp/elv008
Arnholdt-Schmitt, B., Ragonezi, C., and Cardoso, H. G. (2015b). “Do mitochondria play a central role in stress-induced somatic embryogenesis?,” in In vitro Embryogenesis in Higher Plants, eds M. Antonietta and M. Lambardi (New York: Springer).
Arnholdt-Schmitt, B., Herterich, S., and Neumann, K. H. (1995). Physiological aspects of genome variability in tissue culture. I. Growth phase-dependent differential DNA methylation of the carrot genome (Daucus carota L.) during primary culture. Theor. Appl. Genet. 91, 809–815. doi: 10.1007/BF00220964
Arnholdt-Schmitt, B., Valadas, V., and Doring, M. (2014). Functional marker development is challenged by the ubiquity of endophytes–a practical perspective. Brief Funct. Genomics 15, 1–6. doi: 10.1093/bfgp/elu049
Bassi, P. (1990). Quantitative variations of nuclear DNA during plant development: a critical analysis. Biol. Rev. 65, 185–225. doi: 10.1111/j.1469-185X.1990.tb01424.x
Beck, E. H., Heim, R., and Hansen, J. (2004). Plant resistance to cold stress: mechanisms and environmental signals triggering frost hardening and dehardening. J. Biosci. 29, 449–459. doi: 10.1007/BF02712118
Berthold, D. A., Andersson, M. E., and Nordlund, P. (2000). New insight into the structure and function of the alternative oxidase. Biochim. Biophys. Acta 1460, 241–254. doi: 10.1016/S0005-2728(00)00149-3
Berthold, D. A., and Stenmark, P. (2003). Membrane-bound diiron carboxylate proteins. . Annu. Rev. Plant Biol. 54, 497–517. doi: 10.1146/annurev.arplant.54.031902.134915
Berthold, D. A., Voevodskaya, N., Stenmark, P., Gräslund, A., and Nordlund, P. (2002). EPR studies of the mitochondrial alternative oxidase: evidence for a diiron carboxylate center. J. Biol. Chem. 277, 43608–43614. doi: 10.1074/jbc.M206724200
Bimboim, H. C., and Doly, J. (1979). A rapid alkaline extraction procedure for screening recombinant plasmid DNA. Nucleic Acids Res. 7, 1513–1523. doi: 10.1093/nar/7.6.1513
Campos, M. D., Cardoso, H. G., Linke, B., Costa, J. H., de, Melo DF, Justo, L., et al. (2009). Differential expression and co-regulation of carrot AOX genes (Daucus carota). Physiol. Plant. 137, 578–591. doi: 10.1111/j.1399-3054.2009.01282.x
Campos, M. D., Frederico, A. M., Nothnagel, T., et al. (2015). Selection of suitable reference genes for reverse transcription quantitative real-time PCR studies on different experimental systems from carrot (Daucus carota L.). Sci. Hortic. (Amsterdam) 186, 115–123. doi: 10.1016/j.scienta.2014.12.038
Cardoso, H. G., and Arnholdt-Schmitt, B. (2013). “Functional marker development across species in selected traits,” in Diagnostics in Plant Breeding, eds T. Lübberstedt and R. K. Varshney (Dordrecht: Springer), 467–515.
Cardoso, H. G., Campos, M. C., Pais, M. S., and Peixe, A. (2010). Use of morphometric parameters for tracking ovule and microspore evolution in grapevine (Vitis vinifera L., cv. “Aragonez”) and evaluation of their potential to improve in vitro somatic embryogenesis efficiency from gametophyte tissues. In Vitro Cell. Dev. Biol. Plant 46, 499–508. doi: 10.1007/s11627-010-9295-6
Cardoso, H. G., Campos, M. D., Costa, A. R., Campos, M. C., Nothnagel, T., and Arnholdt-Schmitt, B. (2009). Carrot alternative oxidase gene AOX2a demonstrates allelic and genotypic polymorphisms in intron 3. Physiol. Plant 137, 592–608. doi: 10.1111/j.1399-3054.2009.01299.x
Cardoso, H. G., Nogales, A., Frederico, A. M., Svensson, J. T., Macedo, E. S., Valadas, V., et al. (2015). “Natural AOX gene diversity,” in Alternative Respiratory Pathways in Higher Plants, eds K. J. Gupta, L. A. J. Mur, and B. Neelwarne (Oxford: John Wiley), 241–254.
Claros, M. G., and Vincens, P. (1996). Computational method to predict mitochondrially imported proteins and their targeting sequences. Eur. J. Biochem. 241, 779–786. doi: 10.1111/j.1432-1033.1996.00779.x
Clifton, R., Lister, R., Parker, K. L., Sappl, P. G., Elhafez, D., Millar, A. H., et al. (2005). Stress-induced co-expression of alternative respiratory chain components in Arabidopsis thaliana. Plant Mol. Biol. 58, 193–212. doi: 10.1007/s11103-005-5514-7
Collins, N. C., Tardieu, F., and Tuberosa, R. (2008). Quantitative trait loci and crop performance under abiotic stress: where do we stand? Plant Physiol. 147, 469–486. doi: 10.1104/pp.108.118117
Considine, M. J., Holtzapffel, R. C., Day, D. A., Whelan, J., and Millar, A. H. (2002). Molecular distinction between alternative oxidase from monocots and dicots. Plant Physiol. 129, 949–953. doi: 10.1104/pp.004150
Costa, J. H., Cardoso, H. G., Campos, M. D., Zavattieri, A., Frederico, A. M., Fernandes de Melo, D., et al. (2009). Daucus carota L. - An old model for cell reprogramming gains new importance through a novel expansion pattern of alternative oxidase (AOX) genes. Plant Physiol. Biochem. 47, 753–759. doi: 10.1016/j.plaphy.2009.03.011
Costa, J. H., McDonald, A. E., Arnholdt-Schmitt, B., and Fernandes de Melo, D. (2014). A classification scheme for alternative oxidases reveals the taxonomic distribution and evolutionary history of the enzyme in angiosperms. Mitochondrion 19, 172–183. doi: 10.1016/j.mito.2014.04.007
Costa, J. H., Mota, E. F., Cambursano, M. V., Lauxmann, M. A., de Oliveira, L. M., Silva Lima Mda, G., et al. (2010). Stress-induced co-expression of two alternative oxidase (VuAox1 and 2b) genes in Vigna unguiculata. J. Plant Physiol. 167, 561–570. doi: 10.1016/j.jplph.2009.11.001
Crichton, P. G., Affourtit, C., Albury, M. S., Carré, J. E., and Moore, A. L. (2005). Constitutive activity of Sauromatum guttatum alternative oxidase in Schizosaccharomyces pombe implicates residues in addition to conserved cysteines in α-keto acid activation. FEBS Lett. 579, 331–336. doi: 10.1016/j.febslet.2004.10.107
Crichton, P. G., Albury, M. S., Affourtit, C., and Moore, A. L. (2010). Mutagenesis of the Sauromatum guttatum alternative oxidase reveals features important for oxygen binding and catalysis. Biochim. Biophys. Acta Bioenerg. 1797, 732–737. doi: 10.1016/j.bbabio.2009.12.010
Darriba, D., Taboada, G. L., Doallo, R., and Posada, D. (2011). “ProtTest-HPC: fast selection of best-fit models of protein evolution,” in Euro-Par 2010 Parallel Processing Workshops: Lecture Notes in Computer Science (Including Subseries Lecture Notes in Artificial Intelligence and Lecture Notes in Bioinformatics), eds M. R. Guarracinopp, F. Vivien, J. L. Träff, M. Cannatoro, M. Danelutto, A. Hast, et al. (New York: Springer), 177–184.
Fehér, A. (2015). Somatic embryogenesis - stress-induced remodeling of plant cell fate. Biochim. Biophys. Acta 1849, 385–402. doi: 10.1016/j.bbagrm.2014.07.005
Finnegan, P. M., Whelan, J., Millar, A. H., Zhang, Q., Smith, M. K., Wiskich, J. T., et al. (1997). Differential expression of the multigene family encoding the soybean mitochondrial alternative oxidase. Plant Physiol. 114, 455–466. doi: 10.1104/pp.114.2.455
Fiorani, F., Umbach, A. L., and Siedow, J. N. (2005). The alternative oxidase of plant mitochondria is involved in the acclimation of shoot growth at low temperature. A study of Arabidopsis AOX1a transgenic plants. Plant Physiol. 139, 1795–1805. doi: 10.1104/pp.105.070789
Frederico, A. M., Campos, M. D., Cardoso, H. G., Imani, J., and Arnholdt-Schmitt, B. (2009a). Alternative oxidase involvement in Daucus carota somatic embryogenesis. Physiol. Plant 137, 498–508. doi: 10.1111/j.1399-3054.2009.01278.x
Frederico, A. M., Zavattieri, M. A., Campos, M. D., Cardoso, H. G., McDonald, A. E., and Arnholdt-Schmitt, B. (2009b). The gymnosperm Pinus pinea contains both AOX gene subfamilies AOX1 and AOX2. Physiol. Plant. 137, 566–577. doi: 10.1111/j.1399-3054.2009.01279.x
Gartenbach-Scharrer, U., Habib, S., and Neumann, K.-H. (1990). Sequential synthesis of some proteins in cultured carrot explant (Daucus carota) cells during callus induction. Plant Cell Tissue Organ. Cult. 22, 27–35.
Grafi, G., and Barak, S. (2015). Stress induces cell dedifferentiation in plants. Biochim. Biophys. Acta 1849, 378–384. doi: 10.1016/j.bbagrm.2014.07.015
Grafi, G., Florentin, A., Ransbotyn, V., and Morgenstern, Y. (2011). The stem cell state in plant development and in response to stress. Front. Plant Sci. 2:53. doi: 10.3389/fpls.2011.00053
Grant, N., Onda, Y., Kakizaki, Y., Ito, K., Watling, J., and Robinson, S. (2009). Two cys or not two cys? Plant Physiol. 150, 987–995. doi: 10.1104/pp.109.139394
Grieb, B., Schafer, F., Imani, J., Mashayekhi, K. N., Arnhold Schmitt, B., and Neumann, K. H. (1997). Changes in soluble proteins and phytohormone concentrations of cultured carrot petiole explants during induction of somatic embryogenesis (Daucus carota L.). J. Appl. Bot. Bot. 71, 94–103.
Hilal, M., Castagnaro, A., Moreno, H., and Massa, E. M. (1997). Specific localization of the respiratory alternative oxidase in meristematic and xylematic tissues from developing soybean roots and hypocotyls. Plant Physiol. 115, 1499–1503. doi: 10.1104/pp.115.4.1499
Holtzapffel, R. C., Castelli, J., Finnegan, P. M., Millar, A. H., Whelan, J., and Day, D. A. (2003). A tomato alternative oxidase protein with altered regulatory properties. Biochim. Biophys. Acta. Bioenerg. 1606, 153–162. doi: 10.1016/S0005-2728(03)00112-9
Jones, D. T., Taylor, W. R., and Thornton, J. M. (1992). The rapid generation of mutation data matrices from protein sequences. Comput. Appl. Biosci. 8, 275–282. doi: 10.1093/bioinformatics/8.3.275
Karlin, S., and Altschul, S. F. (1993). Applications and statistics for multiple high-scoring segments in molecular sequences. Proc. Natl. Acad. Sci. U.S.A. 90, 5873–5877. doi: 10.1073/pnas.90.12.5873
Kim, G. H., Burger, D. W., Lieth, H., Choi, N. H., and Jeong, B. R. (2006). Metabolic heat and CO2 evolution rates measured by calorimetry during different in vitro induction processes of cineraria. Thermochim. Acta 447, 52–56. doi: 10.1016/j.tca.2006.04.015
Kumar, A., Bender, L., Pauler, B., Neumann, K.-H., Senger, H., and Jeske, C. (1983). Ultrastructural and biochemical development of the photosynthetic apparatus during callus induction in carrot root explants. Plant Cell Tissue Organ Cult. 2, 161–177. doi: 10.1007/BF00043361
Linke, B., Nothnagel, T., and Börner, T. (2003). Flower development in carrot CMS plants: mitochondria affect the expression of MADS box genes homologous to GLOBOSA and DEFICIENS. Plant J. 34, 27–37. doi: 10.1046/j.1365-313X.2003.01703.x
Livak, K. J., and Schmittgen, T. D. (2001). Analysis of relative gene expression data using real-time quantitative PCR and the 2(-Delta Delta C(T)) Method. Methods 25, 402–408. doi: 10.1006/meth.2001.1262
Loke, J. C., Stahlberg, E. A., Strenski, D. G., Haas, B. J., Wood, P. C., and Li, Q. Q. (2005). Compilation of mRNA polyadenylation signals in Arabidopsis revealed a new signal element and potential secondary structures. Plant Physiol. 138, 1457–1468. doi: 10.1104/pp.105.060541
Macedo, S. E., Cardoso, H. G., Hernández, A., Peixe, A. A., Polidoros, A., Ferreira, A., et al. (2009). Physiologic responses and gene diversity indicate olive alternative oxidase as a potential source for markers involved in efficient adventitious root induction. Physiol. Plant 137, 532–552. doi: 10.1111/j.1399-3054.2009.01302.x
Macedo, S. E., Sircar, D., Cardoso, H. G., Peixe, A., and Arnholdt-Schmitt, B. (2012). Involvement of alternative oxidase (AOX) in adventitious rooting of Olea europaea L. microshoots is linked to adaptive phenylpropanoid and lignin metabolism. Plant Cell Rep. 31, 1581–1590. doi: 10.1007/s00299-012-1272-6
Moore, A. L., Carré, J. E., Affourtit, C., Albury, M. S., Crichton, P. G., Kita, K., et al. (2008). Compelling EPR evidence that the alternative oxidase is a diiron carboxylate protein. Biochim. Biophys. Acta Bioenerg. 1777, 327–330. doi: 10.1016/j.bbabio.2008.01.004
Moore, A. L., Shiba, T., Young, L., Harada, S., Kita, K., and Ito, K. (2013). Unraveling the heater: new insights into the structure of the alternative oxidase. Annu. Rev. Plant Biol. 64, 637–663. doi: 10.1146/annurev-arplant-042811-105432
Murashige, T., and Skoog, F. (1962). A revised medium for rapid growth and bio assays with tobacco tissue cultures. Physiol. Plant 15, 473–497. doi: 10.1111/j.1399-3054.1962.tb08052.x
Nakamura, K., Sakamoto, K., Kido, Y., Fujimoto, Y., Suzuki, T., Suzuki, M., et al. (2005). Mutational analysis of the Trypanosoma vivax alternative oxidase: the E(X)6Y motif is conserved in both mitochondrial alternative oxidase and plastid terminal oxidase and is indispensable for enzyme activity. Biochem. Biophys. Res. Commun. 334, 593–600. doi: 10.1016/j.bbrc.2005.06.131
Neumann, K. (1966). Wurzelbildung und nukleinsäuregehalt bei phloem-gewebekulturen der karottenwurzel auf synthetischem nährmedium. Congr. Coll. Univ. Liege 38, 96–102.
Nicotra, A. B., Atkin, O. K., Bonser, S. P., Davidson, A. M., Finnegan, E. J., Mathesius, U., et al. (2010). Plant phenotypic plasticity in a changing climate. Trends Plant Sci. 15, 684–692. doi: 10.1016/j.tplants.2010.09.008
Nogales, A., Muñoz-Sanhueza, L., Hansen, L. D., and Arnholdt-Schmitt, B. (2013). Calorespirometry as a tool for studying temperature response in carrot (Daucus carota L.). Eng. Life Sci. 13, 541–548. doi: 10.1002/elsc.201200197
Nogales, A., Noceda, C., Ragonezi, C., Cardoso, H. G., Campos, M. D., Frederico, A. M., et al. (2015). “Functional marker development from AOX genes requires deep phenotyping and individualized diagnosis,” in Alternative Respiratory Pathways in Higher Plants, eds K. J. Gupta, L. A. G. Mur, and B. Neelwarne (Oxford: John Wiley & Sons, Inc), 275–280.
Pérez-Clemente, R. M., and Gómez-Cadenas, A. (2012). . “In vitro tissue culture, a tool for the study and breeding of plants subjected to abiotic stress conditions,” Recent Advances in Plant in Vitro Culture, eds A. Leva and L. M. R. Rinaldi (Rijeka: Intech), 91–108. doi: 10.5772/52760
Petrussa, E., Bertolini, A., Casolo, V., Krajnáková, J., Macrì, F., and Vianello, A. (2009). Mitochondrial bioenergetics linked to the manifestation of programmed cell death during somatic embryogenesis of Abies alba. Planta 231, 93–107. doi: 10.1007/s00425-009-1028-x
Polidoros, A. N., Mylona, P. V., and Arnholdt-Schmitt, B. (2009). Aox gene structure, transcript variation and expression in plants. Physiol. Plant 137, 342–353. doi: 10.1111/j.1399-3054.2009.01284.x
Polidoros, A. N., Mylona, P. V., Pasentsis, K., Scandalios, J. G., and Tsaftaris, A. S. (2005). The maize alternative oxidase 1a (Aox1a) gene is regulated by signals related to oxidative stress. Redox Rep. 10, 71–78. doi: 10.1179/135100005X21688
Rambaldi, D., and Ciccarelli, F. D. (2009). FancyGene: dynamic visualization of gene structures and protein domain architectures on genomic loci. Bioinformatics 25, 2281–2282. doi: 10.1093/bioinformatics/btp381
Rasmusson, A. G., Fernie, A. R., and Van Dongen, J. T. (2009). Alternative oxidase: a defence against metabolic fluctuations? Physiol. Plant 137, 371–382. doi: 10.1111/j.1399-3054.2009.01252.x
Rhoads, D. M., Umbach, A. L., Sweet, C. R., Lennon, A. M., Rauch, G. S., and Siedow, J. N. (1998). Regulation of the cyanide-resistant alternative oxidase of plant mitochondria: identification of the cysteine residue involved in α-keto acid stimulation and intersubunit disulfide bond formation. J. Biol. Chem. 273, 30750–30756. doi: 10.1074/jbc.273.46.30750
Saisho, D., Nambara, E., Naito, S., Tsutsumi, N., Hirai, A., and Nakazono, M. (1997). Characterization of the gene family for alternative oxidase from Arabidopsis thaliana. Plant Mol. Biol. 35, 585–596. doi: 10.1023/a:1005818507743
Schneider, C. A., Rasband, W. S., and Eliceiri, K. W. (2012). NIH Image to ImageJ: 25 years of image analysis. Nat. Methods 9, 671–675. doi: 10.1038/nmeth.2089
Shen, Y., Ji, G., Haas, B. J., Wu, X., Zheng, J., Reese, G. J., et al. (2008). Genome level analysis of rice mRNA 3’-end processing signals and alternative polyadenylation. Nucleic Acids Res. 36, 3150–3161. doi: 10.1093/nar/gkn158
Siedow, J. N., Umbach, A. L., and Moore, A. L. (1995). The active site of the cyanide-resistant oxidase from plant mitochondria contains a binuclear iron center. FEBS Lett. 362, 10–14. doi: 10.1016/0014-5793(95)00196-G
Sieger, S. M., Kristensen, B. K., Robson, C. A., Amirsadeghi, S., Eng, E. W., Abdel-Mesih, A., et al. (2005). The role of alternative oxidase in modulating carbon use efficiency and growth during macronutrient stress in tobacco cells. J. Exp. Bot. 56, 1499–1515. doi: 10.1093/jxb/eri146
Smertenko, A., and Bozhkov, P. V. (2014). Somatic embryogenesis: life and death processes during apical-basal patterning. J. Exp. Bot. 65, 1343–1360. doi: 10.1093/jxb/eru005
Steward, F. C., Caplin, S. M., and Millar, F. K. (1952). Investigations on the growth and metabolism of plant cells. I. New techniques for the investigation on metabolism, nutrition and growth in undifferentiated cells. Ann. Bot. 16, 57–79.
Umbach, A. L., and Siedow, J. N. (1993). Covalent and noncovalent dimers of the cyanide-resistant alternative oxidase protein in higher plant mitochondria and their relationship to enzyme activity. Plant Physiol. 103, 845–854.
Van Aken, O., Giraud, E., Clifton, R., and Whelan, J. (2009). Alternative oxidase: a target and regulator of stress responses. Physiol. Plant 137, 354–361. doi: 10.1111/j.1399-3054.2009.01240.x
Vanlerberghe, G. C. (2013). Alternative oxidase: a mitochondrial respiratory pathway to maintain metabolic and signaling homeostasis during abiotic and biotic stress in plants. Int. J. Mol. Sci. 14, 6805–6847. doi: 10.3390/ijms14046805
Vanlerberghe, G. C., Cvetkovska, M., and Wang, J. (2009). Is the maintenance of homeostatic mitochondrial signaling during stress a physiological role for alternative oxidase? Physiol. Plant 137, 392–406. doi: 10.1111/j.1399-3054.2009.01254.x
Xing, D., and Li, Q. Q. (2011). Alternative polyadenylation and gene expression regulation in plants. Wiley Interdiscip. Rev. RNA 2, 445–458. doi: 10.1002/wrna.59
Keywords: Daucus carota, alternative oxidase, cell reprogramming, growth induction, chilling, DcAOX1 gene characterization
Citation: Campos MD, Nogales A, Cardoso HG, Kumar SR, Nobre T, Sathishkumar R and Arnholdt-Schmitt B (2016) Stress-Induced Accumulation of DcAOX1 and DcAOX2a Transcripts Coincides with Critical Time Point for Structural Biomass Prediction in Carrot Primary Cultures (Daucus carota L.). Front. Genet. 7:1. doi: 10.3389/fgene.2016.00001
Received: 05 November 2015; Accepted: 07 January 2016;
Published: 29 January 2016.
Edited by:
Keqiang Wu, National Taiwan University, TaiwanReviewed by:
Dariusz Grzebelus, University of Agriculture in Krakow, PolandJing Han Hong, National University of Singapore, Singapore
Copyright © 2016 Campos, Nogales, Cardoso, Kumar, Nobre, Sathishkumar and Arnholdt-Schmitt. This is an open-access article distributed under the terms of the Creative Commons Attribution License (CC BY). The use, distribution or reproduction in other forums is permitted, provided the original author(s) or licensor are credited and that the original publication in this journal is cited, in accordance with accepted academic practice. No use, distribution or reproduction is permitted which does not comply with these terms.
*Correspondence: Hélia G. Cardoso, aGNhcmRvc29AdWV2b3JhLnB0; Birgit Arnholdt-Schmitt, ZXVfY2hhaXJAdWV2b3JhLnB0