 Mehdi Maadooliat1,2
 Naveen K. Bansal1Jiblal Upadhya1
 Manzur R. Farazi1Xiang Li3
 Max M. He2,3,4
 Scott J. Hebbring2,4
 Zhan Ye3
 Steven J. Schrodi2,4*
- 1Department of Mathematics, Statistics and Computer Science, Marquette University, Milwaukee, WI, USA
- 2Center for Human Genetics, Marshfield Clinic Research Foundation, Marshfield, WI, USA
- 3Biomedical Informatics Research Center, Marshfield Clinic Research Foundation, Marshfield, WI, USA
- 4Computation and Informatics in Biology and Medicine, University of Wisconsin-Madison, Madison, WI, USA
Several important and fundamental aspects of disease genetics models have yet to be described. One such property is the relationship of disease association statistics at a marker site closely linked to a disease causing site. A complete description of this two-locus system is of particular importance to experimental efforts to fine map association signals for complex diseases. Here, we present a simple relationship between disease association statistics and the decline of linkage disequilibrium from a causal site. Specifically, the ratio of Chi-square disease association statistics at a marker site and causal site is equivalent to the standard measure of pairwise linkage disequilibrium, r2. A complete derivation of this relationship from a general disease model is shown. Quite interestingly, this relationship holds across all modes of inheritance. Extensive Monte Carlo simulations using a disease genetics model applied to chromosomes subjected to a standard model of recombination are employed to better understand the variation around this fine mapping theorem due to sampling effects. We also use this relationship to provide a framework for estimating properties of a non-interrogated causal site using data at closely linked markers. Lastly, we apply this way of examining association data from high-density genotyping in a large, publicly-available data set investigating extreme BMI. We anticipate that understanding the patterns of disease association decay with declining linkage disequilibrium from a causal site will enable more powerful fine mapping methods and provide new avenues for identifying causal sites/genes from fine-mapping studies.
Introduction
Genetic markers closely linked to disease-causing sites will exhibit association with disease through linkage disequilibrium (Lai et al., 1994; Weiss and Clark, 2002; Morton, 2005; Slatkin, 2008). This is the central idea behind population-based association mapping of disease genes using high density SNP arrays (McVean et al., 2005; Balding, 2006). However, the decay of disease association with declining linkage disequilibrium from a disease-predisposing, functional site has not yet been completely described even though this is a fundamental property of disease genetics. Doing so will provide much needed information concerning the properties of disease genetics and greatly aid experimental designs and statistical methods for identifying functional variants in regions that exhibit disease association.
Although many have argued that genome-wide association studies have been largely unsuccessful in that they have not revealed a large proportion of the heritability from most complex diseases (Latham, 2011), it is certainly clear that numerous loci with impressive statistical evidence for correlation with a wide variety of complex diseases have been identified and replicated (Welter et al., 2014). In a number of instances, these results have provided much needed insight into the biochemical pathways and cellular mechanisms responsible for increasing disease risk (Klein et al., 2005; Cargill et al., 2007; Xavier et al., 2008; Visscher et al., 2012). However, the functional variants underlying the majority of these disease-associated regions have yet to be identified and described (McClellan and King, 2010). The dearth of information concerning functional variants obviously presents a sizable impediment to further dissection of complex disease etiologies and subsequent utility in impacting clinical practice. If genetic and statistical methods can aid in generating either supporting or opposing evidence for the role of functional motifs within a region of disease association, then the progression of human genetics studies can be made much more efficient and potent.
When designing fine mapping genotyping experiments, it is important to select genetic variants and subregions such that the design is well-powered to discover functional variants under two important types of disease models: The first class of model that should be covered by such efforts encompasses models of a causal variant driving a portion, or perhaps all of the disease association within a region. Under this model, varying levels of association signal at different sites are explained by different levels of linkage disequilibrium with causal variants. Hence, given allele frequencies and linkage disequilibrium patterns, one can, in principle, back-calculate the properties of putative functional variants that could be driving an initially observed disease association within the region of interest. Known variants, including those that were not initially interrogated, fulfilling these calculated allele frequency and linkage disequilibrium properties with the initial markers should then be included in a fine-mapping panel. The second model that should be covered by a fine-mapping panel of markers is one of allelic heterogeneity at a functional motif (e.g., a gene) that was originally found to exhibit a disease association signal. Empirical data tends to strongly favor this type of model over an individual variant serving as the sole driving allele within a region (Raychaudhuri et al., 2011; Rivas et al., 2011; Nelson et al., 2012; Kim-Howard et al., 2013; Seddon et al., 2013). Indeed, it is quite typical for studies aiming to fine map regions harboring a GWAS-significant SNP to reveal multiple disease-correlated variants within the same gene. This is not terribly surprising as the site frequency spectrum is expected to contain vast numbers of rare variants in outbred populations, which is accentuated in rapidly expanding demographics (Wright, 1931; Coventry et al., 2010; Keinan and Clark, 2012). Even if there is a small likelihood of any one of these rare variants to exhibit pathogenic effects, the sheer number of variants segregating at a gene trends to produce multiple functional alleles in a sizable population. To cover this class of disease models, one would want to reliably identify the functional motifs tagged by an initial association signal and proceed by exhaustively interrogating variants within those functional motifs. Ultimately, in vitro or in vivo functional studies will serve to confirm that specific, very rare variants have pathogenic effects. In practice, this two-model approach guiding fine mapping was successfully employed to identify alleles segregating at the TRAF1-C5 region conferring susceptibility to rheumatoid arthritis (Schrodi et al., 2007a; Chang et al., 2008) and to fine map the IL23R region in psoriasis (Garcia et al., 2008).
Here, building upon previous work (Kruglyak, 1999; Pritchard and Przeworski, 2001; Zaykin et al., 2006; Schrodi et al., 2007b, 2009), we prove a simple, analytic relationship between case/control association statistics at two closely-linked sites and the linkage disequilibrium between the two sites under a generalized disease genetics model. The result holds treating the parameters as being fixed. Interestingly, the result is invariant with mode of inheritance parameters. Further, we posit that concurrently considering the patterns of disease-association and the genetic architecture within a region of interest may strengthen the ability to assess the likelihood that a particular variant is indeed causal with regard to inflating the risk of disease. By doing so, one may be better able to prioritize variants for functional follow-up studies. For finite sample sizes, dispersion around this relationship is expected if the parameters are replaced with random variables and we therefore explore this variation in the result through the use of a Monte Carlo simulation. Lastly, we investigate these patterns in experimental data around the FTO locus in a large GWAS of extreme BMI.
Results
Approximation
Several groups have described the relationship of statistical power at a marker site in linkage disequilibrium with a causal site. In 1999, using the coalescent process to investigate the density of markers necessary for adequate coverage across the genome to detect disease-associated regions, Kruglyak presented the outline of an argument that the sample size necessary to detect association at a marker locus in linkage disequilibrium with a causal site is approximately S/d2, where S is the number of samples required to detect disease association at the causal site with a given level of power and d2 = [q(1 − q)p−1(1 − p)−1]r2, such that r2 is the standard measure of linkage disequilibrium between the causal site and the marker site and q and p are the allele frequencies at the marker and causal sites, respectively (Kruglyak, 1999). Later, Pritchard and Pzreworski performed a derivation showing a similar result, also with regard to power (Pritchard and Przeworski, 2001). Under the Pritchard- Przeworski derivation, the power to detect disease association at a causal site and marker site were found to be approximately the same if the sample size at a marker site is increased by a factor of (r2)−1 over that used in interrogating the causal site. While certainly an intriguing relationship between sample sizes, as it is, the finding may not always have utility in fine mapping applications as most association studies use the same number samples at all sites interrogated. That said, this relationship can be used to motivate related and illuminating properties regarding how fast the disease association signal can be expected to decay as a function of declining linkage disequilibrium from a causal site. Equating the power at the disease-predisposing site to that at the marker site, it follows that,
where ZD and ZM are the normally-distributed Z-scores for testing disease-association at the causal site and marker site, respectively; and α is the significance level. Taking the inverse functions and squaring yields the provocative approximation,
where and are the Chi-Square statistics for disease association at the disease and marker sites, respectively. An interesting parallel was described by Luo, Thompson, and Wooliams in the context of marker-assisted selection of quantitative traits where the authors showed that the proportion of the additive variance of a trait due to a marker in linkage disequilibrium with a causal quantitative trait locus, , is equal to r2 (Luo et al., 1997).
Plotting the Equation (2) approximation with the χ2 disease-association statistic on the ordinate and 1 − r2 on the abscissa is a simple method of displaying the expected linear decay in the χ2 -values as the linkage disequilibrium with a causal site declines at different marker sites. Figure 1 shows this relationship. This decay pattern was first used empirically in 2007–2008 to fine map the TRAF1 region in rheumatoid arthritis (Schrodi et al., 2007a) and the IL23R region in psoriasis (Garcia et al., 2008) and has, in an analogous form, subsequently been used in other applications (Farh et al., 2015). Although this approximation is very useful in understanding the decay of disease association with declining linkage disequilibrium from a causal site, several simplifying assumptions were made in the original Pritchard-Przeworski derivation. While the impact of these assumptions have been explored to some extent in previous work (Hu et al., 2004), it is not known how violations of the original assumptions might produce departures from Equation (2) nor what the effect of sampling haplotypes does to the relationship. Hence, an exact relationship between disease association statistics and r2 -values with a causal site would aid in clarifying this relationship and motivate statistical approaches to harnessing this pattern for the purpose of fine-mapping functional alleles. Further, Monte Carlo simulations can be used to explore the how treating haplotype counts as random variables generates stochastic variation around this central relationship.
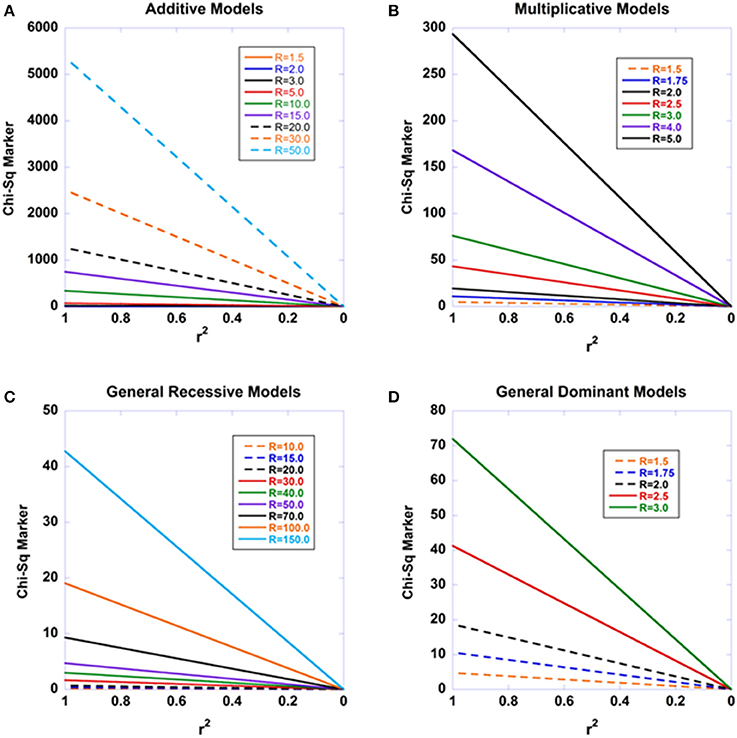
Figure 1. The expected decay of disease association with declining linkage disequilibrium for four modes of inheritance. The standard recursive haplotype frequencies under recombination were used to generate a series of haplotype combinations. The disease-predisposing allele at the causal site was set at a general population frequency of 0.01. The penetrance f22 was set to 0.001 and the remaining two penetrances varied according to the modes of inheritance examined and the relative risks (R) cited in the Figures. Sample sizes were set at nD = 2000 and nC = 2000. (A) displays the results for an additive model, such that f12 is the arithmetic mean of f22 and f11. (B) shows the results under a multiplicative model. (C) shows the results under a general recessive model. (D) shows the results under a general dominant model.
Full Derivation
In this section, we will show the algebraic relationship between the Chi-Square-test statistics at a causal site and marker site, without any assumptions regarding the probabilistic properties (or whether they are fixed parameters) of the allele frequencies or haplotype frequencies of which the statistics are composed. Note that in the Monte Carlo Simulations Section we will treat the haplotype counts as random variables; and hence the Chi-Squared statistics and r2 will each carry stochastic properties and we investigate these properties in that section.
Defining the Chi-Square-test statistics for a disease-causing site () and a marker closely linked to the disease site () following the Pritchard-Przeworski derivation,
where a two-site model is considered (site A segregating alleles A1 and A2, and site B segregating alleles B1 and B2), p, pD, and pC are the frequencies of the A1 allele in the combined population, disease-affected population, and the control population, respectively, and where q, qD, and qC are the frequencies of the B1 allele in the combined population, disease-affected population, and the control population, respectively. nD and nC are the sample sizes for diploid cases and controls, respectively, and n = nD + nC. For this work, haplotype and allele probabilities conditional on disease status (i.e., within cases or within controls) are derived. For the haplotype and allele probabilities in the general population, we weighted the disease status conditional probabilities by the probability of disease or healthy control attributable to the causal site, in accordance with the law of total probability. Note, that the form of these Chi-Square statistics in Equations (3) and (4) is twice the value of traditionally-defined Chi-Square statistic. However, this scalar inflation factor cancels out in the subsequent derivation.
Noting that
where K is the P(Case) attributable to the causal site, we can substitute and into Equation (5), resulting in
This treatment of the allele frequencies using the law of total probability holds for all populations in which each individual is either a case or control (e.g., cohort studies or case/control study designs). The next aim in the derivation is to substitute quantities for the allele frequencies in the affected population at both sites in terms of penetrances, disease prevalence, and general population allele frequencies. The allele frequencies at both the causal and marker sites have been previously described for two-locus systems under general disease models (Schrodi et al., 2007b):
where f11, f12, and f22 are the prevalences of the A1A1, A1A2, and A2A2 genotypes, respectively, such that fij = P(Case|AiAj); which, under this monogenic model and assuming Hardy-Weinberg Equilibrium in the general population and using the law of total probability we can express the disease prevalence as, ; and haplotype frequencies P11 = P(A1B1), and P21 = P(A2B1). Applied to complex diseases, it may be useful to think of this disease model as the subset of individuals with a common disease that is primarily driven by a particular locus. With the substitution into Equation (6),
In Equation (9), the R.H.S. numerator can be simplified to
Noting that P21 = q − P11 and substituting , the numerator becomes
whereas, the denominator in Equation (9) can be simplified to
Hence, Equation (9) can be written as
where D = P11P22 − P12P21 = P11 − pq.
Again substituting ,
Therefore, we have shown the exact relationship under our model,
Not only is this relationship an exact result under the model employed, but it is universal in that there is no dependence on the penetrances. Thus, we may expect that from a true disease-susceptibility site, that there should be a linear decay in the Chi-square statistics for disease association with declining r2 -values with the causal site. Figure 1 shows the expected disease association decay with declining linkage disequilibrium from the causal site for additive, multiplicative, recessive, and dominant sets of models. The patterns arising from various relative risks are presented. Similarly, Figure 2 presents the patterns expected as a function of sample sizes. Aside from Equation (13) illuminating a central aspect of disease genetics, we suspect that it carries utility in fine mapping applications—we hypothesize that identifying this type of pattern in fine mapping data will better enable the pinpointing of truly causal sites through harnessing correlated data.
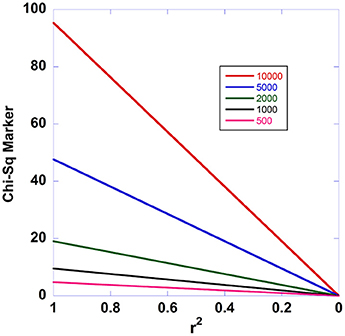
Figure 2. Effect of sample size on the expected decay of disease association with declining linkage disequilibrium. This figure shows how the fine mapping theorem behaves under different sample sizes. The case/control sample sizes in the two-site model are varied from 500 to 10,000.
Corollary
Consider the situation where there is a disease-susceptibility site and other sites in differing levels of linkage disequilibrium with the disease-susceptibility site. From large-scale genotyping or sequencing studies, we often know the matrix of pairwise r2 -values, and allele frequencies at each site in the general population, broadly defined. An interesting question arises: If one has genotyped a marker site in a case/control sample set and calculated testing for disease association, can we infer the expected effect size at a non-interrogated causal site? Using Equation (13), and substituting allele frequencies at the causal site,
where , the effective total number of independent diploid samples. Defining a traditional allelic odds ratio, R, calculated at the causal site as
the allele frequency in the cases can be solved: .
Therefore,
To simplify the derivation, we will assume that the disease studied is not very common such that the allele frequency in controls is well-approximated by the allele frequency in the general population, pC ≅ p. This is also true if samples drawn from the general population are serving as the controls. Hence,
Solving for R,
To illustrate the use and implications of Equation (17), suppose that we have genotyped a site in 500 diploid cases and 500 diploid controls and calculated the test statistic χ2 = 20, corresponding to p = 1.57E-03 (recall that half the Pritchard-Przeworski statistic is Chi-Square distributed with one degree of freedom). Further assume that this region has previously been subjected to next-generation sequencing in individuals derived from the same source population as the cases and controls which has yielded the discovery of numerous additional variants closely linked to the genotyped site, allele frequencies at those variants, and an array of pairwise linkage disequilibrium values across the region of interest. Under that scenario, one would typically have access to good estimates of the general population allele frequencies and r2 -values at sites neighboring the genotyped site that produced the original finding. Suppose that one of these adjacent sites has a general population allele frequency p = 0.03 and a linkage disequilibrium value with the genotyped site of r2 = 0.2. Under the two-site model, we would therefore estimate the odds ratio at the putative, non-genotyped, causal site to be 5.17. Put another way, the putative causal site, having the general population allele frequency and linkage disequilibrium values above, would have to have an odds ratio of 5.17 in order to generate twice a standard Chi-Square statistic value at the genotyped site of 20 given 500 cases and 500 controls. Indirect inference of the properties of non-interrogated causal sites can be helpful in subsequent experimental efforts to identify disease-predisposing sites in a fine-mapped region. Figure 3 displays the relationship between the inferred odds ratio at the causal site from disease association data at the marker site as a function of linkage disequilibrium between the two sites. Graphs for various p-values at marker site are shown. Additional work under a stochastic model would enable the calculation of the posterior probabilities of properties of non-interrogated causal sites given genetic data at linked markers.
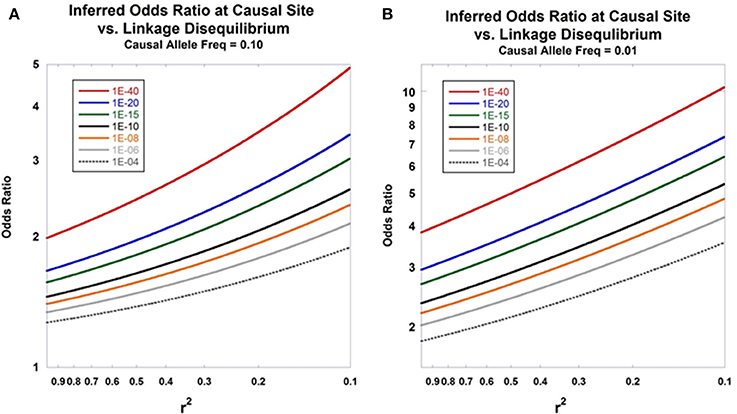
Figure 3. Inferred odds ratio. The relationship between the inferred odds ratio at a causal site and the level of linkage disequilibrium with an interrogated marker is presented in (A,B). Equation (17) is used for the calculations. The seven curves show the patterns of expected odds ratios for disease association at the causal site under different observed p-values calculated at the marker site. Sample size was set at ne = 5000. (A) shows results assuming that the disease-predisposing allele at the causal site has frequency of 0.10 in the general population, whereas (B) sets that frequency at 0.01.
The results detailed in Equations (1–17) do not treat any of the parameters, such as haplotype frequencies, as random variables. Clearly, haplotype counts in cases and controls should be treated with sampling processes from a larger population. To address this issue, we have constructed a Monte Carlo simulation program to generate haplotypes under a probabilistic model. Under this program we are able to explore the variation around Equation (13) generated by sampling haplotypes and to observe effects that may be produced by different sets of parameters.
Monte Carlo Simulations
In an effort to understand the variation in the patterns of disease association decay as a function of linkage disequilibrium with a causative site, we constructed a Monte Carlo simulation using a generalized disease model (penetrances for each of the three genotypes at the causal site are parameterized) and treating the haplotype counts in cases and controls as random variables. Recombination was introduced between a causal site and a closely linked marker as a realistic method of generating different sets of 2-site haplotypes for the general population (Hartl and Clark, 1989). For a rate of recombination, c, and generation time t, we used the following set of recursions (Haldane model of recombination):
Hence, for the general population, we can express r2 as a function of generation time using the recursions in Equations (18–21):
Assuming Hardy-Weinberg equilibrium in the general population at both sites, the proportion of individuals affected by the disease attributable to this locus, is calculated through the previously-described formula for disease prevalence. To calculate the expected haplotype frequencies in cases, we used Bayes theorem. Hence, the expected frequency of the A1B1 haplotype in cases is
In an analogous manner, the remaining haplotype frequencies in cases, where the subscript indicates the haplotype, are
The haplotype frequencies in controls are simply
Sampling of the case and control haplotypes from the expected frequencies is accomplished through two independent multinomial variates such that the joint densities are given by
Hence, the sample frequency of the causal allele in cases and controls, respectively, are
and
We employed an additive model for the penetrances at the causal site and a design using 10,000 cases and 40,000 controls. As the time parameter is increased, the number of recombination events between the casual site and the marker site increases and there is a corresponding reduction in the linkage disequilibrium between the two sites. Figure 4 shows the distribution of the association statistic at the marker site (Equation 4) plotted against the product of the association statistic at the causal site (Equation 3) and the -value between the two sites. Four different time points were evaluated in the simulation, each with 10,000 replicates generated. The patterns show the general linear trend of how the association statistics scale with linkage disequilibrium and the variation around this pattern. For fixed properties at a causal site, Figure 5 displays the mean value and 95% confidence interval of the association statistic at the marker site as the -value declines.
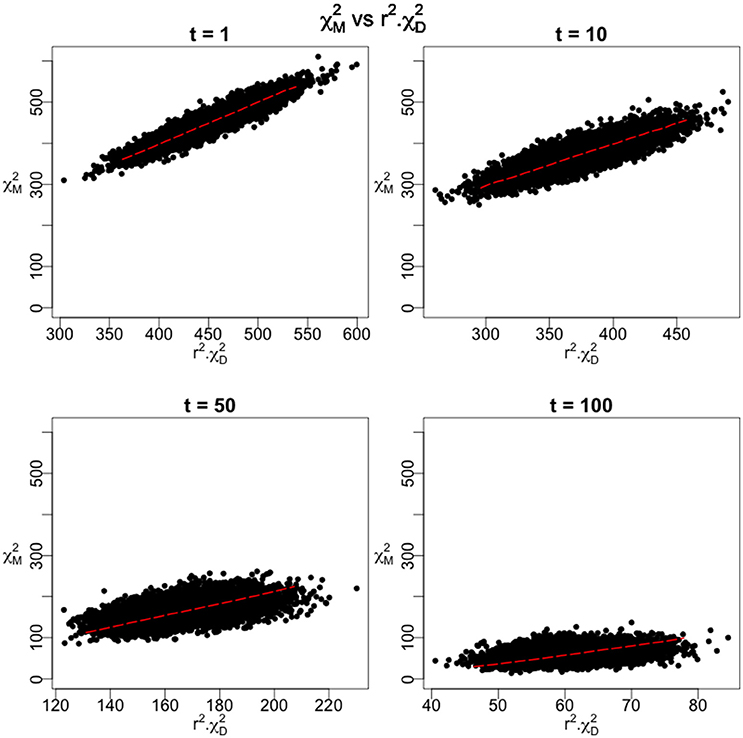
Figure 4. Monte Carlo results under the 2-site model with recombination. The Chi-Square statistic as measured at the marker site is plotted against the product of r2 and the Chi-Square Statistic at the disease site for 10,000 replications of the simulation. 10,000 disease cases and 40,000 controls were assumed in the calculations. The initial frequencies of the four haplotypes were 0.70 for the parental, non-causal haplotype, 0.28 for the parental haplotype carrying the causal variant, and 0.01 for each of the recombinant haplotypes. As time (t) increases, these frequencies varied according to the recursions specified in Equations (18–21). An additive model was assumed as the mode of inheritance model with penetrances of 0.01, 0.03, and 0.05 for the three genotypes at the causal site.
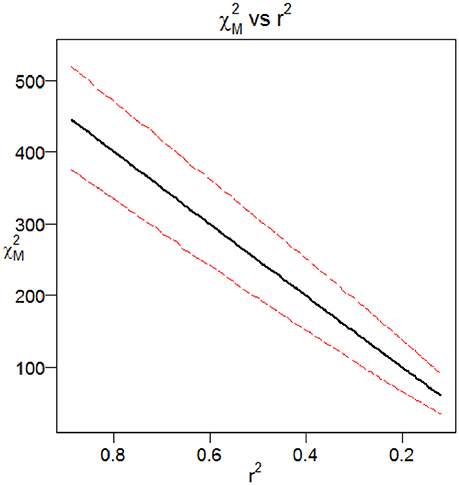
Figure 5. Mean and 95% Confidence Interval for the Chi-Square Statistic at the Marker Site as a Function of Linkage Disequilibrium. Results from the Monte Carlo simulation showing the mean and 95% confidence interval for the Chi-Square statistic at the marker site, plotted as a function of r2 with the causal site. The two-site model with recombination and additive mode of inheritance described previously were used.
Application to Experimental Data
All indicated earlier, there are several uses of the theorem presented here. The pattern of linear decay of association (as measured by the test statistic) with declining linkage disequilibrium can be used to support various markers as causal sites. Conversely, significant departure from the expected pattern can indicate multiple causal sites segregating at the disease locus. And additionally, understanding this fine mapping theorem can be used to infer properties of non-interrogated causal sites. To illustrate the application of the relationship described in Equation (13) to experimental data, we used GWAS data around the well-established obesity locus, FTO, generated by a recent large study of extreme BMI (Berndt et al., 2013). The FTO gene encodes for an alpha-ketoglutarate-dependent dioxygenase (Gerken et al., 2007), playing a role in growth and development (Boissel et al., 2009; Daoud et al., 2016), and has been reliably associated with the related conditions of type 2 diabetes, BMI, adiposity and other obesity-related traits (Scott et al., 2007; Zeggini et al., 2007; Lindgren et al., 2009; Thorleifsson et al., 2009; Fox et al., 2012; DIAGRAM Consortium et al., 2014; Wood et al., 2016). Within the FTO gene region, the study found that rs11075990 exhibited the strongest association with extreme BMI with a reported p-value of 9.3E-33. From this study, we identified 752 SNPs residing within a ~1 Mb region surrounding FTO, having linkage disequilibrium data from the 1000 Genomes project (The 1000 Genomes Project Consortium et al., 2015). Figure 6 displays the positional association of these data, showing a substantial peak localized on chr16q over the FTO gene. Plotting these association results as a function of pairwise linkage disequilibrium (as measured by r2) with rs11075990, there is a general decay of the Chi-Square association statistics with declining r2 -values (Figure 7). Pearson's correlation is 0.979 and the p-value for this relationship (testing Spearman's rho under the null model of no correlation) is 2.87E-29. For this example, there are some immediate findings by visual inspection. The general pattern following the theorem is present. In addition, there appear to be some SNPs with extreme BMI associations that substantially exceed the level of association expected to be driven through linkage disequilibrium with rs11075990. That is, the theoretical model of one causal site (rs11075990) driving the extreme BMI association patterns in the FTO gene region may not explain the association statistics at some SNPs, such as rs2058908, where the theory only predicts a Chi-Square-value of 12.36 (r2 with rs11075990 is 0.087) and yet the observed Chi-Square statistic is 73.98. Hence, the genetic information at rs2058908 may be driven by a causal signal independent of rs11075990 (rs2058908 is denoted with a green circle in Figure 7). A test of conditional association could be used to verify these types of hypotheses. Since the residuals obtains from the fitted line (the line that passes through the origin and the Chi-Square value associated to the causal site) and the observed Chi-Square-values are not normally-distributed, we used a resampling approach to obtain a 95% confidence band (dashed lines in Figure 7). In this approach, we treat the fitted Chi-Square-values to be the expected response for the bootstrap samples, and by resampling the original residuals, we obtain bootstrap replicates for the fixed covariate (r2) (Fox and Weisberg, 2012). Here, we resampled the original residuals 100,000 times in the R programming language (R Core Team, 2014) and used the 0.025 and 0.975 quantiles of the resampled fits to achieve the 95% confidence band in Figure 7.
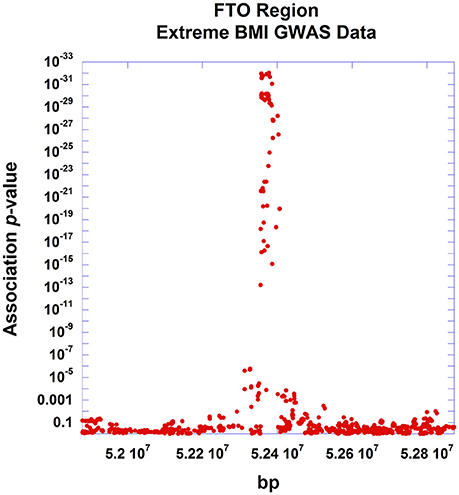
Figure 6. Positional association plot of SNPs around the FTO gene region. Association data from the Berndt et al. study of extreme BMI were used for this positional plot. SNPs (n = 752) within 500 kb of the FTO gene, having linkage disequilibrium information from the 1000 genomes study were used in the plot showing strong localization of the association signal around the FTO gene.
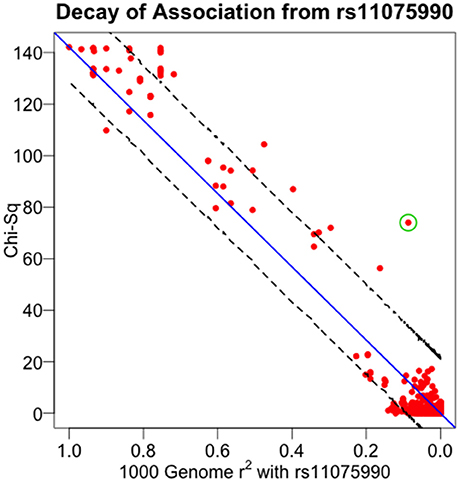
Figure 7. Decay of association from rs11075990. Association from the Berndt et al. study of extreme BMI was plotted against the pairwise linkage disequilibrium (r2) values of each SNP and rs11075990—the most significant finding in the region. rs2058908 is denoted with the green circle. Ninety-five percent of confidence intervals are determined through the resampling scheme presented in the text.
Discussion
One of the most fundamental patterns in disease genetics is the nature of the decay of disease association with declining linkage disequilibrium from a causal site. Motivated by the Kruglyak and Pritchard-Przeworski derivations for the approximate increase in sample size to attain the equivalent statistical power at a marker site in linkage disequilibrium with a causal site, we first showed how this result could be used to produce an approximation showing a linear relationship in the Chi-Square association statistics testing disease association at a marker and a causal site and that the ratio of the two was approximately r2 (Equation 2). Next, using a general two-site model with penetrances, we showed that this is indeed an exact result and invariant to the mode of inheritance model (Equation 13). In this derivation, we treated the variables as fixed parameters. To treat the situation where the haplotype frequencies have sampling properties (i.e., are treated as random variables), we wrote a Monte Carlo simulation of this system for finite sample sizes and used a standard model of recombination between the causal and marker sites. The results characterized the stochastic variability around the initial result. Lastly, we applied this work to experimental data from a large GWAS on extreme BMI and showed reasonably good correspondence with this fine mapping theory.
Aside from being a theorem in disease genetics for dichotomous traits, we hope that this fine mapping theorem can serve as an aid in identifying casual variants segregating in a region associated with disease. Recently, substantial effort has driven the field of fine-mapping forward. To address the statistical aspects of prioritizing potentially causal variants within a fine-mapped region, several methods have been developed including a useful Bayesian method created by Maller et al. (The Wellcome Trust Case Control Consortium et al., 2012), which uses Bayes Factor for each variant in the region and calculates the proportion of the total sum of Bayes Factors in the region that is attributable to that variant, producing a relative ranking of the strength of evidence for each variant within the disease-associated region being causal. These calculations allow for the determination of a credible set of highest ranked variants that explains the large majority of the statistical evidence of disease association within the region of interest. The Maller et al. method has been applied to fine mapping data for complex diseases, such as type 1 diabetes (Onengut-Gumuscu et al., 2015). Other important developments in fine mapping approaches include: Bim-Bam (Servin and Stephens, 2007), another Bayesian approach which determines subsets of variants that likely contain causal sites, CAVIAR (Hormozdiari et al., 2014) and CAVIARBF (Chen et al., 2015), coalescent-based methods (Graham, 1998; Morris et al., 2002; Zöllner and Pritchard, 2005), and PAINTOR (Kichaev et al., 2014), which incorporates functional annotation data in a probabilistic manner. Several different extensions of the work presented here could substantially aid fine mapping efforts for complex diseases: (1) Statistical approaches that harness the pattern of association decay with declining linkage disequilibrium will leverage the genetic data at a fine-mapped region to better support or reject the hypothesis that a particular site is indeed causal. Screening each site for a goodness-of-fit with the expected decay pattern from a causal site would better enable the detection of causal sites; (2) Future work focusing on imputing additional properties of a non-interrogated causal variant within a disease-associated region using the linkage disequilibrium patterns and disease association statistics would provide valuable insights into design and interpretation of fine mapping studies. For example, if one imputed a low-frequency, high effect size variant, then experimental designs and genetic techniques, such as sequencing, that have high power to detect such variants can be utilized; and (3) It is becoming increasingly clear that the large majority of regions associated with complex disease susceptibility have multiple predisposing alleles segregating in the populations examined. Methods that extend the simple two-site model explored here to include multiple causal sites will be invaluable for the identification of these functional variants.
Author Contributions
MM made substantial contributions to the analysis and interpretation of data, constructed the Monte Carlo simulations, devised the method for obtaining confidence intervals and generated figures and drafting/revising the manuscript. NB made substantial contributions to the interpretation of data, proofing the derivations, and editing the manuscript. JU, MF, XL, and ZY reviewed the manuscript, proofed the derivations, and aided in analyses. MH and SH reviewed and edited the manuscript. SS originated the concept of the manuscript, designed the study, derived the equations, aided in the design of the simulations, interpreted the data, generated figures and drafted/revised the manuscript.
Conflict of Interest Statement
The authors declare that the research was conducted in the absence of any commercial or financial relationships that could be construed as a potential conflict of interest.
Acknowledgments
We are greatly appreciative of the support from Terrie Kitchner, Cathy Marx, Marlene Stueland, Murray Brilliant, and Fritz Wenzel. Notably, this work has benefited greatly from conversations with Nori Matsunami and Tony Long. This study was funded through the generous donations to the Marshfield Clinic Research Foundation, a pilot grant award from the NIH-NCATS/University of Wisconsin-Madison Institute for Clinical and Translational Research (UL1TR000427) and NIMH RO1 MH097464. Further, support was provided by K22LM011938 and RO1GM114128. The content is solely the responsibility of the authors and does not necessarily represent the official views of the National Institutes of Health.
References
Balding, D. J. (2006). A tutorial on statistical methods for population association studies. Nat. Rev. Genet. 7, 781–791. doi: 10.1038/nrg1916
Berndt, S. I., Gustaffsson, S., Magi, R., Ganna, A., Wheeler, E., Feitosa, M. F., et al. (2013). Genome-wide meta-analysis identifies 11 new loci for anthropometric traits and provides insights into genetic architecture. Nat. Genet. 45, 501–512. doi: 10.1038/ng.2606
Boissel, S., Reish, O., Proulx, K., Kawagoe-Takaki, H., Sedgwick, B., Yeo, G. S., et al. (2009). Loss-of-function mutation in the dioxygenase-encoding FTO gene causes severe growth retardation and multiple malformations. Am. J. Hum. Genet. 85, 106–111. doi: 10.1016/j.ajhg.2009.06.002
Cargill, M., Schrodi, S. J., Chang, M., Garcia, V. E., Brandon, R., Callis, K. P., et al. (2007). A large-scale genetic association study confirms IL12B and leads to the identification of IL23R as psoriasis-risk genes. Am. J. Hum. Genet. 80, 273–390. doi: 10.1086/511051
Chang, M., Rowland, C. M., Garcia, V. E., Schrodi, S. J., Catanese, J. J., van der Helm-van Mil, A. H., et al. (2008). A large-scale rheumatoid arthritis genetic study identifies association at chromosome 9q33.2. PLoS Genet. 4:e1000107. doi: 10.1371/journal.pgen.1000107
Chen, W., Larrabee, B. R., Ovsyannikova, I. G., Kennedy, R. B., Haralambieva, I. H., Poland, G. A., et al. (2015). Fine mapping causal variants with an approximate Bayesian method using marginal test statistics. Genetics 200, 719–736. doi: 10.1534/genetics.115.176107
Coventry, A., Bull-Otterson, L. M., Liu, X., Clark, A. G., Maxwell, T. J., Crosby, J., et al. (2010). Deep resequencing reveals excess rare recent variants consistent with explosive population growth. Nat. Commun. 1:131. doi: 10.1038/ncomms1130
Daoud, H., Zhang, D., McMurray, F., Yu, A., Luco, S. M., Vanstone, J., et al. (2016). Identification of a pathogenic FTO mutation by next-generation sequencing in a newborn with growth retardation and developmental delay. J. Med. Genet. 53, 200–207. doi: 10.1136/jmedgenet-2015-103399
DIAGRAM Consortium, AGEN-T2D Consortium, SAT2D consortium, MAT2D Consortium, T2D-GENES Consortium, Mahajan, A., et al. (2014). Genome-wide trans-ancestry metw-analysis provides insight into the genetic architecture of type 2 diabetes susceptibility. Nat. Genet. 46, 234–244. doi: 10.1038/ng.2897
Farh, K. K., Marson, A., Zhu, J., Kleinewietfeld, M., Housley, W. J., Beik, S., et al. (2015). Genetic and epigenetic fine mapping of causal autoimmune disease variants. Nature 518, 337–343. doi: 10.1038/nature13835
Fox, C. S., Liu, Y., White, C. C., Feitosa, M., Smith, A. V., Heard-Costa, N., et al. (2012). Genome-wide association for abdominal subcutaneous and visceral adipose reveals a novel locus for visceral fat in women. PLoS Genet. 8:e1002695. doi: 10.1371/journal.pgen.1002695
Fox, J., and Weisberg, S. (2012). “Bootstrapping regression models,” in R. An Appendix to An R Companion to Applied Regression, 2nd Edn. Available online at: https://socserv.socsci.mcmaster.ca/jfox/Books/Companion/appendix/Appendix-Bootstrapping.pdf
Garcia, V. E., Chang, M., Brandon, R., Li, Y., Matsunami, N., Callis-Duffin, K. P., et al. (2008). Detailed genetic characterization of the interleukin-23 receptor in psoriasis. Genes Immun. 9, 546–555. doi: 10.1038/gene.2008.55
Gerken, T., Girard, C. A., Tung, Y.-C., Webby, C. J., Saudek, V., Hewitson, K. S., et al. (2007). The obesity-associated FTO gene encodes a 2-oxoglutarate-dependent nucleic acid demethylase. Science 318, 1469–1472. doi: 10.1126/science.1151710
Graham, J. (1998). Disequilibrium Fine-Mapping of a Rare Allele via Coalescent Models of Gene Ancestry. UMI Dissertation Services.
Hartl, D. L., and Clark, A. G. (1989). Principles of Population Genetics, 2nd Edn. Sunderland, MA: Sinauer Associates, Inc.
Hormozdiari, F., Kostem, E., Kang, E. Y., Pasaniuc, B., and Eskin, E. (2014). Identifying causal variants at loci with multiple signals of association. Genetics 198, 497–508. doi: 10.1534/genetics.114.167908
Hu, X., Schrodi, S. J., Ross, D. A., and Cargill, M. (2004). Selecting tagging SNPs for association studies using power calculations from genotype data. Hum. Hered. 57, 156–170. doi: 10.1159/000079246
Keinan, A., and Clark, A. G. (2012). Recent explosive human population growth resulted in an excess of rare genetic variants. Science 336, 740–743. doi: 10.1126/science.1217283
Kichaev, G., Yang, W.-Y., Lindstrom, S., Hormozdiari, F., Eskin, E., Price, A. L., et al. (2014). Integrating functional data to prioritize causal variants in statistical fine-mapping studies. PLoS Genet. 10:e1004722. doi: 10.1371/journal.pgen.1004722
Kim-Howard, X., Sun, C., Molineros, J. E., Maiti, A. K., Chandru, H., Adler, A., et al. (2013). Allelic heterogeneity in NCF2 associated with systemic lupus erythematosus (SLE) susceptibility across four ethnic populations. Hum. Mol. Genet. 23, 1656–1668. doi: 10.1093/hmg/ddt532
Klein, R. J., Zeiss, C., Chew, E. Y., Tsai, J. Y., Sackler, R. S., Haynes, C., et al. (2005). Complement factor H polymorphism in age-related macular degeneration. Science 308, 385–389. doi: 10.1016/j.ajo.2005.06.004
Kruglyak, L. (1999). Prospects for whole-genome linkage disequilibrium mapping of common disease genes. Nat. Genet. 22, 139–144. doi: 10.1038/9642
Lai, C., Lyman, R. F., Long, A. D., Langley, C. H., and Mackay, T. F. (1994). Naturally occurring variation in bristle number and DNA polymorphisms at the scabrous locus of Drosophila melanogaster. Science 266, 1697–1702. doi: 10.1126/science.7992053
Lindgren, C. M., Heid, I. M., Randall, J. C., Lamina, C., Steinthorsdottir, V., Qi, L., et al. (2009). Genome-wide association scan meta-analysis identifies three loci influencing adiposity and fat distribution. PLoS Genet. 5:e1000508. doi: 10.1371/journal.pgen.1000508
Luo, Z. W., Thompson, R., and Woolliams, J. A. (1997). A population genetics model of marker-assisted selection. Genetics 146, 1173–1183.
McClellan, J., and King, M. C. (2010). Genetic heterogeneity in human disease. Cell 141, 210–217. doi: 10.1016/j.cell.2010.03.032
McVean, G., Spencer, C. C., and Chaix, R. (2005). Perspectives on human genetic variation from the HapMap Project. PLoS Genet. 1:e54. doi: 10.1371/journal.pgen.0010054
Morris, A. P., Whittaker, J. C., and Balding, D. J. (2002). Fine-scale mapping of disease loci via shattered coalescent modeling of genealogies. Am. J. Hum. Genet. 70, 686–707. doi: 10.1086/339271
Morton, N. E. (2005). Linkage disequilibrium maps and association mapping. J. Clin. Invest. 115, 1425–1430. doi: 10.1172/JCI25032
Nelson, M. R., Wegmann, D., Ehm, M. G., Kessner, D., St Jean, P., Verzilli, C., et al. (2012). An abundance of rare functional variants in 202 drug target genes sequenced in 14,002 people. Science 337, 100–104. doi: 10.1126/science.1217876
Onengut-Gumuscu, S., Chen, W.-M., Burren, O., Cooper, N. J., Quinlan, A. R., Mychaleckyj, J. C., et al. (2015). Fine mapping of type 1 diabetes susceptibility loci and evidence for colocalization of causal variants with lymphoid gene enhancers. Nat. Genet. 47, 381–386. doi: 10.1038/ng.3245
Pritchard, J. K., and Przeworski, M. (2001). Linkage disequilibrium in humans: models and data. Am. J. Hum. Genet. 69, 1–14. doi: 10.1086/321275
R Core Team (2014). R: A Language and Environment for Statistical Computing. Vienna: R Foundation for Statistical Computing. Available online at: http://www.R-project.org/
Raychaudhuri, S., Iartchouk, O., Chin, K., Tan, P. L., Tai, A. K., Ripke, S., et al. (2011). A rare penetrant mutation in CFH confers high risk of age-related macular generation. Nat. Genet. 43, 1232–1236. doi: 10.1038/ng.976
Rivas, M. A., Beaudoin, M., Gardet, A., Stevens, C., Sharma, Y., Zhang, C. K., et al. (2011). Deep resequencing of GWAS loci identifies independent rare variants associated with inflammatory bowel disease. Nat. Genet. 43, 1066–1073. doi: 10.1038/ng.952
Schrodi, S. J., Chang, M., Ardlie, K., Amos, C. I., et al. (2007a). “A large-scale rheumatoid arthritis genetic study identifies TRAF1 variants on chr 9q33.2 (Abstract/f21225),” Presented at the 57th Annual Meeting of The American Society of Human Genetics (San Diego, CA).
Schrodi, S. J., Garcia, V. E., Rowland, C., and Jones, H. B. (2007b). Pairwise linkage disequilibrium under disease models. Eur. J. Hum. Genet. 15, 212–220. doi: 10.1038/sj.ejhg.5201731
Schrodi, S. J., Garcia, V. E., and Rowland, C. M. (2009). “A fine mapping theorem to refine results from association genetic studies (Abstract/f20455),” in Presented at the 59th Annual Meeting of The American Society of Human Genetics (Honolulu, HI).
Scott, L. J., Mohlke, K. L., Bonnycastle, L. L., Willer, C. J., Li, Y., Duren, W. L., et al. (2007). A genome-wide association study of type 2 diabetes in Finns detects multiple susceptibility variants. Science 316, 1341–1345. doi: 10.1126/science.1142382
Seddon, J. M., Yu, Y., Miller, E. C., Reynolds, R., Tan, P. L., Gowrisankar, S., et al. (2013). Rare variants in CFI, C3 and C9 are associated with high risk of advanced age-related macular degeneration. Nat. Genet. 45, 1366–1370. doi: 10.1038/ng.2741
Servin, B., and Stephens, M. (2007). Imputation-based analysis of association studies: candidate regions and quantitative traits. PLoS Genet. 3:e114. doi: 10.1371/journal.pgen.0030114
Slatkin, M. (2008). Linkage disequilibrium – understanding the evolutionary past and mapping the medical future. Nat. Rev. Genet. 9, 477–485. doi: 10.1038/nrg2361
The 1000 Genomes Project Consortium, Auton, A., Brooks, L. D., Durbin, R. M., Garrison, E. P., Kang, H. M., et al. (2015). A global reference for human genetic variation. Nature 526, 68–74. doi: 10.1038/nature15393
The Wellcome Trust Case Control Consortium, Maller, J. B., McVean, G., Byrnes, J., Vukcevic, D., Palin, K., et al. (2012). Bayesian refinement of association signals for 14 loci in 3 common diseases. Nat. Genet. 44, 1294–1301. doi: 10.1038/ng.2435
Thorleifsson, G., Walters, G. B., Gudbjartsson, D. F., Steinthorsdottir, V., Sulem, P., Helgadottir, A., et al. (2009). Genome-wide association yields new sequence variants at seven loci that associate with measures of obesity. Nat. Genet. 41, 18–24. doi: 10.1038/ng.274
Visscher, P. M., Brown, M. A., McCarthy, M. I., and Yang, J. (2012). Five years of GWAS discovery. Am. J. Hum. Genet. 90, 7–24. doi: 10.1016/j.ajhg.2011.11.029
Weiss, K. M., and Clark, A. G. (2002). Linkage disequilibrium and the mapping of complex human traits. Trends Genet. 18, 19–24. doi: 10.1016/S0168-9525(01)02550-1
Welter, D., MacArthur, J., Morales, J., Burdett, T., Hall, P., Junkins, H., et al. (2014). The NHGRI GWAS Catalog, a curated resource of SNP-trait associations. Nucleic Acids Res. 42, D1001–D1006. doi: 10.1093/nar/gkt1229
Wood, A. R., Tyrell, J., Beaumont, R., Jones, S. E., Tuke, M. A., Ruth, K. S., et al. (2016). Variants in the FTO and CDKAL1 loci have recessive effects on the risk of obesity and type 2 diabetes, respectively. Diabetologia 59, 1214–1221. doi: 10.1007/s00125-016-3908-5
Xavier, R. J., Huett, A., and Rioux, J. D. (2008). Autophagy as an important process in gut homeostasis and Crohn's disease pathogenesis. Gut 57, 717–720. doi: 10.1136/gut.2007.134254
Zaykin, D. M., Meng, Z., and Ehm, M. G. (2006). Contrasting linkage-disequilibrium patterns between cases and controls as a novel association-mapping method. Am. J. Hum. Genet. 78, 737–746. doi: 10.1086/503710
Zeggini, E., Weedon, M. N., Lindgren, C. M., Frayling, T. M., Elliott, K. S., Lango, H., et al. (2007). Replication of genome-wide association signals in UK samples reveals risk loci for type 2 diabetes. Science 316, 1336–1341. doi: 10.1126/science.1142364
Keywords: fine-mapping, linkage disequilibrium, statistical genetics/genomics, two-site model, disease genetics, theoretical genetics, disease association, mode of inheritance
Citation: Maadooliat M, Bansal NK, Upadhya J, Farazi MR, Li X, He MM, Hebbring SJ, Ye Z and Schrodi SJ (2016) The Decay of Disease Association with Declining Linkage Disequilibrium: A Fine Mapping Theorem. Front. Genet. 7:217. doi: 10.3389/fgene.2016.00217
Received: 13 September 2016; Accepted: 28 November 2016;
Published: 12 December 2016.
Edited by:
Mariza De Andrade, Mayo Clinic, USACopyright © 2016 Maadooliat, Bansal, Upadhya, Farazi, Li, He, Hebbring, Ye and Schrodi. This is an open-access article distributed under the terms of the Creative Commons Attribution License (CC BY). The use, distribution or reproduction in other forums is permitted, provided the original author(s) or licensor are credited and that the original publication in this journal is cited, in accordance with accepted academic practice. No use, distribution or reproduction is permitted which does not comply with these terms.
*Correspondence: Steven J. Schrodi, c2Nocm9kaS5zdGV2ZW5AbWNyZi5tZmxkY2xpbi5lZHU=