 Jing Li1*
 Song-Shan Feng
 Tao Huang
- 1Department of Rehabilitation, The Second Xiangya Hospital, Central South University, Changsha, China
- 2Department of Neurosurgery, Xiangya Hospital, Central South University, Changsha, China
- 3Institute of Health Sciences, Shanghai Institutes for Biological Sciences, Chinese Academy of Sciences, Shanghai, China
Osteoarthritis (OA) is a complex disease that affects articular joints and may cause disability. The incidence of OA is extremely high. Most elderly people have the symptoms of osteoarthritis. The physiotherapy of OA is time consuming, and the chances of full recovery from OA are very minimal. The most effective way of fighting OA is early diagnosis and early intervention. Liquid biopsy has become a popular noninvasive test. To find the blood gene expression signature for OA, we reanalyzed the publicly available blood gene expression profiles of 106 patients with OA and 33 control samples using an automatic computational pipeline based on advanced feature selection methods. Finally, a compact 23-gene set was identified. On the basis of these 23 genes, we constructed a Support Vector Machine (SVM) classifier and evaluated it with leave-one-out cross-validation. Its sensitivity (Sn), specificity (Sp), accuracy (ACC), and Mathew's correlation coefficient (MCC) were 0.991, 0.909, 0.971, and 0.920, respectively. Obviously, the performance needed to be validated in an independent large dataset, but the in-depth biological analysis of the 23 biomarkers showed great promise and suggested that mRNA surveillance pathway and multicellular organism growth played important roles in OA. Our results shed light on OA diagnosis through liquid biopsy.
Introduction
Osteoarthritis (OA) is a complex disease that affects articular joints and may cause disability (Appleton, 2017). In the USA, 14 million people have symptomatic knee osteoarthritis (KOA) (Vina and Kwoh, 2017). Approximately 10–20% adult have OA (Bay-Jensen et al., 2018). Although OA is considered a disease primarily for the elderly, nowadays, more than half of patients with OA are under 65 years old. More and more young people show the symptoms of OA. The physiotherapy of OA is time consuming, and the chances of full recovery from OA are very minimal (Nelson, 2017). The most effective way of fighting OA is early diagnosis and early intervention. However, usually at early stage when OA is treatable, the patients often ignore the symptoms and are reluctant to go to the doctor for consultation (Nelson, 2017). When OA becomes serious, it is too difficult to treat this illness.
Blood is a vehicle for mRNAs from different tissues (Budd et al., 2017). It has been widely used for the early detection of various cancers (Zhang et al., 2017) and predictions of drug responses (Huang et al., 2008; Zhang et al., 2012). As a complex disease, the occurrence and development of OA involves changes to the mRNA (Steinberg et al., 2017). The blood flow under the subchondral bone (Aaron et al., 2018) may carry the signal of OA (Fotouhi et al., 2018). It can be detected when the mRNA level changes in blood (Budd et al., 2017). If so, then the detection of OA will be much easier and more accurate. In fact, there have been several studies of blood biomarkers for OA (Ramos et al., 2014; Feng et al., 2015; Ahmed et al., 2016; Bay-Jensen et al., 2018; Costa-Cavalcanti et al., 2018). For example, Ramos et al. demonstrated that the mRNA expression of apoptotic pathways was significantly different in the blood of patients with OA (Ramos et al., 2014). Bay-Jensen et al. reported the use of biochemical markers for OA, which measured the turnover of joint tissue or the inflammatory status (Bay-Jensen et al., 2018).
To quantify the cartilage turnover, several discovered biomarkers were used, such as PIIANP, CTX-II, ARGS, COMP, and C2C. In serum, PIIANP and CTX-II were found to be associated with OA progression by Osteoarthritis Initiative (OAI) Study of FNIH (Foundation for the National Institutes of Health; Kraus et al., 2017). ARGS was found to be associated with pain in anterior cruciate ligament injury patients (Wasilko et al., 2016). COMP was highly expressed in synovial fluid of patients with OA (Lorenzo et al., 2017). C2C was significantly different among patients with OA with no sign of cartilage damage, early signs of OA, and radiographic OA, and it was highly expressed in the patients with radiographic OA (Schaefer et al., 2017). In addition, there were biomarkers for synovial inflammation and fibrosis, such as C1M, C3M, and CRPM. They were positively correlated with elderly symptomatic OA (Martel-Pelletier et al., 2016).
Unfortunately, many of these biomarkers were for synovial fluid and most of them were only differentially expressed. Such qualitative biomarkers cannot be used in clinical settings directly, and for this reason, a blood biomarker-based quantitative classifier was the ideal model.
To build such a useful model, we reanalyzed a publicly available dataset from Ramos et al. (2014), which included the blood gene expression profiles of 106 patients with OA and 33 control samples with advanced feature selection methods, such as minimal redundancy maximal relevance (mRMR) and incremental feature selection (IFS), instead of a conventional statistical test. We identified 23 blood gene expression biomarkers. On the basis of these 23 genes, we constructed a Support Vector Machine (SVM) classifier and evaluated its performance with Leave-One-Out Cross Validation (LOOCV). The sensitivity (Sn), specificity (Sp), accuracy (ACC), and Mathew's correlation coefficient (MCC) were 0.991, 0.909, 0.971, and 0.920, respectively. In addition, we performed in-depth biological analysis of the 23 biomarkers. They were involved in the mRNA surveillance pathway and multicellular organism growth. Not only was a quantitative classifier constructed, but also the underlying mechanisms of OA occurrence and progression were revealed.
Materials and Methods
The Blood Gene Expression Profiles of Osteoarthritis and Control Samples
We downloaded the blood gene expression profiles of 106 OA and 33 control samples from the Gene Expression Omnibus (GEO) database under the accession number of GSE48556 (Ramos et al., 2014). The gene expression levels were measured using Illumina HumanHT-12 V3.0 expression beadchip. There were 48,802 probes corresponding to 25,159 genes. The probes representing the same gene were averaged, and the gene expression profiles of OA and control samples were quantile-normalized.
Unlike Ramos's study (Ramos et al., 2014), which identified 694 genes with adjusted p-value smaller than 0.05 using linear regression analysis and then narrowed down the genes to a short list using functional annotation, we aimed to develop an automatic analysis pipeline that minimized human intervention and avoided the hand-picking during biomarker selection. Despite the great performance achieved by Ramos et al. (2014), we believe that there are other actionable biomarkers which may function in a different way and we are trying to find them with advanced feature selection methods.
Mutual Information-Based Feature Ranking
Identifying the phenotype-associated features is one of the basic problems in bioinformatics, and for different problems, there are different solutions (Huang et al., 2008; Cai et al., 2010; Zhang et al., 2012, 2015, 2016, 2017; Li et al., 2014; Chen et al., 2018a; Wang et al., 2018). For identifying differentially expressed genes (DEG), the most widely used methods are the t-test, significance analysis of microarrays (SAM; Tusher et al., 2001), and linear regression as performed by Ramos et al. (2014). However, usually such statistics-based methods will identify too many DEG than we require. The redundancy between DEG is extremely high. Many genes have very similar expression patterns.
Unlike DEG, we needed a smaller number of signature genes that can be applied in clinical settings. Therefore, we adopted a mutual information-based method, i.e., mRMR (Peng et al., 2005), which has been widely used in feature ranking (Niu et al., 2013; Zhao et al., 2013; Zhou et al., 2015; Zhang et al., 2016; Li and Huang, 2017; Liu et al., 2017). It considers both the relevance between features and sample labels and the redundancy among features and has been proven to be an effective feature selection method, especially for gene expression analysis (Qin et al., 2012; Zhang et al., 2014b, 2017, 2018; Zhang Y. et al., 2014; Li et al., 2015; Zhou et al., 2015; Wang et al., 2016; Song et al., 2017; Chen et al., 2018b). The method works like this: let us use Ω to denote all the 25,159 genes, Ωs to denote the selected gene set that includes m genes, and Ωg to denote the n genes that will be evaluated, and one of them will be selected.
First, the relevance of gene g from Ωg with sample labels l was measured using mutual information (I) (Sun et al., 2012; Huang and Cai, 2013):
As the mutual information can only be calculated between categorical variables, the expression levels of each gene were discretized with the thresholds of mean minus standard deviation and mean plus standard deviation.
Then, the redundancy of gene g with selected gene set Ωs was quantified:
As we wanted to maximize the relevance and minimize the redundancy, the optimization goal can be characterized as follows and the best gene form Ωg will be selected:
After n rounds of optimization, a ranked gene list was obtained. The top ranked genes had strong relevance to OA but little redundancy among each other. In the next step, we further optimized the top 300 mRMR genes and got the final OA biomarker.
Osteoarthritis Biomarker Optimization
Although the mRMR method can rank genes effectively, it is still unknown how many genes should be finally selected as the OA biomarker. Therefore, we applied a greedy method called incremental feature selection (IFS) (Jiang et al., 2013; Li et al., 2014; Shu et al., 2014; Zhang N. et al., 2014a; Huang et al., 2015; Zhang et al., 2015; Chen et al., 2018a) to optimize the number of signature genes. In this method, too few genes may miss the important information and too many genes may introduce noise.
During the IFS procedure, different numbers of genes were tried and their performances were evaluated. As there were too many combinations and the mRMR have already ranked the genes meaningfully, the mRMR genes were tested sequentially, i.e., in the r rounds, were tested. For each round, an SVM classifier was constructed based on the selected genes and its performance was evaluated through LOOCV. We used the R function SVM from package e1017 with default parameters and kernel of radial to build the SVM classifier.
To have a complete measurement of the prediction performance, four statistics, which were the sensitivity (Sn), specificity (Sp), accuracy (ACC), and Matthew's correlation coefficient (MCC), were calculated:
In Equations (4–7), TP, TN, FP, and FN were the number of true OA, true control, false OA, and false control samples, respectively.
On the basis of IFS results, we can determine how many genes should be chosen finally as the OA biomarker to achieve the best performance. As the numbers of OA samples and control samples were not balanced, the MCC was used as the main measurement for classification performance.
Results
The Osteoarthritis-Associated Genes Selected and Ranked Based on the mRMR Method
To identify the OA-associated genes, we used the mRMR method that can select and rank genes based on their relevance with OA and their redundancy with other genes. The top 300 most discriminative genes for OA were selected and ranked using the mRMR method. These 300 mRMR genes will be further optimized using the IFS method.
The Osteoarthritis Biomarker Optimization Based on the IFS Method
As a ranked gene list, the top 300 mRMR genes included the candidate OA biomarker genes. However, we still did not know how many genes should be finally selected. To optimize OA biomarker selection, we tried different number of top genes and calculated their prediction performance. On the basis of these performances, we plotted an IFS curve, as shown in Figure 1, in which the x-axis was the number of genes and the y-axis was the LOOCV MCC of the SVM classifier. It can be seen that when the top 23 mRMR genes were used, the MCC was the highest, i.e., 0.920. Meanwhile, the sensitivity, specificity, and accuracy of the 23-gene classifier were 0.991, 0.909, and 0.971, respectively. The 23 genes are listed in Table 1. The confusion matrix of the predicted and actual sample classes is given in Table 2.
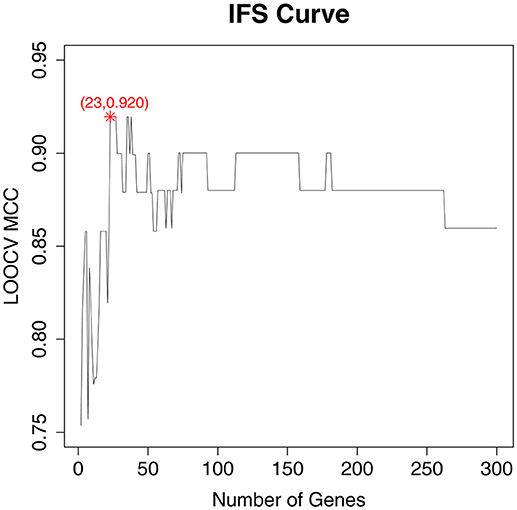
Figure 1. The IFS curve with the number of genes and the performance of classifiers. The x-axis was the number of genes used for SVM classifier construction and the y-axis was the classification Mathew's correlation coefficient (MCC) of the SVM classifier evaluated with Leave-One Out-Cross Validation (LOOCV). The peak of the IFS curve was MCC of 0.920 when 23 genes were used. The sensitivity, specificity, and accuracy of the 23-gene classifier were 0.991, 0.909, and 0.971, respectively.
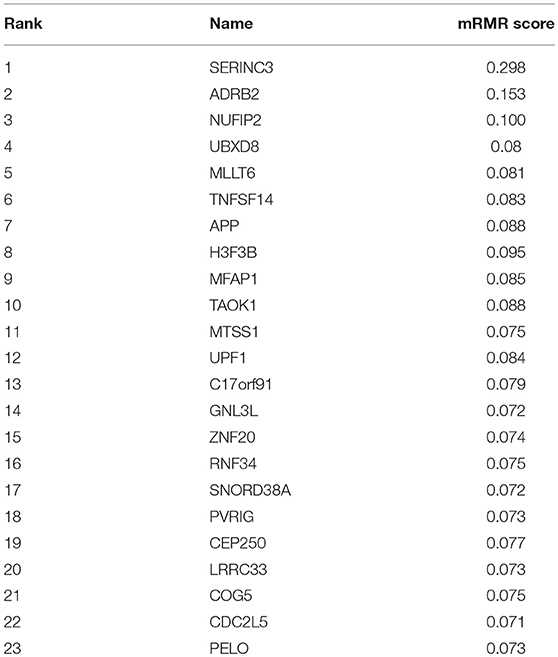
Table 1. The 23 osteoarthritis biomarker genes.
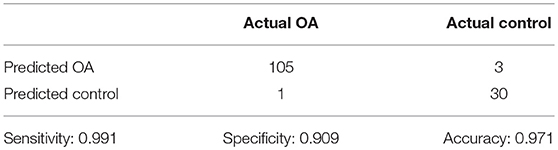
Table 2. The confusion matrix of the predicted and actual sample classes.
To investigate the associations of the 23 genes with OA, we plotted the heatmap of the 23 genes in OA and control samples, as shown in Figure 2. It can be seen that the OA and control samples had very different expression patterns. Generally speaking, APP, SERINC3, GNL3L, MLLT6, C17orf91, NUFIP2, TAOK1, H3F3B, and SNORD38A were highly expressed in control samples, whereas COG5, UBXD8, ZNF20, PELO, MTSS1, CEP250, CDC2L5, MFAP1, RNF34, UPF1, LRRC33, TNFSF14, ADRB2, and PVRIG were highly expressed in OA samples.
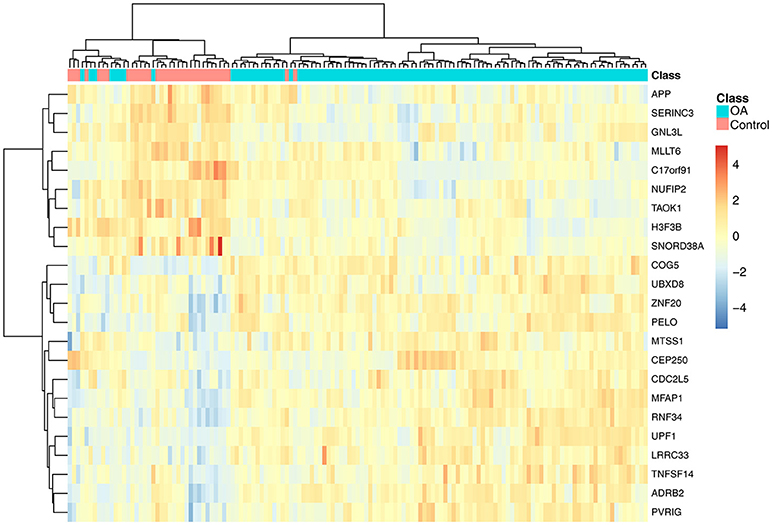
Figure 2. The heatmap of the 23 genes in osteoarthritis and control samples. Each row represented the expression level of one gene. The warm colors meant high expression and the cold colors meant low expression. The red and green columns were osteoarthritis and healthy samples, respectively. It can be seen that the osteoarthritis and control samples had very different expression patterns.
We compared our 23 genes with the 27 genes from Ramos et al. (2014) and plotted the Venn diagram, as shown in Figure 3. There were four overlapped genes: ADRB2, H3F3B, PELO, and ZNF20. We evaluated the significance of overlapping using the hypergeometric test. The p-value was 9.18e-09 and the odds ratio was 229.87. The overlap between our 23 genes and the 27 genes from Ramos et al. (2014) was very significant.
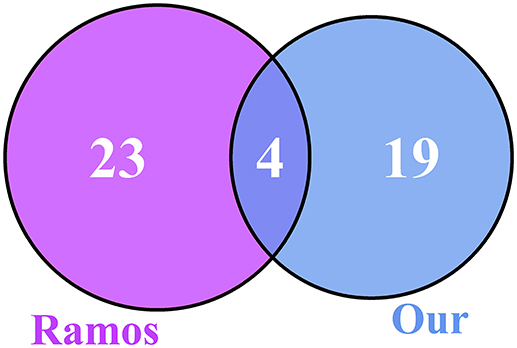
Figure 3. The Venn diagram of our 23 genes and the 27 genes from Ramos et al. (2014). There were four overlapped genes, ADRB2, H3F3B, PELO, and ZNF20, between the 23 osteoarthritis biomarker genes we identified and the 27 genes from Ramos et al. (2014). To evaluate the significance of overlap, we calculated the hypergeometric test p-value and odds ratio, which were 9.18e-09 and 229.87, respectively. The overlap was very significant.
The Functional Analysis of the Optimal Osteoarthritis Biomarker
We did functional enrichment analysis of 23 OA biomarker genes using Metascape (Tripathi et al., 2015). The Gene Ontology (GO) results are shown in Figure 4. The enriched GO terms were GO:0032200: telomere organization, GO:1903829: positive regulation of cellular protein localization, GO:0010389: regulation of G2/M transition of mitotic cell cycle, and GO:0010951: negative regulation of endopeptidase activity.
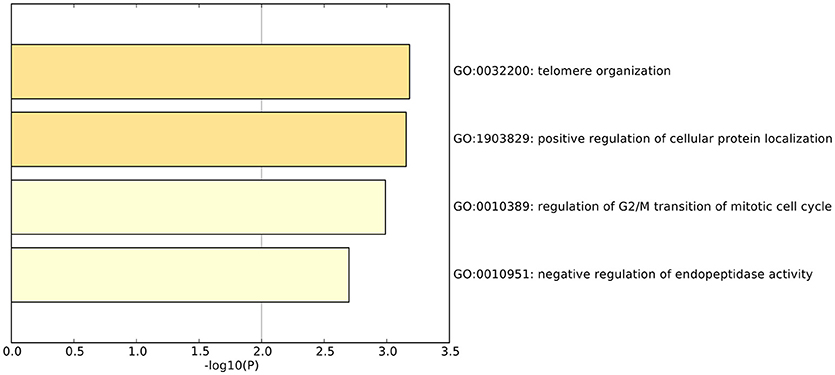
Figure 4. The enriched GO terms of the 23 osteoarthritis biomarker genes. The 23 osteoarthritis biomarker genes were enriched onto GO terms, such as GO:0032200: telomere organization, GO:1903829: positive regulation of cellular protein localization, GO:0010389: regulation of G2/M transition of mitotic cell cycle, and GO:0010951: negative regulation of endopeptidase activity.
There have been many studies about the relationship between telomere length and OA (Kuszel et al., 2015; Wiwanitkit, 2017). OA is a typical geriatric disease and the telomere length becomes shorter and shorter during aging. In patients with OA, the shortening of telomeres was accelerated (Kuszel et al., 2015). H3F3B, UPF1, and GNL3L were involved in GO:0032200: telomere organization.
The dysfunctional regulation of cellular protein localization in OA was reasonable. Osteoarthritis is a joint disease and the gap junctional communication is regulated by the extracellular signal pathway (Niger et al., 2009). APP, TNFSF14, CEP250, and GNL3L were involved in GO:1903829: positive regulation of cellular protein localization.
There have been many theories about cell cycle and OA. Franke et al. found that during the pathogenesis of OA, advanced glycation end products (AGEs) influence osteoarthritic fibroblast-like synovial cells through inducing cell cycle arrest (Niger et al., 2009). de Andrés et al. discovered that the demethylation of an NF-κB enhancer can induce OA by regulating the cell cycle (de Andrés et al., 2016). APP, CEP250, and TAOK1 were involved in GO:0010389: regulation of the G2/M transition of the mitotic cell cycle.
It is known that several endogenous peptides have strong inflammatory effects in the joint and they are regulated by endopeptidase (Solan et al., 1998). Therefore, the genes from GO:0010951: negative regulation of endopeptidase activity, such as APP, TNFSF14, and RNF34, may play regulatory roles in OA.
The Protein Interactions Between the Optimal Osteoarthritis Biomarkers
The protein–protein interaction (PPI) between the optimal OA biomarker was derived from the STRING database (https://string-db.org/) and is shown in Figure 5. STRING is a comprehensive database that integrates protein functional associations from multiple sources, such as experiment and literature (Szklarczyk et al., 2015). From Figure 5, we can see that APP, RNF34, TNFSF14, CEP250, and MLLT6 formed a cluster and GNL3L, UPF1, TAOK1, ADRB2, and H3F3B formed another cluster.
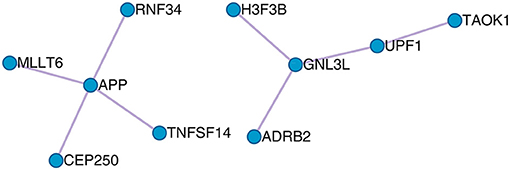
Figure 5. The PPI network of the 23 osteoarthritis biomarker genes. The 23 osteoarthritis biomarker genes formed two PPI clusters: the APP cluster that included APP, RNF34, TNFSF14, CEP250, and MLLT6, and the GNL3L cluster that included GNL3L, UPF1, TAOK1, ADRB2, and H3F3B.
Basically, the functions of the APP cluster that included APP, RNF34, TNFSF14, CEP250, and MLLT6 were regulation of endopeptidase activity, cell cycle, and cellular protein localization, whereas the functions the GNL3L cluster that included GNL3L, UPF1, TAOK1, ADRB2, and H3F3B were involved in telomere organization and cellular protein localization. Common function that linked the two clusters was cellular protein localization, which indicated that the secretion of protein into extracellular synovia was the key processes of OA.
Discussion
As a common geriatric disease, OA has extremely high incidence, especially in elder people. As the chances of full recovery from late-stage OA are minimal, the most effective way of fighting OA is early diagnosis and early intervention. As a popular noninvasive test, liquid biopsy showed great potential in cancer detection. To identify the blood gene expression signature for OA, we studied the blood gene expression profiles of 106 patients with OA and 33 control samples. With mRMR and IFS methods, we identified 23 genes whose sensitivity, specificity, accuracy, and Mathew's correlation coefficient were 0.991, 0.909, 0.971, and 0.920, respectively. The prediction performance was excellent. The biological function analysis of these 23 genes suggested that there were two pathways or PPI modules associated with OA through aging, cellular protein localization, and inflammation. These findings may be helpful for understanding OA.
There were still some disadvantages of this work. Here, we investigated only the gene expression levels. However, recent studies have suggested that the genome-wide association study (GWAS) and epigenetics approaches were also effective in OA mechanisms (Kerkhof et al., 2010; Panoutsopoulou et al., 2011; Rushton et al., 2014; Ramos and Meulenbelt, 2017; Simon and Jeffries, 2017). Integrating the genetic and epigenetic data with gene expression may provide a more comprehensive view of OA. We surveyed the identified genes based on one expression and found that the variant rs3815148 of COG5 was found to be associated with OA by GWAS reports (Kerkhof et al., 2010; Panoutsopoulou et al., 2011). Rushton et al. reported that the methylation status of MLLT6, TNFSF14, TAOK1, and MTSS1 was different between OA hip subtypes and LRRC33 was hypermethylated in OA hip than OA knee (Rushton et al., 2014). These results encourage us and others to do integrative studies of multiomics data in OA in future.
Data Availability Statement
The datasets for this study can be found in the Gene Expression Omnibus [https://www.ncbi.nlm.nih.gov/geo/query/acc.cgi?acc=GSE48556].
Author Contributions
JL and TH conceived and designed the experiments; JL performed the experiments; JL, C-NL, YK, and S-SF analyzed the data; JL and TH wrote the paper.
Funding
National Natural Science Foundation of China (31701151), Shanghai Sailing Program, and The Youth Innovation Promotion Association of Chinese Academy of Sciences (2016245).
Conflict of Interest Statement
The authors declare that the research was conducted in the absence of any commercial or financial relationships that could be construed as a potential conflict of interest.
Acknowledgments
We would like to thank Ramos et al. for sharing their data.
References
Aaron, R. K., Racine, J. R., Voisinet, A., Evangelista, P., and Dyke, J. P. (2018). Subchondral bone circulation in osteoarthritis of the human knee. Osteoarthritis Cartilage 26, 940–944. doi: 10.1016/j.joca.2018.04.003
Ahmed, U., Anwar, A., Savage, R. S., Thornalley, P. J., and Rabbani, N. (2016). Protein oxidation, nitration and glycation biomarkers for early-stage diagnosis of osteoarthritis of the knee and typing and progression of arthritic disease. Arthritis Res. Ther. 18, 250. doi: 10.1186/s13075-016-1154-3
Appleton, C. T. (2017). Osteoarthritis year in review 2017: biology. Osteoarthritis Cartilage 26, 296–303. doi: 10.1016/j.joca.2017.02.024
Bay-Jensen, A. C., Thudium, C. S., and Mobasheri, A. (2018). Development and use of biochemical markers in osteoarthritis: current update. Curr. Opin. Rheumatol. 30, 121–128. doi: 10.1097/BOR.0000000000000467
Budd, E., Nalesso, G., and Mobasheri, A. (2017). Extracellular genomic biomarkers of osteoarthritis. Expert. Rev. Mol. Diagn. 18, 55–74. doi: 10.1080/14737159.2018.1415757
Cai, Y. D., Huang, T., Feng, K. Y., Hu, L., and Xie, L. (2010). A unified 35-gene signature for both subtype classification and survival prediction in diffuse large B-Cell lymphomas. PLoS ONE 5:12726. doi: 10.1371/journal.pone.0012726
Chen, L., Li, J., Zhang, Y. H., Feng, K., Wang, S., Zhang, Y., et al. (2018a). Identification of gene expression signatures across different types of neural stem cells with the Monte-Carlo feature selection method. J. Cell. Biochem 119, 3394–3403. doi: 10.1002/jcb.26507
Chen, L., Pan, X., Hu, X., Zhang, Y. H., Wang, S., Huang, T., et al. (2018b). Gene expression differences among different MSI statuses in colorectal cancer. Int. J. Cancer doi: 10.1002/ijc.31554. [Epub ahead of print].
Costa-Cavalcanti, R. G., da Cunha de Sá-Caputo, D., Moreira-Marconi, E., Ribeiro Kütter, C., Brandão-Sobrinho-Neto, S., Liane Paineiras-Domingos, L., et al. (2018). Effect of auriculotherapy on the plasma concentration of biomarkers in individuals with knee osteoarthritis. J. Acupunct. Meridian Stud. doi: 10.1016/j.jams.2018.05.005. [Epub ahead of print].
de Andrés, M. C., Takahashi, A., and Oreffo, R. O. (2016). Demethylation of an NF-kappaB enhancer element orchestrates iNOS induction in osteoarthritis and is associated with altered chondrocyte cell cycle. Osteoarthritis Cartilage 24, 1951–1960. doi: 10.1016/j.joca.2016.06.002
Feng, J., Xia, Y., Yuan, L., Chen, A., Yang, N., Xiang, Y., et al. (2015). [An increased level of interleukin 27 in peripheral blood mononuclear cells and fibroblasts like synoviocytes of patients with rheumatoid arthritis or osteoarthritis]. Xi Bao Yu Fen Zi Mian Yi Xue Za Zhi 31, 1673–1676.
Fotouhi, A., Maleki, A., Dolati, S., Aghebati-Maleki, A., and Aghebati-Maleki, L. (2018). Platelet rich plasma, stromal vascular fraction and autologous conditioned serum in treatment of knee osteoarthritis. Biomed. Pharmacother. 104, 652–660. doi: 10.1016/j.biopha.2018.05.019
Huang, T., and Cai, Y. D. (2013). An information-theoretic machine learning approach to expression QTL analysis. PLoS ONE 8:e67899. doi: 10.1371/journal.pone.0067899
Huang, T., Shu, Y., and Cai, Y. D. (2015). Genetic differences among ethnic groups. BMC Genomics 16:1093. doi: 10.1186/s12864-015-2328-0
Huang, T., Tu, K., Shyr, Y., Wei, C. C., Xie, L., and Li, Y. X. (2008). The prediction of interferon treatment effects based on time series microarray gene expression profiles. J. Transl. Med. 6:44. doi: 10.1186/1479-5876-6-44
Jiang, Y., Huang, T., Chen, L., Gao, Y. F., Cai, Y., and Chou, K. C. (2013). Signal propagation in protein interaction network during colorectal cancer progression. Biomed. Res. Int. 2013:287019. doi: 10.1155/2013/287019
Kerkhof, H. J., Lories, R. J., Meulenbelt, I., Jonsdottir, I., Valdes, A. M., Arp, P., et al. (2010). A genome-wide association study identifies an osteoarthritis susceptibility locus on chromosome 7q22. Arthritis Rheum. 62, 499–510. doi: 10.1002/art.27184
Kraus, V. B., Collins, J. E., Hargrove, D., Losina, E., Nevitt, M., Katz, J. N., et al. (2017). Predictive validity of biochemical biomarkers in knee osteoarthritis: data from the FNIH OA Biomarkers Consortium. Ann. Rheum. Dis. 76, 186–195. doi: 10.1136/annrheumdis-2016-209252
Kuszel, L., Trzeciak, T., Richter, M., and Czarny-Ratajczak, M. (2015). Osteoarthritis and telomere shortening. J. Appl. Genet. 56, 169–176. doi: 10.1007/s13353-014-0251-8
Li, B. Q., You, J., Huang, T., and Cai, Y. D. (2014). Classification of non-small cell lung cancer based on copy number alterations. PLoS ONE 9:e88300. doi: 10.1371/journal.pone.0088300
Li, F., Li, C., Wang, M., Webb, G. I., Zhang, Y., Whisstock, J. C., et al. (2015). GlycoMine: a machine learning-based approach for predicting N-, C- and O-linked glycosylation in the human proteome. Bioinformatics 31, 1411–1419. doi: 10.1093/bioinformatics/btu852
Li, J., and Huang, T. (2017). Predicting and analyzing early wake-up associated gene expressions by integrating GWAS and eQTL studies. Biochim. Biophys. Acta 1864(6 Pt B), 2241–2246. doi: 10.1016/j.bbadis.2017.10.036
Liu, L., Chen, L., Zhang, Y. H., Wei, L., Cheng, S., Kong, X., et al. (2017). Analysis and prediction of drug-drug interaction by minimum redundancy maximum relevance and incremental feature selection. J. Biomol. Struct. Dyn. 35, 312–329. doi: 10.1080/07391102.2016.1138142
Lorenzo, P., Aspberg, A., Saxne, T., and Önnerfjord, P. (2017). Quantification of cartilage oligomeric matrix protein (COMP) and a COMP neoepitope in synovial fluid of patients with different joint disorders by novel automated assays. Osteoarthritis Cartilage 25, 1436–1442. doi: 10.1016/j.joca.2017.04.004
Martel-Pelletier, J., Raynauld, J. P., Dorais, M., Abram, F., and Pelletier, J. P. (2016). The levels of the adipokines adipsin and leptin are associated with knee osteoarthritis progression as assessed by MRI and incidence of total knee replacement in symptomatic osteoarthritis patients: a post hoc analysis. Rheumatology 55, 680–688. doi: 10.1093/rheumatology/kev408
Nelson, A. E. (2017). Osteoarthritis year in review 2017: clinical. Osteoarthritis Cartilage 26, 319–325. doi: 10.1016/j.joca.2017.11.014
Niger, C., Howell, F. D., and Stains, J. P. (2009). Interleukin-1beta increases gap junctional communication among synovial fibroblasts via the extracellular-signal-regulated kinase pathway. Biol. Cell 102, 37–49. doi: 10.1042/BC20090056
Niu, B., Huang, G., Zheng, L., Wang, X., Chen, F., Zhang, Y., et al. (2013). Prediction of substrate-enzyme-product interaction based on molecular descriptors and physicochemical properties. Biomed. Res. Int. 2013:674215. doi: 10.1155/2013/674215
Panoutsopoulou, K., Southam, L., Elliott, K. S., Wrayner, N., Zhai, G., Beazley, C., et al. (2011). Insights into the genetic architecture of osteoarthritis from stage 1 of the arcOGEN study. Ann. Rheum. Dis. 70, 864–867. doi: 10.1136/ard.2010.141473
Peng, H., Long, F., and Ding, C. (2005). Feature selection based on mutual information: criteria of max-dependency, max-relevance, and min-redundancy. IEEE Trans. Pattern Anal. Mach. Intell. 27, 1226–1238. doi: 10.1109/TPAMI.2005.159
Qin, W., Li, Y., Li, J., Yu, L., Wu, D., Jing, R., et al. (2012). Predicting deleterious non-synonymous single nucleotide polymorphisms in signal peptides based on hybrid sequence attributes. Comput. Biol. Chem. 36, 31–35. doi: 10.1016/j.compbiolchem.2011.12.001
Ramos, Y. F., Bos, S. D., Lakenberg, N., Böhringer, S., den Hollander, W. J., Kloppenburg, M., et al. (2014). Genes expressed in blood link osteoarthritis with apoptotic pathways. Ann. Rheum. Dis. 73, 1844–1853. doi: 10.1136/annrheumdis-2013-203405
Ramos, Y. F., and Meulenbelt, I. (2017). The role of epigenetics in osteoarthritis: current perspective. Curr. Opin. Rheumatol. 29, 119–129. doi: 10.1097/BOR.0000000000000355
Rushton, M. D., Reynard, L. N., Barter, M. J., Refaie, R., Rankin, K. S., Young, D. A., et al. (2014). Characterization of the cartilage DNA methylome in knee and hip osteoarthritis. Arthritis Rheumatol. 66, 2450–2460. doi: 10.1002/art.38713
Schaefer, L. F., Sury, M., Yin, M., Jamieson, S., Donnell, I., Smith, S. E., et al. (2017). Quantitative measurement of medial femoral knee cartilage volume - analysis of the OA Biomarkers Consortium FNIH Study cohort. Osteoarthritis Cartilage 25, 1107–1113. doi: 10.1016/j.joca.2017.01.010
Shu, Y., Zhang, N., Kong, X., Huang, T., and Cai, Y. D. (2014). Predicting A-to-I RNA editing by feature selection and random forest. PLoS ONE 9:e110607. doi: 10.1371/journal.pone.0110607
Simon, T. C., and Jeffries, M. A. (2017). The epigenomic landscape in osteoarthritis. Curr. Rheumatol. Rep. 19:30. doi: 10.1007/s11926-017-0661-9
Solan, N. J., Ward, P. E., Sanders, S. P., Towns, M. C., and Bathon, J. M. (1998). Soluble recombinant neutral endopeptidase (CD10) as a potential antiinflammatory agent. Inflammation 22, 107–121. doi: 10.1023/A:1022304025789
Song, J., Wang, H., Wang, J., Leier, A., Marquez-Lago, T., Yang, B., et al. (2017). PhosphoPredict: a bioinformatics tool for prediction of human kinase-specific phosphorylation substrates and sites by integrating heterogeneous feature selection. Sci. Rep. 7:6862. doi: 10.1038/s41598-017-07199-4
Steinberg, J., Ritchie, G. R. S., Roumeliotis, T. I., Jayasuriya, R. L., Clark, M. J., Brooks, R. A., et al. (2017). Integrative epigenomics, transcriptomics and proteomics of patient chondrocytes reveal genes and pathways involved in osteoarthritis. Sci. Rep. 7:8935. doi: 10.1038/s41598-017-09335-6
Sun, L., Yu, Y., Huang, T., An, P., Yu, D., Yu, Z., et al. (2012). Associations between ionomic profile and metabolic abnormalities in human population. PLoS ONE 7:e38845. doi: 10.1371/journal.pone.0038845
Szklarczyk, D., Franceschini, A., Wyder, S., Forslund, K., Heller, D., Huerta-Cepas, J., et al. (2015). STRING v10: protein-protein interaction networks, integrated over the tree of life. Nucleic Acids Res. 43(Database issue), D447–D452. doi: 10.1093/nar/gku1003
Tripathi, S., Pohl, M. O., Zhou, Y., Rodriguez-Frandsen, A., Wang, G., Stein, D. A., et al. (2015). Meta- and orthogonal integration of influenza “OMICs” data defines a role for UBR4 in virus budding. Cell Host Microbe 18, 723–735. doi: 10.1016/j.chom.2015.11.002
Tusher, V. G., Tibshirani, R., and Chu, G. (2001). Significance analysis of microarrays applied to the ionizing radiation response. Proc. Natl. Acad. Sci. U.S.A. 98, 5116–5121. doi: 10.1073/pnas.091062498
Vina, E. R., and Kwoh, C. K. (2017). Epidemiology of osteoarthritis: literature update. Curr. Opin. Rheumatol. 30, 160–167. doi: 10.1097/BOR.0000000000000479
Wang, D., Li, J. R., Zhang, Y. H., Chen, L., Huang, T., and Cai, Y. D. (2018). Identification of differentially expressed genes between original breast cancer and xenograft using machine learning algorithms. Genes 9:155. doi: 10.3390/genes9030155
Wang, H., Feng, L., Zhang, Z., Webb, G. I., Lin, D., and Song, J. (2016). Crysalis: an integrated server for computational analysis and design of protein crystallization. Sci. Rep. 6:21383. doi: 10.1038/srep21383
Wasilko, S. M., Tourville, T. W., DeSarno, M. J., Slauterbeck, J. R., Johnson, R. J., Struglics, A., et al. (2016). Relationship between synovial fluid biomarkers of articular cartilage metabolism and the patient's perspective of outcome depends on the severity of articular cartilage damage following ACL trauma. J. Orthop. Res. 34, 820–827. doi: 10.1002/jor.23084
Wiwanitkit, V. (2017). Telomere length and angiogenic cytokines in knee osteoarthritis. Int. J. Rheum. Dis. 20:2141. doi: 10.1111/1756-185X.13140
Zhang, N., Huang, T., and Cai, Y. D. (2014a). Discriminating between deleterious and neutral non-frameshifting indels based on protein interaction networks and hybrid properties. Mol. Genet. Genomics 290, 343–352. doi: 10.1007/s00438-014-0922-5
Zhang, N., Wang, M., Zhang, P., and Huang, T. (2016). Classification of cancers based on copy number variation landscapes. Biochim. Biophys. Acta 1860(11 Part B), 2750–2755. doi: 10.1016/j.bbagen.2016.06.003
Zhang, N., Zhou, Y., Huang, T., Zhang, Y. C., Li, B. Q., Chen, L., et al. (2014b). Discriminating between lysine sumoylation and lysine acetylation using mRMR feature selection and analysis. PLoS ONE 9:e107464. doi: 10.1371/journal.pone.0107464
Zhang, P. W., Chen, L., Huang, T., Zhang, N., Kong, X. Y., and Cai, Y. D. (2015). Classifying ten types of major cancers based on reverse phase protein array profiles. PLoS ONE 10:e0123147. doi: 10.1371/journal.pone.0123147
Zhang, T. M., Huang, T., and Wang, R. F. (2018). Cross talk of chromosome instability, CpG island methylator phenotype and mismatch repair in colorectal cancer. Oncol. Lett. 16, 1736–1746. doi: 10.3892/ol.2018.8860
Zhang, X., Chen, C., Wu, M., Chen, L., Zhang, J., Zhang, X., et al. (2012). Plasma microRNA profile as a predictor of early virological response to interferon treatment in chronic hepatitis B patients. Antivir. Ther. 17, 1243–1253. doi: 10.3851/IMP2401
Zhang, Y., Xu, J., Zheng, W., Zhang, C., Qiu, X., Chen, K., et al. (2014). newDNA-Prot: prediction of DNA-binding proteins by employing support vector machine and a comprehensive sequence representation. Comput. Biol. Chem. 52, 51–59. doi: 10.1016/j.compbiolchem.2014.09.002
Zhang, Y. H., Huang, T., Chen, L., Xu, Y., Hu, Y., Hu, L. D., et al. (2017). Identifying and analyzing different cancer subtypes using RNA-seq data of blood platelets. Oncotarget 8, 87494–87511. doi: 10.18632/oncotarget.20903
Zhao, T. H., Jiang, M., Huang, T., Li, B. Q., Zhang, N., Li, H. P., et al. (2013). A novel method of predicting protein disordered regions based on sequence features. Biomed Res. Int. 2013:414327. doi: 10.1155/2013/414327
Keywords: osteoarthritis, blood, gene expression, signature, support vector machine, minimal redundancy maximal relevance, incremental feature selection
Citation: Li J, Lan C-N, Kong Y, Feng S-S and Huang T (2018) Identification and Analysis of Blood Gene Expression Signature for Osteoarthritis With Advanced Feature Selection Methods. Front. Genet. 9:246. doi: 10.3389/fgene.2018.00246
Received: 03 May 2018; Accepted: 22 June 2018;
Published: 30 August 2018.
Edited by:
Quan Zou, Tianjin University, ChinaReviewed by:
Jiangning Song, Monash University, AustraliaJianbo Pan, Johns Hopkins Medicine, United States
Copyright © 2018 Li, Lan, Kong, Feng and Huang. This is an open-access article distributed under the terms of the Creative Commons Attribution License (CC BY). The use, distribution or reproduction in other forums is permitted, provided the original author(s) and the copyright owner(s) are credited and that the original publication in this journal is cited, in accordance with accepted academic practice. No use, distribution or reproduction is permitted which does not comply with these terms.
*Correspondence: Jing Li, bGlqaW5nMjAxN0Bjc3UuZWR1LmNu
Tao Huang, dG9odWFuZ3Rhb0AxMjYuY29t