 Patricia de Francisco
 Francisco Amaro
 Ana Martín-González
 Juan Carlos Gutiérrez
- Departamento de Genética, Fisiología y Microbiología, Facultad de Ciencias Biológicas, Universidad Complutense de Madrid, Madrid, Spain
Metallothioneins (MT) are multi-stress proteins mainly involved in metal detoxification. MT gene expression is normally induced by a broad variety of stimulus and its gene expression regulation mainly occurs at a transcriptional level. Conserved motifs in the Tetrahymena thermophila MT promoters have been described. These motifs show a consensus sequence very similar to AP-1 sites, and bZIP type transcription factors might participate in the MT gene expression regulation. In this research work, we characterize four AP-1 transcription factors in each of four different analyzed Tetrahymena species, detecting a high conservation among them. Each AP-1 molecule has its counterpart in the other three Tetrahymena species. A comparative qRT-PCR analysis of these AP-1 genes have been carried out in different T. thermophila strains (including metal-adapted, knockout and/or knockdown strains among others), and under different metal-stress conditions (1 or 24 h Cd2+, Cu2+, or Pb2+ treatments). The possible interaction of these transcription factors with the conserved AP-1 motifs present in MT promoters has been corroborated by protein-DNA interaction experiments. Certain connection between the expression patterns of the bZIP and MT genes seems to exist. For the first time, and based on our findings, a possible gene expression regulation model including both AP-1 transcription factors and MT genes from the ciliate T. thermophila has been elaborated.
Introduction
Metallothioneins (MTs) are multi-stress proteins able to chelate metallic cations through their numerous cysteine residues (Gutierrez et al., 2011; de Francisco et al., 2016). They are considered as multifunctional proteins that participate in different biological processes, such as: maintaining of cellular metal homeostasis, protection against toxic metals (detoxification) or indirect protection against reactive oxygen species (ROS) (Vasak, 2005; Diaz et al., 2007). Although most of the MT genes have certain basal expression levels, their expression is normally induced by a broad variety of stimulus or environmental stressors, such as: metal(loid)s, oxidant and cytotoxic agents, hormones, inflammatory agents and cytokines, growth factors, antibiotics, radiations and other factors considered as stress signals (Haq et al., 2003). Moreover, MT genes expression levels are modified during cell differentiation processes, organism developmental phases (De et al., 1991), cellular aging and some pathologic processes, such as: cancer, Crohn illness, Alzheimer, amyotrophic lateral sclerosis or Wilson and Menkes illnesses (disorders in the copper homeostasis maintaining) (Miles et al., 2000; Laukens et al., 2009; Takahashi, 2015).
Although there are signs of post-transcriptional regulation (Haq et al., 2003), MT gene expression regulation mainly occurs at a transcriptional level by some response cis elements located in their promoter regions, where different transcription factors (TFs) can be bound (Gutierrez et al., 2009, 2011). Besides TATA boxes and transcriptional start regions, MT gene promoters can have different motifs related to their expression induction, such as; metal responsive elements (MREs), antioxidant responsive elements (AREs), and glucocorticoid responsive elements (GREs) (Gunther et al., 2012). Moreover, other binding-sites have been detected in some MT gene promoters, as GATA factors binding-sites ([A/T]GATA[A/G]) described in MTs from the nematode Caenorhabditis elegans (Moilanen et al., 1999), AP-1 (Activating Protein-1) sites (TGA[G/C]TCA) and the GC boxes (GGGGCGGGG) related to the binding of bZIP (basic region leucine zipper) TFs (Shaulian and Karin, 2002; Haq et al., 2003; Jenny et al., 2006; Gutierrez et al., 2011; Kumar et al., 2015). A MTCM1 motif (Metallothionein Conserved Motif 1) has been described in the promoters of several MT genes from the ciliate Tetrahymena thermophila: MTT1 gene promoter has 6 MTCM1 motifs, MTT3 only has 2 motifs and MTT5 has 13 MTCM1 motifs in its duplicated promoter region (Diaz et al., 2007; Gutierrez et al., 2011; de Francisco et al., 2016). In fact, these motifs show a consensus sequence (GTGTGAATCATGAGT) very similar to the previously reported for AP-1 sites and, therefore, it is believed that putative bZIP factors could participate in their gene expression regulation (Diaz et al., 2007; Gutierrez et al., 2011; de Francisco et al., 2016).
The bZIP superfamily is one of the most ancient and conserved eukaryotic TFs analyzed until now (Jindrich and Degnan, 2016). Some of them as Jun/Fos or CREB have been extensively studied in plants and animals and they are used as models to understand DNA-transcription factor interactions (Karin et al., 1997; Jakoby et al., 2002). bZIP TFs are really important due to their participation in multiple biological processes. Moreover, they are involved in the cellular response to different stress situations, such as; the presence of a pathogen, high temperature, osmolarity changes or high salinity levels, the presence of toxic substances, apoptosis, etc. (Karin et al., 1997; Sornaraj et al., 2016; De la Cruz et al., 2017). Although bZIP superfamily includes different types of TFs, all of them are characterized by presenting a highly conserved bZIP motif (60–80 amino acids). This motif is formed by two different adjacent regions: a N-terminal basic region which is usually formed by ∼33 amino acids and allows the binding of TF to the DNA chain and an amphipathic helix or leucine zipper (Karin et al., 1997). The basic region contains a nuclear location signal followed by the conserved motif N-X7-R/K (where X is any other amino acid). The leucine zipper is formed by five or more highly conserved leucine residues and, in general, exactly located every 6 amino acids. The bZIP molecules dimerize each other, by the leucine zipper structures, to be able for binding to DNA molecules. In this way, they can form homo- or heterodimers of mutually compatible bZIP proteins according to electrostatic attraction/repulsion processes among polar residues of the leucine helix hydrophobic regions (Karin et al., 1997).
The bZIP superfamily can be grouped into at least seven families (Yang and Cvekl, 2007), and among them AP-1 family includes homo- and heterodimeric forms of Jun (v-Jun, c-Jun, JunB, and JunD) and Fos/Fra (v-Fos, c-Fos, FosB, Fra1, and Fra2) subfamilies. All AP-1 factors are characterized by binding DNA molecules through two possible responsive elements: TRE [TPA(12-O-tetradecanoate-13-acetate)-responsive element] which has the consensus sequence TGACTCA and CRE (cAMP-responsive element) whose consensus sequence is TGACGTCA (Karin et al., 1997). These transcription factors are induced by different stress conditions (metals, cytokines, H2O2, etc.) through a cellular signaling pathway where different MAP kinases (JNK, ASK1 and p38, among others) are involved (Karin et al., 1997; Valko et al., 2005). AP-1 expression regulation and activation processes are complex and depend on the dimers formation, possible post-translational modifications and their interactions to specific proteins (protein-kinases, transcriptional coactivators, etc.) (Kappelmann et al., 2014). All these elements define the stability and binding specificity of each AP-1 factor to a particular promoter (Schutze et al., 2008).
AP-1 factors participate in the control of multiple cell processes such as cellular differentiation, proliferation, cancer and apoptosis (Karin et al., 1997; Shaulian and Karin, 2002; Yang and Cvekl, 2007; Shaulian, 2010). They are also involved in gene expression regulation processes in response to different stimulus: cytokines, growth factors, viral or bacterial infections and stress conditions (Durchdewald et al., 2009). Likewise, AP-1 has been related to MT gene expression increasing levels under different stress conditions in different organisms, such as; Saccharomyces cerevisiae (Wu et al., 1993; Kumar et al., 2015), Crassostrea virginica (Jenny et al., 2006), Drosophila melanogaster (Kockel et al., 2001), and C. elegans (Moilanen et al., 1999). An increase of MT-1 metallothionein gene expression level has been related to a higher gene expression of a gene encoding an AP-1 TF in mammalian cells after treatment with an oxidative stressor (Braithwaite et al., 2010). Also, higher MT-1, c-fos, and c-jun gene expression levels were detected after 24 h copper treatments in simian cells (Mattie et al., 2008).
In this research work, we have carried out a structural in silico characterization of four putative AP-1 TFs in the ciliate-model T. thermophila (named as TthebZIP1, TthebZIP2, TthebZIP3, and TthebZIP4), and a comparison with AP-1 from other Tetrahymena species. Moreover, we have realized an AP-1 gene expression analysis using different T. thermophila strains (including metal-adapted, knockout and knockdown strains), under various metal (Cd2+, Cu2+, or Pb2+) treatments (de Francisco et al., 2017, 2018). In addition, experiments to study protein-DNA interactions were carried out, which might confirm the interaction of these AP-1 TFs with MTCM1 motifs present in T. thermophila MT gene promoters. Finally, taken together all these data, we have elaborated a model relating all T. thermophila metallothionein paralog (MTT1, MTT3, MTT5, and MTT2/4) gene expression and its presumable regulation by these AP-1 TFs in response to metal-stress.
Materials and Methods
Strains and Culture Conditions
Different T. thermophila strains were used in this study: SB1969 control strain (chx1-1/chx1-1, mpr1-1/mpr1-1; pm-S, cy-S, mt II), kindly supplied by Dr. E. Orias (University of California, Santa Barbara, United States), Strains GFPMTT1 and GFPMTT5 harbor multi-copy plasmids bearing the constructs PMTT1::GFP::MTT1 or PMTT1::GFP::MTT5, which over-express MTT1 or MTT5, respectively, under the same promoter from MTT1 gene (Amaro et al., 2014), three metal-adapted strains (Cd-adap, Cu-adap, and Pb-adap) which were obtained after an extensive metal adaptation process and three knockout (KO) and/or knockdown (KD) strains for MTT1 and/or MTT5 genes (MTT1KO, MTT5KD, MTT1KO+MTT5KD) (de Francisco et al., 2017, 2018). All these strains were axenically grown in PP210 medium [2% w/v aqueous solution of proteose peptone (Pronadisa), supplemented with 10 μM FeCl3 and 250 μg/ml of streptomycin sulfate (Calbiochem) and penicillin G (Sigma)] and maintained at a constant temperature of 30 ± 1°C. Metal-adapted strains were grown with a constant metal pressure equal to their maximum tolerated concentrations (MTC) previously calculated: 115 μM Cd2+ (CdCl2, Sigma) for Cd-adap strain, 4 mM Cu2+ (CuSO4⋅5H2O, Sigma) for Cu-adap and 5.5 mM Pb2+ (Pb(NO3)2, Sigma) for Pb-adap (de Francisco et al., 2017). To prevent the loss of multi-copy plasmids, GFPMTT1 and GFPMTT5 strains were maintained in 12 μg/ml of paromomycin sulfate (Sigma). Similarly, MTT5KD and MTT1KO+MTT5KD strains were maintained in 800 μg/ml of paromomycin sulfate or 60 μg/ml of cycloheximide, respectively (de Francisco et al., 2017).
Metal Stress Treatments
The treatment conditions (concentration and time of exposure) for each heavy metal correspond to half the LC50 value that results in negligible cell mortality, as were previously determined (Diaz et al., 2007). Cells were exposed for 1 or 24 h to Cd2+ (CdCl2), Cu2+ (CuSO4 ⋅ 5H2O) or Pb2+ [Pb(NO3)2] (Sigma). SB1969, KO, and KD strains were treated with 44.5 μM Cd2+, 315 μM Cu2+, or 965 μM Pb2+, while metal-adapted, GFPMTT1 and GFPMTT5 strains were exposed to the previously mentioned MTC for each metal. Metal-adapted cells were maintained for 24 h in PP210 medium without any added metal and then were exposed for 1 or 24 h to the MTC of each metal. The MTC-cultures were obtained by continuously culturing cells at their corresponding MTC.
Total RNA Isolation and cDNA Synthesis
Exponential cell cultures (1–3 × 10⁵ cells/ml) were harvested by centrifugation at 2,800 rpm for 3 min. Total RNA samples were isolated by using the TRIzol Reagent method (Invitrogen). RNA samples were treated with DNase I (Roche) for 30 min at 37°C. RNA integrity was tested by agarose gel electrophoresis and sample concentrations were calculated by the NanoDrop 1000 (Thermo Scientific). MultiScribe Reverse Transcriptase 50 units/μl (Life Technologies) and oligo(dT)-adaptor primer (Roche) were used to synthesize cDNAs from 3.5 μg of total RNA.
Quantitative RT-PCR (qRT-PCR)
cDNA samples were amplified in duplicate in 96 microtiter plates. Each qPCR reaction (20 μl) contained: 10 μl of SYBR Green (Takara), 0.4 μl of ROX as passive reference dye (Takara), 1 μl of each primer (at 40 nM final concentration), 3.6 μl of ultrapure sterile water (Roche) and 4 μl of a 10-1 dilution of cDNA. PCR primers (Supplementary Table S1) were designed using the “Primer Quest and Probe Design” online-application from IDT (Integrated DNA Technologies). β-actin was used as an endogenous control or normalizer gene. Melting curves were obtained and primers specificity was tested by confirming each PCR product by gel electrophoresis and sequencing. Real-time PCR reactions were carried out in an iQ5 real-time PCR apparatus (Bio-Rad) and the thermal cycling protocol was as follows: 5 min at 95°C, 40 cycles (30 s at 95°C, 30 s at 55°C and 20 s at 72°C), 1 min at 95°C and 1 min at 55°C. All controls [no template controls (NTC) and RT minus controls] were negative. Amplification efficiency (E) was measured by using 10-fold serial dilutions of a positive control PCR template. Efficiency parameters were met for all tested genes in all the strains (Supplementary Table S2). Results were finally processed by the standard-curve method (Larionov et al., 2005) and were corroborated with at least two independent experiments, each performed in duplicate. We compared the basal expression levels of different genes using the formula: 2(Ct1-Ct2), being Ct1 and Ct2 the cycle threshold (Ct) values of both genes under a control situation (no metal exposure).
Protein-DNA Interaction Experiments
Cell extracts were obtained according to the following protocol (Barchetta et al., 2008). From T. thermophila cultures ∼107 cells were collected by centrifugation at 1,100 × g during 5 min. The cellular pellet was lysed at 4°C in lysis buffer [10 mM Tris-HCl pH 7.5, 10 mM MgCl2 (Sigma), 250 mM sucrose (Panreac), 0.5% Triton X-100 (Merk)], containing 100 μl/ml of a protease inhibitor cocktel (Sigma), 1mM PMSF (Fluka) and 0.5 mM DTT (Sigma). The cellular lysate was centrifugated at 15,000 × g during 10 min at 4°C, and the supernatant discarded. The presence of intact nuclei was detected by staining with propidium iodide and fluorescence microscopy. The obtained pellet was resuspended in 300 μl of cold nuclear protein extraction buffer [50 mM Tris-HCl pH 8, 0.5 M NaCl (PanReac), 10% glycerol (PanReac), 1 mM DTT (Merck), 1 m MPMSF (Sigma), 0.1 mM EDTA (BM)] and incubated at 4°C during 20 min. Then, the cellular debris were eliminated by centrifugation at 15,000 × g during 5 min at 4°C. The supernatant was distributed in 30 μl aliquots immediately frozen under liquid nitrogen and stored at -80°C.
EMSA (Electrophoretic mobility shift assay) experiments were carried out according to protocols from Hellman and Fried (2007) and Molloy (2000) with some modifications. All solutions for these assays were performed with Milli Q water (Millipore). In Supplementary Table S3 the oligonucleotide sequences used in EMSA, previously labeled with digoxigenin (DIG High Prime DNA labeling kit) (Roche), are showed. Each one of these oligonucleotides (10 pmoles) were diluted in TEN buffer [0.1 M Tris-HCl pH 8, 1 mM EDTA (BM) pH 8, 50 mM NaCl (PanReac)]. In order to determine the optimal conditions for the protein-DNA binding, different reactions were tested, varying the volumes of each component of the reaction (Supplementary Table S4). The nuclear extract (3–75 μg/μl) was incubated with the digoxigenin-labeled DNA (50 fmoles/μl) in binding buffer [10 mM Tris-HCl pH 7.5, 50 mM NaCl (PanReac), 25 mM MgCl2 (Sigma), 4% glycerol (PanReac), 0.5 mM DTT (Merk)] and 1 μg/μl poly(dI-dC). Each reaction (20 μl) was incubated at room temperature (20 min). The binding reaction was stopped adding the 5× electrophoresis sample buffer [300 mM Tris-HCl pH 7.5, 50% glycerol (PanReac), 0.05% bromophenol blue (Bio-Rad), 0.05% xylene cyanol (Bio-Rad)]. The samples were analyzed by polyacrylamide gel electrophoresis [10× TBE buffer (Pronadisa), 40% acrylamide-bisacrylamide, 0.05 g ammonium persulfate (Sigma), 12 ml TEMED (Sigma)], at 10 V/cm (2 h) in 1× TBE buffer. Then, DNA from the gel was electro-blotted onto a nylon+ membrane (Roche), at 100 V in 1× TBE buffer, using a Mini Trans-blot Cell system (Bio-Rad), it was bound to the membrane by UV light using a XL-1000 UV crosslinker (Spectronic Corporation). Chemiluminescentnt detection of DNA was performed as described in Detection Started kit II manual (Roche).
To identify nuclear proteins that can interact with the selected DNA fragment we apply the Southwestern blotting method (Labbe et al., 2001; Siu et al., 2008). The nuclear protein extracts were obtained as previously reported in this section. These protein extracts were analyzed by SDS-PAGE (SDS-polyacrylamide gel electrophoresis) at 10 V/cm during 2 h (4°C). Then, proteins were electro-blotted onto PVDF membrane (at 150 mA, 2h, 4°C) in electro-blotting buffer [0.25 M Tris, 1.92 M glycine (Sigma), 20% methanol (Merck)], using the Mini-Transblot Cell system (Bio-Rad). Blotted proteins were renaturalized in TNED buffer (10 mM Tris buffer pH 7.5, 50 mM NaCl, 0.1 mM EDTA, 1 mM DTT ] containing 5% skimmed milk powder, and incubated during 4 h at room temperature. After this, the labeled oligonucleotide (50 fmol/μl) in TNED buffer was added and incubated overnight. The membranes were washed in TNED buffer and the labeled probes were chemiluminescent detected as previously reported.
Partial Protein Purification
The partial protein purification binding to MTCM1 motifs was carried out using the DNA-protein binding purification kit (Roche). The used oligonucleotide (MTCMAB2) presents two repetitions of the MTCM1 motif (Supplementary Table S3). After applying the protocol submitted by the manufacturer, the eluted protein fractions were analyzed by SDS-PAGE and proteins were fixed and stained with a silver staining method (Chevallet et al., 2006).
Statistical Analysis
Gene expression differences were tested for statistical significance by Student’s t-test using the program Statgraphics Centurion XVI (16.1.15 version). P-value was fixed in ≤0.05.
In silico Analysis of AP-1 Transcription Factors and Phylogenetic Tree Construction
New putative AP-1 TF sequences were searched in the sequenced genomes of T. borealis, T. elliotti, and T. malaccensis using the BLAST tool of Tetrahymena Genome Database (Stover et al., 2006). T. thermophila AP-1 TFs (TthebZIP1, ThebZIP2, TthebZIP3, and TthebZIP4) were used as reference sequences. Access numbers of all the sequences used in this study are collected in Supplementary Table S5. Amino acid composition and molecular weight calculation of new putative AP-1 factors were performed using the online application PIR (Protein Information Resource1) (Wu et al., 2003). Possible leucine zippers and coiled-coil motifs were identified using two online applications: 2ZIP-Server2 (Bornberg-Bauer et al., 1998) and COILS3 (Lupas et al., 1991). PSIPRED program4 was used to predict secondary structures of bZIP motifs in the AP-1 TFs (Jones, 1999). Possible interactions between coiled-coil regions were calculated by the program bZIP coiled-coil scoring form5 (Fong et al., 2004). A multiple sequence alignment was performed using T-Coffee online application (Tree-based Consistency Objective Function for Alignment Evaluation) (Notredame et al., 2000). The phylogenetic trees were built with MEGA 5.05 program, using Neighbor Joining algorithm and the bootstrap method with 2,000 repeats. Prediction of three-dimensional (3D) structures was carried out using Phyre2 program (Protein Homology/Analogy Recognition Engine6) (Kelley et al., 2015) and PyMOL Viewer 1.7.4.5. (PyMOL Molecular Graphics System7) was used to visualize them. Putative conserved motifs in 5′UTR regions were described using MEME v.4.11.2 program (Multiple Em for Motif Elicitation) (Bailey and Elkan, 1994).
Results
Identification and Structural Characterization of AP-1 Transcription Factors in Different Tetrahymena Species
Four putative AP-1 genes are detected in the T. thermophila macronuclear genome and they have been named; ThebZIP1, TthebZIP2, TthebZIP3, and TthebZIP4. Likewise, four putative AP-1 genes have been identified in each of the other three analyzed Tetrahymena species (T. elliotti, T. borealis, and T. malaccensis). The main characteristics of these AP-1 TFs are summarized in Table 1. The comparative analysis of these AP-1 shows that each T. thermophila AP-1 gene has its matching ortholog in the other three species, sharing common characteristics among them. These genes have introns in a variable number, from only 2 (in TthebZIP2, TborbZIP3, TmalabZIP2, and TellibZIP2) to 11 (in TthebZIP3, TborbZIP4, TmalabZIP3, and TellibZIP3) (Table 1). The inferred protein sizes are in the range of 501–746 aa, and we can distinguish two smaller AP-1 proteins (501–595 aa) and two bigger AP-1 proteins (726–746 aa) in each analyzed specie (Table 1). A bZIP motif has been identified in all Tetrahymena AP-1 inferred amino acid sequences and they are similar (mainly the basic region) to the bZIP motifs previously described in other AP-1 TFs from different model organisms, such as: Homo sapiens (HsapFOS), C. elegans (CeleFOS-1, CeleJUN-1B), Mus musculus (MmusJUN-B) or Rattus norvegicus (RnorATF3) (Figure 1). Likewise, we have detected proteins with bZIP motifs in other ciliates; one sequence in Oxytricha sp. and seven sequences in Stentor coeruleus (Figure 1).
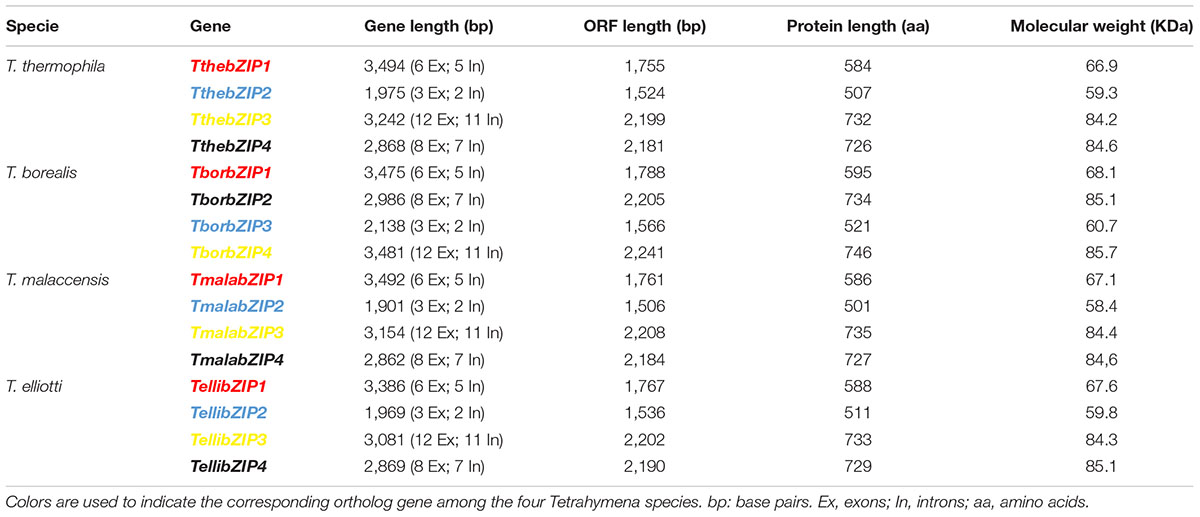
TABLE 1. Structural characteristics of the bZIP genes and inferred proteins from different Tetrahymena species.
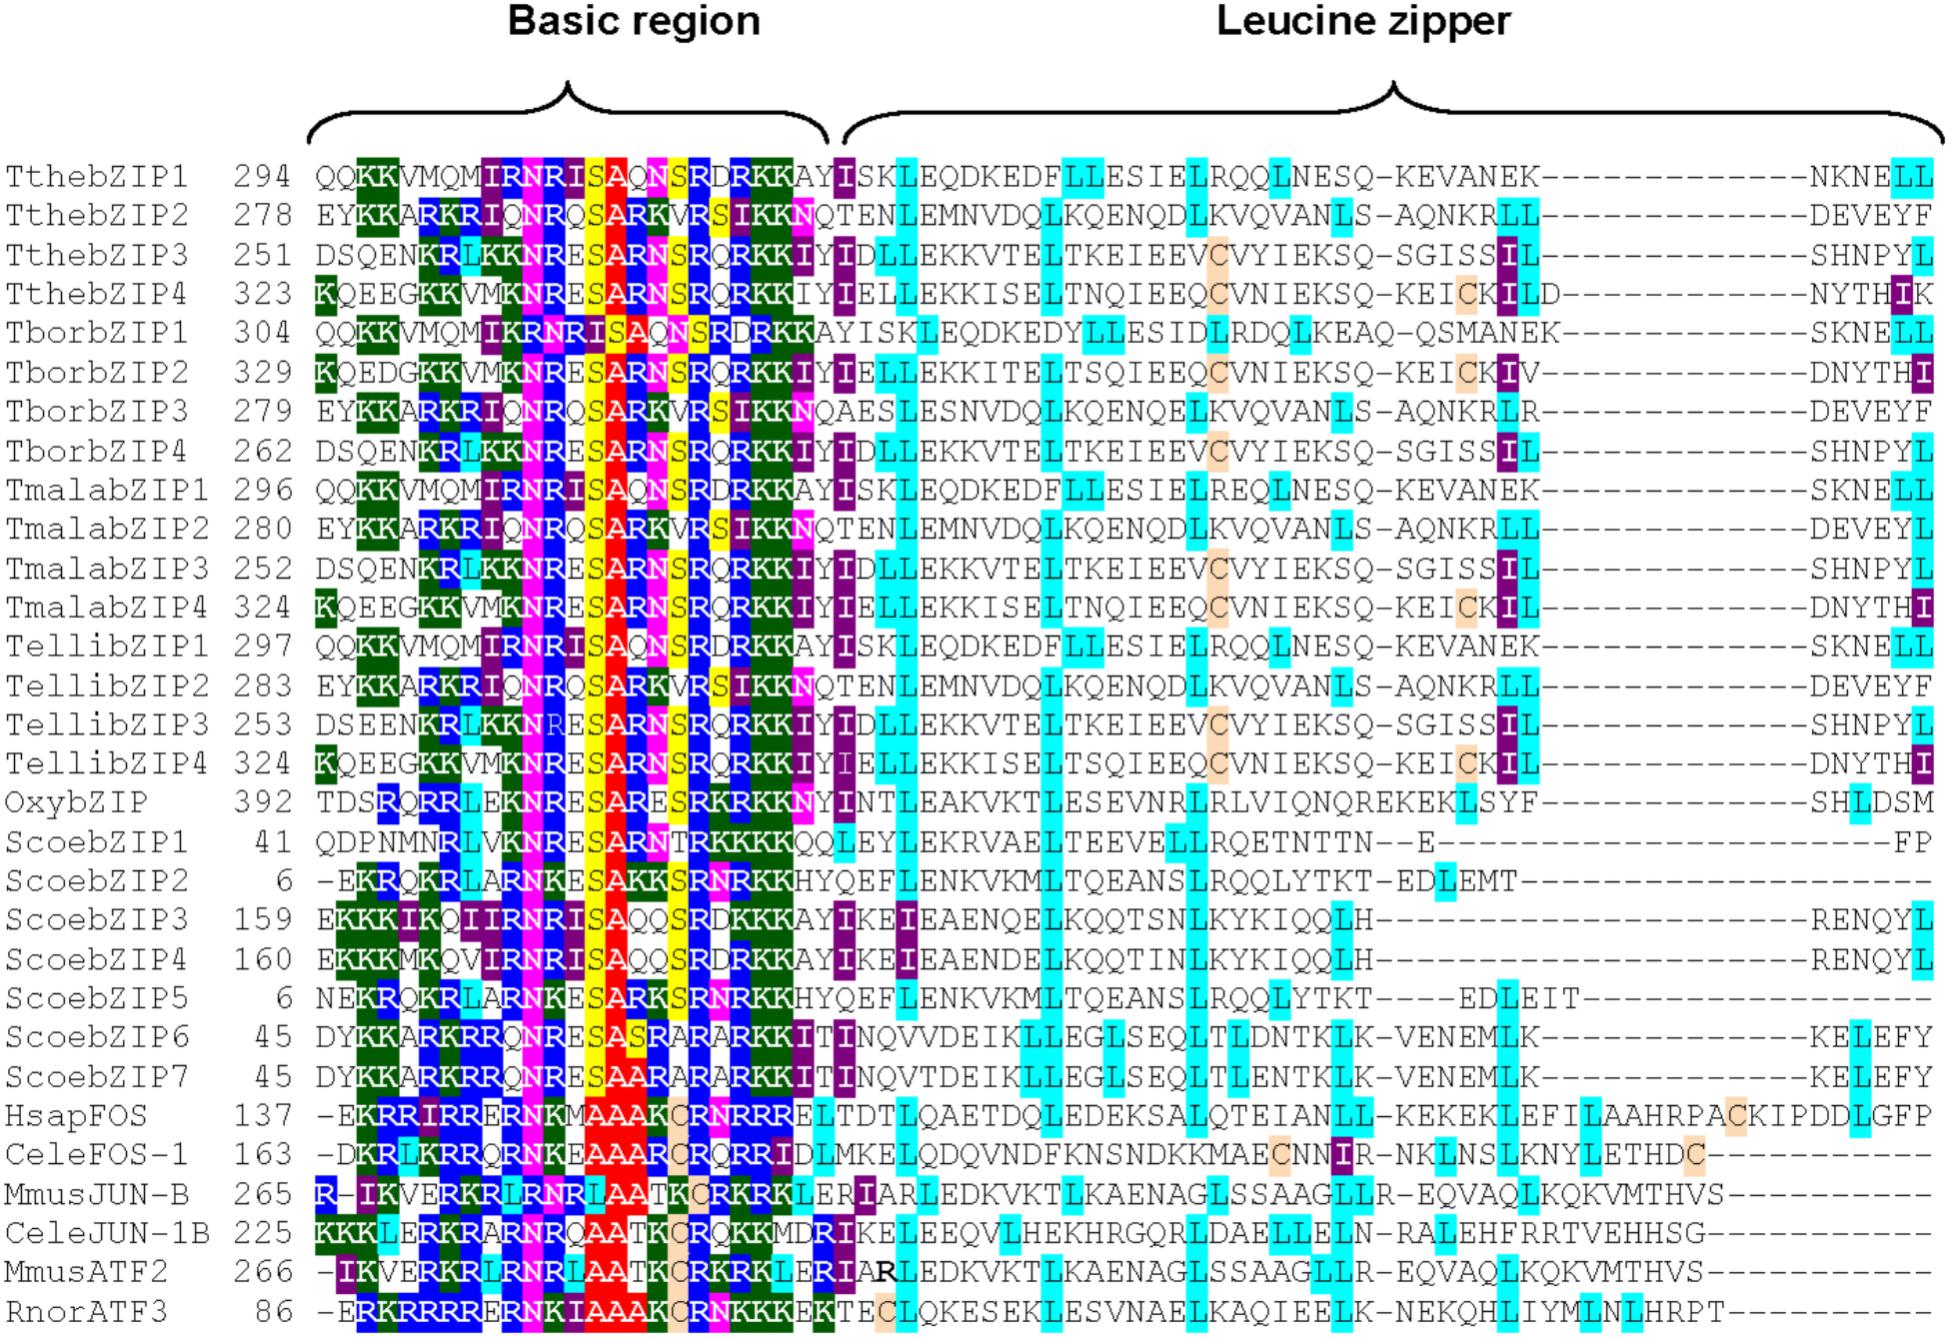
FIGURE 1. Multiple partial alignment of bZIP motif amino acid sequences from four Tetrahymena species and some other model organisms (including two different ciliates). Basic regions and leucine zippers are shown. Conserved residues are marked with different colors: Lys (K) in dark green, Arg (R) in dark blue, Ser (S) in yellow, Asn (N) in fuchsia, Ala (A) in red, Leu (L) in light blue, Ile (I) in violet and Cys (C) in light brown. Tthe, T. thermophila; Tbor, T. borealis; Tmala, T. malaccensis; Telli, T. elliotti; Oxy, Oxytricha sp.; Scoe, Stentor coeruleus; HsapFOS, Homo sapiens FOS; CeleFOS-1, Caenorhabditis elegans FOS-1; MusJUN-1B, Mus musculus JUN-1B; RnorATF3, Rattus norvegicus ATF3. Numbers (on the left) indicate the position of the first amino acid shown in the partial alignment. Access numbers of all these sequences are shown in Supplementary Table S5.
With regard to the leucine zipper region, the majority of Tetrahymena AP-1 TFs have the first three leucine (Leu) repeats strictly distributed in its bZIP motifs, and located every 6 or 7 amino acids (Figure 1). This conserved pattern also appears in almost all model organism sequences: HsapFOS, MmusJUN-B or RnorATF3, and in AP-1 from other ciliates (Figure 1). However, the fourth conserved Leu residue, in the majority of the Tetrahymena AP-1 TFs, do not appear in the expected position, because the region between the 3rd and 4th Leu in the leucine zipper is considerably greater (13 aa). In only one ortholog of the four AP-1 TFs from each Tetrahymena species (indicated in blue in Table 1) there is a Leu residue whose location corresponds to the fourth Leu of the leucine zipper pattern from other organisms (Figure 1). In four other orthologs (bZIP1 in red in Table 1), the 4th Leu residue location matches with the Jun-1B TF from C. elegans (Figure 1). In some Tetrahymena leucine zipper sequences, the Leu residues are substituted by other aliphatic amino acids like valine (Val) or isoleucine (Ile), constituting a more flexible conformation. This fact is also detected in other bZIP motifs, like FOS1 of C. elegans or ATF3 of R. norvegicus (Figure 1). Therefore, the Tetrahymena leucine zipper pattern contains 5–7 Leu residues or 3–5 Leu plus 1–3 Ile residues, being thus richer in isoleucine residues than other leucine zippers (Figure 1).
Independently of having a strict or flexible leucine pattern, COILS program predicts the presence of one or two potential dimerization motifs in all the Tetrahymena AP-1 TF sequences. These motifs are related to the possible formation of coiled-coil structures (Table 2 and Supplementary Figure S1). However, 2ZIP Server program distinguishes between strict or real leucine zippers (only sequences with a strict Leu pattern) and other motifs able to form coiled-coil structures, that allow the dimerization of two proteins but without a strict Leu pattern (Table 2). 2ZIP Server has identified real leucine zippers in the orthologs TthebZIP2, TborbZIP3, TmalabZIP2, TellibZIP2 from different Tetrahymena species, and in HsapFOS, MmusJUN-B or RnorATF3 from other selected bZIP TFs (Table 2).
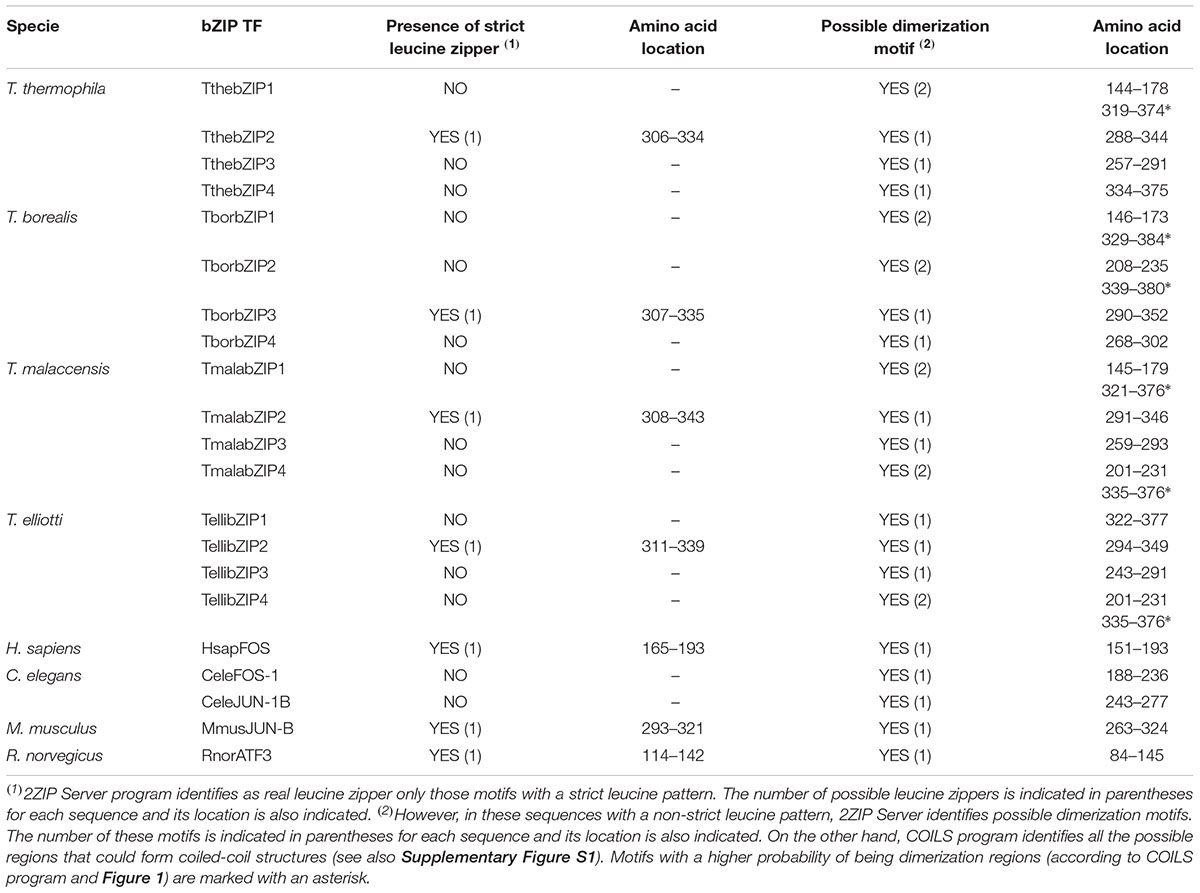
TABLE 2. Identification of real leucine zippers and other motifs related to dimerization processes and coiled-coil structures formation by 2ZIP Server and COILS programs.
According to PSIPRED and Phyre2 programs all in silico analyzed Tetrahymena bZIP TFs have a α-helix located in their putative bZIP motifs. Almost all these proteins have a globular region, including some α-helices. Likewise, Leu residues in leucine zipper are normally disposed in the same rotational positions (data not shown). All T. thermophila bZIP motif α-helix models, obtained from the in silico 3D analysis, present a 99% of average confidence to different templates; TthebZIP1 or TthebZIP2 (∼99.5% to mafB TF from H. sapiens) and TthebZIP3 or TthebZIP4 (∼99.5% to pap1 TF from Schizosaccharomyces pombe).
Prediction of Possible Interactions Between Tetrahymena AP-1: Homo- or Heterodimers Formation
Most probable interactions between coiled-coil regions of different AP-1 TFs were predicted by bZIP coiled-coil scoring form program, to know the probability of each AP-1 TF to form homo- or heterodimers. Scores obtained for all possible bZIP interactions for each Tetrahymena specie AP-1 are shown in Supplementary Table S6. Higher scores indicate the most probable interactions. Negative values are considered as no optimal interactions. Homodimers formation prevails in all the Tetrahymena species for bZIP1, bZIP2, and bZIP3 TFs (Supplementary Table S6). On the other hand, Tetrahymena bZIP4 can form homo- or heterodimers independently of the species analyzed (Supplementary Table S6). Specifically, bZIP4 TFs from T. thermophila, T. elliotti, or T. malaccensis have a higher probability to form heterodimers with their corresponding bZIP3 than homodimers with themselves. However, TborbZIP4 has a higher probability to form homodimers than heterodimers with other TborbZIP TF (Supplementary Table S6). In this way, according to the scores obtained, the following heterodimers could be formed: TthebZIP3/4, TborbZIP2/4, TellibZIP3/4, and TmalabZIP3/4 (Supplementary Table S6). In contrast, some TF don’t seem to have an optimal bZIP motif to interact with other different bZIP motifs, such as: TthebZIP2, TborbZIP3, TellibZIP1, TellibZIP2, and TmalabZIP2, that obtain negative or low scores when they are put together with other bZIP factors (Supplementary Table S6).
Identification of Conserved Motifs in Putative Promoter Regions of T. thermophila AP-1 Genes
To know if the expression of T. thermophila AP-1 genes could be jointly regulated, an in silico analysis of their putative promoter regions was carried out. Three conserved motifs have been identified in 5′UTR regions from all T. thermophila AP-1 genes (Table 3). Probably, these motifs may be involved in the gene expression regulation of these AP-1 genes, with the following consensus sequences: GCT(N)3CT for motif 1, G(S)2TT(B)2C for motif 2 and (H)2C(R)A(V)T(N)4C(N)5A(N)3T(N)3A(M)2A for motif 3 (letters other than C,G,A or T follow the IUPAC nucleotide code).
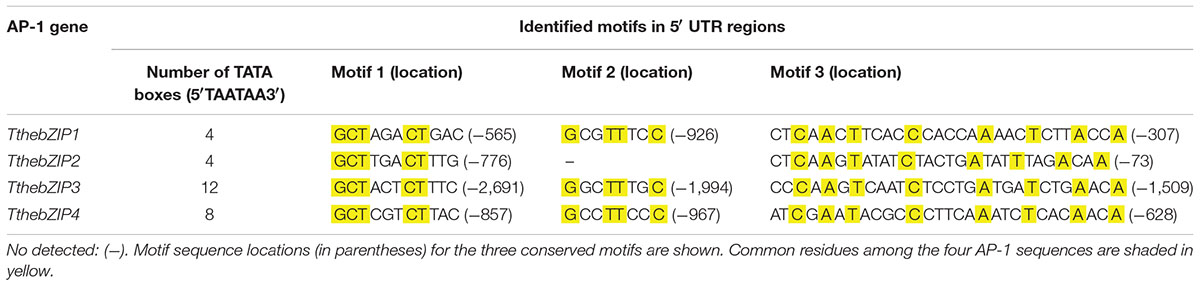
TABLE 3. Conserved motifs located in putative promoter regions of the four T. thermophila AP-1 genes.
One copy of each motif has been located in each AP-1 gene promoter, excepting for the motif 2 that is not present in the TthebZIP2 gene (Table 3). Motif 2 has the highest percentage of conserved residues (50%) among the four AP-1 sequences, followed by motif 1 (45%) and, finally, by motif 3 (28%). In all AP-1 genes, motif 3 is the nearest located to the beginning of the ORF (Table 3). Likewise, motif 3 is the longest (29 bp) in comparison to the other two motifs with 11 (motif 1) and 8 bp (motif 2).
Comparative Analysis of T. thermophila AP-1 Gene Expression Induction Under Different Metal Stress Treatments
The relative gene expression induction levels (calculated by qRT-PCR) for the four AP-1 genes from T. thermophila, after 1 or 24 h treatments with three different heavy metals (Cd2+, Cu2+, or Pb2+), have been analyzed and compared. This analysis has been performed with different strains of this Tetrahymena species (see Experimental section) and results are shown in Figures 2–5 and Supplementary Table S7.
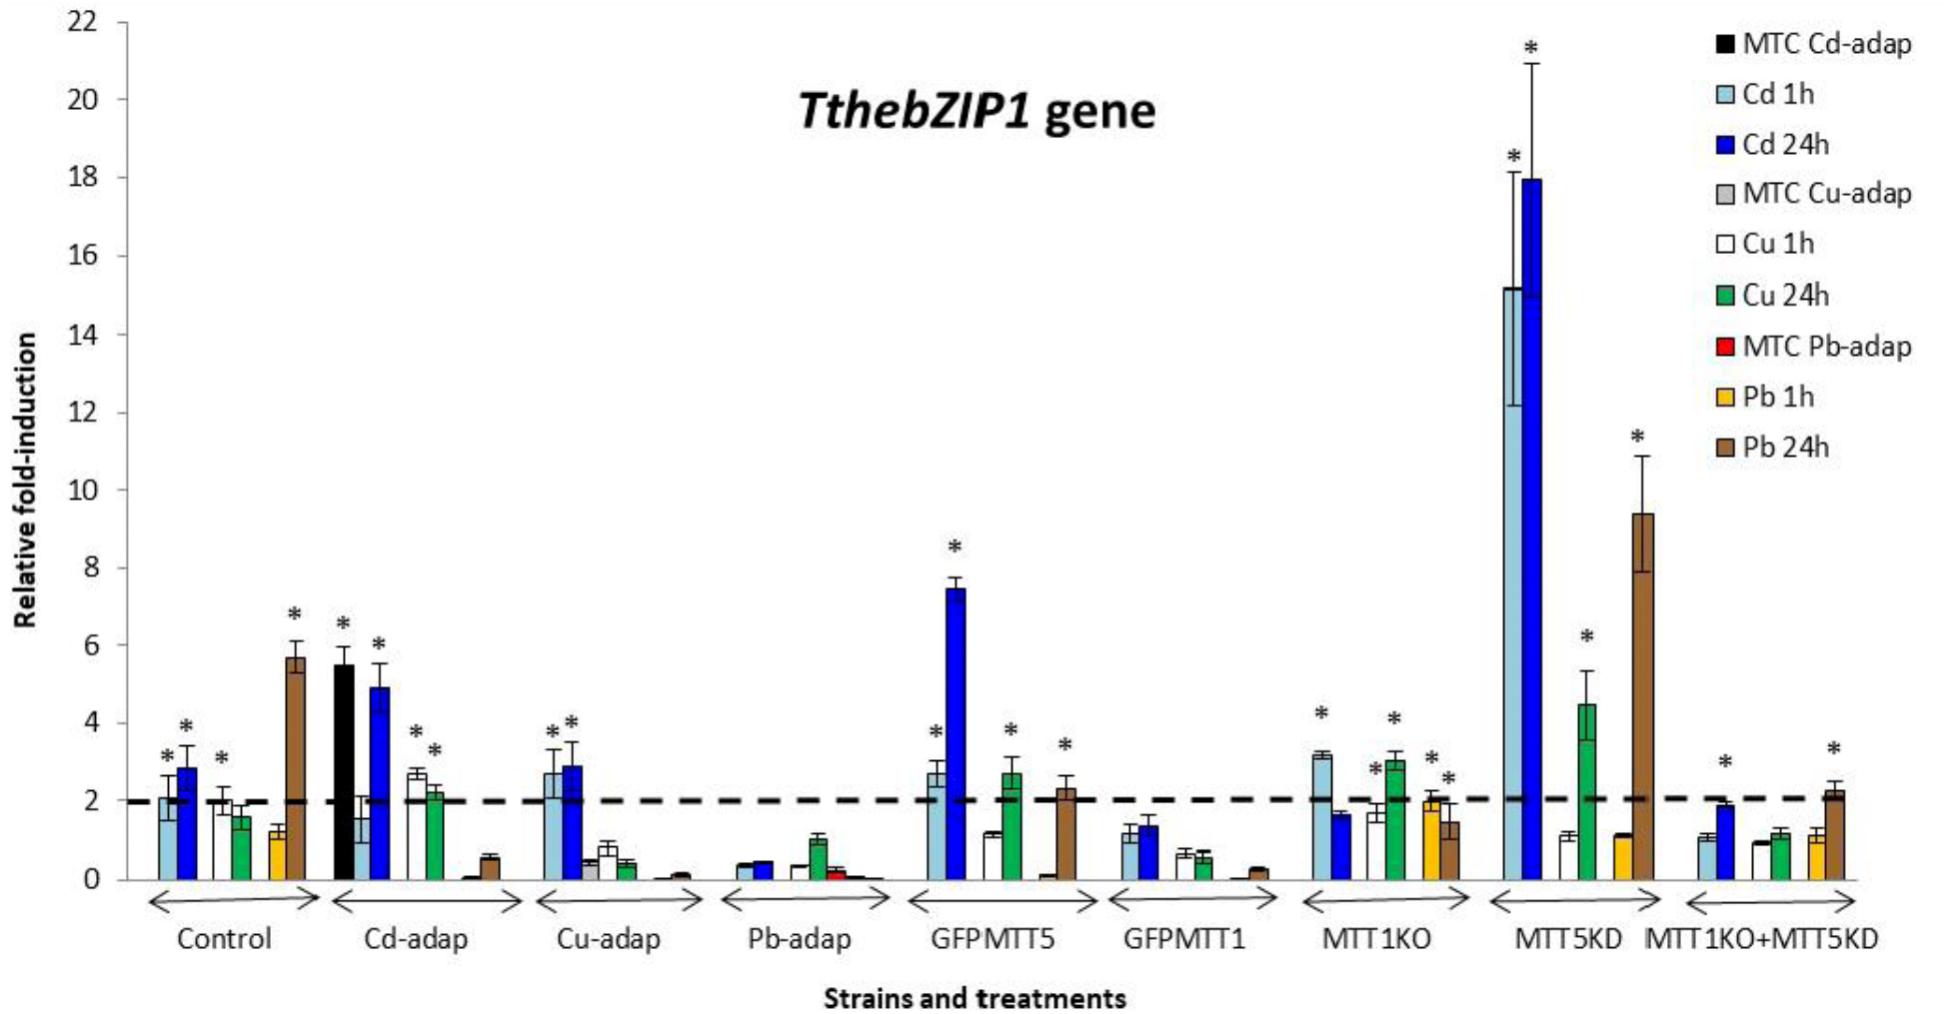
FIGURE 2. TthebZIP1 gene induction levels after Cd2+, Cu2+, or Pb2+ treatments (1 or 24 h) from different Tetrahymena thermophila strains. MTC, maximum tolerated concentrations by metal-adapted strains: 115 μM Cd2+, 4 mM Cu2+, and 5.5 mM Pb2+. Each histogram bar represents an average value ± standard deviation (see Supplementary Table S7) from two or three independent experiments. Relative induction values are represented in a logarithmic scale. Asterisks indicate significant differences from the control with p < 0.05.
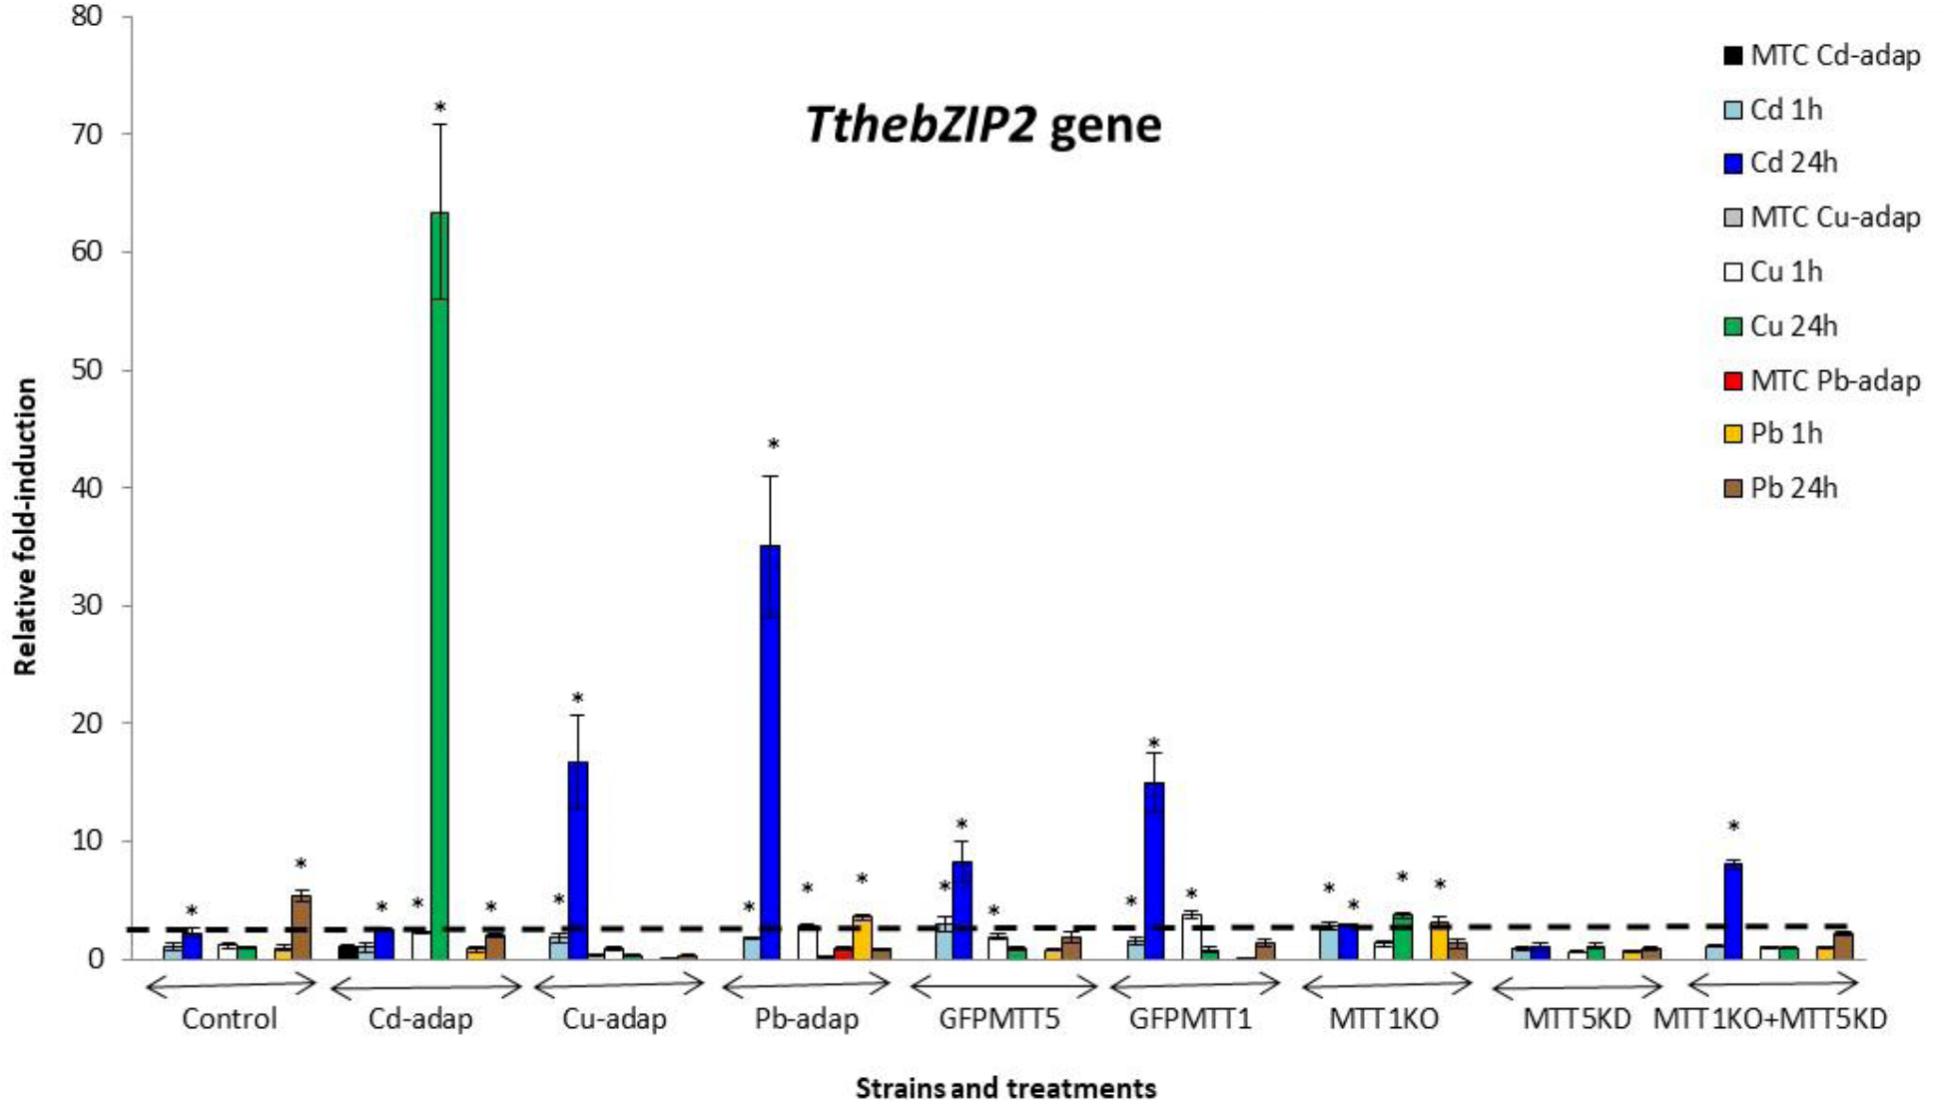
FIGURE 3. TthebZIP2 gene induction levels after Cd2+, Cu2+, or Pb2+ treatments (1 or 24 h) among different T. thermophila strains. MTC, maximum tolerated concentrations by metal-adapted strains: 115 μM Cd2+, 4 mM Cu2+, and 5.5 mM Pb2+. Each histogram bar represents an average value ± standard deviation (see Supplementary Table S7) from two or three independent experiments. Relative induction values are represented in a logarithmic scale. Asterisks indicate significant differences from the control with p < 0.05.
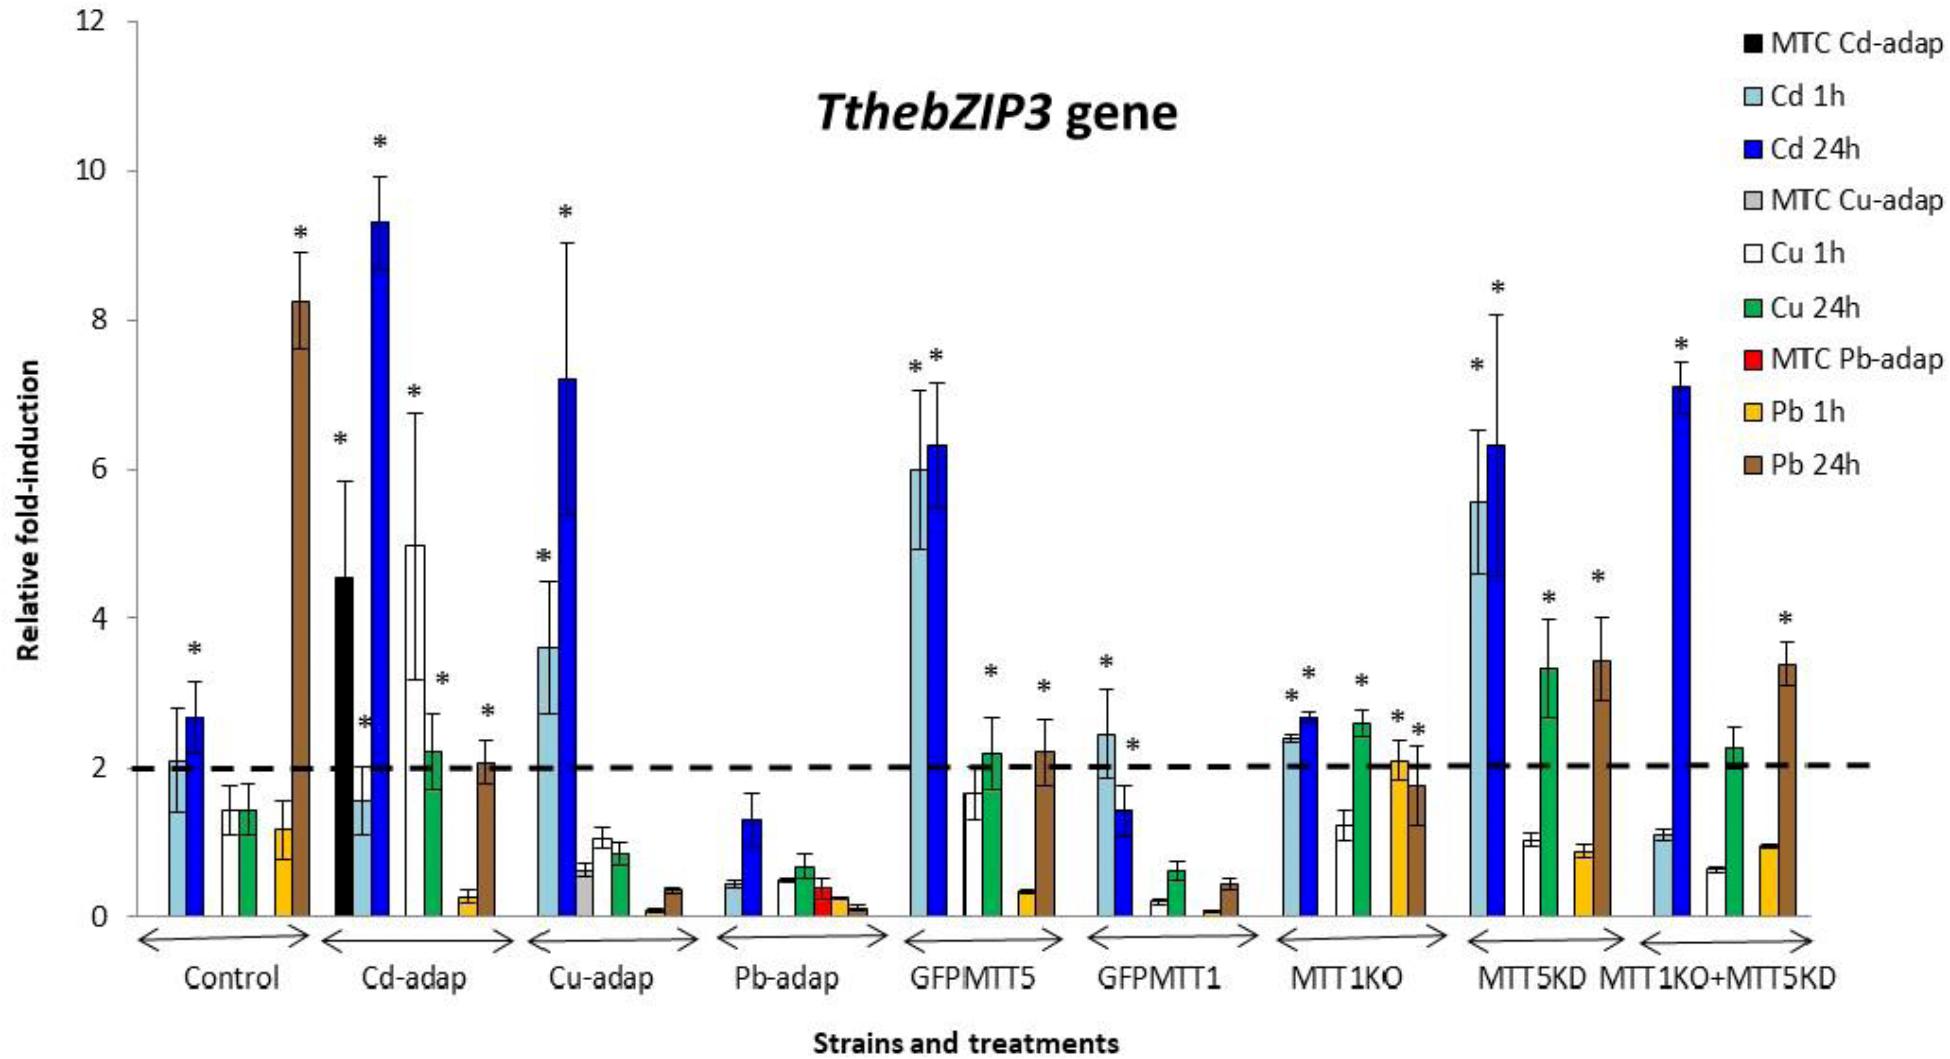
FIGURE 4. TthebZIP3 gene induction levels after Cd2+, Cu2+, or Pb2+ treatments (1 or 24 h) among different T. thermophila strains. MTC, maximum tolerated concentrations by metal-adapted strains: 115 μM Cd2+, 4 mM Cu2+, and 5.5 mM Pb2+. Each histogram bar represents an average value ± standard deviation (see Supplementary Table S7) from two or three independent experiments. Relative induction values are represented in a logarithmic scale. Asterisks indicate significant differences from the control with p < 0.05.
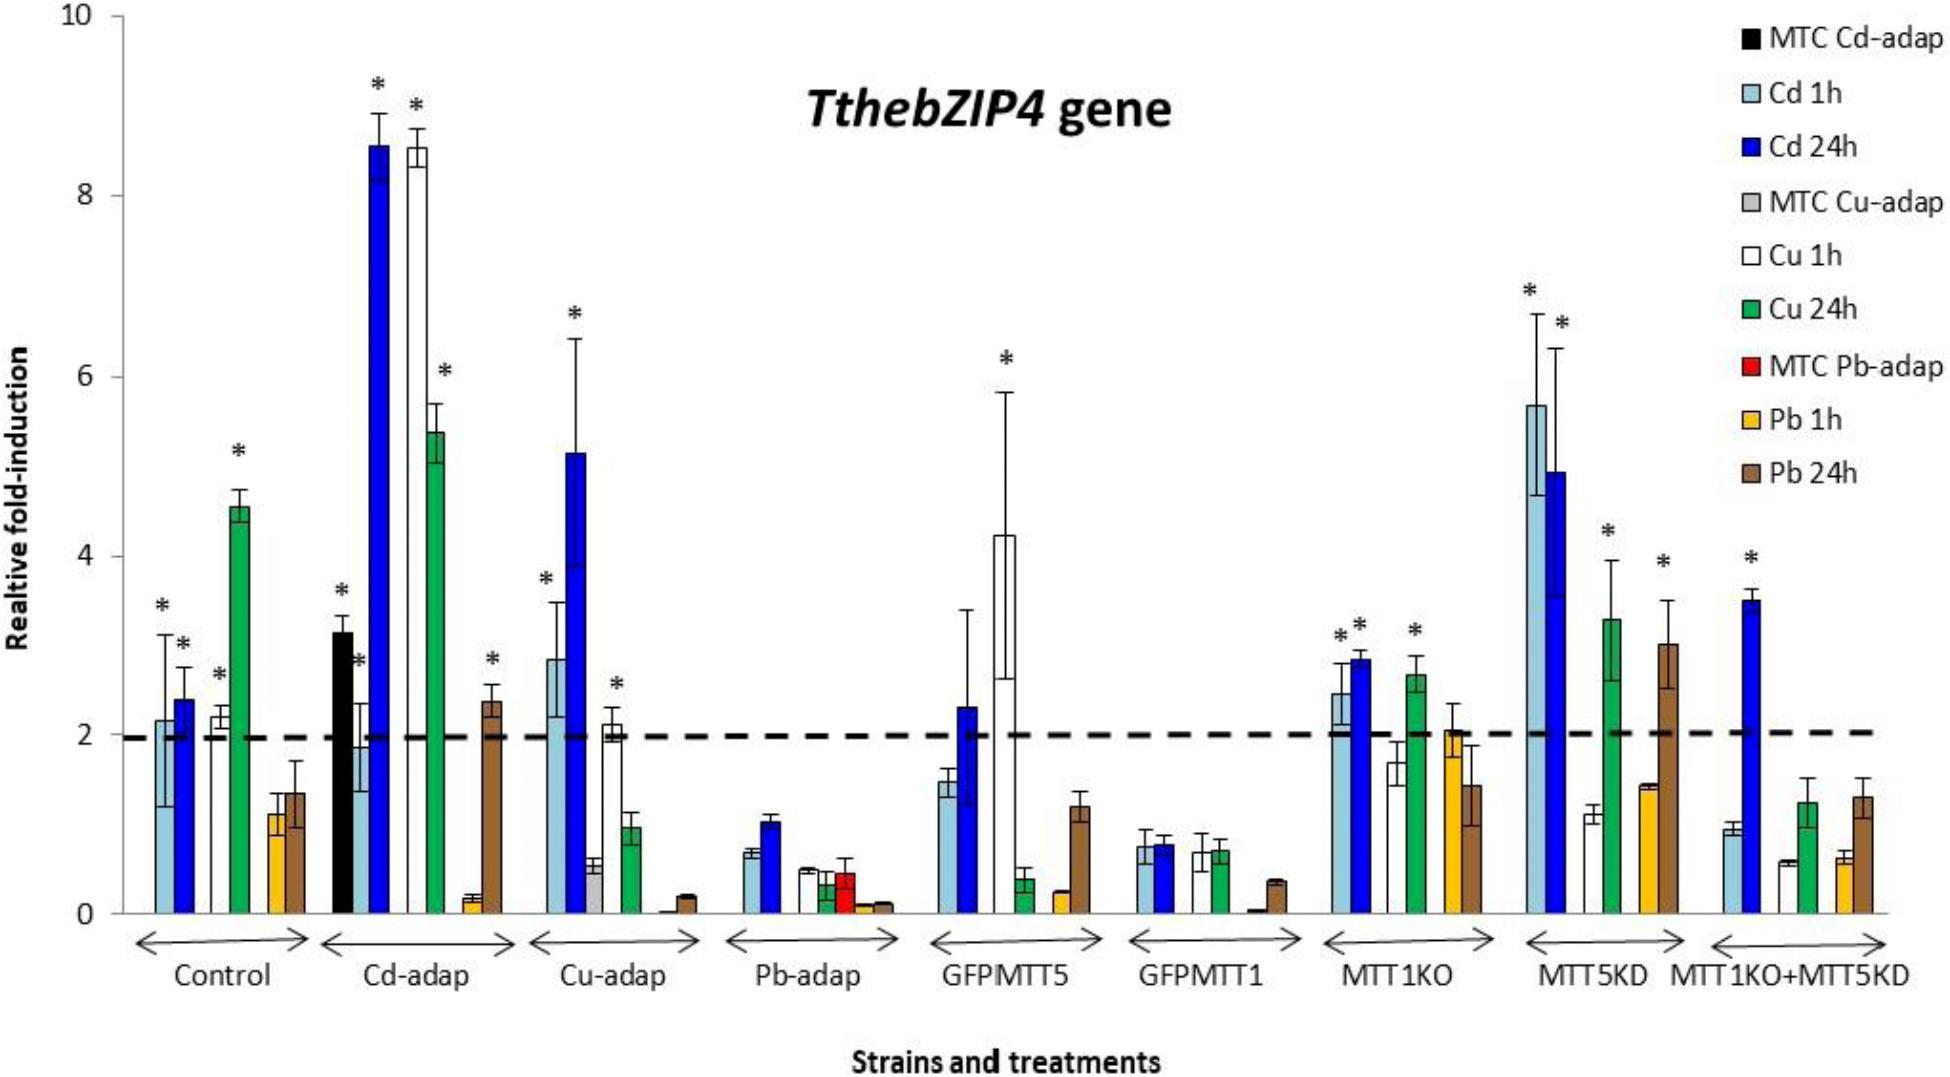
FIGURE 5. TthebZIP4 gene induction levels after Cd2+, Cu2+, or Pb2+ treatments (1 or 24 h) among different T. thermophila strains. MTC, maximum tolerated concentrations by metal-adapted strains: 115 μM Cd2+, 4 mM Cu2+, and 5.5 mM Pb2+. Each histogram bar represents an average value ± standard deviation (see Supplementary Table S7) from two or three independent experiments. Relative induction values are represented in a logarithmic scale. Asterisks indicate significant differences from the control with p < 0.05.
TthebZIP1 gene is mainly induced under Cd2+ treatments and, in general, higher induction levels are detected after 24 h exposures (Figure 2). Specifically, the highest induction values were observed for MTT5KD, GFPMTT5, and Cd-adap strains. On the other hand, this gene is also induced under 24 h Pb2+ treatments (mainly, in control and MTT5KD strains) or, even, under 24 h Cu2+ treatments (in GFPMTT5, MTT1KO, and MTT5KD strains) but in this case a lower expression level is detected. Therefore, the induction ranking for TthebZIP1 gene is: Cd > Pb > Cu (Figure 2 and Supplementary Table S7).
In general, TthebZIP2 is the T. thermophila AP-1 gene that achieves the highest induction level values (Figure 3). Just like TthebZIP1, higher induction values are observed after 24 h treatments. It is enormously highlighted the high induction value obtained under 24 h Cu2+ treatments in the Cd-adap strain. On the contrary, this gene is mainly induced under 24 h Cd2+ treatments in Cu-adap, Pb-adap, GFPMTT5, GFPMTT1, and MTT1KO+MTT5KD strains or even after 24 h Pb2+ exposures in the SB1969 control strain, although this value is considerably lower (Figure 3). TthebZIP3 (Figure 4) and TthebZIP4 (Figure 5) genes present, in general, lower induction levels (<10×) than the other two AP-1 genes previously analyzed. TthebZIP3 is mainly induced after Cd2+ (1 or 24 h) treatments in Cd-adap, Cu-adap, GFPMTT5, MTT5KD, and MTT1KO+MTT5KD strains and after 24 h Pb2+ exposures in control, MTT5KD, MTT1KO+MTT5KD strains (Figure 4 and Supplementary Table S7). Likewise, certain induction levels are detected after Cu2+ treatments in the case of Cd-adap (1 h) and MTT5KD (24 h). TthebZIP4 has a similar induction pattern to TthebZIP3 under Cd2+ exposures, but it is also considerably induced under Cu2+ treatments (1 or 24 h) in Cd-adap, GFPMTT5, MTT5KD and control strains (Figure 5 and Supplementary Table S7).
In Supplementary Figure S2, a comparative analysis of the different AP-1 gene expression patterns obtained from each analyzed T. thermophila strain and under different metal exposures (including basal expression levels and induction values > 2) is showed. TthebZIP2 gene expression normally appears in the first positions in almost all analyzed strains, independently of the metal treatment. However, a clear exception is detected in MTT5KD strain, where none metal treatment obtains significant induction values for TthebZIP2 gene (Supplementary Figure S2). On the contrary, TthebZIP1 gene occupies the first position of the ranking in this knockdown strain for all metal treatments: bZIP1 ≥ bZIP3 ≥ bZIP4 (Supplementary Figure S2). On the other hand, TthebZIP4 gene expression is normally located in the last positions of the ranking after Cd2+ or Pb2+ exposures, but it holds the first or second position under Cu2+ treatments (Supplementary Figure S2). In Cu or Pb-adap strains, only one AP-1 gene is significantly induced in response to a Cu2+ or Pb2+ exposure, and TthebZIP2 and TthebZIP4 genes are involved in this “unique response” situation. Finally, TthebZIP1 and TthebZIP3 genes present a less-defined location into the different induction patterns, presenting a higher variability. However, TthebZIP3 achieves the highest induction values under lead treatments, reaching the first positions of the ranking in some Tetrahymena strains, while it occupies more remote positions under copper exposures (Supplementary Figure S2).
By way of summary, we can also analyze separately each Tetrahymena strain and compare its AP-1 gene induction values among them:
1. SB1969 control strain shows similar induction patterns for TthebZIP1, TthebZIP2, and TthebZIP3 genes, which mainly respond to Pb2+ and Cd2+ (24 h treatments) (Figures 2–5). TthebZIP4 has a very different pattern and it is mainly induced by Cu2+ and Cd2+ (24 h treatments) (Figure 5).
2. TthebZIP2 is the highest induced AP-1 gene in Cd-adap strain in response to Cu2+ (24 h) (Figure 3). TthebZIP3 and TthebZIP4 have a very similar induction pattern, responding mainly to Cd2+ (24 h) and Cu2+ (1 h) (Figures 4, 5). TthebZIP1in this strain is mainly expressed under Cd2+ (24 h) (Figure 2).
3. Likewise, TthebZIP2 genes stands out in Cu-adap strain and it shows the highest induction values under 24 h Cd2+ treatment (Figure 3). The other three AP-1 genes show lower induction values and similar patterns among them, being also the highest induction values under 24 h Cd2+ treatments (Figures 2–5).
4. TthebZIP2 gene is the only one that shows significant induction values in Pb-adap strain. It achieves the highest induction values under 24 h Cd2+ treatment (Figure 3).
5. In GFPMTT5 strain, TthebZIP1, TthebZIP2, and TthebZIP3 genes present similar induction patterns, and the highest induction values are obtained under 24 h Cd2+ treatments (Figures 2–5). On the other hand, TthebZIP4 gene has a very different pattern and it is mainly expressed after 1 h Cu2+ treatment (Figure 5).
6. GFPMTT1 strain has a similar AP-1 gene expression pattern to Pb-adap strain as TthebZIP2 is the only one that responds to metal-treatments; this gene is mainly induced after 24 h Cd2+ exposure (Figure 3).
7. Finally, regarding KO and/or KD strains, MTT5KD is the strain that shows the highest AP-1 gene induction levels: TthebZIP1 is mainly induced under Cd2+(1 or 24 h), Cu2+or Pb2+ (24 h treatments) (Figure 2), TthebZIP3 and TthebZIP4 genes have similar patterns and they achieve the highest induction values after Cd2+ treatments (Figures 4, 5) and TthebZIP2 doesn’t show significant induction values for any metal treatment. On the other hand, TthebZIP2 and TthebZIP3 are the AP-1 genes that better responds in MTT1KO+MTT5KD strain under Cd2+ (24 h) exposures (Figures 3, 4). Finally, low induction values have been detected for every AP-1 gene in the MTT1KO strain (Figures 2–5).
T. thermophila AP-1 Gene Basal Expression Levels: A Comparative Analysis
Ct values obtained by qRT-PCR under control conditions (no metal treatments) (Supplementary Table S8) have been compared among the four AP-1 genes in each Tetrahymena strain (Table 4 and Supplementary Figure S2) and among the different strains for each AP-1 gene (Table 5). In all analyzed strains, TthebZIP4 gene shows the highest basal expression levels whereas TthebZIP3 exhibits the lowest values (Supplementary Figure S2). Therefore, the consensus AP-1 gene basal expression pattern for almost all analyzed T. thermophila strains is: bZIP4 > bZIP1 > bZIP2 > bZIP3 (Supplementary Figure S2). The highest differences between TthebZIP4 and TthebZIP3 basal expression levels are detected in GFPMTT5 (∼ 32×) and SB1969 control (∼ 27×) strains (Table 4). On the other hand, TthebZIP1 and TthebZIP2 genes show quite similar basal expression levels in the majority of the T. thermophila strains, excepting for MTT5KD strain, in which TthebZIP2 expression level is ∼5× higher than TthebZIP1 gene (Table 4). TthebZIP1 and TthebZIP2 gene basal expression levels are usually higher than those showed by TthebZIP3 gene, regardless of the considered strain (Table 4 and Supplementary Figure S2).
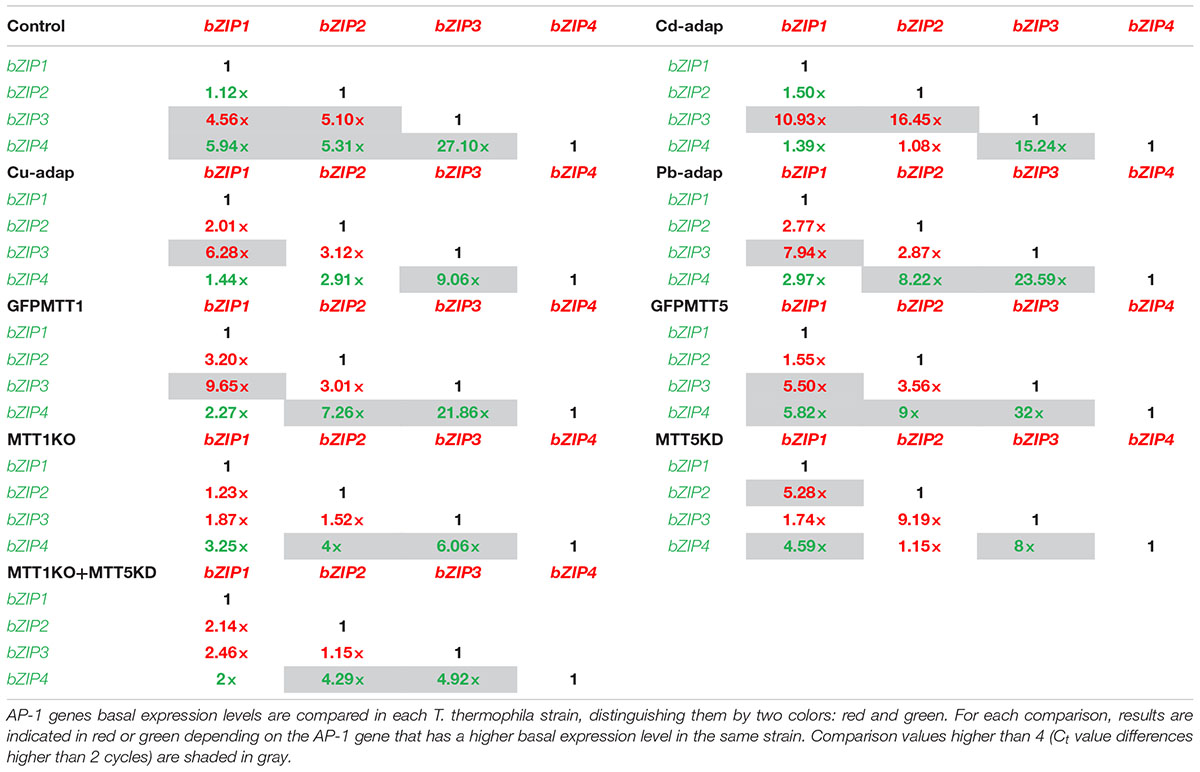
TABLE 4. Comparison of basal expression levels among the four AP-1 genes in each analyzed T. thermophila strain.
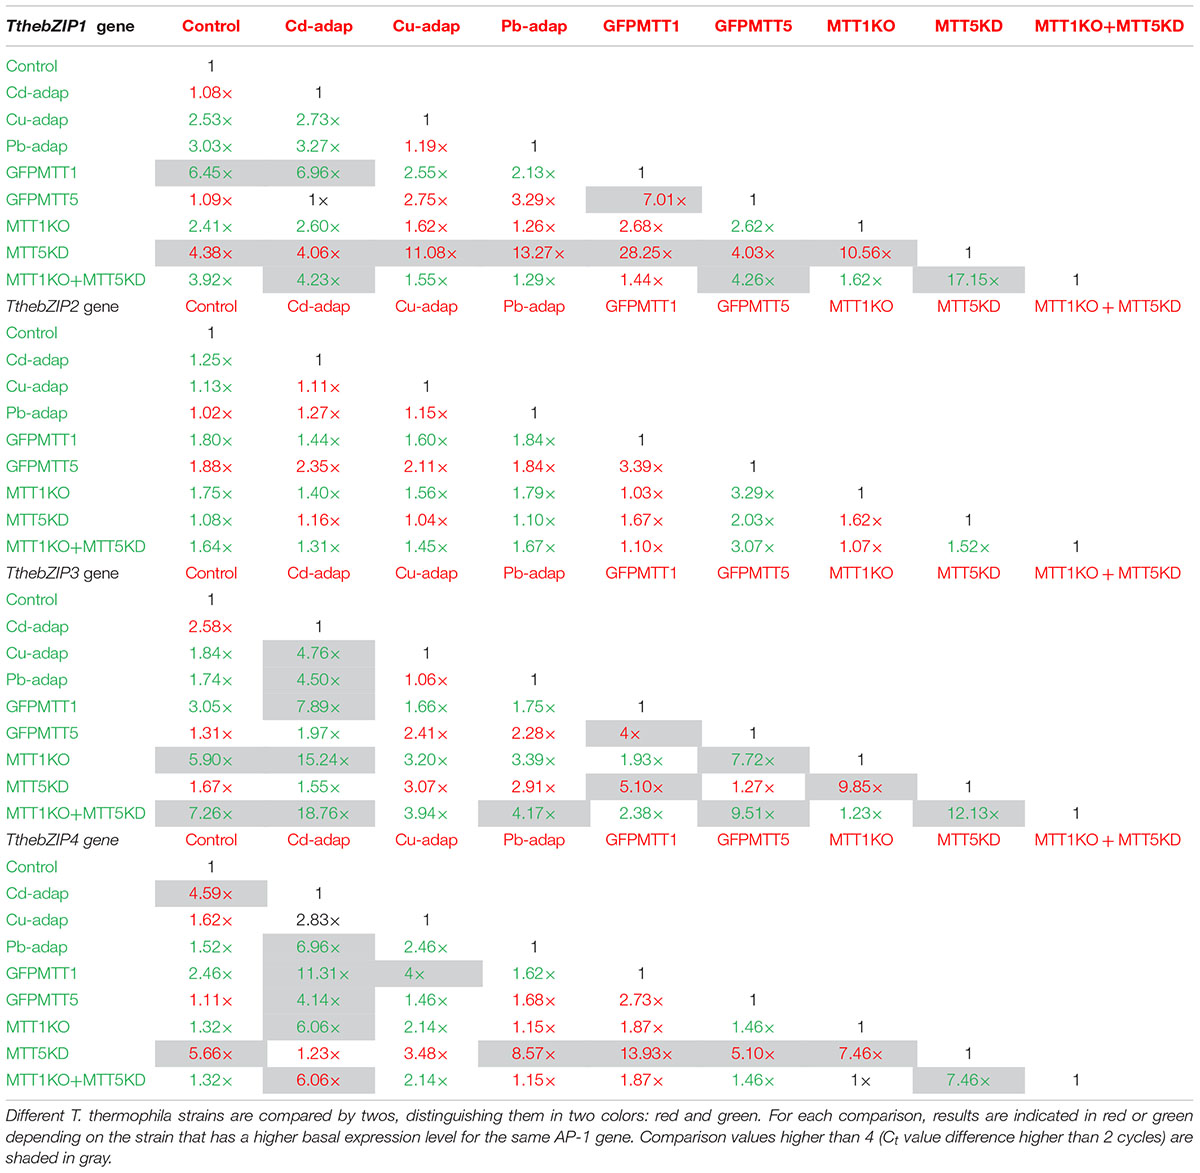
TABLE 5. Comparison of basal expression levels for each AP-1 gene among different T. thermophila strains.
The comparison of basal expression levels for each AP-1 gene between the control (SB1969) and the other strains (Table 5), reveals that, in general, TthebZIP2 levels are not significantly increased in none of the analyzed strains. TthebZIP1 basal expression levels are increased in GFPMTT1 (∼6.5×) and TthebZIP3 shows higher basal expression levels in MTT1KO (∼6×) and MTT1KO+MTT5KD (∼7×) than control strain (Table 5). Comparing AP-1 basal expression levels among all the analyzed strains, we detect that GFPMTT1 strain is the one that has the highest basal expression levels for TthebZIP1, TthebZIP2, and TthebZIP4 genes. Likewise, TthebZIP3 is considerably expressed in MTT1KO and MTT1KO+MTT5KD strains (Supplementary Table S8). In contrast, the lowest basal expression levels are detected in the following strains: MTT5KD (TthebZIP1 and TthebZIP3), GFPMTT5 (TthebZIP3) and Cd-adap (TthebZIP3) (Supplementary Table S8).
Summarizing, TthebZIP1 gene presents the highest basal expression levels in GFPMTT1 and MTT1KO+MTT5KD strains and its lowest levels in MTT5KD (Supplementary Table S8). TthebZIP2 shows very similar basal expression levels in all the analyzed strains. The highest TthebZIP3 basal expression levels are detected in MTT1KO+MTT5KD, MTT1KO and GFPMTT1 strains, while its lowest levels are seen in Cd-adap, GFPMTT5 and MTT5KD strains (Supplementary Table S8). Finally, the highest basal expression levels in TthebZIP4 gene are detected in GFPMTT1, MTT1KO, MTT1KO+MTT5KD, and Pb-adap strains and its lowest levels were in Cd-adap and MTT5KD strains (Supplementary Table S8).
Analysis of Nuclear Protein-MTCM1 Motif Interactions
To find out if there are nuclear proteins that can be attached to the MTCM1 motif, several EMSA tests were carried out. The digoxigenin-labeled MTCM1 oligonucleotide was incubated at room temperature during 30 min under increasing concentrations of T. thermophila macronuclear protein extracts and different reaction conditions (Supplementary Figure S3). As an unspecific competitor, the poly(dI-dC) oligonucleotide was added to the reaction. Results have shown that two different majority protein bands are present (Supplementary Figure S3A), indicating that, at least, several putative nuclear proteins can bind to this DNA motif. The band intensity and, therefore the amount of DNA-protein complex formed, was higher as the concentration of the nuclear extract increased (Supplementary Figure S3A). In addition, after using nuclear extracts from T. thermophila Cd-treated cultures (0.9 mM, in Tris-HCl buffer), during 2 h (Supplementary Figure S3B), bands with a higher intensity, with regard to samples exposed during 30 min, are detected (Supplementary Figure S3B). Which indicates that after a longer Cd-treatment a larger amount of DNA-bound protein is present. The specificity of DNA-binding protein was evidenced by the addition of non-digoxigenin-labeled DNA (specific competitor at 50×, 100×, or 200× concentration), which significantly reduced the labeled DNA-protein complex formation (Supplementary Figure S3B). The addition of Zn2+ does not increase the formation of the DNA-protein complex, so it seems that the proteins binding to the MTCM1 motif are not Zn finger proteins. Both negative controls (Supplementary Figure S3) reveal that the MTCM1 motif-binding protein is exclusively from T. thermophila.
Using the Southwestern blotting technique we tried to get to know the molecular weight of the proteins that bind to the MTCM1 motif. The Supplementary Figure S4 shows that, at least, three different bands are detected, indicating that the digoxigenin-labeled MTCM1 oligonucleotide can interact with, at least, three different proteins present in the T. thermophila nuclear extract. Their estimated molecular weights are in the range; 30–57, 57–93, and 93–116 KDa, respectively (Supplementary Figure S4). The inferred molecular weights of the putative T. thermophila AP-1 proteins (Table 1); TthebZIP1 (66.9 KDa), TthebZIP2 (59.3 KDa), TthebZIP3 and TthebZIP4 (∼84 KDa), are in or near of any of these ranges. No bands are detected in the negative control (Supplementary Figure S4, lane C), thus discarding the possibility that the detected bands (lanes 1 and 2 in Supplementary Figure S4) are due to an unspecific binding of the MTCM1 oligonucleotide to any protein.
After verifying that one or more proteins from the T. thermophila nuclear extract interact with the MTCM1 motif, we have tried to purify some of these proteins. The eluted fractions, containing presumably the proteins retained by the MTCM1 oligonucleotide, were analyzed by SDS-PAGE. Several bands with molecular weights within the range 40–85 KDa were detected (data not shown). Unfortunately, the amounts obtained of these proteins (only detected after silver staining) were not sufficient for their identification.
Discussion
Identification and Characterization of Four AP-1 Genes in Tetrahymena Species: Existence of a High and Significant Numerical and Structural Conservation
After examining the sequenced macronuclear genomes of four Tetrahymena species (T. thermophila, T. borealis, T. elliotti, and T. malaccensis), we have found four putative bZIP transcription factors in each species. Each of the four bZIP genes has its corresponding counterpart in the other three Tetrahymena species (Table 1). TthebZIP1 is very similar to TmalabZIP1 (95%), TellibZIP1 (88%), and TborbZIP1 (71%) (Supplementary Table S9). TthebZIP2 shares high identity percentages with TmalabZIP2 (82%), TellibZIP2 (75%), and TborbZIP3 (58%). TthebZIP3 is very similar to TmalabZIP3 (94%), TellibZIP3 (89%), and TborbZIP4 (80%), and TthebZIP4 shares high identity percentages with TmalabZIP4 (95%), TellibZIP4 (89%), and TborbZIP2 (79%) (Supplementary Table S9). Something similar happens between yeast species, such as; S. cerevisiae and Kluyveromyces lactis, which have AP-1 ortholog genes with a high similarity (Billard et al., 1997).
These high identity percentages are also reflected in the phylogenetic tree showed in Figure 6. All Tetrahymena bZIP protein sequences are divided into two large groups, each of which is subdivided into two groups that include one of the each homologous bZIP protein. Although the four Tetrahymena species belong to Borealis group (Chantangsi and Lynn, 2008), T. thermophila and T. malaccensis (both included in RSA1 riboset) are the nearest from a phylogenetic point of view, and, likewise, their AP-1 transcription factors are those with the highest identity percentages. On the other hand, T. borealis (RSA2 riboset) (Chantangsi and Lynn, 2008) is the furthest specie from a phylogenetic point of view and its AP-1 transcription factors show, in general, the lowest identity percentages comparing to the others. In addition, conservation among Tetrahymena bZIP transcription factors is not only numerical (four AP-1 genes in each Tetrahymena species) but also structural, as the four AP-1 TFs that form each group share very similar structural features, such as: the length of their amino acid sequences, the number of exons and introns in their corresponding genes (Table 1) or the location of their dimerization motifs (Table 2). In fact, these four groups are grouped into two major groups in the phylogenetic tree (Figure 6), depending on the size range of their bZIP proteins; one group formed by larger (726–746 aa) and another group formed by smaller bZIP proteins (501–595 aa).
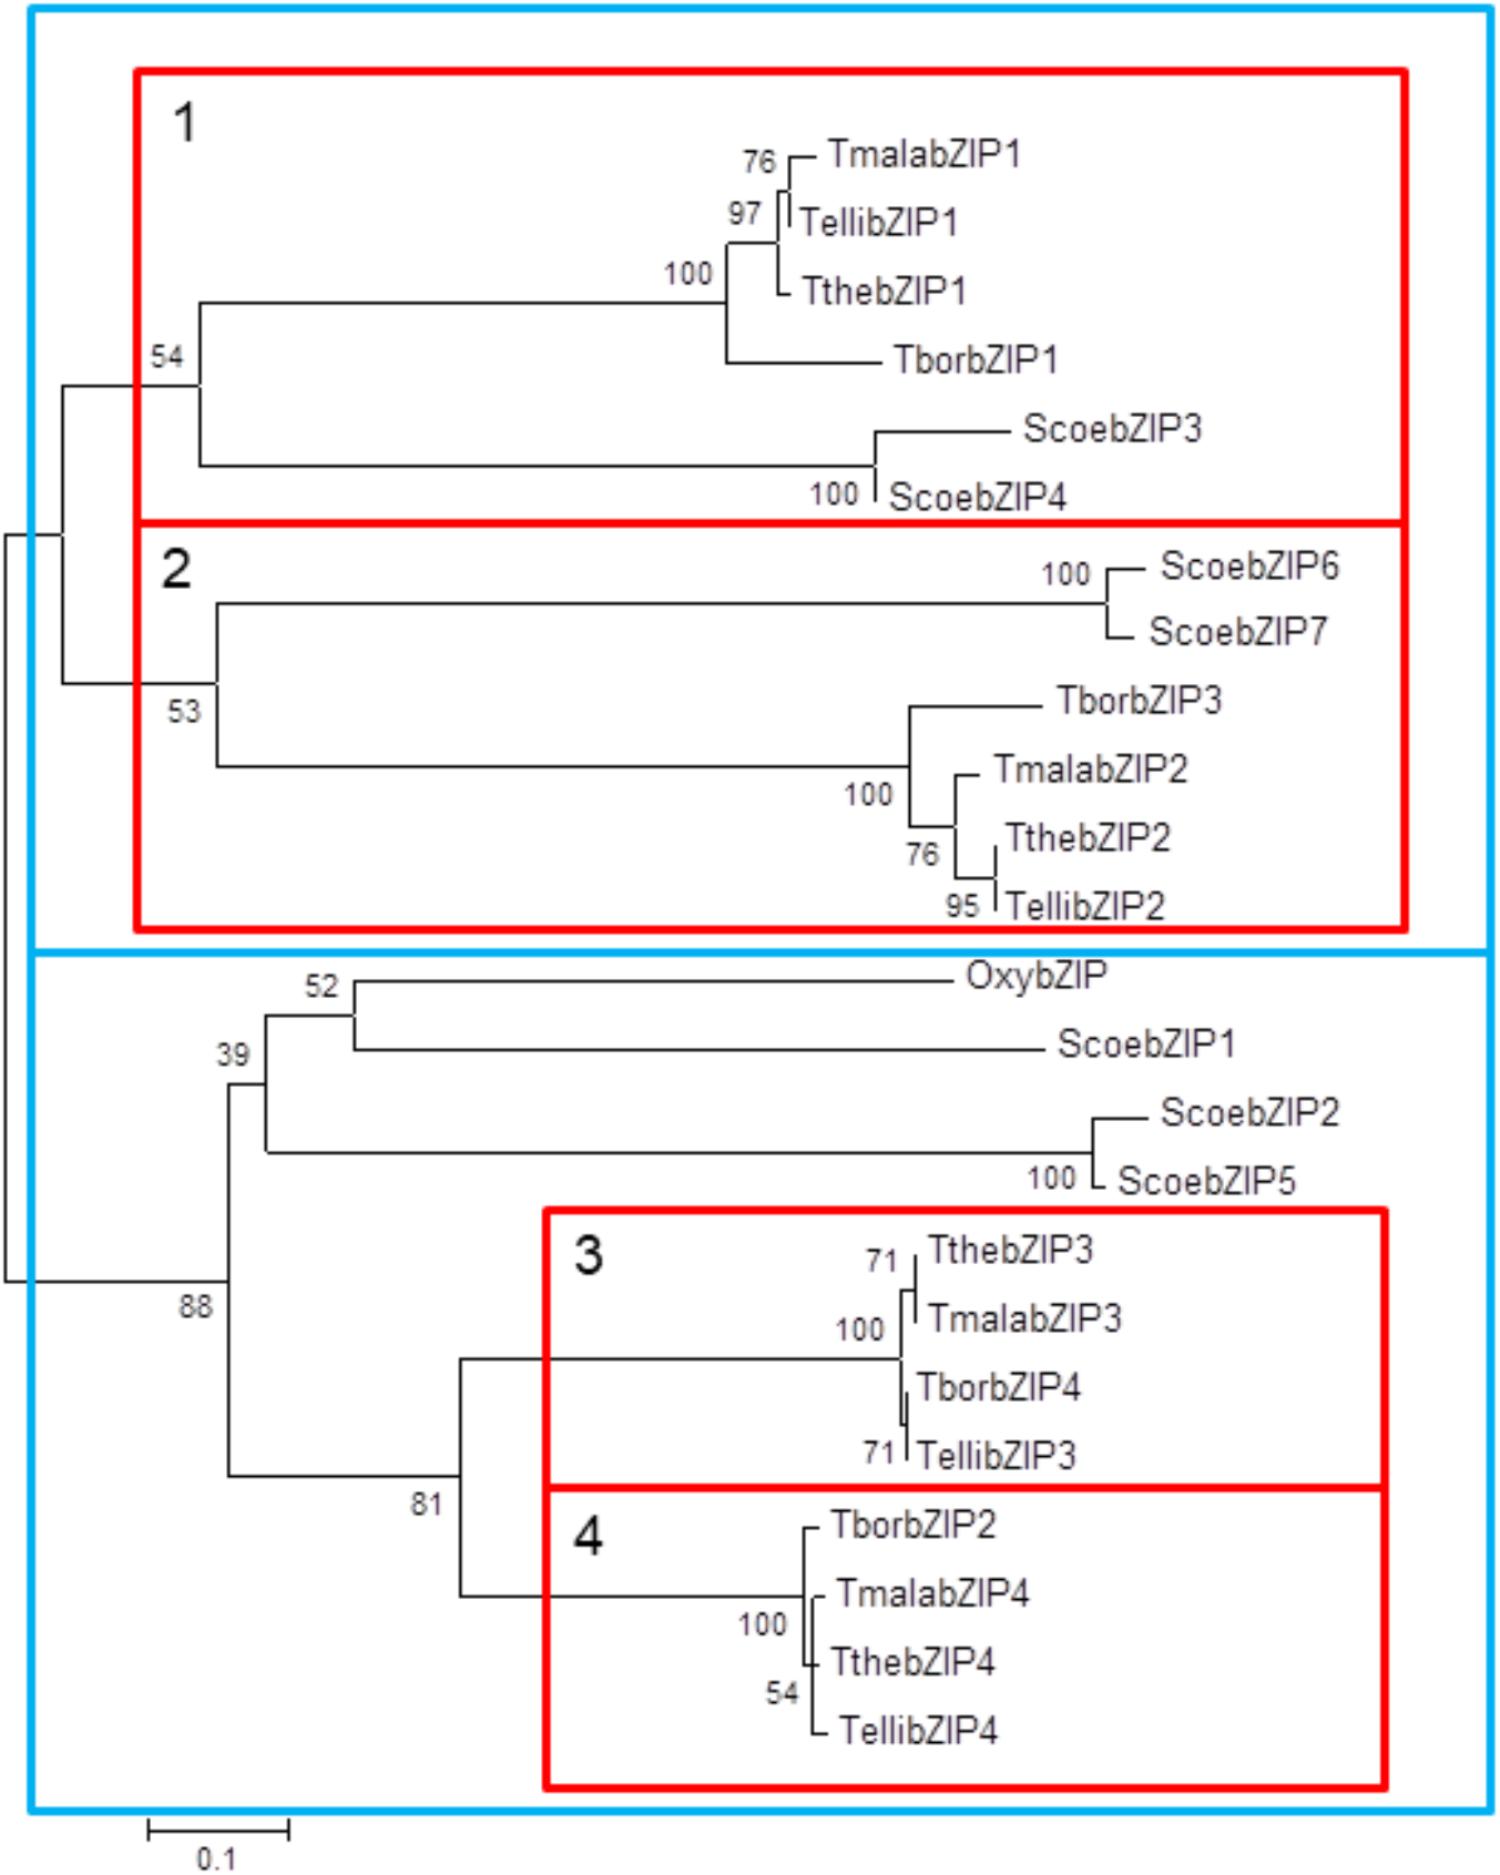
FIGURE 6. Phylogenetic tree of bZIP amino acid sequences from different ciliates. Each branch length follows the scale. Calculated bootstrap values are indicated in each node. Tthe, T. thermophila; Tbor, T. borealis; Telli, T. elliotti; Tmala, T. malaccensis; Oxy, Oxytricha sp.; Scoe, Stentor coeruleus. Red boxes include the four bZIP subgroups (1–4), each one composed by four bZIP TFs from different Tetrahymena species. Blue boxes are grouping these four groups into two major groups depending on the size range of their bZIP proteins; large (726–746 aa) and small (501–595 aa).
Four of the bZIP sequences from S. coeruleus are included in the first large group (smaller bZIP molecules); two are close to the first subgroup of Tetrahymena bZIP proteins and two are related to the second subgroup of Tetrahymena bZIP proteins. Three bZIP of S. coeruleus are related to the second large group (larger bZIP molecules), but separated from those of Tetrahymena. Also, the only bZIP protein from Oxytricha sp. is related to ScoebZIP1 protein, from S. coeruleus, in the second large group of ciliate bZIP TFs (Figure 6).
All Tetrahymena AP-1 TFs have the characteristic bZIP motif and all of them share a high level of conservation, and this assertion can be extended to all bZIP proteins found in ciliates (Figure 1). Their basic regions, that allow DNA binding, show many conserved residues among very different organisms including the 24 ciliate analyzed sequences. Specifically, the following motif stands out: NR/KxSAxx(N/K)(S/V)Rx(R/I)KK, where the underlined amino acid residues are the most conserved, and x means other amino acids. The high similarity of the bZIP basic region among different organisms suggests a common origin from an ancestral eukaryotic bZIP, which would include the highly conserved NxxSAxxSR signature motif. This DNA binding motif has not changed in the course of the bZIP superfamily evolution. Using 49 sequenced genomes from different eukaryotic groups, the evolution of the oldest family of eukaryotic transcription factors (bZIP) has been reconstructed, and authors have demonstrated that the evolution of multicellularity was paralleled to the expansion and diversification of bZIP genes in different families (Jindrich and Degnan, 2016). It has been proposed that the bZIP TF from the pathogenic flagellated protozoon Giardia lamblia could be the precursor of all bZIPs (Amoutzias et al., 2007). A phylogenetic analysis including bZIP TFs from very diverse organisms (including Tetrahymena and other protists) (data not shown), reveals that both TthebZIP3 and TthebZIP4 are close to Giardia bZIP, and so we could also consider them phylogenetically near.
Leucine zippers also have a high conservation level, but this one is lower than the previously mentioned for the basic regions. Leucine-rich regions allow dimerization processes (Hurst, 1995) and, probably for this reason, Leu residues are usually exposed to the surface of the protein, allowing the binding of two bZIP monomers and the obtaining of active conformations (homo- or heterodimers) which will regulate the expression of specific genes. Tetrahymena leucine zipper patterns contain 5–7 Leu residues like other bZIP motifs, but they are richer in isoleucine residues than other leucine zippers (including those from other ciliates). In Tetrahymena larger protein AP-1 group (mainly bZIP3 and bZIP4), unlike what happens in the majority of bZIP motifs and like it occurs in some Fos TFs (from C. elegans or H. sapiens), 1 or 2 conserved cysteine (Cys) residues are present in the leucine zipper (Figure 1). In Tetrahymena bZIP3 and bZIP4 proteins, one of these Cys residues is located in the same place that the third conserved leucine residue (Figure 1). We can speculate about the possibility that SH- groups from Cys residues could facilitate, after binding to a metallic cation (Cd2+ or another), the homo- or hetero-dimerization of two AP-1 monomers, forming homodimers (bZIP3/3 or bZIP4/4) or heterodimers (bZIP3/4). Thus, the presence of a toxic metal could induce the dimerization of AP-1 monomers, and induce the expression of metallothionein genes. In the yeast S. cerevisiae an AP-1 TF (Yap8) is critical for arsenic tolerance, and the authors have demonstrated that Yap8 directly binds to As3+ (one arsenite ion per one Yap8 monomer) (Kumar et al., 2015). The binding site is constituted by three Cys residues present in Yap8, and it does not require an additional protein. Binding of As3+ to Yap8 induces a conformational change that converts the inactive Yap8 form into an active transcriptional regulator. Therefore, Yap8 DNA-bound form acts as an As3+ molecular sensor.
Strict leucine zippers have been detected in only one AP-1 ortholog of each of the four Tetrahymena species (Table 2), which are grouped in the same subgroup present into the smaller bZIP protein group shown in Figure 6. The rest of Tetrahymena AP-1 orthologs, even if they do not have a strict leucine zipper, are able to carry out homo- or hetero-dimerization.
The in silico inferred 3D structure analysis reveals that in almost all Tetrahymena bZIP proteins some others α-helices attached to the α-helix of the bZIP motif exist, which are probably eliminated after a post-translational processing to originate the functional monomer, or this protein region facilitates in some way their dimerization.
The probability of each Tetrahymena AP-1 TF to form homo- or heterodimers was tested (Supplementary Table S6). The phylogenetic subgroups including different Tetrahymena bZIP1 and bZIP2 (subgroups 1 and 2 in Figure 6) preferentially form homodimers, while heterodimers are preferably formed between bZIP3 and bZIP4 molecules (subgroups 3 and 4 in Figure 6) of each corresponding Tetrahymena species: TthebZIP3/4, TellibZIP3/4, and TmalabZIP3/4. However, although heterodimers may be formed in T. borealis (TborbZIP2/4), the monomer TborbZIP4 is more likely to form homodimers than heterodimers with other TborbZIP monomers.
The products of these ortholog and highly conserved genes may perform similar functions in the different Tetrahymena species, just like has been reported in some yeasts, where complementation studies have been carried out using mutant strains for AP-1 genes. It has been checked that ortholog genes from other species can complement AP-1 mutations in another species (Billard et al., 1997). Furthermore, if we compare the different bZIP isoforms of each Tetrahymena species, we observe low identity percentages among them (22–45%) (Supplementary Table S9). This fact may corroborate the hypothesis that the four isoforms are necessary in each species as they have different functions among them. In addition, for each Tetrahymena species, the two bZIP isoforms with a higher identity percentage (43–45%) (Supplementary Table S9) are also the ones with a high probability of forming heterodimers.
After an analysis of conserved motifs in the putative promoter regions of Tetrahymena AP-1 genes, we have found three conserved DNA motifs (Table 3) and one copy of each motif is present in almost all Tetrahymena AP-1 5′UTR regions, which corroborates the hypothesis that these motifs may be involved in the expression regulation of these genes. By presenting the same regulatory motifs, we could think about the existence of a coordinated expression between the different ortholog genes.
Nuclear Protein-MTCM1 Motif Interactions
Electrophoretic mobility shift assay analysis have showed that, at least one protein, or probably several proteins from the T. thermophila macronuclear extract interacts with the MTCM1 motif. Because of its similarity with the molecular weight of some of them, it could be identified with some of the TthebZIP TFs. But, unfortunately, the obtained amounts of these proteins were not sufficient for their identification. Therefore, the only thing we can infer from these experiments is that these DNA conserved motifs, present in the T. thermophila MT gene promoters, can be linked to proteins acting as transcription factors.
Putative Functional Attributions to the Different T. thermophila AP-1 Transcription Factors
According to qRT-PCR results, the four T. thermophila bZIP TFs may have different and complementary functions in response to a stressful situation. In general, transcription factors act in low concentrations, and the expression levels of their encoding genes do not achieve high values. Therefore, small detected changes are significantly considered because a slightly increase in their expression levels is enough to perform their biological functions (Kouno and Ezaki, 2013). However, there are exceptions such as some TFs from the bacterium Helicobacter pylori under different environmental conditions (De la Cruz et al., 2017). Likewise, we have detected relatively high induction levels for some Tetrahymena AP-1 genes, under specific experimental conditions and in diverse strains. In this way, T. thermophila AP-1 TFs seem to have a key role as expression activators for genes related to metal-stress responses like MT genes, and probably to other environmental stressors. It is difficult to relate the expression profiling of these bZIP genes to each MT gene or to assign a specific bZIP TF to a particular MT gene expression. In the following sections we try to extract, from our actual and previous results, the clearest possible connections between the different bZIP TFs and the MT gene expression inductions from T. thermophila under different metal stress conditions.
TthebZIP1: A Probable Transcription Factor for MTT1 Gene Expression
In all analyzed strains, TthebZIP1 gene shows, under no metal-treatment, the second place in the ranking of basal expression values of T. thermophila AP-1 genes (Supplementary Figure S2). However, although it is in second place in the ranking, in GFPMTT1 strain this gene has a considerably higher basal expression level than control strain (SB1969): ∼6.5× and ∼3× and ∼10× regarding to TthebZIP2 and TthebZIP3 basal expression levels, respectively. GFPMTT1 strain has a higher number of copies for the MTT1 gene (Amaro et al., 2014) and it shows the highest MTT1 basal expression level (de Francisco et al., 2017). Likewise, in GFPMTT5 (which has the same MTT1 gene promoter than the strain GFPMTT1) (Amaro et al., 2014), the AP-1 basal expression ranking is the same (Supplementary Figure S2), and, like GFPMTT1, it shows the highest MTT1 basal expression level (de Francisco et al., 2017). Therefore, higher TthebZIP1 gene expression levels may be required in these strains for maintaining some MT gene basal expression levels, such as MTT1 levels, as this gene normally shows the highest basal expression levels under no metal exposures (de Francisco et al., 2017). In this way, artificially increased MTT1 levels may also cause an increase of TthebZIP1 basal expression levels in the GFPMTT1 or GFPMTT5 strains.
Likewise, TthebZIP1 gene induction patterns under metal exposures are similar to the ones previously described for MTT1 gene (de Francisco et al., 2017): the highest induction values are detected after 24 h Cd2+ treatments and, in some strains, also after 24 h Pb2+ exposures (Figure 2). In general, higher TthebZIP1 induction values are observed after 24 h treatments, so higher quantities of the TthebZIP1 TF may be required after long metal-exposure periods. The highest TthebZIP1 gene induction levels are detected in MTT5KD, GFPMTT5, and Cd-adap strains. These three strains have in common an increase in the MTT1 gene expression levels as Cd-adap and MTT5KD strains have a higher number of copies for the MTT1 gene or new MTT1 paralogs comparing to the control strain (∼5× for Cd-adap and ∼3× for MTT5KD) (de Francisco et al., 2018). GFPMTT1 and GFPMTT5 strains have high MTT1 expression levels under Cd2+ treatments (de Francisco et al., 2017). Therefore, a possible connection between TthebZIP1 gene induction in response to Cd2+ or Pb2+ and MTT1 gene expression levels, may be considered.
Further remarks on TthebZIP1 are as follows: (a)- the TthebZIP1 gene is the first in the expression ranking in Cd-adap strain under the maximum cadmium tolerated concentration (MTC) (Supplementary Figure S2), and MTT1 is the T. thermophila MT with the highest binding preference to Cd2+ (Espart et al., 2015). (b)- In MTT5KD strain, with a considerably reduced MTT5 gene copy number (de Francisco et al., 2018), TthebZIP1 gene expression induction predominates in all metal treatments (at 1 and/or 24 h) (Supplementary Figure S2), and in this strain MTT1 and MTT5 genes are over-expressed (de Francisco et al., 2017). (c)- according to a microarray analysis (data from Tetrahymena Functional Genomic Database) (Xiong et al., 2013) this TthebZIP1 gene is highly expressed during the first 2 h of Tetrahymena conjugation, and during the first 9 h of this sexual process all different MT genes are expressed. (d)- the MTT1 gene promoter is the second Tetrahymena MT gene with the highest number of TGA(A/T/C)TCA motifs (AP-1 binding sites), to which the TthebZIP1 homodimers could be attached (de Francisco et al., 2016).
TthebZIP2: A Transcription Factor Standing Up to Stressful Situations
In the majority of T. thermophila strains, TthebZIP2 gene shows the third place in the basal expression raking, excepting for Cd-adap and MTT5KD strains in which this gene is in the first place, together with TthebZIP4 (Supplementary Figure S2). Besides this, TthebZIP2 gene is the one that achieves the highest induction levels, mainly after 24 h Cd2+ or Cu2+ exposures in Cu-adap and Cd-adap strains, respectively. Likewise, this gene (like TthebZIP1) is induced (fold-induction >2) in 20 different situations under metal stress and in different T. thermophila strains, about 7–13 times after 1 h or 24 h metal treatments (Supplementary Figure S2). The three metal adapted strains have the highest TthebZIP2 gene expression induction values (Cd-adap > Pb-adap > Cu-adap) compared to the rest of the TthebZIP genes, after Cu2+ (in Cd-adap) or Cd2+ (in Cu- and Pb-adap strains) 24 h treatments (Figure 3 and Supplementary Table S7). Under these metal stress conditions, the MT genes MTT2/4 (in Cd-adap) and MTT5 (in Cu- and Pb-adap strains) are strongly over-expressed (de Francisco et al., 2017). In addition, the TthebZIP2 gene is the only one induced in Pb-adap (Supplementary Figure S2), and in this strain is the MTT5 gene the first one in the MT expression induction ranking, after any metal treatment (de Francisco et al., 2017).
The expression of TthebZIP2 gene has also been detected during the conjugation process (Tetrahymena Functional Genomic Database) (Xiong et al., 2013), showing two maximum values; at 2–4 h (preceding to MTT5, MTT1, and MTT3 gene expressions) and 10–12 h (preceding to the second maximum of MTT5 gene expression) from the beginning of the conjugation.
TthebZIP2 gene may intensely respond under stress situations when other bZIP TF isoforms are not able to respond so effectively. This gene seems to respond preferably after long metal exposure periods (24 h) and with some minor preference after short periods (1 h), and would also reinforce the cellular response in strains that are under higher stress conditions (metal-adapted, KO and/or KD strains). TthebZIP2 homodimers could also be indistinctly related to the induction of the five MT isoforms, activating one or another required MT gene in each stress situation.
TthebZIP3 and TthebZIP4: Transcription Factors Related to MTT5 Gene Expression
TthebZIP3 gene shows the lowest basal expression levels comparing to the other bZIP genes in all analyzed strain (Supplementary Figure S2). However, the two KO strains suppressing the MTT1 gene (MTT1KO and MTT1KO+MTT5KD) show the highest TthebZIP3 basal expression levels; ∼6× and ∼7× higher than the SB1969 control strain, respectively. As previously suggested (de Francisco et al., 2017), MTT5 gene may replace, in both strains, the loss of the completely eliminated MTT1, increasing its basal expression levels (∼8.5× and ∼59×, respectively), with regard to the control strain.
TthebZIP3 shows similar induction patterns to TthebZIP4 under metal-stress treatments (Figures 4, 5) and it is mainly expressed, but not exclusively, after Cd2+ (1 or 24 h) or Pb2+ (24 h) exposures (Supplementary Figure S2). This gene is also induced in Cd-adap (1 and 24 h Cu2+ treatment) and MTT5KD strain after Cu2+ (24 h), and it is the only expressed bZIP gene in MTT1KO+MTT5KD strain after Cu2+ (24 h) (Supplementary Figure S2). Regardless of the strain, the induction of the TthebZIP3 gene appears 25 times in metal treated samples and so it is one of the bZIP genes that, together with TthebZIP4, is preferably induced under metal stress (Supplementary Figure S2). In general, it seems to have a more general response against metal stress conditions, being able to react after 1 and 24 h treatments.
During T. thermophila conjugation the TthebZIP3 gene expression pattern overlaps or is close to those obtained from MTT5 and MTT3 genes, in addition, both genes (TthebZIP3 and MTT5) have two maximum matching peaks during this sexual process.
MTT5 gene is the mostly induced under Cd2+ or Pb2+ treatments in almost all analyzed T. thermophila strains (MTT5 > MTT1 > MTT3 > MTT2/4 consensus ranking), and under Cu2+ stress in some strains (Cu-adap, Pb-adap, and MTT5KD) (de Francisco et al., 2017). This essential MT gene has been considered as an “alarm” gene, that is over-expressed under metal stress (mainly Cd2+ and Pb2+) and promotes the expression of other MT genes (de Francisco et al., 2017). Likewise, a possible connection between TthebZIP3 and MTT5 expression may be considered, as both genes predominantly respond against different metals (mainly lead and cadmium).
TthebZIP4 gene has the highest basal expression levels among the four T. thermophila bZIP genes independently of the analyzed strain (Supplementary Figure S2). It suggests the potential relevance of TthebZIP4 gene as a gene expression regulator even under no stress conditions. This gene is induced in up to 23 different metal stress situations, being one of the most induced together with TthebZIP3 (25 times). During T. thermophila conjugation TthebZIP4 is also induced, and its maximum expression value is within the same conjugation temporal range (4–8 h) that the expression of MTT5, MTT1, MTT3, and TthebZIP3 genes (as showed in Tetrahymena Functional Genomic Database) (Xiong et al., 2013).
MTT5 gene has a promoter sequence duplicated, making it the MT gene with the largest number of AP-1 motifs (13 in total) (Diaz et al., 2007). This could involve a greater number of AP-1 TF molecules to increase their expression levels under stress conditions (Gutierrez et al., 2011). According to the scores obtained for all the possible T. thermophila AP-1 TF interactions, TthebZIP3 and TthebZIP4 are the most likely to form heterodimers. The formation of these heterodimers could be enhanced by the presence of the Cys residue present in each monomer (ThebZIP3 and TthebZIP4), which would form a thiolate bridge with the toxic metal (like Cd2+). Under no-stress conditions, the constitutive expression of TthebZIP3 gene is the lowest while that of TthebZIP4 is the highest in all T. thermophila analyzed strains (Supplementary Figure S2), and under these conditions the formation of TthebZIP4 homodimers could be favored. However, when TthebZIP3 TF is required (as when cells need to express the stress “alarm” MTT5 gene), TthebZIP3/4 heterodimers may be formed after increasing the expression of the TthebZIP3 gene (both genes are habitually induced under metal stress). Furthermore, against a stressful situation, the possibility of forming homo- or heterodimers increases cell response options as both conformations are normally related to the activation of different genes with putative different functions (de Francisco et al., 2018).
A Global Outlook and a Model Integrating MT Gene Expression Regulation and the Four T. thermophila AP-1 Transcription Factors
AP-1 TFs are normally expressed under no-stress conditions but they are also induced against a large variety of stimulus that can cause cellular stress, such as: ultraviolet and ionizing radiations, oxidative stress, DNA damages, cytoskeleton reorganizations, etc. Even, in mammalian cells, these transcription factors are activated in response to neuronal depolarization events, the binding of antigens to B or T lymphocytes or cytokines detection, so these AP-1 TFs are key regulators in multiple physiological processes (de Francisco et al., 2018).
The MTCM1 motifs described in the promoter regions of the T. thermophila MT genes are putative AP-1 factor binding sites and their number of copies follows the ranking: MTT5 (13) > >MTT1 (6) > MTT3 (2) = MTT2/4 (2) (Diaz et al., 2007; de Francisco et al., 2016). Differences among the numbers of MTCM1 motifs are also related to MT gene expression levels against metal stress conditions and, presumably, to the number of AP-1 factors that can bind to their promoter regions to express these MT genes. Likewise, the ability of these AP-1 TFs to activate different genes may be related to post-translational modifications, the dimerization type or their association to different molecules acting as coactivators (Wisdom, 1999).
Results presented here provide some indirect evidences of the key role that the four T. thermophila AP-1 TFs may play in the MT gene expression regulation. The possible relationships among the different AP-1 TFs and MT genes of T. thermophila have been summarized in a hypothetical model (Figure 7).
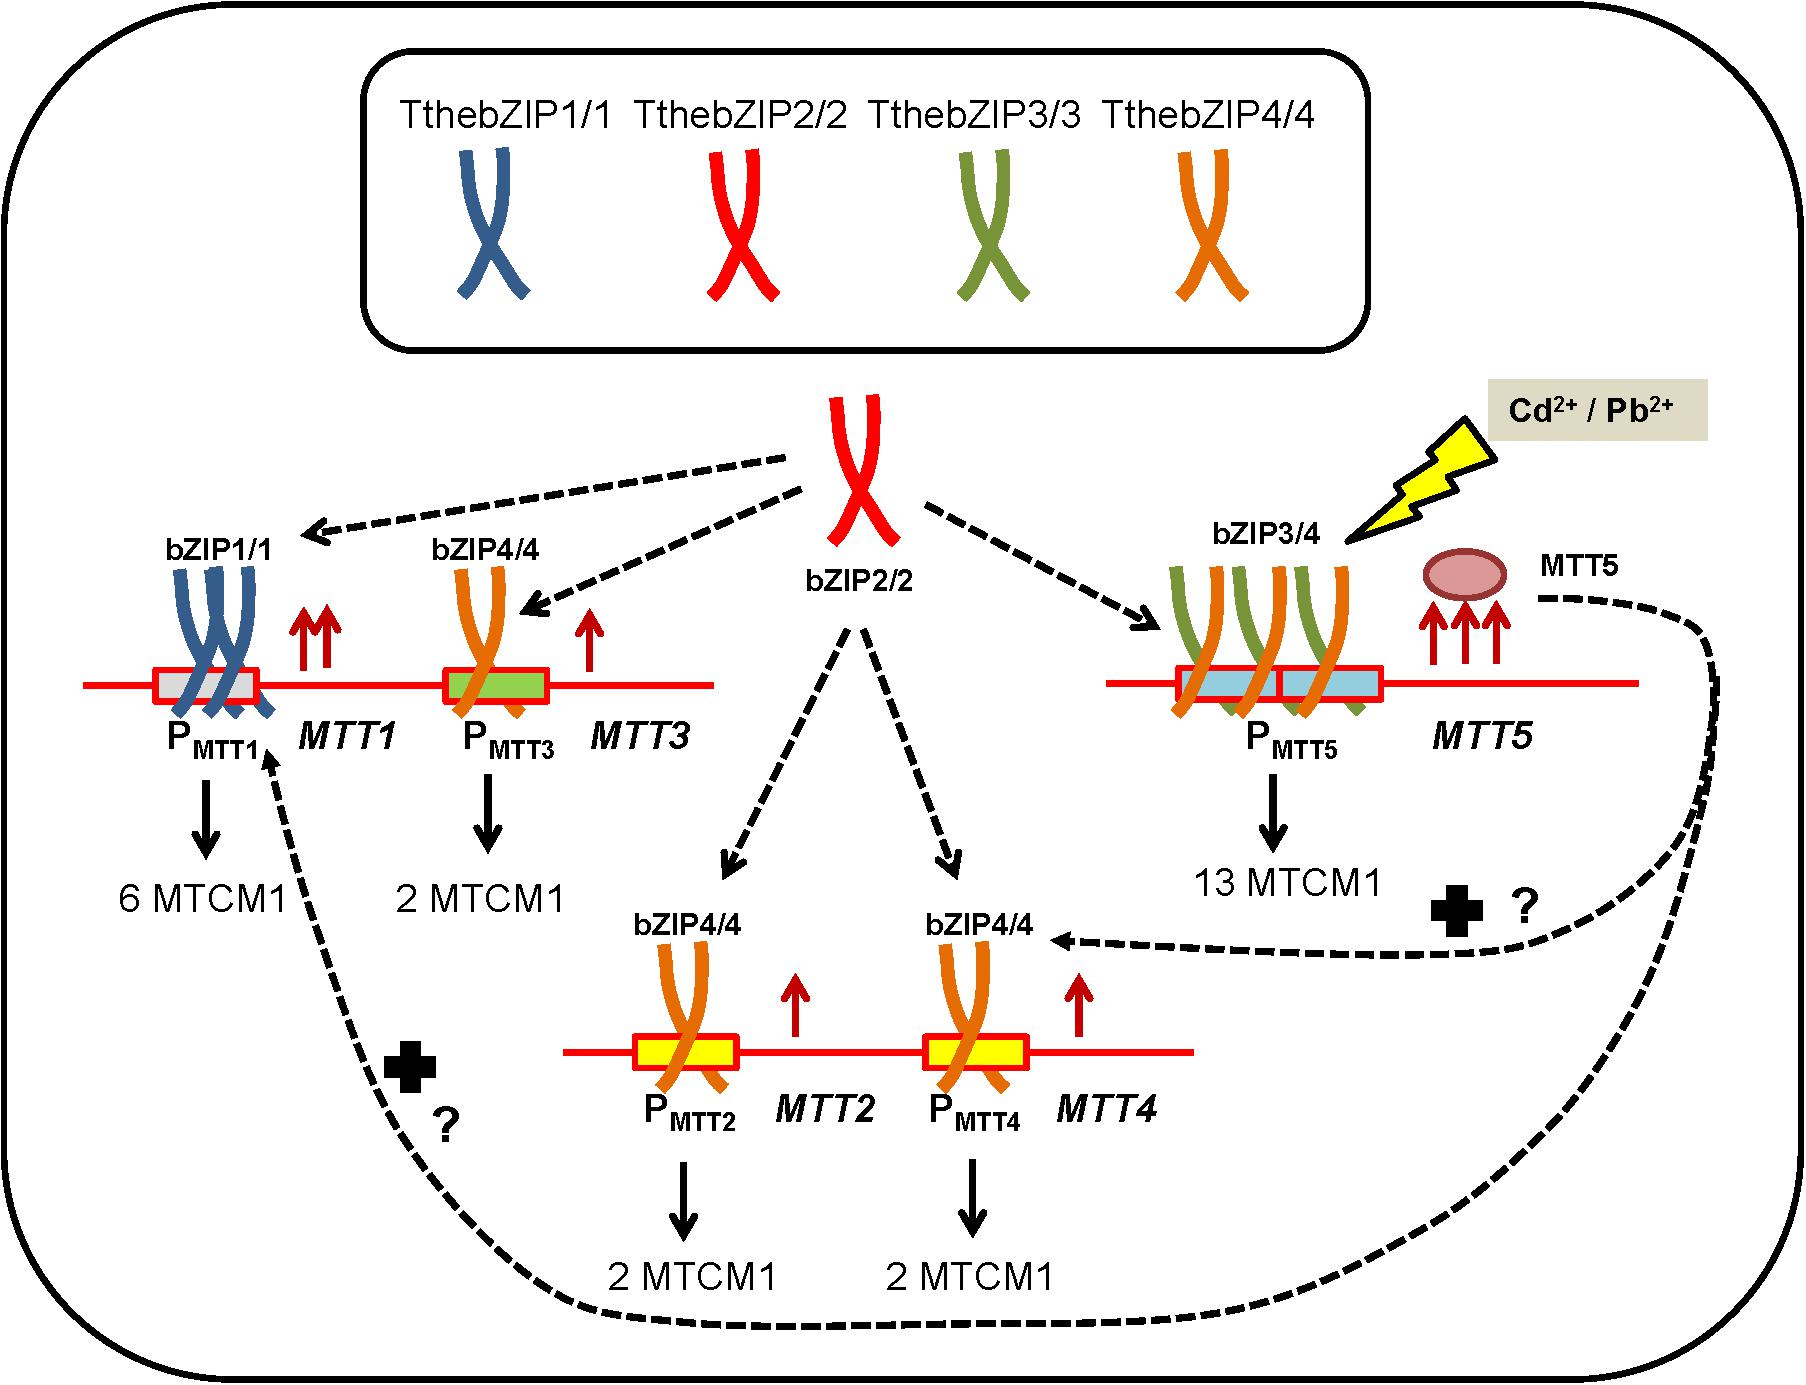
FIGURE 7. Hypothetical model representing the possible relationships among the different AP-1 TFs and MT genes of T. thermophila under metal-stress. PMTT, promoter region of each MT gene. MTCM1, metallothionein conserved motif 1. For further explanation see the text.
The majority of these TthebZIP TFs seems to form homodimers (bZIP1/1, bZIP2/2, bZIP3/3, and bZIP4/4), while TthebZIP3 and TthebZIP4 may also form heterodimers (TthebZIP3/4) with the aim to promote MTT5 gene expression (Figure 7). Moreover, considering the results, a possible preference of some TthebZIP TF to a specific MT promoter might exist, for instance; TthebZIP1 for MTT1 promoter. Likewise, an unspecific TthebZIP TF with the ability to link to different MT gene promoters, such as TthebZIP2/2 or TthebZIP4/4 homodimers could also be considered (Figure 7). Finally, we have previously reported that high MTT5 induction levels normally induce higher MTT1 and MTT2/4 expression levels (de Francisco et al., 2017), existing a connection among these three MT genes (MTT5, MTT1, and MTT2/4) and configuring a transcriptional regulatory network. Thus, MTT5 protein may interact, direct or indirectly, with TthebZIP gene promoters changing their expression levels and, therefore, having an additional function as a TthebZIP gene expression regulator (Figure 7). Of course, it is also possible that these TthebZIP TFs may also regulate the gene expression of other than the MT encoding genes.
From this study we can conclude the following main points:
(1) Four bZIP TFs have been described in all Tetrahymena analyzed species, showing a high conservation among them. Each AP-1 TF has its counterpart in the other three Tetrahymena species. This high evolutionary conservation may corroborate the functional relevance of these TFs in these microorganisms.
(2) Unusual high expression induction levels have been detected in some TthebZIP genes, and this induction seems to be associated to metallothionein gene expression during both metal stress and conjugation.
(3) TthebZIP1 homodimers might be related to MTT1 gene expression regulation.
On the other hand, TthebZIP2 homodimers seem to be involved in a punctual reinforcement of MT genes expression under extreme metal stress conditions. TthebZIP3/4 heterodimers might be involved in the activation of the stress “alarm” MTT5 gene. Which, in turn, increases the expression levels of MTT1 and MTT2/4 under metal stress. All these results are summarized in a hypothetical model of gene regulation involving T. thermophila MT genes, bZIP TFs and its connection to metal-stress cell response.
Author’s Note
In memory of Silvia Atrian. Silvia Atrian passed away about a year ago. She was an excellent friend and Spanish scientific colleague. Her important research work on metallothioneins has represented a significant advance in this area. We dedicate this work to her memory.
Author Contributions
PdF carried out all the qRT-PCR experiments, part of the in silico analysis of the bZIP TF sequences and drew up the first draft of the manuscript. FA carried out EMSA experiments and partial protein purification. AM-G assisted in statistical and in silico analysis. The project was conceived by JG who provided overall supervision of the study and the drafting of the manuscript. All authors read and approved the final manuscript.
Funding
This research work was supported by a grant from MINECO CGL2016-75494-R to JG. A Ph.D. scholarship was awarded to PdF by the Spanish Ministry of Education (FPU12/02789).
Conflict of Interest Statement
The authors declare that the research was conducted in the absence of any commercial or financial relationships that could be construed as a potential conflict of interest.
Acknowledgments
We would like to thank Dr. A. P. Turkewitz for his help in isolating T. thermophila KO and/or KD strains.
Supplementary Material
The Supplementary Material for this article can be found online at: https://www.frontiersin.org/articles/10.3389/fgene.2018.00459/full#supplementary-material
Footnotes
- ^ http://pir.georgetown.edu/pirwww/search/comp_mw.shtml
- ^ http://2zip.molgen.mpg.de/
- ^ http://embnet.vital-it.ch/software/COILS_form.html
- ^ http://bioinf.cs.ucl.ac.uk/psipred/
- ^ http://compbio.cs.princeton.edu/bzip/
- ^ http://www.sbg.bio.ic.ac.uk/phyre2/html/page.cgi?id=index
- ^ http://pymol.org
References
Amaro, F., Turkewitz, A. P., Martin-Gonzalez, A., and Gutierrez, J. C. (2014). Functional GFP-metallothionein fusion protein from Tetrahymena thermophila: a potential whole-cell biosensor for monitoring heavy metal pollution and a cell model to study metallothionein overproduction effects. Biometals 27, 195–205. doi: 10.1007/s10534-014-9704-0
Amoutzias, G. D., Veron, A. S., Weiner, J. III, Robinson-Rechavi, M., Bornberg-Bauer, E., Oliver, S. G., et al. (2007). One billion years of bZIP transcription factor evolution: conservation and change in dimerization and DNA-binding site specificity. Mol. Biol. Evol. 24, 827–835. doi: 10.1093/molbev/msl211
Bailey, T. L., and Elkan, C. (1994). Fitting a mixture model by expectation maximization to discover motifs in biopolymers. Proc. Int. Conf. Intell. Syst. Mol. Biol. 2, 28–36.
Barchetta, S., La Terza, A., Ballarini, P., Pucciarelli, S., and Miceli, C. (2008). Combination of two regulatory elements in the Tetrahymena thermophila HSP70-1 gene controls heat shock activation. Eukaryot. Cell 7, 379–386. doi: 10.1128/EC.00221-07
Billard, P., Dumond, H., and Bolotin-Fukuhara, M. (1997). Characterization of an AP-1-like transcription factor that mediates an oxidative stress response in Kluyveromyces lactis. Mol. Gen. Genet. 257, 62–70. doi: 10.1007/s004380050624
Bornberg-Bauer, E., Rivals, E., and Vingron, M. (1998). Computational approaches to identify leucine zippers. Nucleic Acids Res. 26, 2740–2746. doi: 10.1093/nar/26.11.2740
Braithwaite, E. K., Mattie, M. D., and Freedman, J. H. (2010). Activation of metallothionein transcription by 4-hydroxynonenal. J. Biochem. Mol. Toxicol. 24, 330–334. doi: 10.1002/jbt.20342
Chantangsi, C., and Lynn, D. H. (2008). Phylogenetic relationships within the genus Tetrahymena inferred from the cytochrome c oxidase subunit 1 and the small subunit ribosomal RNA genes. Mol. Phylogenet. Evol. 49, 979–987. doi: 10.1016/j.ympev.2008.09.017
Chevallet, M., Luche, S., and Rabilloud, T. (2006). Silver staining of proteins in polyacrylamide gels. Nat. Protoc. 1, 1852–1858. doi: 10.1038/nprot.2006.288
De, S. K., Enders, G. C., and Andrews, G. K. (1991). High levels of metallothionein messenger RNAs in male germ cells of the adult mouse. Mol. Endocrinol. 5, 628–636. doi: 10.1210/mend-5-5-628
de Francisco, P., Martin-Gonzalez, A., Turkewitz, A. P., and Gutierrez, J. C. (2017). Extreme metal adapted, knockout and knockdown strains reveal a coordinated gene expression among different Tetrahymena thermophila metallothionein isoforms. PLoS One 12:e0189076. doi: 10.1371/journal.pone.0189076
de Francisco, P., Martin-Gonzalez, A., Turkewitz, A. P., and Gutierrez, J. C. (2018). Genome plasticity in response to stress in Tetrahymena thermophila: selective and reversible chromosome amplification and paralogous expansion of metallothionein genes. Environ. Microbiol. 20, 2410–2421. doi: 10.1111/1462-2920.14251
de Francisco, P., Melgar, L. M., Diaz, S., Martin-Gonzalez, A., and Gutierrez, J. C. (2016). The Tetrahymena metallothionein gene family: twenty-one new cDNAs, molecular characterization, phylogenetic study and comparative analysis of the gene expression under different abiotic stressors. BMC Genomics 17:346. doi: 10.1186/s12864-016-2658-6
De la Cruz, M. A., Ares, M. A., Von Bargen, K., Panunzi, L. G., Martinez-Cruz, J., Valdez-Salazar, H. A., et al. (2017). Gene expression profiling of transcription factors of Helicobacter pylori under different environmental conditions. Front. Microbiol. 8:615. doi: 10.3389/fmicb.2017.00615
Diaz, S., Amaro, F., Rico, D., Campos, V., Benitez, L., Martin-Gonzalez, A., et al. (2007). Tetrahymena metallothioneins fall into two discrete subfamilies. PLoS One 2:e291. doi: 10.1371/journal.pone.0000291
Durchdewald, M., Angel, P., and Hess, J. (2009). The transcription factor fos: a Janus-type regulator in health and disease. Histol. Histopathol. 24, 1451–1461. doi: 10.14670/HH-24.1451
Espart, A., Marin, M., Gil-Moreno, S., Palacios, O., Amaro, F., Martin-Gonzalez, A., et al. (2015). Hints for metal-preference protein sequence determinants: different metal binding features of the five Tetrahymena thermophila metallothioneins. Int. J. Biol. Sci. 11, 456–471. doi: 10.7150/ijbs.11060
Fong, J. H., Keating, A. E., and Singh, M. (2004). Predicting specificity in bZIP coiled-coil protein interactions. Genome Biol. 5:R11. doi: 10.1186/gb-2004-5-2-r11
Gunther, V., Lindert, U., and Schaffner, W. (2012). The taste of heavy metals: gene regulation by MTF-1. Biochim. Biophys. Acta 1823, 1416–1425. doi: 10.1016/j.bbamcr.2012.01.005
Gutierrez, J. C., Amaro, F., Diaz, S., De Francisco, P., Cubas, L. L., and Martin-Gonzalez, A. (2011). Ciliate metallothioneins: unique microbial eukaryotic heavy-metal-binder molecules. J. Biol. Inorg. Chem. 16, 1025–1034. doi: 10.1007/s00775-011-0820-9
Gutierrez, J. C., Amaro, F., and Martin-Gonzalez, A. (2009). From heavy metal-binders to biosensors: ciliate metallothioneins discussed. Bioessays 31, 805–816. doi: 10.1002/bies.200900011
Haq, F., Mahoney, M., and Koropatnick, J. (2003). Signaling events for metallothionein induction. Mutat. Res. 533, 211–226. doi: 10.1016/j.mrfmmm.2003.07.014
Hellman, L. M., and Fried, M. G. (2007). Electrophoretic mobility shift assay (EMSA) for detecting protein-nucleic acid interactions. Nat Protoc 2,1849–1861. doi: 10.1038/nprot.2007.249
Jakoby, M., Weisshaar, B., Droge-Laser, W., Vicente-Carbajosa, J., Tiedemann, J., Kroj, T., et al. (2002). bZIP transcription factors in Arabidopsis. Trends Plant Sci. 7, 106–111. doi: 10.1016/S1360-1385(01)02223-3
Jenny, M. J., Warr, G. W., Ringwood, A. H., Baltzegar, D. A., and Chapman, R. W. (2006). Regulation of metallothionein genes in the American oyster (Crassostrea virginica): ontogeny and differential expression in response to different stressors. Gene 379, 156–165. doi: 10.1016/j.gene.2006.05.004
Jindrich, K., and Degnan, B. M. (2016). The diversification of the basic leucine zipper family in eukaryotes correlates with the evolution of multicellularity. BMC Evol. Biol. 16:28. doi: 10.1186/s12862-016-0598-z
Jones, D. T. (1999). Protein secondary structure prediction based on position-specific scoring matrices. J. Mol. Biol. 292, 195–202. doi: 10.1006/jmbi.1999.3091
Kappelmann, M., Bosserhoff, A., and Kuphal, S. (2014). AP-1/c-Jun transcription factors: regulation and function in malignant melanoma. Eur. J. Cell Biol. 93, 76–81. doi: 10.1016/j.ejcb.2013.10.003
Karin, M., Liu, Z., and Zandi, E. (1997). AP-1 function and regulation. Curr. Opin. Cell Biol 9, 240–246. doi: 10.1016/S0955-0674(97)80068-3
Kelley, L. A., Mezulis, S., Yates, C. M., Wass, M. N., and Sternberg, M. J. (2015). The Phyre2 web portal for protein modeling, prediction and analysis. Nat. Protoc. 10, 845–858. doi: 10.1038/nprot.2015.053
Kockel, L., Homsy, J. G., and Bohmann, D. (2001). Drosophila AP-1: lessons from an invertebrate. Oncogene 20, 2347–2364. doi: 10.1038/sj.onc.1204300
Kouno, T., and Ezaki, B. (2013). Multiple regulation of Arabidopsis AtGST11 gene expression by four transcription factors under abiotic stresses. Physiol. Plant. 148, 97–104. doi: 10.1111/j.1399-3054.2012.01699.x
Kumar, N. V., Yang, J., Pillai, J. K., Rawat, S., Solano, C., Kumar, A., et al. (2015). Arsenic directly binds to and activates the yeast AP-1-like transcription factor Yap8. Mol. Cell. Biol. 36, 913–922. doi: 10.1128/MCB.00842-15
Labbe, S., Stewart, G., Larochelle, O., Poirier, G. G., and Seguin, C. (2001). Identification of sequence-specific DNA-binding proteins by southwestern blotting. Methods Mol. Biol. 148, 255–264.
Larionov, A., Krause, A., and Miller, W. (2005). A standard curve based method for relative real time PCR data processing. BMC Bioinformatics 6:62. doi: 10.1186/1471-2105-6-62
Laukens, D., Waeytens, A., De Bleser, P., Cuvelier, C., and De Vos, M. (2009). Human metallothionein expression under normal and pathological conditions: mechanisms of gene regulation based on in silico promoter analysis. Crit. Rev. Eukaryot. Gene Expr. 19, 301–317. doi: 10.1615/CritRevEukarGeneExpr.v19.i4.40
Lupas, A., Van Dyke, M., and Stock, J. (1991). Predicting coiled coils from protein sequences. Science 252, 1162–1164. doi: 10.1126/science.252.5009.1162
Mattie, M. D., Mcelwee, M. K., and Freedman, J. H. (2008). Mechanism of copper-activated transcription: activation of AP-1, and the JNK/SAPK and p38 signal transduction pathways. J. Mol. Biol. 383, 1008–1018. doi: 10.1016/j.jmb.2008.08.080
Miles, A. T., Hawksworth, G. M., Beattie, J. H., and Rodilla, V. (2000). Induction, regulation, degradation, and biological significance of mammalian metallothioneins. Crit. Rev. Biochem. Mol. Biol 35, 35–70. doi: 10.1080/10409230091169168
Moilanen, L. H., Fukushige, T., and Freedman, J. H. (1999). Regulation of metallothionein gene transcription. J. Biol. Chem. 274, 29655–29665. doi: 10.1074/jbc.274.42.29655
Notredame, C., Higgins, D. G., and Heringa, J. (2000). T-Coffee: a novel method for fast and accurate multiple sequence alignment. J. Mol. Biol. 302, 205–217. doi: 10.1006/jmbi.2000.4042
Schutze, K., Harter, K., and Chaban, C. (2008). Post-translational regulation of plant bZIP factors. Trends Plant Sci. 13, 247–255. doi: 10.1016/j.tplants.2008.03.002
Shaulian, E. (2010). AP-1–the jun proteins: oncogenes or tumor suppressors in disguise? Cell Signal 22, 894–899. doi: 10.1016/j.cellsig.2009.12.008
Shaulian, E., and Karin, M. (2002). AP-1 as a regulator of cell life and death. Nat. Cell Biol. 4, E131–E136.
Siu, F. K., Lee, L. T., and Chow, B. K. (2008). Southwestern blotting in investigating transcriptional regulation. Nat. Protoc. 3, 51–58. doi: 10.1038/nprot.2007.492
Sornaraj, P., Luang, S., Lopato, S., and Hrmova, M. (2016). Basic leucine zipper (bZIP) transcription factors involved in abiotic stresses: a molecular model of a wheat bZIP factor and implications of its structure in function. Biochim. Biophys. Acta 1860, 46–56. doi: 10.1016/j.bbagen.2015.10.014
Stover, N. A., Krieger, C. J., Binkley, G., Dong, Q., Fisk, D. G., Nash, R., et al. (2006). Tetrahymena Genome Database (TGD): a new genomic resource for Tetrahymena thermophila research. Nucleic Acids Res. 34, D500–D503. doi: 10.1093/nar/gkj054
Takahashi, S. (2015). Positive and negative regulators of the metallothionein gene (review). Mol. Med. Rep. 12, 795–799. doi: 10.3892/mmr.2015.3459
Valko, M., Morris, H., and Cronin, M. T. (2005). Metals, toxicity and oxidative stress. Curr. Med. Chem 12, 1161–1208. doi: 10.2174/0929867053764635
Vasak, M. (2005). Advances in metallothionein structure and functions. J. Trace Elem. Med. Biol. 19, 13–17. doi: 10.1016/j.jtemb.2005.03.003
Wisdom, R. (1999). AP-1: one switch for many signals. Exp. Cell Res. 253, 180–185. doi: 10.1006/excr.1999.4685
Wu, A., Wemmie, J. A., Edgington, N. P., Goebl, M., Guevara, J. L., and Moye-Rowley, W. S. (1993). Yeast bZip proteins mediate pleiotropic drug and metal resistance. J. Biol. Chem. 268, 18850–18858.
Wu, C. H., Yeh, L. S., Huang, H., Arminski, L., Castro-Alvear, J., Chen, Y., et al. (2003). The Protein Information Resource. Nucleic Acids Res. 31, 345–347. doi: 10.1093/nar/gkg040
Xiong, J., Lu, Y., Feng, J., Yuan, D., Tian, M., Chang, Y., et al. (2013). Tetrahymena functional genomics database (TetraFGD): an integrated resource for Tetrahymena functional genomics. Database 2013:bat008. doi: 10.1093/database/bat008
Keywords: AP-1 transcription factors, metallothioneins, metal stress, gene expression regulation, Tetrahymena thermophila
Citation: de Francisco P, Amaro F, Martín-González A and Gutiérrez JC (2018) AP-1 (bZIP) Transcription Factors as Potential Regulators of Metallothionein Gene Expression in Tetrahymena thermophila. Front. Genet. 9:459. doi: 10.3389/fgene.2018.00459
Received: 24 July 2018; Accepted: 19 September 2018;
Published: 23 October 2018.
Edited by:
Joao Batista Teixeira da Rocha, Universidade Federal de Santa Maria, BrazilReviewed by:
Abdul Rauf Shakoori, University of the Punjab, PakistanWei Wang, Shanxi University, China
Wei Miao, Institute of Hydrobiology, Chinese Academy of Sciences, China
Copyright © 2018 de Francisco, Amaro, Martín-González and Gutiérrez. This is an open-access article distributed under the terms of the Creative Commons Attribution License (CC BY). The use, distribution or reproduction in other forums is permitted, provided the original author(s) and the copyright owner(s) are credited and that the original publication in this journal is cited, in accordance with accepted academic practice. No use, distribution or reproduction is permitted which does not comply with these terms.
*Correspondence: Juan Carlos Gutiérrez, anVhbmNhckBiaW8udWNtLmVz