 Lucas E. Cardozo1
 Pedro S. T. Russo1
 Bruno Gomes-Correia2
 Mariana Araujo-Pereira1
 Gonzalo Sepúlveda-Hermosilla3
 Vinicius Maracaja-Coutinho2
 Helder I. Nakaya1*
- 1Department of Clinical and Toxicological Analyses, School of Pharmaceutical Sciences, University of São Paulo, São Paulo, Brazil
- 2Advanced Center for Chronic Diseases–ACCDiS, Facultad de Ciencias Químicas y Farmacéuticas, Universidad de Chile, Santiago, Chile
- 3Centro de Genómica y Bioinformática, Facultad de Ciencias, Universidad Mayor, Santiago, Chile
Co-expression analysis has been widely used to elucidate the functional architecture of genes under different biological processes. Such analysis, however, requires substantial knowledge about programming languages and/or bioinformatics skills. We present webCEMiTool,1 a unique online tool that performs comprehensive modular analyses in a fully automated manner. The webCEMiTool not only identifies co-expression gene modules but also performs several functional analyses on them. In addition, webCEMiTool integrates transcriptomic data with interactome information (i.e., protein-protein interactions) and identifies potential hubs on each network. The tool generates user-friendly html reports that allow users to search for specific genes in each module, as well as check if a module contains genes overrepresented in specific pathways or altered in a specific sample phenotype. We used webCEMiTool to perform a modular analysis of single-cell RNA-seq data of human cells infected with either Zika virus or dengue virus.
Introduction
Cellular processes are driven by multiple interacting molecules whose activity level must be dynamically regulated (Kitano, 2002). As a result, genes belonging to the same signaling and metabolic pathway or sharing similar functions will tend to be co-expressed across conditions (Wang et al., 2016). Co-expression gene module analysis creates networks comprising sets of genes (i.e., modules) whose expression is highly correlated. Such analysis was applied to reveal functional modules related to infectious (Janova et al., 2015), inflammatory (Beins et al., 2016), and neurological (Voineagu et al., 2011) diseases, as well as several types of cancer (Sharma et al., 2017).
Weighted gene co-expression network analysis (WGCNA) is a widely used method to identify co-expressed gene modules (Zhang and Horvath, 2005). In order to run WGCNA, however, users are required to be familiar to programming environments, as well as to manually select parameters. These features prevent researchers with insufficient knowledge of R to identify gene modules from transcriptome data sets.
Based on our Bioconductor R package named CEMiTool (Russo et al., 2018), we developed a user-friendly web-based application that allows scientists with no background in bioinformatics to perform comprehensive co-expression network analysis.
Materials and Methods
The web interface of webCEMiTool was developed to allow users to quickly generate comprehensive analyses without the need of installing any specific program or internet browser. The only requirement for running the modular analysis is a data set containing the expression levels of all genes in samples under different biological conditions (herein defined as “classes”). There is no defined range number of samples but our previous study suggests a minimum of 15 samples per data set (Russo et al., 2018). Although it was primarily designed for transcriptome data (i.e., RNA-seq or microarrays), it can also be potentially used for identifying modules of proteins, cytokines, and even metabolites. webCEMiTool will then automatically select the input genes and identify the co-expression modules. Each module contains a set of genes whose expression follows a similar pattern.
We implemented, within webCEMiTool, a feature that assesses the activity of gene modules on each class of samples. For this, the users only have to provide a sample annotation tab-delimited text file that informs the class of each sample. A “profile plot” showing the median level of individual genes within the module is then displayed in the “Results” section of the tool (Figure 1A).
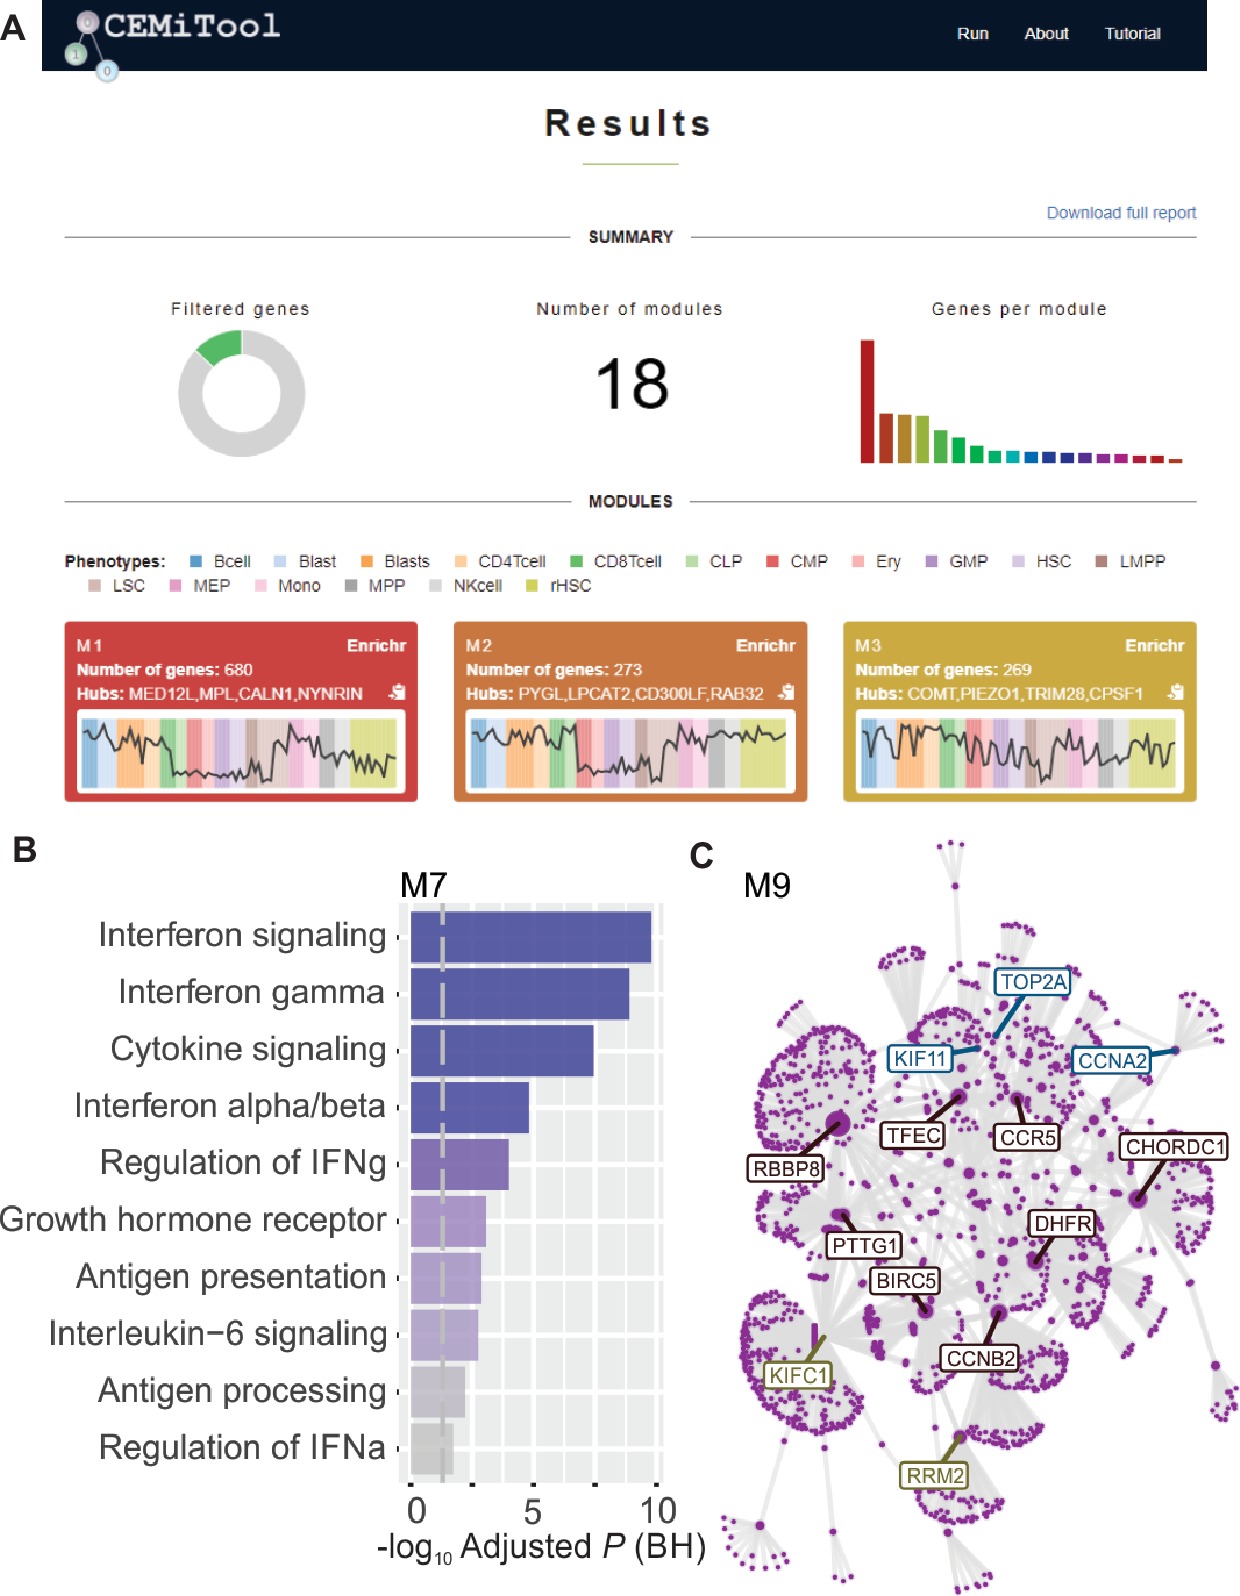
Figure 1. webCEMiTool overview. (A) webCEMiTool results summary – The donut chart represents the proportion of selected genes by the unsupervised filter. The front page also displays the number of modules obtained, as well as a bar chart depicting the number of genes in each module. Module profile plots illustrate the median expression activity of genes from the modules across each sample. The colors represent the different sample classes. (B) Overrepresentation analysis – This depicts the −log10 adjusted p-value (Benjamini-Hochberg) of the enriched pathways in a module (pathways defined by user-inputted .gmt file). (C) Gene network of a module – The top most connected genes (hubs) are labeled and colored based on whether they were originally present in the module (blue), or inserted from a user-inputted interaction file (red), or both (green).
To enable functional analysis, the users can also check if the gene modules are associated with specific signaling or metabolic pathways (Figure 1B). These pathways can easily be extracted from databases, such as KEGG, Reactome, and MySigDB. Finally, users can integrate the results with interactome data (i.e., protein-protein interactions, transcription factors and their transcribed genes, or even miRNAs and their target genes). This feature enables users to identify critical regulators of modules (Figure 1C), providing valuable insights for experimental validation or potential targets for drugs. Additional details on how to obtain the optional files can be found in the “Tutorial” page of the website.2
To demonstrate that our method is robust, we performed an unprecedented large-scale modular analysis with over 1,000 publicly available RNA-seq and microarray data sets and new RNA-seq data of patients infected with Leishmania using the CEMiTool R package version (Russo et al., 2018). Although webCEMiTool and the package have distinct visualization features and are based on different platforms, the core co-expression functionality is essentially the same. The online tool we are describing here is built to enable easy access to gene modular analyses for non-programming researchers, while the R library version is geared towards users with greater knowledge of the R programming language. Additionally, the results dashboard is composed of interactive charts that facilitate interpretation. Moreover, taking advantage of the rising ecosystem of bioinformatics web services, our tool establishes an interface with the Enrichr platform (Chen et al., 2013), enabling a richer experience for our users.
Results
We demonstrated that webCEMiTool can be applied to analyze expression data at the single cell level. Publicly available viscRNA-Seq data (virus-including single cell RNA-Seq) were obtained from NCBI GEO database (accession number GSE110496) and used as input for the analysis. The data refer to the transcriptome of individual human hepatoma (Huh7) cells, which were infected with either dengue virus (DENV) or Zika virus (ZIKV), using multiplicity of infection (MOI) 0, 1, or 10 (Zanini et al., 2018). Cells collected on four different time points (4, 12, 24 and 48 h after infection) were then sorted for single cell transcriptomic analysis with an adapted Smart-seq2 protocol (Zanini et al., 2018). The DENV data set comprises 933 infected cells (MOI = 1 or 10) and 303 controls (MOI = 0), while the ZIKV data set is composed of 488 infected cells (MOI = 1) and 403 controls. Before submitting the analysis to the webCEMiTool platform, both data sets were log10 transformed and genes that were not expressed in more than 80% of the samples were removed. The data sets were then split by virus and by time point and used as input (“Expression file” field) to webCEMiTool. In addition to the gene expression data, we also provided to webCEMiTool the sample phenotypes (i.e., viral loads) and Reactome gene sets.
Our webCEMiTool analyses generated an average of six modules per time point in DENV infection and more than eight modules per time point in ZIKV infection. We have selected one module per time point as a representative of our findings (Figure 2A). It is clear that at 24 and 48 h post-infection, the expression activity of representative modules increases according to the viral load (Figure 2A). We next performed the pathway enrichment analysis of the representative modules at 24 h post-infection using the webCEMiTool link for Enrichr (Figure 2B). These findings not only corroborate what was described in the original publication (Zanini et al., 2018) but also provide new insights about the physiopathology of dengue and Zika virus infections.
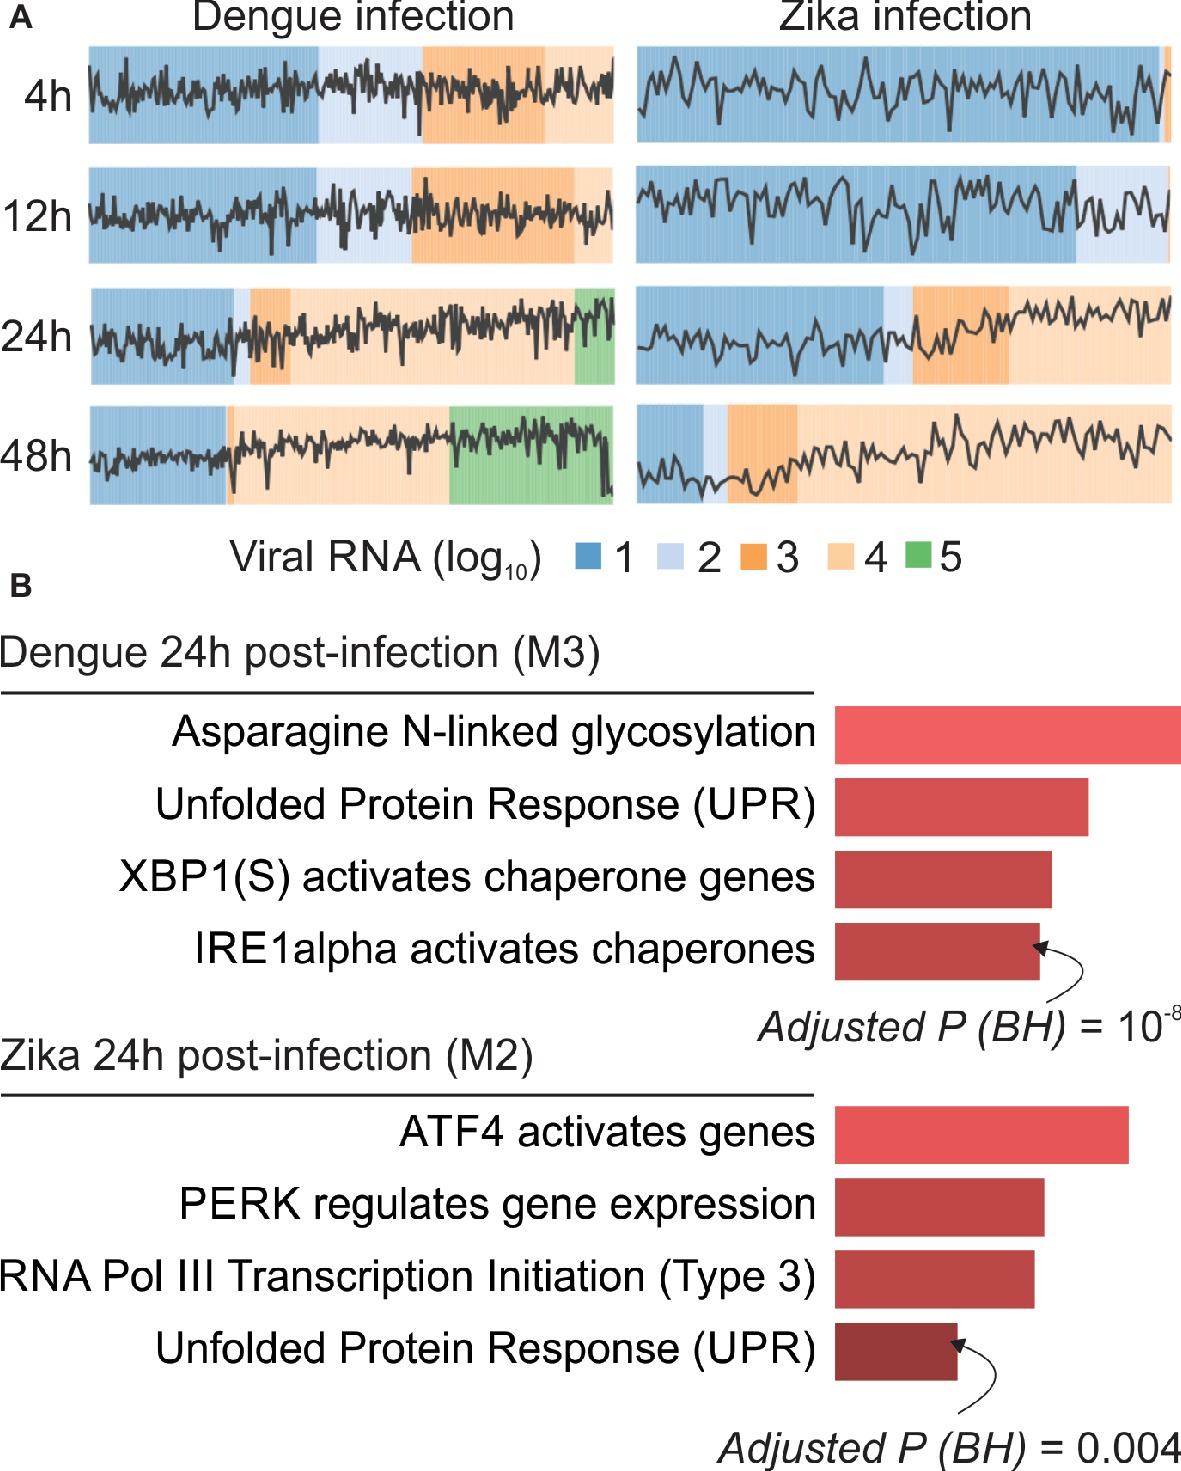
Figure 2. webCEMiTool applied to single-cell RNA-seq data. (A) Profile plot of co-expressed gene modules. We selected one representative module for each time point post-dengue virus infection (left) or post-Zika virus infection (right). The black line represents the median expression activity of genes from the modules across each sample. The colors represent the different amount of virus RNA within the cell. (B) Overrepresentation analysis of selected modules at 24 h post-virus infection. The bar graphs were adapted from the Enrichr webtool linked to webCEMiTool. The bars are proportional to the −log10 adjusted p-value (Benjamini-Hochberg) of the enriched pathways in a module.
Discussion
Although few similar web-based applications were developed to perform co-expression gene analysis (Tzfadia et al., 2016; Desai et al., 2017), these tools do not provide comparable results to webCEMiTool. One such application is GeNET (Desai et al., 2017). This webtool was designed to facilitate gene co-expression analyses and provides enrichment analysis and gene-to-gene networks. However, it only performs these analyses for three organisms (R. capsulatus, M. tuberculosis, and O. sativa). Another example is CoExpNetViz (Tzfadia et al., 2016), a webtool designed for the visualization and construction of gene networks. Similar to GeNET, CoExpNetViz is somewhat limited with respect to the organisms as it is stated to be primarily designed for plant transcriptomes. The webCEMiTool aims to provide co-expression analyses for any organism. Moreover, although CoExpNetViz is presented as a web-based application, its results are returned to users as a compressed folder containing a README.txt file with instructions on how to visualize their results on the Cytoscape app. The users have then to manually insert into Cytoscape the several different output files provided by the tool. These additional steps can also make the process error-prone and possibly daunting to users unfamiliar with Cytoscape. The webCEMiTool offers much more convenient browser-displayed results.
We also showed that webCEMitool is able to analyze single-cell RNA-seq data faster and efficiently. Our results returned relevant information about the biological processes involved with dengue and Zika virus infection. All this analysis were performed in an automated and practical manner, with no need for the user to have deep understanding on the internal processing of gene co-expression data analysis.
Author Contributions
LC, PR, BG-C, and MA-P performed the analyses. LC, GS-H, and VM-C developed the webtool. HN conceived the tool and supervised the work. All authors help in the writing of the paper.
Conflict of Interest Statement
The authors declare that the research was conducted in the absence of any commercial or financial relationships that could be construed as a potential conflict of interest.
Funding
This work was supported by grants from FAPESP (2012/19278-6, 2013/08216-2, 2017/05762-7, 2018/10748-6); CNPq (313662/2017-7); FONDECYT-CONICYT (11161020); and PAI-CONICYT (PAI79170021). This study was financed in part by the Coordenação de Aperfeiçoamento de Pessoal de Nível Superior – Brasil (CAPES) – Finance Code 001.
Footnotes
References
Beins, E., Ulas, T., Ternes, S., Neumann, H., Schultze, J., and Zimmer, A. (2016). Characterization of inflammatory markers and transcriptome profiles of differentially activated embryonic stem cell-derived microglia. Glia 64, 1007–1020. doi: 10.1002/glia.22979
Chen, E., Tan, C., Kou, Y., Duan, Q., Wang, Z., Meirelles, G., et al. (2013). Enrichr: interactive and collaborative HTML5 gene list enrichment analysis tool. BMC Bioinf. 14:128. doi: 10.1186/1471-2105-14-128
Desai, A., Razeghin, M., Meruvia-Pastor, O., and Peña-Castillo, L. (2017). GeNET: a web application to explore and share Gene Co-expression network analysis data. PeerJ. 5:e3678. doi: 10.7717/peerj.3678
Janova, H., Böttcher, C., Holtman, I., Regen, T., van Rossum, D., Götz, A., et al. (2015). CD14 is a key organizer of microglial responses to CNS infection and injury. Glia 64, 635–649. doi: 10.1002/glia.22955
Kitano, H. (2002). Systems biology: a brief overview. Science 295, 1662–1664. doi: 10.1126/science.1069492
Russo, P., Ferreira, G., Cardozo, L., Bürger, M., Arias-Carrasco, R., Maruyama, S., et al. (2018). CEMiTool: a Bioconductor package for performing comprehensive modular co-expression analyses. BMC Bioinf. 19:56. doi: 10.1186/s12859-018-2053-1
Sharma, A., Cinti, C., and Capobianco, E. (2017). Multitype network-guided target controllability in phenotypically characterized osteosarcoma: role of tumor microenvironment. Front. Immunol. 8:928. doi: 10.3389/fimmu.2017.00918
Tzfadia, O., Diels, T., De Meyer, S., Vandepoele, K., Aharoni, A., and Van de Peer, Y. (2016). CoExpNetViz: comparative co-expression networks construction and visualization tool. Front. Plant Sci. 6:1194. doi: 10.3389/fpls.2015.01194
Voineagu, I., Wang, X., Johnston, P., Lowe, J., Tian, Y., Horvath, S., et al. (2011). Transcriptomic analysis of autistic brain reveals convergent molecular pathology. Nature 474, 380–384. doi: 10.1038/nature10110
Wang, J., Xia, S., Arand, B., Zhu, H., Machiraju, R., Huang, K., et al. (2016). Single-cell co-expression analysis reveals distinct functional modules, co-regulation mechanisms and clinical outcomes. PLoS Comput. Biol. 12:e1004892. doi: 10.1371/journal.pcbi.1004892
Zanini, F., Szu-Yuan, P., Bekerman, E., Einav, S., and Quake, S. R. (2018). Single-cell transcriptional dynamics of flavivirus infection. Elife 7:e32942. doi: 10.7554/eLife.32942
Keywords: co-expression analysis, systems biology, transcriptomics, web tool, data integration
Citation: Cardozo LE, Russo PST, Gomes-Correia B, Araujo-Pereira M, Sepúlveda-Hermosilla G, Maracaja-Coutinho V and Nakaya HI (2019) webCEMiTool: Co-expression Modular Analysis Made Easy. Front. Genet. 10:146. doi: 10.3389/fgene.2019.00146
Edited by:
Akira Funahashi, Keio University, JapanReviewed by:
Takahiro G. Yamada, Keio University, JapanMarco Vanoni, Università degli Studi di Milano Bicocca, Italy
Copyright © 2019 Cardozo, Russo, Gomes-Correia, Araujo-Pereira, Sepúlveda-Hermosilla, Maracaja-Coutinho and Nakaya. This is an open-access article distributed under the terms of the Creative Commons Attribution License (CC BY). The use, distribution or reproduction in other forums is permitted, provided the original author(s) and the copyright owner(s) are credited and that the original publication in this journal is cited, in accordance with accepted academic practice. No use, distribution or reproduction is permitted which does not comply with these terms.
*Correspondence: Helder I. Nakaya, aG5ha2F5YUB1c3AuYnI=