Abstract
Triple-negative breast cancer (TNBC) is a special subtype of breast cancer that is difficult to treat. It is crucial to identify breast cancer-related genes that could provide new biomarkers for breast cancer diagnosis and potential treatment goals. In the development of our new high-risk breast cancer prediction model, seven raw gene expression datasets from the NCBI gene expression omnibus (GEO) database (GSE31519, GSE9574, GSE20194, GSE20271, GSE32646, GSE45255, and GSE15852) were used. Using the maximum relevance minimum redundancy (mRMR) method, we selected significant genes. Then, we mapped transcripts of the genes on the protein-protein interaction (PPI) network from the Search Tool for the Retrieval of Interacting Genes (STRING) database, as well as traced the shortest path between each pair of proteins. Genes with higher betweenness values were selected from the shortest path proteins. In order to ensure validity and precision, a permutation test was performed. We randomly selected 248 proteins from the PPI network for shortest path tracing and repeated the procedure 100 times. We also removed genes that appeared more frequently in randomized results. As a result, 54 genes were selected as potential TNBC-related genes. Using 14 out the 54 genes, which are potential TNBC associated genes, as input features into a support vector machine (SVM), a novel model was trained to predict high-risk breast cancer. The prediction accuracy of normal tissues and TNBC tissues reached 95.394%, and the predictions of Stage II and Stage III TNBC reached 86.598%, indicating that such genes play important roles in distinguishing breast cancers, and that the method could be promising in practical use. According to reports, some of the 54 genes we identified from the PPI network are associated with breast cancer in the literature. Several other genes have not yet been reported but have functional resemblance with known cancer genes. These may be novel breast cancer-related genes and need further experimental validation. Gene ontology (GO) enrichment and Kyoto Encyclopedia of Genes and Genomes (KEGG) enrichment analyses were performed to appraise the 54 genes. It was indicated that cellular response to organic cyclic compounds has an influence in breast cancer, and most genes may be related with viral carcinogenesis.
Introduction
Breast cancer is a malignant tumor that is highly prevalent among women worldwide. In recent years, the incidence rate has increased significantly. According to estrogen receptor (ER), progesterone receptor (PR), and human epidermal growth factor receptor 2 (HER-2) status, breast cancer can be classified into four categories. Triple-negative breast cancer (TNBC), one of the more specialized types of breast cancer, is defined as the lack of expression of the ER and PR, as well as breast cancer that lacks HER-2 overexpression or gene amplification. TNBC is more common in young women, with large tumors, high lymphatic metastasis rate, and high clinical stage. The 5-year recurrence rate is high, and visceral metastases such as liver and lung metastasis are more common. Compared with other types of breast cancer, TNBC has characteristics of rapid tumor growth, early recurrence, easy metastasis, and so on (Prat et al., 2013). Up to now, the genes related to this disease are poorly understood.
Triple-negative breast cancer accounts for about 15–25% of all breast cancers. The identification of disease-related genes and prediction of high-risk breast cancer patients have become important problems. Genes that are highly associated with TNBC can be found using gene expression profiles. However, there are still some problems in the current methods of predicting protein function using high-throughput protein interaction data. It usually has a high false positive rate, and the reliability of functional prediction results is reduced (Li et al., 2012b; Oliver et al., 2015).
In recent years, the continuous accumulation of protein interaction data has made it possible to analyze and predict protein functions at the system level through the protein-protein interaction (PPI) network. Nabieva et al. (2005) proposed the “guilt-by-association rule” (GBA), which states that interacting proteins have the same or similar functions, which suggests that protein function can be predicted by protein interactions.
In this study, we identified TNBC-related genes by a computational method. A weighted functional PPI network was integrated, which can overcome the disadvantages of that by only using the gene expression profiles. We also previously successfully applied such an integrating method to gene function prediction and to the identification of novel genes of various kinds of diseases, such as influenza A/H7N9 virus infection (Ning et al., 2014), colorectal cancer (Li et al., 2012b), lung cancer (Li et al., 2013b), colorectal cancer (Li et al., 2013a), hepatitis B virus (HBV) infection-related hepatocellular carcinoma (Jiang et al., 2013), retinoblastoma (Li et al., 2012c), Ebola virus (Cao et al., 2017), etc.
Materials and Methods
The whole process of our study is illustrated in Figure 1. Details are presented in the following sub-sections.
FIGURE 1
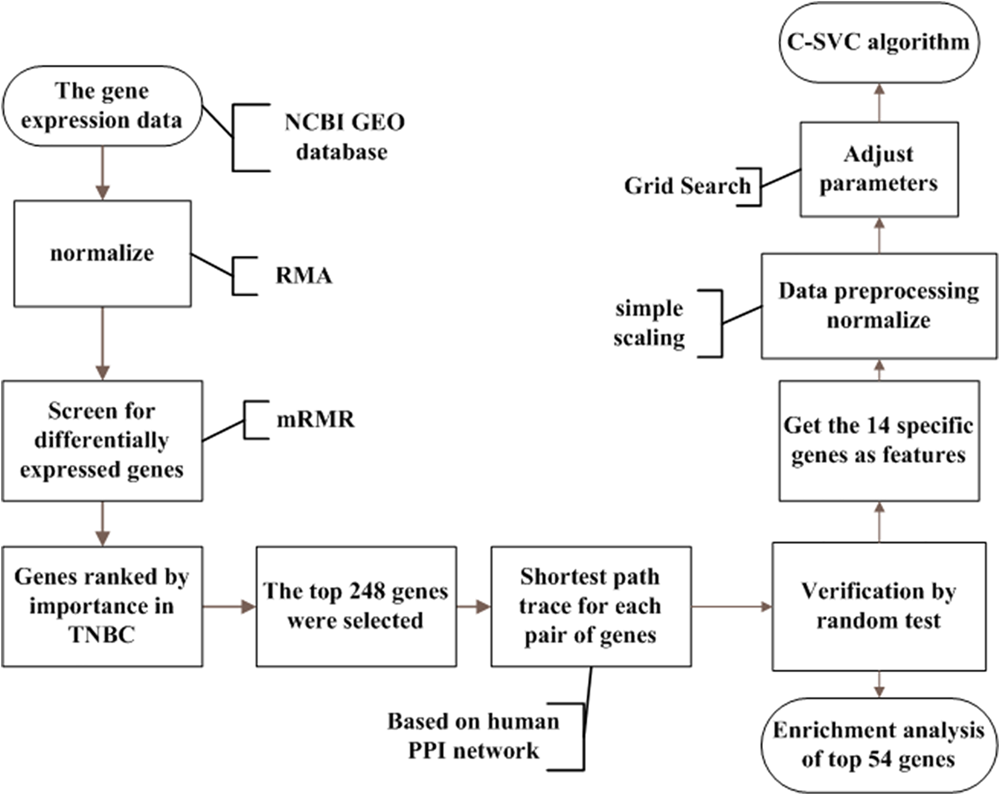
The analysis flowchart for this study. This method integrated breast cancer gene expression data and PPI data. Firstly, we regard each gene as a feature in the data and used mRMR to rank the importance of the genes. Then we selected the top 248 genes from the mRMR results. We searched the shortest paths between every pair of the 248 coding proteins by the Dijkstra algorithm in the PPI network. Shortest path proteins were retrieved and were ranked in descending order. After that, 54 of the shortest path proteins were selected and were considered as the potential triple-negative breast cancer-related genes. Finally, using the C-SVC model for classification in order to achieve satisfactory results, we used the grid Search method to select the appropriate parameters.
Dataset
Expression profiles from datasets GSE31519, GSE9574, GSE20194, GSE20271, GSE45255, and GSE15852 were obtained from the GEO database1. The dataset involves 319 sample chips with 101 normal breast tissue samples and 218 TNBC tissue samples (including 21 Stage II samples and 101 Stage III samples).
In this study, the robust multi-array average (RMA) method in “limma” in R was used to normalize microarray data and to perform a log2 transformation of chip data. In total, 12,437 genes were obtained. RMA uses a multi-chip model that requires standardization of all chips together. The expression value is estimated based on a stochastic model employed by the perfect match (PM) signal distribution. It is currently the most common chip data preprocessing method. RMA is commonly used in the literature. This method has also been used in many other biomedical research problems, such as when analyzing diabetic nephropathy (Cohen et al., 2008), the crosstalk between B16 melanoma cells and B-1 lymphocytes (Xander et al., 2013), colon cancer (Melo et al., 2013), etc.
The mRMR Method
We employed the mRMR method (Peng et al., 2005; Li et al., 2012a,b; Zhang et al., 2012; Zou et al., 2016b; Su et al., 2018) to rank the importance of all 12,437 genes examined. In such a procedure, each gene was regarded as a feature. The Maximum Relevance criterion selects features most important in discriminating TNBC samples and controls. The Minimum Redundancy criterion excludes redundant features among the selected ones. In an mRMR procedure, a value A-B is calculated for each feature, in which value A is represented for the relevance and value B for the redundancy of the feature. Then the features are ranked by their A-B values in descending order to reflect the importance to the target. The most important feature is ranked at the top (Peng et al., 2005; Li et al., 2012a,b; Zhang et al., 2012; Zou et al., 2016b).
Two ordered lists were generated by the mRMR method, one was called the MaxRel table, and the other was called the mRMR table. In the MaxRel table, all the features were ranked only by the Maximum Relevance criterion. In the mRMR table, they were ranked by the mRMR criterion, i.e., a feature with a smaller index in such a table could be more important since it has a better trade-off between the maximum relevance and the minimum redundancy. In this study, we selected the top 248 features from the mRMR table, with which the corresponding 248 genes were regarded as significantly differentially expressed genes from the expression profiles and were analyzed in the downstream procedures.
PPI Network From STRING
The STRING database (version 10.0)2 (Franceschini et al., 2013) is a database for searching for known and predicted interactions between proteins. The related interactions mentioned herein include direct and indirect relationships between proteins. The interacting protein can be mapped to a weight network in STRING. In such a network, proteins are denoted as nodes and the interaction of every two proteins is given as an edge marked with a confidence score. If the confidence score is higher, they may have more analogous functions (Kourmpetis et al., 2010; Ng et al., 2010; Szklarczyk et al., 2011). In this study, we used a d value instead of a confidence score (s) for the weight of each interaction edge. According to the equation d = 1,000-s, d was calculated. Therefore, the d value can be considered to represent the protein distances to each other; a smaller distance value indicates the protein pair has a higher interaction confidence score.
In this study, the human PPI data in the STRING database were selected as the data source, and there are 8,548,002 pairs of related interaction forces. The ID of the human species is 9,606.
Shortest Path Tracing
Interactions between every protein pair were analyzed in a graph. In this study, the R package “STRINGdb” was used to map the corresponding protein IDs of the top 248 genes selected by mRMR. The betweenness of a shortest path protein is the number of shortest paths across the protein. Then, the shortest path proteins were ranked by betweenness in descending order. The proteins whose betweenness was greater than 3,000 were picked out and their corresponding genes were treated as breast cancer-related genes. The Dijkstra algorithm served to find the shortest path in the graph G between two given proteins, which was implemented in the R package “igraph” (Csardi and Nepusz, 2006). In order to ensure the validity and precision of our results, we randomly chose 248 proteins in the PPI network for shortest path tracing and repeated the procedure 100 times, and a permutation test was performed. Then we removed 5 genes that appear more frequently in randomized results.
The C-SVC Algorithm
The support vector machine (SVM) method largely overcomes the dimensional disaster and local minimization of feature attributes in traditional machine learning and solves small samples. There are many advantages in non-linear and high-dimensional pattern recognition, which have received more and more attention in the fields of biomedicine and bioinformatics. Therefore, in the field of health care, an improved SVM algorithm for the diagnosis of breast cancer diseases was applied by Zhang et al. (2013). A new data feature dimension reduction method for lymphatic diseases was proposed by Azar et al. (2014). Auxiliary diagnosis has achieved a certain improvement in diagnostic efficiency (Yuan et al., 2010; Mokeddem et al., 2013).
The Cost Support Vector Classification (C-SVC) is a method of SVM classification. It introduces penalty parameter C for SVM classification.
subject to
Its dual is:
subject to yTα = 0
where e is the vector of all ones, C > 0 is the upper bound, Q is an n by positive semidefinite matrix, , where is the kernel. Here, training vectors are implicitly mapped into a higher (maybe infinite) dimensional space by the function:
The C-SVC is capable of categorizing two types of breast tissue (Jiang and Yao, 2016).
Data Preprocessing for the Prediction Model
To test the accuracy of the C-SVC-based high-risk breast cancer prediction model, we divided the samples into two groups, one for normal tissue and breast cancer tissue, and the other for Stage II and Stage III breast cancers.
Scaling data according to the Equation (4):
where y is the data before scaling, y′ is the scaled data; lower is the lower bound of the data specified in the parameter, upper is the upper bound of the data specified in the parameter; min is the minimum of all training data, and max is the maximum value of all training data.
The preprocessing of the data has a great influence on the final classification accuracy. This paper will compare the different preprocessing methods and finally choose the method with high classification accuracy to establish the model.
Parameter Optimization
The choice of a kernel function is important. In a specific problem, several kernel functions should be applied in order to choose the best one, obtaining the highest accuracy (Deng et al., 2016). Both the type of kernel function and other parameters such as penalty parameter C and γ in kernel functions impact the performance. Thus, we use the grid search method to select the appropriate parameters.
Results
The Top 54 Genes on PPI Shortest Paths
After removing the five randomized genes from the intersection of the shortest path results for normal breast and TNBC tissues, a total of 54 genes associated with TNBC were obtained, as shown in Table 1. Similarly, we mapped the PPI networks of these 54 genes using the STRINGdb package in R, as shown in Figure 2.
Table 1
| hgnc_symbol | ensp | Betweenness | Reference |
|---|---|---|---|
| MAGOH | ENSP00000360525 | 1777 | Kataoka et al., 2001 |
| CBL | ENSP00000264033 | 1548 | Thien and Langdon, 2001 |
| RPS3 | ENSP00000433821 | 1380 | Jang et al., 2004 |
| FGFR1 | ENSP00000393312 | 1286 | Pirvola et al., 2002 |
| RHOA | ENSP00000400175 | 1237 | Strutt et al., 1997 |
| EP300 | ENSP00000263253 | 1048 | Gayther et al., 2000 |
| RAC1 | ENSP00000348461 | 871 | Gu et al., 2003 |
| CDK1 | ENSP00000378699 | 852 | Santamaría et al., 2007 |
| CDH1 | ENSP00000261769 | 848 | Konishi et al., 2004 |
| EGFR | ENSP00000275493 | 815 | Kobayashi et al., 2005 |
| JUN | ENSP00000360266 | 811 | Curran and Franza, 1988 |
| NOTCH1 | ENSP00000277541 | 803 | Nicolas et al., 2003 |
| HCFC1 | ENSP00000309555 | 795 | Jolly et al., 2015 |
| OGT | ENSP00000362824 | 786 | Sodi et al., 2015 |
| PPP1CB | ENSP00000296122 | 786 | Alquobaili et al., 2009 |
| CFTR | ENSP00000003084 | 767 | Zhang et al., 2013 |
| ERBB2 | ENSP00000269571 | 763 | Blackwell et al., 2010 |
| HIF1A | ENSP00000338018 | 762 | Ponente et al., 2017 |
| ESR1 | ENSP00000206249 | 745 | Robinson et al., 2013 |
| HDAC1 | ENSP00000362649 | 705 | Kawai et al., 2003 |
| RPS27A | ENSP00000272317 | 672 | Wang et al., 2014 |
| RELA | ENSP00000384273 | 658 | Xia et al., 2010 |
| CREB1 | ENSP00000387699 | 582 | Chhabra et al., 2007 |
| CCNB1 | ENSP00000256442 | 565 | Ding et al., 2014 |
| MAPK8 | ENSP00000353483 | 561 | Slattery et al., 2015 |
| SRC | ENSP00000350941 | 559 | Zhang et al., 2013 |
| OPTN | ENSP00000263036 | 558 | Jeffrey et al., 1999 |
| ITGB1 | ENSP00000303351 | 553 | Yang et al., 2016 |
| RPS2 | ENSP00000341885 | 549 | Douglas, 1997 |
| NFKB1 | ENSP00000226574 | 512 | Curran et al., 2002 |
| MT-ATP6 | ENSP00000354632 | 508 | You et al., 2009 |
| MT-CO3 | ENSP00000354982 | 508 | |
| ATP5A1 | ENSP00000282050 | 508 | Lotz et al., 2014 |
| WDR5 | ENSP00000351446 | 466 | Dai et al., 2015 |
| CREBBP | ENSP00000262367 | 466 | Gupta et al., 2014 |
| RAN | ENSP00000376176 | 445 | Yuen et al., 2013 |
| HNRNPK | ENSP00000365439 | 429 | |
| BTRC | ENSP00000359206 | 408 | |
| PXN | ENSP00000228307 | 406 | Sp et al., 2017 |
| CYC1 | ENSP00000317159 | 394 | Han et al., 2016 |
| CYCS | ENSP00000307786 | 391 | |
| SHC1 | ENSP00000401303 | 383 | Wagner et al., 2004 |
| MEF2A | ENSP00000346389 | 381 | |
| NCOR2 | ENSP00000384018 | 362 | Green et al., 2008 |
| LIN7A | ENSP00000447488 | 347 | Gruel et al., 2016 |
| PCNA | ENSP00000368438 | 336 | Kato et al., 2002 |
| YAP1 | ENSP00000282441 | 335 | Yu et al., 2013 |
| MPP5 | ENSP00000261681 | 331 | Van Rossum et al., 2006 |
| AMOT | ENSP00000361027 | 331 | Zhang and Fan, 2015 |
| RANGAP1 | ENSP00000348577 | 323 | |
| FOS | ENSP00000306245 | 316 | Langer et al., 2006 |
| STAT1 | ENSP00000354394 | 313 | Khodarev et al., 2010 |
| AR | ENSP00000363822 | 308 | Subik et al., 2010 |
| SUMO2 | ENSP00000405965 | 297 | Subramonian et al., 2014 |
The 54 candidate breast cancer-related genes and betweenness.
FIGURE 2
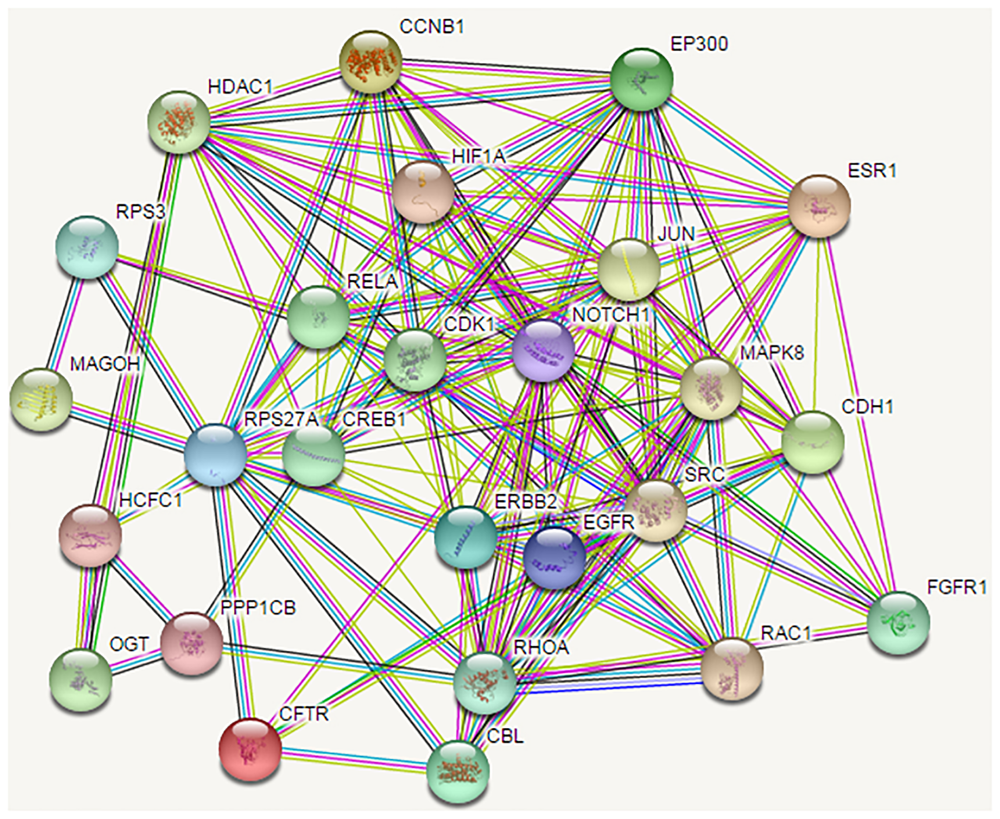
The protein-protein interaction network of the proteins encoded by the 54 candidate genes. Shortest path proteins were retrieved from the shortest paths between every protein pair coded by the top 248 genes selected from the mRMR table. The shortest path between every protein pair was searched by the Dijkstra algorithm in the network. Finally, the 54 shortest path proteins were obtained, the related genes of which were considered as candidate genes. The PPI network of the 54 shortest path proteins is depicted, in which the nodes represent proteins, and the lines between nodes represent protein interactions.
Function Gene Enrichment Analysis
In this study, we transferred the disease-related genes into its corresponding EntrezID by using “org.Hs.eg.db” in R. Then, we analyzed the functional enrichment of the 54 candidate genes in KEGG pathways and GO terms using the R package “clusterProfilter.” The GO enrichment analysis includes three categories: cellular component (CC), molecular function (MF), and biological process (BP). In our study, we only focus on BP enrichment due to its importance. These terms were ranked by the enrichment p-value. The Benjamin multiple testing correction method was used to regulate family-wide false discovery rate under a certain rate (e.g., ≤0.01) to correct the enrichment p-value (Benjamini and Yekutieli, 2001). Results of the GO enrichment analysis ranked by p-value were provided in Table 2 and result of the KEGG enrichment analysis ranked by p-value was provided in Table 3, respectively. The top 10 terms of the enrichment results are depicted in Figure 3, 4.
Table 2
| Go term entry ID | Description | p-value | Count |
|---|---|---|---|
| GO:0071407 | Cellular response to organic cyclic compound | 1.217E-12 | 16 |
| GO:0006979 | Response to oxidative stress | 9.108E-11 | 13 |
| GO:0048511 | Rhythmic process | 1.467E-10 | 12 |
| GO:0071396 | Cellular response to lipid | 1.897E-10 | 14 |
| GO:0048732 | Heart development | 2.055E-10 | 14 |
| GO:0009612 | Gland development | 2.349E-10 | 13 |
| GO:0009314 | Response to mechanical stimulus | 3.549E-10 | 10 |
| GO:0009314 | Response to radiation | 3.666E-10 | 13 |
| GO:0038095 | Fc-epsilon receptor signaling pathway | 5.244E-10 | 9 |
| GO:0000302 | Response to reactive oxygen species | 6.401E-10 | 10 |
Results of the GO enrichment analysis.
Table 3
| KEGG term entry ID | Description | p-value | Count |
|---|---|---|---|
| hsa05200 | Pathways in cancer | 7.835E-13 | 20 |
| hsa05167 | Kaposi’s sarcoma-associated herpesvirus infection | 1.406E-10 | 13 |
| hsa05161 | Hepatitis B | 2.393E-10 | 12 |
| hsa05168 | Herpes simplex infection | 3.262E-10 | 13 |
| hsa05203 | Viral carcinogenesis | 9.155E-10 | 13 |
| hsa04520 | Adherens junction | 1.430E-09 | 9 |
| hsa05215 | Prostate cancer | 7.949E-09 | 9 |
| hsa04024 | cAMP signaling pathway | 9.423E-09 | 12 |
| hsa05205 | Proteoglycans in cancer | 1.249E-08 | 12 |
| hsa01522 | Endocrine resistance | 1.915E-08 | 9 |
Results of the KEGG enrichment analysis.
FIGURE 3

The GO enrichment analysis. The top 10 terms from the GO enrichment analysis ranked by p-value, shown as a bar chart. The GO terms by name are listed on the y-axis. The shared number of terms is shown as the length of histogram. The different colors represent the different p-values.
FIGURE 4
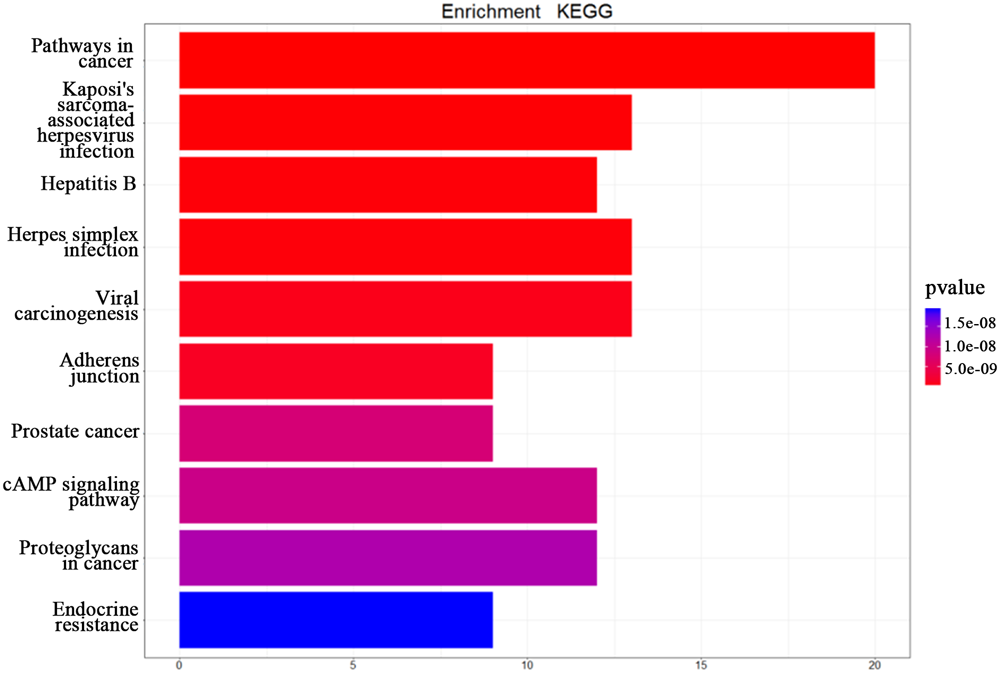
The KEGG enrichment analysis. The top 10 pathways from the KEGG enrichment analysis ranked by p-value, shown as a bar chart. The terms of the KEGG pathways are depicted on the y-axis. The shared number of pathways is shown as the length of histogram. The different colors represent the different p-values.
High-Risk Breast Cancer Prediction
In this study, we implemented the C-SVC algorithm in the Matlab 2015a environment. The radial basis function (RBF) kernel function was employed in this study since the function has been widely used in various bioinformatics prediction problems and usually yields the best results compared to other types of kernel functions (Li et al., 2011; Song et al., 2011; Khan et al., 2016). In this study, we also employed other kernel functions on the same prediction task and found that the RBF performed the best (data not shown). The grid search method was used and the results were verified by the ten-fold cross-validation method. The data in the experiment was divided into 10 sets of similar size, and 9 of them were used in turn as the training set. One set was used as the test to calculate the corrections and errors of the prediction. As a result, the normal tissue and TNBC tissue prediction accuracy reached 95.394%, and the Stage II and Stage III TNBC predictions reached 86.598%, as shown in Table 4. It is indicated that based on the 54 genes as features, the C-SVC algorithm can accurately predict normal tissue and TNBC, as well as the stage data for TNBC.
Table 4
| ACC | Precision | Recall | F-measure | |
|---|---|---|---|---|
| Normal and TNBC | 95.394% | 88.889% | 100% | 94.118% |
| II and III | 86.597% | 80.952% | 100% | 89.474% |
The performance of the high-risk breast cancer classification model.
The experiment result shows its upper recall and precision rate. Its recall rate reaches 100%. The precision and F-measure are also above 80%.
Discussion
Genes Identified From PPI Shortest Paths
As can be seen from Table 1, some genes are associated with TNBC, such as FGFR1, EGFR, NOTCH1, ERBB2, AR, and so on.
Among these genes, CBL, FGFR1, RHOA, EP300, RAC1, CDH1, EGFR, NOTCH1, ERBB2, HIF1A, HDAC1, CCNB1, SRC, ITGB1, NFKB1, CREBBP, PCNA, STAT, and AR are reported to be related to TNBC.
The Migration and Invasion
We found that specific genes such as CBL, RHOA, EP300, RAC1, CDK1, and CDH1 are involved in the migration and invasion of breast cancer.
CBL is a proto-oncogene, and it is indicated that CBL is associated with the development of leukemia. It has been found that this gene is mutated or translocated in many cancers (Choi et al., 2003). CBL encodes a protein which is one of the enzymes required to target substrate degradation through the proteasome. It has been found that the gene mutation or translocation occurs in many cancers, such as acute myeloid leukemia. So far, there are some studies suggesting that CBL is associated with breast cancer or TNBC. It is reported by Kales et al. that low expression of Cbl-c is associated with breast tumors (Kales et al., 2014). It is shown that this gene is involved in the invasion of cancer. The study by Crist et al. showed that a diminished regulatory capacity of Cbl-c is a recurrent event that may play a role in the invasive nature of colorectal cancer cells (Cristóbal et al., 2014). From these studies, it can be speculated that CBL is associated with invasiveness of TNBC.
In the Rho family, RHOA is a small GTPase protein. The overexpression of this gene is related to tumor cell proliferation and metastasis. It is shown that the RhoA pathway mediates the independent invasion of MMP-2 and MMP-9 in TNBS cell lines (Fagan-Solis et al., 2013). RHOA is the target of miR-146a to prevent cell invasion and metastasis in breast cancer (Liu et al., 2016). Lee et al. showed that ODAM expression maintains breast cancer cell adhesion and thus prevents breast cancer cell metastasis by modulating RhoA signaling in breast cancer cells (Lee et al., 2015). The study by Kwon et al. showed that SMURF1 acts in EGF-induced migration and invasion of breast cancer cells (Kwon et al., 2013). In conclusion, RHOA is involved in the invasion of TNBC cells.
EP300 (histone acetyltransferase p300) encodes the p300 transcriptional coactivator of the adenovirus E1A-associated cell. Studies by Cho et al. (2015) showed that p300 and MRTF-A synergistically enhance the expression of migration-associated genes in breast cancer cells. In addition, it is report that the EP300-G211S mutation correlates with a low mutation load in TNBC patients (Bemanian et al., 2017). Therefore, EP300 is directly related to TNBC.
The RAC1 gene encodes a protein belonging to the GTPase of the small GTP-binding protein RAS superfamily. It was found that RASAL2 activates RAC1 to promote TNBC (Feng et al., 2014). Studies by De et al. have shown that the caspase-β-catenin-RAC1 cascade suggests a link between RAC1 and integrin-related metastasis in TNBC (De et al., 2017). In addition, studies by De et al. (2017) observed that two different mTORC2-dependent signaling pathways can be fused with RAC1 to drive breast cancer metastasis. Therefore, RAC1 may play an important clinical role for the treatment of TNBC.
CDH1, the gene encoding E-cadherin (E-cadherin), is a calcium-dependent cell adhesion protein belonging to the cadherin family. It is involved in the process of tumor proliferation, invasion, and metastasis. Therefore, it is anticipated that gene function defects will promote the occurrence and development of cancer. It is shown that 1α, 25-dihydroxyvitamin D3 induces E-cadherin expression in TNBC cells through demethylation of the CDH1 promoter (Lopes et al., 2012).
Posttranscriptional Regulation of Gene Expression
We found that FGR1, MAGOH, RPS3, and CDK1 are all involved in posttranscriptional regulation of gene expression.
FGFR1 is one of the fibroblast growth factor (FGF) encoding genes. Cheng et al. suggested that upregulation of FGFR1 expression in TNBC cells may be treated as a potential therapeutic target (Cheng et al., 2015). Vinayak et al. (2013) reported that FGF pathways have been implicated in breast tumorigenesis as a potential target for TNBC. In addition, there is some research indicating that it is related to breast cancer, as FGFR1 was found to be associated with luminal A breast cancer (Zou et al., 2016a). FGFR is also helpful in the targeted therapy of breast cancer (Ye et al., 2014). Amplification of FGFR1 also occurs in almost 10% of ER-positive breast cancers, particularly luminol type B breast cancer subtypes. In summary, FGFR1 and TNBC are closely related.
MAGOH ranked first, indicating it plays an important role in TNBC. A protein encoded by the gene is the core component of the composite exon. There is some evidence showing that it is associated with TNBC. This gene could possibly be treated as a potential specific gene for TNBC.
The RPS3 gene encodes the 40S ribosomal protein S3 domain. Kim et al. have shown that the rpS3 protein is a marker of malignancy (Kim et al., 2013). It is reported that it is mainly associated with lung cancer. Slizhikova et al. (2005) have shown that this gene is a marker of human squamous cell lung cancer.
CDK1 is a set of Ser/Thr kinase systems corresponding to cell cycle progression. It was shown by Xia et al. (2014) that the CDK1 inhibitor RO3306 potentiates BRCA-negative breast cancer cell responses to PARP inhibitors. CDK1 inhibition may have a role in the adjuvant treatment of TNBC.
Additionally, some genes have also been reported to have a direct relationship with TNBC. In a nutshell, most of the specific genes found in this study have been reported to be associated with TNBC, while others are rarely reported to have a direct relationship with TNBC, suggesting that they could be new specific genes and potentially be new biomarkers for breast cancer prevention and treatment.
Candidate Gene Enrichment Analysis
We used the ‘clusterProfilter’ package in R for the enrichment analysis of the 54 candidate genes, ranking the GO terms and KEGG pathways by p-value in ascending order. In the present study, the p-value was calculated for each KEGG and GO term.
In this study, we only focused on BP. The top 10 terms ranked by p-value are shown in Figure 2.
As shown in Figure 2, “cellular response to organic cyclic compound (GO:0071407)” was ranked first. It is well known that any process leading to changes in cell state or activity (changes in movement, secretion, enzyme production, gene expression, etc.) is the result of stimulation by organic cyclic compounds. It proved the importance of this BP in TNBC. Both “response to oxidative stress” (GO: 0006979) and “response to reactive oxygen species” (GO: 0000302) are related to the reaction of oxygen. “Rhythmic process” (GO:0048511), “cellular response to lipid” (GO:0071396), “heart development” (GO: 0007507), “gland development” (GO:0048732), and “glandular development” (GO:0048732) are also associated with TNBC. In addition, the two responses “response to mechanical stimulus” (GO: 0009612) and “response to radiation” (GO: 0009314) are also associated with TNBC, as well as the “Fc-epsilon receptor signaling pathway” (GO: 0038095). The above entry comment may provide some new ideas for TNBC.
The top 10 terms of KEGG enrichment ranked by p-value are depicted in Figure 3. It is clear that “pathways in cancer” (hsa05200) is ranked at the top, demonstrating its importance in TNBC.
In addition, “Kaposi’s sarcoma-associated herpesvirus infection” (hsa05167), “hepatitis B” (hsa05161), “herpes simplex infection” (hsa05168), and “viral carcinogenesis” (hsa05203) are associated with viral infection. Moreover, “adherens junction” (hsa04520), “prostate cancer” (hsa05215), “cAMP signaling pathway” (hsa04024), “proteoglycans in cancer” (hsa05205), and “endocrine resistance” (hsa01522) are also associated with the occurrence and development of TNBC. Huo et al. (2012) suggested that breast cancer and viral infection were statistically significant. From the enrichment analysis above it can be concluded that TNBC may be related to viral carcinogenesis.
Advantages of the Method and Extension
It is anticipated that our model may become a useful tool for studying cancers from the angle of genes and networks. It was observed by analyzing the results that the specific genes, the biological functions of the significant genes, and the pathways enriched would contribute to cancer diagnosis and cancer predictions. Furthermore, the current model can also be used to solve many other disease prediction problems, and we also have many similar applications in our previous studies, such as for Ebola (Cao et al., 2017) and for A/H7N9 (Zhang et al., 2014). These studies show promising results and prove the efficiency of the proposed methods. However, this method has limitations on diseases with insignificant genes, which may lead to bias in prediction results. Additionally, insufficient samples will also affect the results. Moreover, genes identified from computational methods should be verified by further experimental studies.
In all, results may shed some light on the understanding of the mechanism of the tumorigenesis of breast cancer, providing new references for research into the disease and for the development of new strategies for clinical therapies as well as providing potential for future experimental validation.
Conclusion
In this study, we developed a novel method to identify TNBC-related genes. This method integrated breast cancer gene expression data and PPI data. Many of the identified genes were reported to be related to TNBC in the literature. Most of these genes are related with invasion and metastasis. GO enrichment analysis indicated that the cellular response to organic cyclic compounds have an influence in breast cancer. KEGG pathway analysis indicated that most of these 54 genes may be related with viral carcinogenesis. We believe that these findings will provide some insights for breast cancer therapy and drug development.
We also developed a new SVM method based on the C-SVC for predicting high-risk breast cancer. The prediction accuracy of normal tissues and TNBC tissues reached 95.394%, and the predictions of Stage II and Stage III TNBC reached 86.598%.
Our method could be helpful for identifying novel cancer-related genes and assisting doctors in medical diagnosis. Identification of TNBC genes and a novel high-risk breast cancer prediction model development based on PPI data and SVM method may have certain theoretical significance and practical value in the application of cancer diagnosis. Recently, link prediction paradigms have been applied in the prediction of disease genes (Zeng et al., 2017a,b), circular RNAs (Zeng et al., 2017c), and miRNAs (Liu et al., 2016). Additionally, computational intelligence such as neural networks (Cabarle et al., 2017) can be applied in this field.
Statements
Data availability statement
The datasets generated for this study can be found in NCBI GEO, GSE31519, GSE9574, GSE20194, GSE20271, GSE32646, GSE45255, and GSE15852.
Author contributions
NZ conceived and supervised the project. YG and ML were responsible for the design, data preprocessing, computational analyses, and drafted the manuscript with revisions provided. Y-MF, NZ, and ML participated in the design of the study and performed the computational analysis. All authors read and approved the final manuscript.
Conflict of interest
The authors declare that the research was conducted in the absence of any commercial or financial relationships that could be construed as a potential conflict of interest.
References
1
AlquobailiF.MillerS. A.MuhieS.DayA.JettM.HammamiehR. (2009). Estrogen receptor-dependent genomic expression profiles in breast cancer cells in response to fatty acids.J. Carcinog.8:17. 10.4103/1477-3163.59539
2
AzarA. T.ElshazlyH. I.HassanienA. E.ElkoranyA. M. (2014). A random forest classifier for lymph diseases.Comput. Methods Programs Biomed.113465–473. 10.1016/j.cmpb.2013.11.004
3
BemanianV.SauerT.ToumaJ.VetvikK. M.NooneJ. C.KristensenV. N.et al (2017). Abstract LB-027: the EP300-G211S mutation is highly associated with a low mutational burden in triple-negative breast cancer patients.Cancer Res.77(13 Suppl.):LB-027-LB-027. 10.1158/1538-7445
4
BenjaminiY.YekutieliD. (2001). The control of the false discovery rate in multiple testing under dependency.Ann. Statist.291165–1188. 10.1186/1471-2105-9-114
5
BlackwellK. L.BursteinH. J.StornioloA. M.RugoH.SledgeG.KoehlerM.et al (2010). Randomized study of Lapatinib alone or in combination with trastuzumab in women with ErbB2-positive, trastuzumab-refractory metastatic breast cancer.J. Clin. Oncol.281124–1130. 10.1200/JCO.2008.21.4437
6
CabarleF. G. C.AdornaH. N.JiangM.ZengX. (2017). Spiking neural p systems with scheduled synapses.IEEE Trans. Nanobioscience16792–801. 10.1109/TNB.2017.2762580
7
CaoH. H.ZhangY. H.ZhaoJ.ZhuL.WangY.LiJ. R.et al (2017). Prediction of the ebola virus infection related human genes using protein-protein interaction network.Comb. Chem. High Throughput Screen.20638–646. 10.2174/1386207320666170310114816
8
ChengC. L.ThikeA. A.TanS. Y. J.ChuaP. J.BayB. H.TanP. H. (2015). Expression of FGFR1 is an independent prognostic factor in triple-negative breast cancer.Breast Cancer Res. Treat.15199–111. 10.1007/s10549-015-3371-x
9
ChhabraA.FernandoH.WatkinsG.ManselR. E.JiangW. G. (2007). Expression of transcription factor CREB1 in human breast cancer and its correlation with prognosis.Oncol. Rep.18953–958. 10.3892/or.18.4.953
10
ChoM. H.ParkJ. H.ChoiH. J.ParkM. K.WonH. Y.ParkY. J.et al (2015). DOT1L cooperates with the c-myc-p300 complex to epigenetically derepress CDH1 transcription factors in breast cancer progression.Nat. Commun.6:7821. 10.1038/ncomms8821
11
ChoiJ. H.BaeS. S.ParkJ. B.HaS. H.SongH.KimJ. H.et al (2003). Cbl competitively inhibits epidermal growth factor-induced activation of phospholipase C-gamma1.Mol. Cells15245–255.
12
CohenC. D.LindenmeyerM. T.EichingerF.HahnA.SeifertM.MollA. G.et al (2008). Improved elucidation of biological processes linked to diabetic nephropathy by single probe-based microarray data analysis.PLoS One3:e2937. 10.1371/journal.pone.0002937
13
CristóbalI.MansoR.RincónR.CaramésC.Madoz-GúrpideJ.RojoF.et al (2014). Up-regulation of c-Cbl suggests its potential role as oncogene in primary colorectal cancer.Int. J. Colorectal Dis.29:641. 10.1007/s00384-014-1839-5
14
CsardiG.NepuszT. (2006). The igraph software package for complex network research.Inter J. Complex Syst.16951–9.
15
CurranJ. E.WeinsteinS. R.GriffithsL. R. (2002). Polymorphic variants of NFKB1 and its inhibitory protein NFKBIA, and their involvement in sporadic breast cancer.Cancer Lett.188103–107. 10.1016/S0304-3835(02)00460-3
16
CurranT.FranzaB. R.Jr. (1988). Fos and Jun: the AP-1 connection.Cell55395–397. 10.1016/0092-8674(88)90024-4
17
DaiX.GuoW.ZhanC.LiuX.BaiZ.YangY. (2015). WDR5 expression is prognostic of breast cancer outcome.PLos One10:e0124964. 10.1371/journal.pone.0124964
18
DeP.CarlsonJ. H.JeppersonT.WillisS.Leyland-JonesB.DeyN. (2017). RAC1 GTP-ase signals wnt-beta-catenin pathway mediated integrin-directed metastasis-associated tumor cell phenotypes in triple negative breast cancers.Oncotarget83072–3103. 10.18632/oncotarget.13618
19
DengX.LanY.HongT.ChenJ. (2016). Citrus greening detection using visible spectrum imaging and C-SVC.Comput. Electron. Agric.130177–183. 10.1016/j.compag.2016.09.005
20
DingK.LiW.ZouZ.ZouX.WangC. (2014). CCNB1 is a prognostic biomarker for ER+ breast cancer.Med. Hypotheses83359–364. 10.1016/j.mehy.2014.06.013
21
DouglasR. E.Jr. (1997). RPS2 Proposal submission software: testing and distribution of periodically updated software.Bull. Am. Astron. Soc.29:1238.
22
Fagan-SolisK. D.SchneiderS. S.PentecostB. T.BentleyB. A.OtisC. N.GierthyJ. F.et al (2013). The RhoA pathway mediates MMP-2 and MMP-9-independent invasive behavior in a triple-negative breast cancer cell line.J. Cell. Biochem.1141385–1394. 10.1002/jcb.24480
23
FengM.BaoY.LiZ.LiJ.GongM.LamS.et al (2014). RASAL2 activates RAC1 to promote triple-negative breast cancer progression.J. Clin. Invest.1245291–5304. 10.1172/JCI76711
24
FranceschiniA.SzklarczykD.FrankildS.KuhnM.SimonovicM.RothA.et al (2013). STRING v9. 1: protein-protein interaction networks, with increased coverage and integration.Nucleic Acids Res.41D808–D815. 10.1093/nar/gks1094
25
GaytherS. A.BatleyS. J.LingerL.BannisterA.ThorpeK.ChinS. F.et al (2000). Mutations truncating the EP300 acetylase in human cancers.Nat. Genet.24300–303. 10.1038/73536
26
GreenA. R.BurneyC.GrangerC. J.PaishE. C.El-SheikhS.RakhaE. A.et al (2008). Prognostic significance of steroid receptor co-regulators in breast cancer: co-repressor NCOR2/SMRT is an independent indicator of poor outcome.Breast Cancer Res. Treat.110427–437. 10.1186/bcr1947
27
GruelN.FuhrmannL.LodillinskyC.BenhamoV.MarianiO.CédenotA.et al (2016). LIN7A is a major determinant of cell-polarity defects in breast carcinomas.Breast Cancer Res.18:23. 10.1186/s13058-016-0680-x
28
GuY.FilippiM. D.CancelasJ. A.SiefringJ. E.WilliamsE. P.JastiA. C.et al (2003). Hematopoietic cell regulation by rac1 and rac2 guanosine triphosphatases.Science302445–449. 10.1126/science.1088485
29
GuptaA.PatnaikM. M.NainaH. V. (2014). MYST3/CREBBP rearranged acute myeloid leukemia after adjuvant chemotherapy for breast cancer.Case Rep. Oncol. Med.2014:361748. 10.1155/2014/361748
30
HanY.SunS.ZhaoM.ZhangZ.GongS.GaoP.et al (2016). CYC1 predicts poor prognosis in patients with breast cancer.Dis. Markers2016:3528064. 10.1155/2016/3528064
31
HuoQ.ZhangN.YangQ. (2012). Epstein-Barr virus infection and sporadic breast cancer risk: a meta-analysis.PLoS One7:e31656. 10.1371/journal.pone.0031656
32
JangC. Y.LeeJ. Y.KimJ. (2004). RpS3 a DNA repair endonuclease and ribosomal protein, is involved in apoptosis.FEBS Lett.56081–85. 10.1016/S0014-5793(04)00074-2
33
JeffreyS. S.BirdwellR. L.IkedaD. M.DanielB. L.NowelsK. W.DirbasF. M.et al (1999). Radiofrequency ablation of breast cancer: first report of an emerging technology.Arch. Surg.1341064–1068. 10.1001/archsurg.134.10.1064
34
JiangL.YaoR. (2016). Modelling personal thermal sensations using C-Support Vector Classification (C-SVC) algorithm.Build. Environ.9998–106. 10.1016/j.buildenv.2016.01.022
35
JiangM.ChenY.ZhangY.ChenL.ZhangN.HuangT.et al (2013). Identification of hepatocellular carcinoma related genes with k-th shortest paths in a protein–protein interaction network.Mol. Biosyst.92720–2728. 10.1039/C3MB70089E
36
JollyL. A.NguyenL. S.DomingoD.SunY.BarryS.HancarovaM.et al (2015). HCFC1 loss-of-function mutations disrupt neuronal and neural progenitor cells of the developing brain.Hum. Mol. Genet.243335–3347. 10.1093/hmg/ddv083
37
KalesS. C.NauM. M.MerchantA. S.LipkowitzS. (2014). Enigma prevents Cbl-c-mediated ubiquitination and degradation of RETMEN2A.PLoS One9:e87116. 10.1371/journal.pone.0087116
38
KataokaN.DiemM. D.KimV. N.YongJ.DreyfussG. (2001). Magoh, a human homolog of Drosophila mago nashi protein, is a component of the splicing-dependent exon–exon junction complex.EMBO J.206424–6433. 10.1093/emboj/20.22.6424
39
KatoT.KameokaS.KimuraT.NishikawaT.KobayashiM. (2002). C-erbB-2 and PCNA as prognostic indicators of long-term survival in breast cancer.Anticancer Res.221097–1103.
40
KawaiH.LiH.AvrahamS.JiangS.AvrahamH. K. (2003). Overexpression of histone deacetylase HDAC1 modulates breast cancer progression by negative regulation of estrogen receptor α.Int. J. Cancer107353–358. 10.1002/ijc.11403
41
KhanA.BilalM.AhmedM.WahabN.UllahR.KhanS. (2016). Analysis of dengue infection based on raman spectroscopy and support vector machine (svm).Biomed. Opt. Express72249–2256. 10.1364/BOE.7.002249
42
KhodarevN.AhmadR.RajabiH.PitrodaS.KufeT.McClaryC.et al (2010). Cooperativity of the MUC1 oncoprotein and STAT1 pathway in poor prognosis human breast cancer.Oncogene29:920. 10.1038/onc.2009.391
43
KimY.KimH. D.YounB.ParkY. G.KimJ. (2013). Ribosomal protein S3 is secreted as a homodimer in cancer cells.Biochem. Biophys. Res. Commun.441805–808. 10.1016/j.bbrc.2013.10.132
44
KobayashiS.BoggonT. J.DayaramT.JänneP. A.KocherO.MeyersonM.et al (2005). EGFR mutation and resistance of non–small-cell lung cancer to gefitinib.N. Engl. J. Med.352786–792. 10.1056/NEJMoa044238
45
KonishiY.StegmüllerJ.MatsudaT.BonniS.BonniA. (2004). Cdh1-APC controls axonal growth and patterning in the mammalian brain.Science3031026–1030. 10.1126/science.1093712
46
KourmpetisY. A.Van DijkA. D.BinkM. C.van HamR. C.ter BraakC. J. (2010). Bayesian Markov Random Field analysis for protein function prediction based on network data.PLoS One5:e9293. 10.1371/journal.pone.0009293
47
KwonA.LeeH. L.WooK. M.RyooH. M.BaekJ. H. (2013). SMURF1 plays a role in EGF-induced breast cancer cell migration and invasion.Mol. Cells36548–555. 10.1007/s10059-013-0233-4
48
LangerS.SingerC. F.HudelistG.DampierB.KasererK.VinatzerU.et al (2006). Jun and Fos family protein expression in human breast cancer: correlation of protein expression and clinicopathological parameters.Eur. J. Gynaecol. Oncol.27345–352.
49
LeeH. K.ChoungH. W.YangY. I.YoonH. J.ParkI. A.ParkJ. C. (2015). ODAM inhibits RhoA-dependent invasion in breast cancer.Cell Biochem. Funct.33451–461. 10.1002/cbf.3132
50
LiB. Q.HuL. L.ChenL.FengK. Y.CaiY. D.ChouK. C. (2012a). Prediction of protein domain with mRMR feature selection and analysis.PLoS One7:e39308. 10.1371/journal.pone.0039308
51
LiB. Q.HuangT.LiuL.CaiY. D.ChouK. C. (2012b). Identification of colorectal cancer related genes with mRMR and shortest path in protein-protein interaction network.PLoS One7:e33393. 10.1371/journal.pone.0033393
52
LiB. Q.ZhangJ.HuangT.ZhangL.CaiY. D. (2012c). Identification of retinoblastoma related genes with shortest path in a protein–protein interaction network.Biochimie941910–1917. 10.1016/j.biochi.2012.05.005
53
LiB. Q.HuangT.ZhangJ.ZhangN.HuangG. H.LiuL.et al (2013a). An ensemble prognostic model for colorectal cancer.PLoS One8:e63494. 10.1371/journal.pone.0063494
54
LiB. Q.YouJ.ChenL.ZhangJ.ZhangN.LiH. P.et al (2013b). Identification of lung-cancer-related genes with the shortest path approach in a protein-protein interaction network.Biomed Res. Int.20131–8. 10.1155/2013/267375
55
LiY.ZhangY.JiangL. (2011). Modeling chlorophyll content of korean pine needles with NIR and SVM.Procedia Environ. Sci.10222–227. 10.1016/j.proenv.2011.09.038
56
LiuQ.WangW.YangX.ZhaoD.LiF.WANgH. (2016). MicroRNA-146a inhibits cell migration and invasion by targeting RhoA in breast cancer.Oncol. Rep.36189–196. 10.3892/or.2016.4788
57
LopesN.CarvalhoJ.DuraesC.SousaB.GomesM.CostaJ. L.et al (2012). 1Alpha, 25-dihydroxyvitamin D3 induces de novo E-cadherin expression in triple-negative breast cancer cells by CDH1-promoter demethylation.Anticancer Res.32249–257.
58
LotzC.LinA. J.BlackC. M.ZhangJ.LauE.DengN.et al (2014). Characterization, design, and function of the mitochondrial proteome: from organs to organisms.J. Proteome Res.13433–446. 10.1021/pr400539j
59
MeloF. D. S. E.WangX.JansenM.FesslerE.VermeulenL. (2013). Poor-prognosis colon cancer is defined by a molecularly distinct subtype and develops from serrated precursor lesions.Nat. Med.19614–618. 10.1038/nm.3174
60
MokeddemS.AtmaniB.MokaddemM. (2013). Supervised feature selection for diagnosis of coronary artery disease based on genetic algorithm.Comput. J. Sci. Inform. Tech.1041–51. 10.5121/csit.2013.3305
61
NabievaE.JimK.AgarwalA.ChazelleB.SinghM. (2005). Whole-proteome prediction of protein function via graph-theoretic analysis of interaction maps.Bioinformatics21(Suppl. 1)i302–i310. 10.1093/bioinformatics/bti1054
62
NgK. L.CiouJ. S.HuangC. H. (2010). Prediction of protein functions based on function–function correlation relations.Comput. Biol. Med.40300–305. 10.1016/j.compbiomed.2010.01.001
63
NicolasM.WolferA.RajK.KummerJ. A.MillP.van NoortM.et al (2003). Notch1 functions as a tumor suppressor in mouse skin.Nat. Genet.33:416. 10.1038/ng1099
64
NingZ.MinJ.TaoH.CaiY.-D. (2014). Identification of influenza A/H7N9 virus infection-related human genes based on shortest paths in a virus-human protein interaction network.Biomed. Res. Int.2014:239462. 10.1155/2014/239462
65
OliverG. R.HartS. N.KleeE. W. (2015). Bioinformatics for clinical next generation sequencing.Clin. Chem.61124–135. 10.1373/clinchem.2014.224360
66
PengH.LongF.DingC. (2005). Feature selection based on mutual information criteria of max-dependency, max-relevance, and min-redundancy.IEEE Trans. Pattern Anal. Mach. Intell.271226–1238. 10.1109/TPAMI.2005.159
67
PirvolaU.YlikoskiJ.TrokovicR.HébertJ. M.McConnellS. K.PartanenJ. (2002). FGFR1 is required for the development of the auditory sensory epithelium.Neuron35671–680. 10.1016/S0896-6273(02)00824-3
68
PonenteM.CampaniniL.CuttanoR.PiuntiA.DelledonneG. A.ColtellaN.et al (2017). PML promotes metastasis of triple-negative breast cancer through transcriptional regulation of HIF1A target genes.JCI Insight2:e87380. 10.1172/jci.insight.87380
69
PratA.AdamoB.CheangM. C.AndersC. K.CareyL. A.PerouC. M. (2013). Molecular characterization of basal-like and non-basal-like triple-negative breast cancer.Oncologist18123–133. 10.1634/theoncologist.2012-0397
70
RobinsonD. R.WuY. M.VatsP.SuF.LonigroR. J.CaoX.et al (2013). Activating ESR1 mutations in hormone-resistant metastatic breast cancer.Nat. Genet.45:1446. 10.1038/ng.2823
71
SantamaríaD.BarrièreC.CerqueiraA.HuntS.TardyC.NewtonK.et al (2007). Cdk1 is sufficient to drive the mammalian cell cycle.Nature448811–815. 10.1038/nature06046
72
SlatteryM. L.LundgreenA.JohnE. M.Torres-MejiaG.HinesL.GiulianoA. R.et al (2015). MAPK genes interact with diet and lifestyle factors to alter risk of breast cancer: the Breast Cancer Health Disparities Study.Nutr. Cancer67292–304. 10.1080/01635581.2015.990568
73
SlizhikovaD. K.VinogradovaT. V.SverdlovE. D. (2005). The NOLA2 and RPS3A genes as highly informative markers of human squamous cell carcinoma of lung.Russ. J. Bioorgan. Chem.31178–182. 10.1007/s11171-005-0024-6
74
SodiV. L.KhakuS.KrutilinaR.SchwabL. P.VocadloD. J.SeagrovesT. N.et al (2015). mTOR/MYC axis regulates O-GlcNAc transferase (OGT) expression and O-GlcNAcylation in breast cancer.Mol. Cancer Res.13923–933. 10.1158/1541-7786
75
SongS.ZhanZ.LongZ.ZhangJ.YaoL. (2011). Comparative study of svm methods combined with voxel selection for object category classification on fmri data.PLoS One6:e17191. 10.1371/journal.pone.0017191
76
SpN.KangD. Y.JoungY. H.ParkJ. H.KimW. S.LeeH. K.et al (2017). Nobiletin inhibits angiogenesis by regulating Src/FAK/STAT3-mediated signaling through PXN in ER+ breast cancer cells.Int. J. Mol. Sci.18:935. 10.3390/ijms18050935
77
StruttD. I.WeberU.MlodzikM. (1997). The role of RhoA in tissue polarity and Frizzled signalling.Nature387:292. 10.1038/387292a0
78
SuR.WuH.XuB.LiuX.WeiL. (2018). Developing a multi-dose computational model for drug-induced hepatotoxicity prediction based on toxicogenomics data.IEEE/ACM Trans. Comput. Biol. Bioinform.10.1109/TCBB.2018.2858756[Epub ahead of print].
79
SubikK.LeeJ. F.BaxterL.StrzepekT.CostelloD.CrowleyP.et al (2010). The expression patterns of ER, PR, HER2 CK5/6 EGFR, Ki-67 and AR by immunohistochemical analysis in breast cancer cell lines.Breast Cancer435–41. 10.1177/117822341000400004
80
SubramonianD.RaghunayakulaS.OlsenJ. V.BeningoK. A.PaschenW.ZhangX. D. (2014). Analysis of changes in SUMO-2/3 modification during breast cancer progression and metastasis.J. Proteome Res.133905–3918. 10.1021/pr500119a
81
SzklarczykD.FranceschiniA.KuhnM.SimonovicM.RothA.MinguezP.et al (2011). The STRING database in 2011: functional interaction networks of proteins, globally integrated and scored.Nucleic Acids Res.39(Suppl. 1)D561–D568. 10.1093/nar/gkq973
82
ThienC. B.LangdonW. Y. (2001). Cbl: many adaptations to regulate protein tyrosine kinases.Nat. Rev. Mol. Cell Biol.2:294. 10.1038/35067100
83
Van RossumA. G.AartsenW. M.MeulemanJ.KloosterJ.MalyshevaA.VersteegI.et al (2006). Pals1/Mpp5 is required for correct localization of Crb1 at the subapical region in polarized Müller glia cells.Hum. Mol. Genet.152659–2672. 10.1093/hmg/ddl194
84
VinayakS.NadauldL. D.MiotkeL.RummaR. T.TelliM. L.JiH. P.et al (2013). Detection of FGFR1 and FGFR2 amplification in triple-negative breast cancer using digital droplet PCR and DNA-based microarrays.Cancer Res.73(8 Suppl.):4130. 10.1158/1538-7445.AM2013-4130
85
WagnerK.HemminkiK.GrzybowskaE.KlaesR.ButkiewiczD.PamulaJ.et al (2004). The insulin-like growth factor-1 pathway mediator genes: SHC1 Met300Val shows a protective effect in breast cancer.Carcinogenesis252473–2478. 10.1093/carcin/bgh263
86
WangH.-C.ChenJ.AnN.YuT.-T.LiS.-Y.LiuS.et al (2014). Rps27a silence potentiates chemosensitivity of k562 cells to saha.J. Exp. Hematol.22938–942. 10.7534/j.issn.1009-2137.2014.04.011
87
XanderP.BritoR. R.PérezE. C.PozzibonJ. M.De SouzaC. F.PellegrinoR.et al (2013). Crosstalk between b16 melanoma cells and b-1 lymphocytes induces global changes in tumor cell gene expression.Immunobiology2181293–1303. 10.1016/j.imbio.2013.04.017
88
XiaQ.CaiY.PengR.WuG.ShiY.JiangW. (2014). The CDK1 inhibitor RO3306 improves the response of BRCA-proficient breast cancer cells to PARP inhibition.Int. J. Oncol.44735–744. 10.3892/ijo.2013.2240
89
XiaW.BacusS.HusainI.LiuL.ZhaoS.LiuZ.et al (2010). Resistance to ErbB2 tyrosine kinase inhibitors in breast cancer is mediated by calcium-dependent activation of RelA.Mol. Cancer Ther.9292–299. 10.1158/1535-7163.MCT-09-1041
90
YangJ.HouY.ZhouM.WenS.ZhouJ.XuL.et al (2016). Twist induces epithelial-mesenchymal transition and cell motility in breast cancer via ITGB1-FAK/ILK signaling axis and its associated downstream network.Int. J. Biochem. Cell Biol.7162–71. 10.1016/j.biocel.2015.12.004
91
YeT.WeiX.YinT.XiaY.LiD.ShaoB.et al (2014). Inhibition of FGFR signaling by PD173074 improves antitumor immunity and impairs breast cancer metastasis.Breast Cancer Res. Treat.143435–446. 10.1007/s10549-013-2829-y
92
YouH.JinJ.ShuH.YuB.De MilitoA.LozuponeF.et al (2009). Small interfering RNA targeting the subunit ATP6L of proton pump V-ATPase overcomes chemoresistance of breast cancer cells.Cancer Lett.280110–119. 10.1016/j.canlet.2009.02.023
93
YuS. J.HuJ. Y.KuangX. Y.LuoJ. M.HouY. F.DiG. H.et al (2013). MicroRNA-200a promotes anoikis resistance and metastasis by targeting YAP1 in human breast cancer.Clin. Cancer Res.191389–1399. 10.1158/1078-0432.CCR-12-1959
94
YuanY.GigerM. L.LiH.BhooshanN.SennettC. A. (2010). Multimodality computer-aided breast cancer diagnosis with FFDM and DCE-MRI.Acad. Radiol.171158–1167. 10.1016/j.acra.2010.04.015
95
YuenH. F.GunasekharanV. K.ChanK. K.ZhangS. D.Platt-HigginsA.GatelyK.et al (2013). RanGTPase: a candidate for Myc-mediated cancer progression.J. Natl. Cancer Inst.105475–488. 10.1093/jnci/djt028
96
ZengX.DingN.Rodríguez-PatónA.ZouQ. (2017a). Probability-based collaborative filtering model for predicting gene–disease associations.BMC Med. Genom.10:76. 10.1186/s12920-017-0313-y
97
ZengX.LiaoY.LiuY.ZouQ. (2017b). Prediction and validation of disease genes using HeteSim Scores.IEEE/ACM Trans. Comput. Biol. Bioinform.14687–695. 10.1109/TCBB.2016.2520947
98
ZengX.LinW.GuoM.ZouQ. (2017c). A comprehensive overview and evaluation of circular RNA detection tools.PLoS Comput. Biol.13:e1005420. 10.1371/journal.pcbi.1005420
99
ZhangH.FanQ. (2015). MicroRNA-205 inhibits the proliferation and invasion of breast cancer by regulating AMOT expression.Oncol. Rep.342163–2170. 10.3892/or.2015.4148
100
ZhangJ. T.JiangX. H.XieC.ChengH.Da DongJ.WangY.et al (2013). Downregulation of CFTR promotes epithelial-to-mesenchymal transition and is associated with poor prognosis of breast cancer.Biochim. Biophys. Acta18332961–2969. 10.1016/j.bbamcr.2013.07.021
101
ZhangN.JiangM.HuangT.CaiY. D. (2014). Identification of Influenza A/H7N9 virus infection-related human genes based on shortest paths in a virus-human protein interaction network.Biomed Res. Int.2014:239462. 10.1155/2014/239462
102
ZhangN.LiB. Q.GaoS.RuanJ. S.CaiY. D. (2012). Computational prediction and analysis of protein γ-carboxylation sites based on a random forest method.Mol. Biosyst.82946–2955. 10.1039/C2MB25185J
103
ZouQ.WanS.HanB.ZhanZ. (2016a). “BDSCyto: an automated approach for identifying cytokines based on best dimension searching,” inProceedings of the Pacific Rim International Conference on Artificial Intelligence (Cham: Springer) 713–725.
104
ZouQ.ZengJ.CaoL.JiR. (2016b). A novel features ranking metric with application to scalable visual and bioinformatics data classification.Neurocomputing173346–354. 10.1016/j.neucom.2014.12.123
Summary
Keywords
triple-negative breast cancer, gene, proteins, protein-protein interaction network, SVM
Citation
Li M, Guo Y, Feng Y-M and Zhang N (2019) Identification of Triple-Negative Breast Cancer Genes and a Novel High-Risk Breast Cancer Prediction Model Development Based on PPI Data and Support Vector Machines. Front. Genet. 10:180. doi: 10.3389/fgene.2019.00180
Received
31 October 2018
Accepted
19 February 2019
Published
15 March 2019
Volume
10 - 2019
Edited by
Arun Kumar Sangaiah, VIT University, India
Reviewed by
Jiangning Song, Monash University, Australia; Zhi-Ping Liu, Shandong University, China
Updates
Copyright
© 2019 Li, Guo, Feng and Zhang.
This is an open-access article distributed under the terms of the Creative Commons Attribution License (CC BY). The use, distribution or reproduction in other forums is permitted, provided the original author(s) and the copyright owner(s) are credited and that the original publication in this journal is cited, in accordance with accepted academic practice. No use, distribution or reproduction is permitted which does not comply with these terms.
*Correspondence: Ning Zhang, zhni@tju.edu.cn
This article was submitted to Bioinformatics and Computational Biology, a section of the journal Frontiers in Genetics
Disclaimer
All claims expressed in this article are solely those of the authors and do not necessarily represent those of their affiliated organizations, or those of the publisher, the editors and the reviewers. Any product that may be evaluated in this article or claim that may be made by its manufacturer is not guaranteed or endorsed by the publisher.