 Ping Wang
 Libo Jiang
 Meixia Ye
 Xuli Zhu
 Rongling Wu
- 1Center for Computational Biology, College of Biological Sciences and Biotechnology, Beijing Forestry University, Beijing, China
- 2Center for Statistical Genetics, The Pennsylvania State University, Hershey, PA, United States
Crossover (CO) interference is a universal phenomenon by which the occurrence of one CO event inhibits the simultaneous occurrence of other COs along a chromosome. Because of its critical role in the evolution of genome structure and organization, the cytological and molecular mechanisms underlying CO interference have been extensively investigated. However, the genome-wide distribution of CO interference and its interplay with sex-, stress-, and age-induced differentiation remain poorly understood. Multi-point linkage analysis has proven to be a powerful tool for landscaping CO interference, especially within species for which CO mutants are rarely available. We implemented four-point linkage analysis to landscape a detailed picture of how CO interference is distributed through the entire genome of Populus euphratica, the only forest tree that can survive and grow in saline desert. We identified an extensive occurrence of CO interference, and found that its strength depends on the length of chromosomes and the genomic locations within the chromosome. We detected high-order CO interference, possibly suggesting a highly complex mechanism crucial for P. euphratica to grow, reproduce, and evolve in its harsh environment.
Introduction
Crossovers (COs) are recombination events involving a reciprocal exchange of genetic material. During meiotic prophase, COs are essential for the accurate segregation of homologous chromosomes (Hillers, 2004). In most organisms, the abundance and distribution of COs is highly regulated by universal mechanisms, referred to as CO interference or genetic interference. The fact that the presence of a CO interferes with the occurrence of other COs within the same chromosome has been confirmed. Due to such interferences, chiasmata are more evenly placed along chromosomes than previously expected (Hillers, 2004; Hultén, 2011). Moreover, CO interference is ubiquitous in eukaryotes and plays a crucial role in their evolution. However, our understanding of CO interference mechanisms and their distribution in biota remains very limited.
Sturtevant and Muller constructed a Drosophila genetic map and found that COs were more evenly spaced than would be expected from random placement (Lam et al., 2005). CO interference is widespread in most eukaryotes and can confer selectivity advantages. The extent of CO interference decreases with genetic distance between COs; however, given the same distance, it is stronger on the same chromosomal arm than on different arms (Berchowitz and Copenhaver, 2010). The variability of CO interference within a specific chromosome region is affected by the overall size and structure of the chromosome (Hillers, 2004), and CO interferences are regulated by the anti-recombinase RTEL-1 protein in Caenorhabditis elegant (Youds et al., 2010). A reduction in CO interference can result from a lack of DNA-damage-response-kinase Tel1/ATM (Anderson et al., 2015). Links between CO interferences and sex differences (Jan et al., 2007; Szatkiewicz et al., 2013), stress-induced adaptation (Yant et al., 2013; Aggarwal et al., 2015), and aging (Campbell et al., 2015; Wang Z. et al., 2016) have been discovered, highlighting the multifaceted role of COs in mediating biological processes. As an evolutionary phenotype, CO interference varies with biotic and abiotic environmental parameters, such as sex, age, and stress. For example, in mice and cattle, interference is stronger in females than in males (Szatkiewicz et al., 2013; Wang Z. et al., 2016). However, the opposite is found in humans, where interference is stronger in males than in females, although this pattern varies by chromosome (Campbell et al., 2015).
Many methods have been used to study the mechanisms of CO interference, including the count-location model, the gamma model, and multi-point linkage analysis. Initially, CO interference was genetically defined and characterized by cytology, the location of protein complexes, and chromosomal CO events. Recent studies have explored the mechanistic basis of CO interference using cytogenetics and molecular methods, whereas more traditional interference studies use the coefficient of coincidence (CoC) between two disjoint intervals on a genetic map. The CoC is defined as the ratio of the observed frequency to the expected frequency, and represents all possible intervals of gametes with double CO for each pair (Waterworth, 2000). Traditional models of interference suggest that the occurrence of a CO produces signals or substances that prevent additional CO events and then spreads along the chromosome at a similar distance on both sides (Housworth and Stahl, 2003). The polymerization model states that early recombination events are distributed independently with each other and then have the same chance of initiating bidirectional aggregation events per unit of time (King and Mortimer, 1990).
More recently, many model and non-model systems have been developed to characterize the phenomenon of CO interference. CO interference has been investigated mainly by tracking DNA markers on a single chromosome of parents during a specific period under electron fluorescence microscopy. The gamma model has recently received attention and suggests that the shape parameter of the gamma distribution is an indicator for uniformity and an indirect indicator for interference (Lam et al., 2005). The mechanical stress model assumes that each CO event releases a specific distance of pressure along the chromosome to prevent the presence of nearby COs (Wang et al., 2015). At present, multi-point linkage analysis has been proven to be more advantageous in genetic distance estimation and gene ordering, and it is equipped with a strong ability to discern and quantify CO interferences.
Despite numerous theoretical and empirical studies, our understanding of how interference is distributed across genomes remains unclear (Housworth and Stahl, 2003). This can be attributed to a number of reasons. First, traditional genetic screens for mutations affecting interference require numerous meiotic progenies to include meiotic COs in multiple intervals along a chromosome (Berchowitz and Copenhaver, 2010). Second, most of the mutations that modify interference affect chromosomal proteins, which not only mediate interference but also play a role in CO formation (Joshi et al., 2009). Thus, genetic strategies that abolish mutation interference also reduce or eliminate CO events. Third, many mutants differ in their frequency of occurrence of CO in different loci and environments (Getz et al., 2008). Therefore, combining multi-point analysis and cytology tools, which are used widely for locating and sequencing genes, can increase the ability to detect interference (Broman and Weber, 2000). The multi-analytic statistical model, which is based on the linkage analysis method of genetic maps, can describe CO interference that take place not only between two adjacent chromosome intervals, but also in multiple consecutive intervals. Additionally, multi-point analysis provides a quantitative method to estimate CO interference (Zickler and Kleckner, 2016). In particular, by assessing the chromosomal distribution of CO interference, multi-point analysis can activate the use of linkage mapping as a routine genetic tool to investigate further dimensions of genomic structure and organization (Lu et al., 2004).
Populus euphratica is the only arbor species in arid-semiarid regions and plays an important role in maintaining the ecological balance in desert regions. The goals of this study were to identify the distribution of CO interference in P. euphratica at a whole-genome scale using multi-point analysis based on the full-sib family of P. euphratica and to study the relationship between the overall CO interference strength and length of the chromosome, as well as the region of the chromosome. Due to the impact of climate change and anthropogenic activities, the area of P. euphratica in northwest China has declined sharply and its ecological security and agricultural production are facing severe challenges (Qiu et al., 2011). By using four-point linkage analysis to analyze the CO interference of P. euphratica, we can describe its distribution within the genome in detail, which will provide a theoretical basis for the follow-up forest genetic research and molecular marker-assisted breeding. It is of great significance to understand the genetic diversity and evolutionary history of P. euphratica and to find their core germplasm resources.
Materials and Methods
Plant Material and Genetic Linkage Map
One male and one female P. euphratica individual were randomly selected along the Tarim River in the Korla region of Xinjiang, China. The individuals were located 31 km from one another, ensuring a large genetic difference between them. Male and female flowering branches from the individuals were planted in an artificial climate chamber at Beijing Forestry University. After cultivation was completed, a series of experimental treatments, including dehydration, thinning, and freezing with liquid nitrogen, were performed on the selected materials. Finally, the F1 progeny of 408 individuals were obtained. DNA was extracted using the TIANGEN plant genomic DNA extraction kit (Beijing, China). The quality of all samples was assessed and RAD technology was used for high-throughput DNA sequencing (Conesa et al., 2005). The genetic map of P. euphratica was constructed from the resultant sequence data.
Multi-Point Linkage Analysis
A four-point analysis was developed so that four consecutive markers could be analyzed simultaneously (Wang J. et al., 2016). It beyond three-point analysis, can characterize crossover interference that takes place not only between two adjacent chromosomal intervals, but also over multiple successive intervals (We call the interference occurred in multiple marker intervals of more than three markers as high dimensional CO interference). We used the CoC to describe the ratio of the observed number of double recombinants to this expected number. As we have known, the recombination events occurring between different marker intervals are not independent. Thus, the extent to which this coefficient corresponds to the strength of CO interference.
In the full-sib family of P. euphratica, two heterozygous F1 individuals, ABCD/abcd and ABCD/abcd, were crossed to produce a segregated F2 population. Each F1 parent produced 16 gametes, divided into eight types (Table 1). The frequencies of the gamete types are represented by g000,…, g111, where the subscripts represent the number of COs between a particular pair of tags. Based on the genetic map of P. euphratica, we grouped single-nucleotide polymorphism markers on 19 linkage groups with four markers in every group. The genotype frequencies of the gamete types were calculated by counting the number of genotypes within the 408 individuals of each group. The four consecutive markers (i.e., A-B-C-D) had six possible recombination moieties. From these gamete-type frequencies, we expressed the recombination fractions of each marker pair, denoted by rAB, rBC, rCD, rAC, rBD, and rAD, as follows:
Denote the coefficients of coincidence (a measure of crossover interference) between double marker intervals A-B and B-C, double marker intervals B-C and C-D, double marker intervals A-B and C-D, and triple marker intervals A-B, B-C, and C-D by C1, C2, C3, and C4, respectively (Sun et al., 2017). Wang J. et al. (2016) formulated the relationship between different recombination fractions based on the CoC and derived a process to estimate and test each coefficient, as follows:
providing a method to characterize the genomic distribution of CO interference along the chromosome.
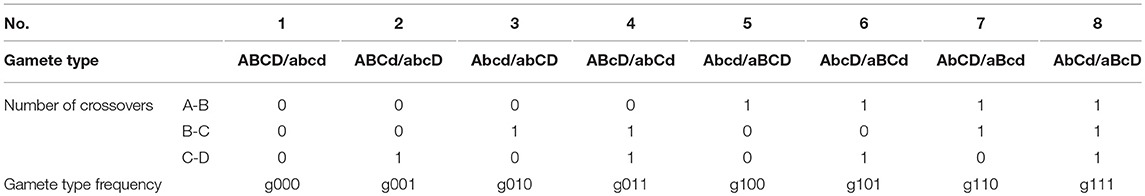
Table 1. Gamete types and their frequencies at four ordered markers, A-B-C-D.
For an F2 offspring family of P. euphratica, two F1 progenies crossed to produce 136 diploids, divided into 81 identifiable genotypes. This situation differs from the backcross population, which is more complex and requires the Expectation Maximization algorithm to be implemented (Dempster et al., 1977). Table 2 provides the frequencies of these 81 genotypes, as well as the corresponding numbers. The frequencies of heterozygous genotypes are a mix of products of gamete-type frequencies (Wang J. et al., 2016). Subsequently, the P. euphratica data were analyzed by multi-point analysis to obtain the CoC values representing the CO interference strength. If the CoC value is 0, it indicates that interference is absent.
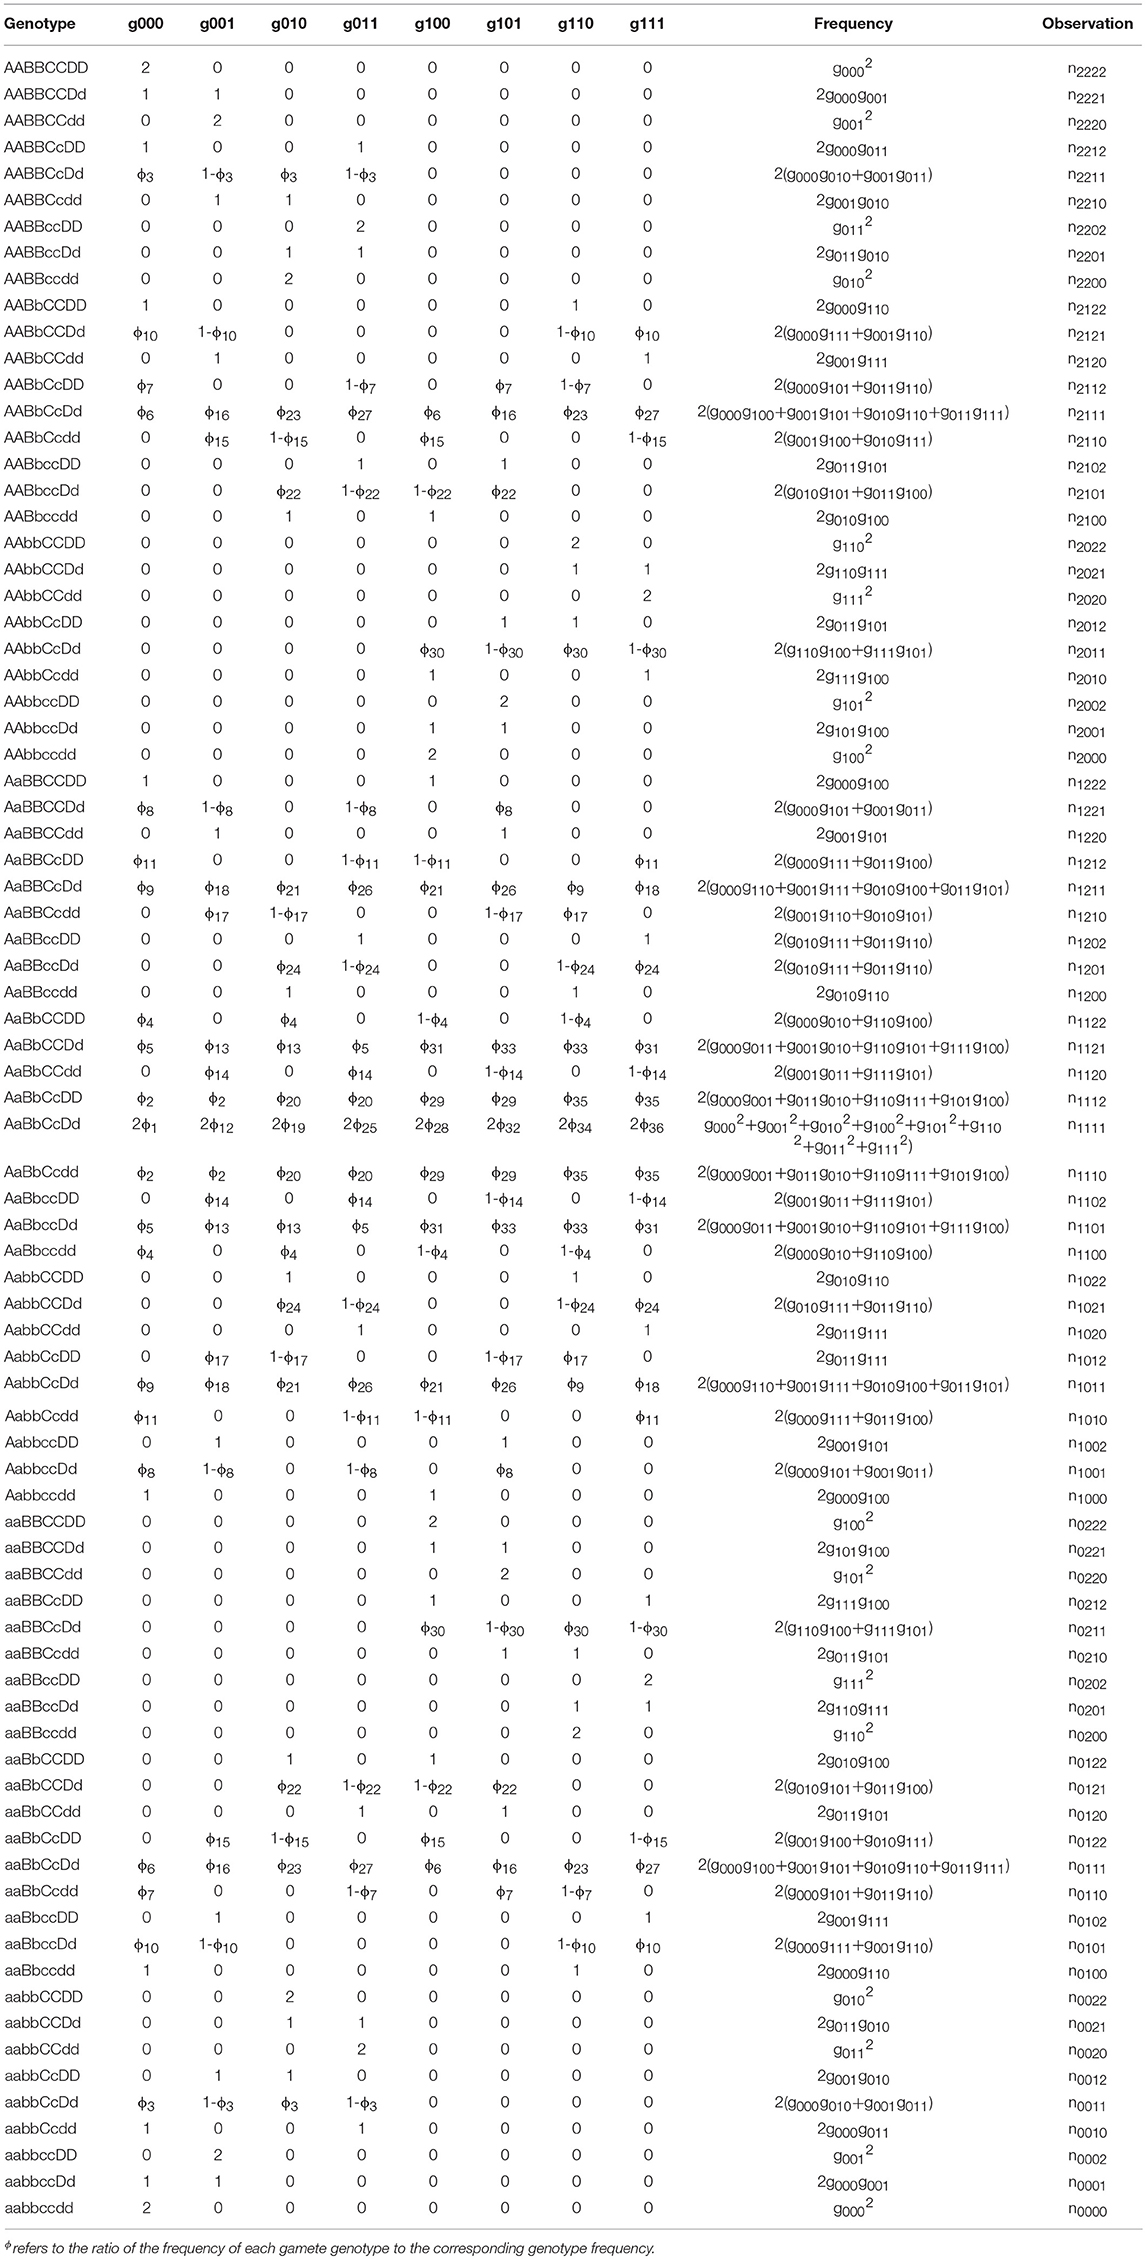
Table 2. Four-marker genotype observations and expected frequencies composed of gamete-type frequencies produced by each parent in a full-sib population.
The Relationship Between Overall High Dimensional CO Interference Strength and Chromosome Length
Differences in CO interference strength are affected by the overall size of the chromosome (Albini, 2010). Through four-point linkage analysis, we obtained the recombination rate between four marker intervals on each linkage group and the corresponding CoC. To study the relationship between chromosome length and overall high-order CO interference strength, we assumed that the length of the linkage group on the genetic map was the length of the chromosome. Next, the distribution interval of high dimensional CO interference strength on the 19 chromosomes was characterized by a boxplot displaying the maximum, minimum, median, and upper and lower quartiles of the data. Due to different structural characteristics of chromosomes, there are many factors affecting the strength of CO interference; therefore, the mean of the CO interference strength on each chromosome was calculated to account for the relationship between chromosome size and overall CO interference strength. Due to the distribution of chromosome 1 deviates more from the distribution of other chromosomes, it was determined to be an outlier and was removed from the dataset. Subsequently, chromosomes 2, 3, 4, and 6 were fitted with a linear model (blue line), and the remaining chromosomes were fitted with a trend line (red line). Through the fitting curves, the distribution of the overall high dimensional CO interference strength on different chromosomes was observed.
Ratio Variance in High Dimensional CO Interference Strength Between Different Chromosome Regions
CO rates are closely related to chromosome region (Giraut et al., 2011), allowing for differences in CO interference strength in different regions to be explored. In this study, each chromosome was divided into three parts according to genetic distance uniformity, and the three sections were labeled NO.1, NO.2, and NO.3, respectively. The CO interference strength of each was subtracted separately. NO.1-NO.2, NO.2-NO.3, and NO.1-NO.3 indicate the difference ratio (sum of the difference value of each corresponding CO interference strength between intervals) of CO interference strength in the first (NO.1) and second (NO.2) parts, the second part and the third (NO.3) part, the first and third part, respectively. This allowed for differences in the distribution of CO interference strength between the regions of the chromosome to be seen.
To display the impact of the three regions (NO.1, NO.2, and NO.3) in the chromosome on the CO interference strength distribution, we employed δ to quantitatively evaluate the difference of the CO interference strength distribution in different sections of chromosome, which can be calculated by
where N is the total number of intervals of the CO interference strength value, and represent the percentage of the ith interval in two different chromosome regions, respectively. We further derived the range of δ:
When the CO interference strength distributions in both regions 1 and 2 were the same, δ was equal to 0, whereas δ reached the maximum of 2 when there was no overlapping region between the CO interference strength distributions of two regions. In all other cases, δ is larger than 0 and smaller than 2. δ reflects the difference of two different CO interference strength distributions.
Results
In this study, we first used a four-point linkage analysis model to quantitatively analyze the CO interference on a full-sib population of P. euphratica. The genetic map contained 8,305 markers on 19 linkage groups. The total genetic distance was 4574.89 cM for the entire genetic map, among which the shortest linkage group was linkage group 19 (LG19) with a genetic distance of 130.26 cM and the longest linkage group was LG1 with a distance of 530.03 cM. The average distance of markers on each individual linkage group was 0.40–0.66 cM (Zhang et al., 2017).
The recombination rates rAB, rBC, rCD, rAC, rBD, and rAD and the corresponding C1, C2, C3, and C4 between every four consecutive markers were obtained by four-point linkage analysis (Table 3). According to the CoC (Table 3) and the genetic distance of each linkage group, we determined the CO interference between two adjacent intervals, the CO interference of one interval apart, and the high dimensional CO interference of triple marker intervals. CO interference is ubiquitous within a genome, exhibiting COs between two adjacent marker intervals distributed throughout the genome and varied with the length of the chromosome (Figure 1A), making the distribution of COs across each linkage group more even. However, the distribution of interference between two non-adjacent marker intervals occasionally occurs at lower frequencies and lower intensities than the adjacent intervals (Figure 1B). Interestingly, high dimensional CO interference was highly distributed across the 19 linkage groups and had a wide distribution within the genome (Figure 1C). By comparison, high dimensional CO interference with high-density distribution existed on linkage group 4 (LG4) and linkage group 5 (LG5), whereas the high-dimensional CO interference distribution density of linkage group 11 (LG11) was lower.
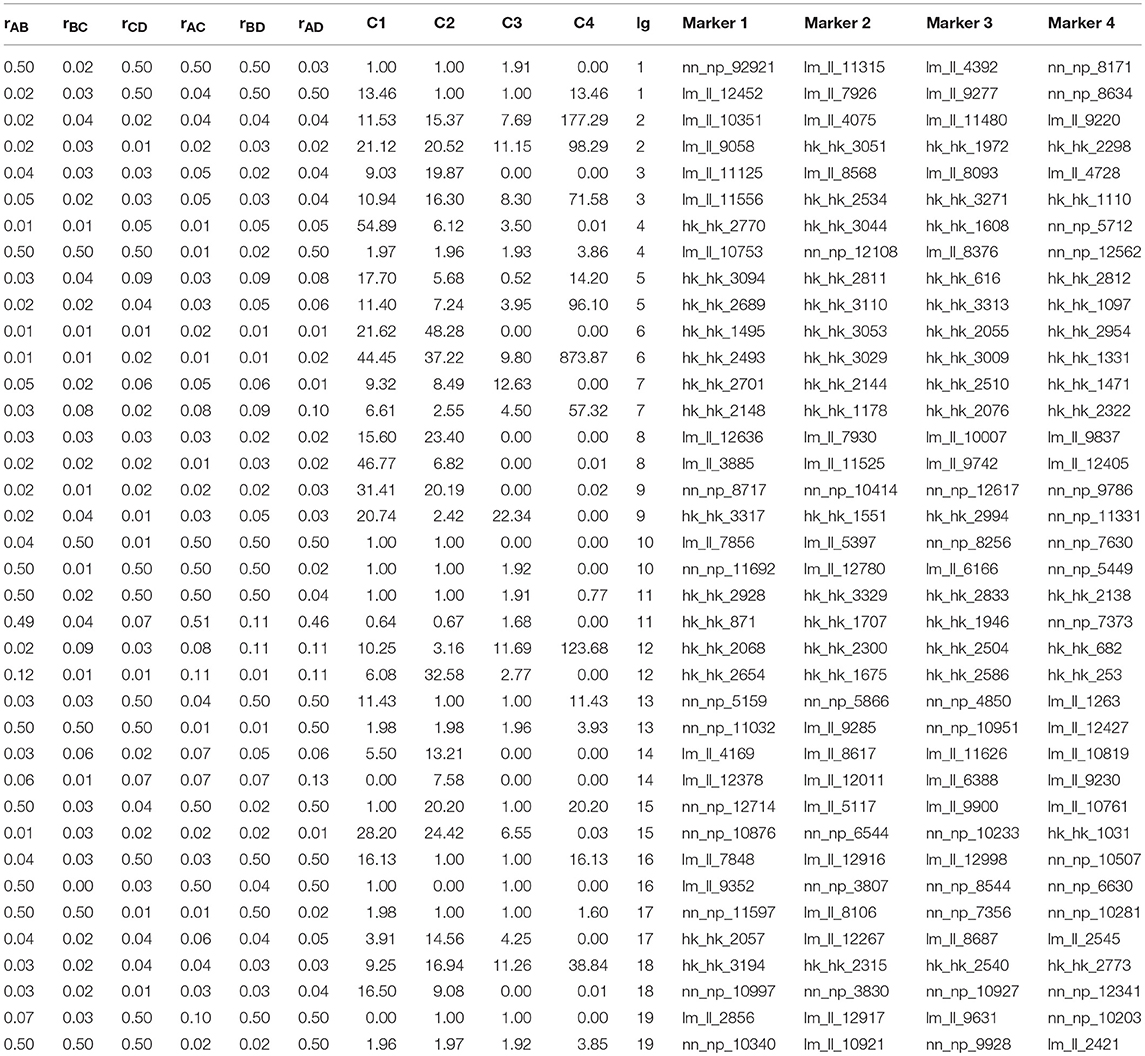
Table 3. Recombination rates corresponding to the first two groups in each linkage group and the coefficient of coincidence (CoC) of crossover interference strength.
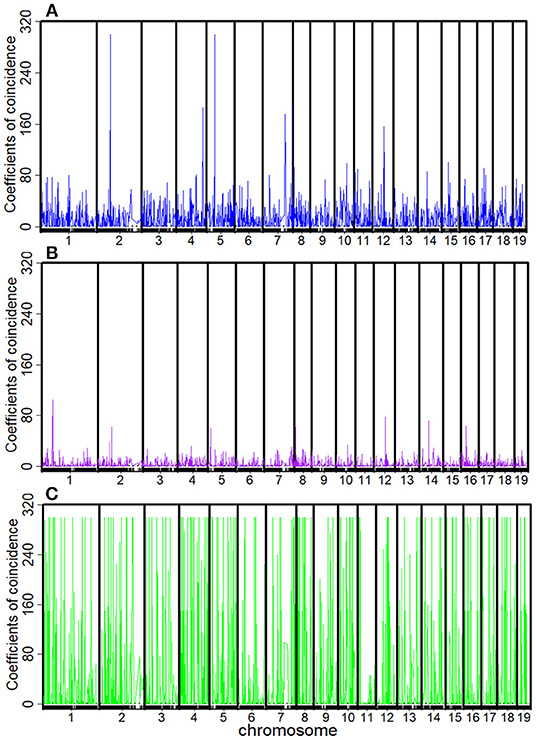
Figure 1. Distribution of crossover interference within the Populus euphratica genome, composed of 19 chromosomes, estimated from a full-sib family of two different cultivars. (A) Crossover interference between two adjacent marker intervals (C1 and C2); (B) crossover interference between two non-adjacent marker intervals (C3); (C) high-dimensional crossover interference over three successive marker intervals (C4).
We plotted the first eight high-dimensional CO interference in the 19 linkage groups to visualize the distribution of high-dimensional CO interference on the eight linkage groups more directly (Figure 2). Although the chromosome length varied, higher-dimensional CO interferences were evenly distributed within each chromosome and the amplitudes were larger and denser than the other two genetic disturbances. Additionally, the location information of the markers where CO interference occurred could be seen (Figure 2). There was an obvious correlation between the density of high-dimensional CO interference and chromosome length, with different chromosome lengths resulting in different distributions of high-dimensional CO interference.
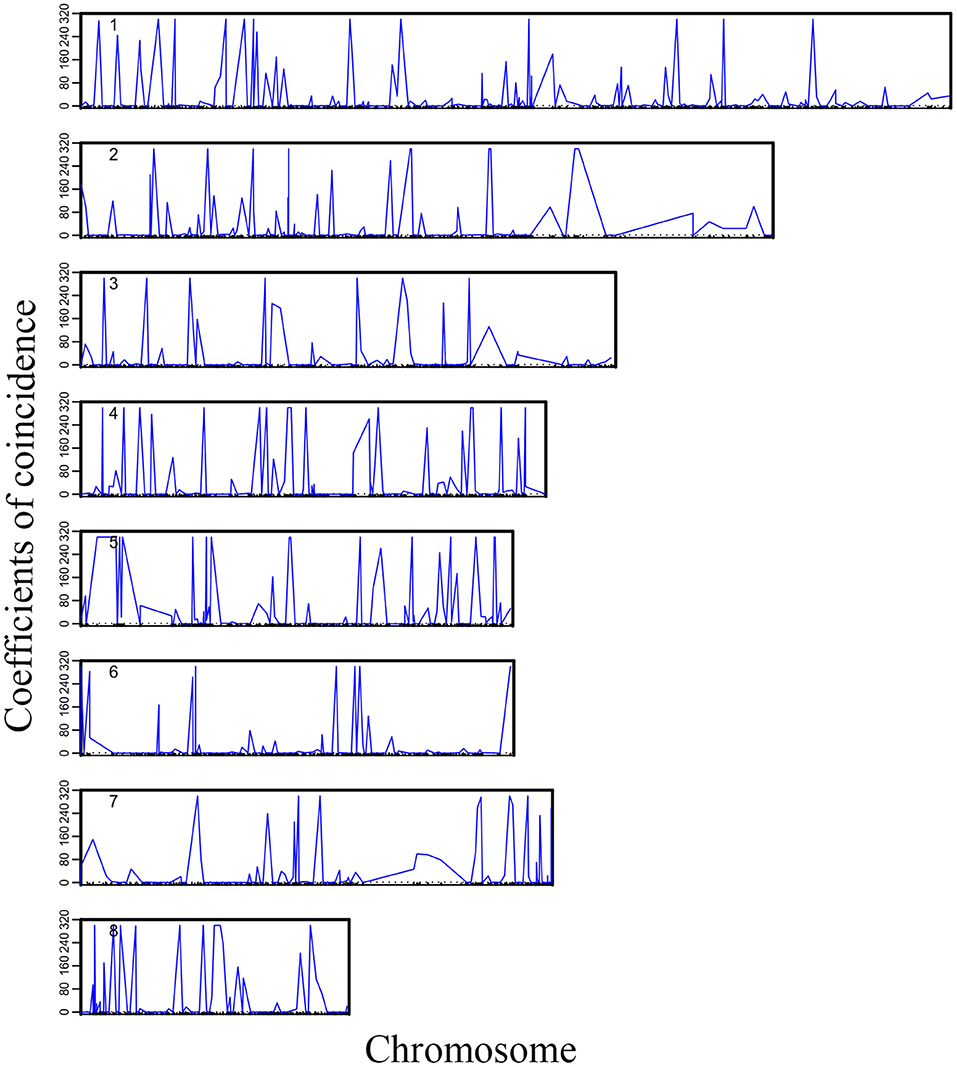
Figure 2. Landscape of crossover interference along eight chromosomes within the Populus euphratica genome.
We analyzed the correlation between the genetic distance of chromosomes and overall high-dimensional CO interference strength. The median of the overall CO interference strength was concentrated between 0 and 1, and the interquartile range (IQR) was variable and dependent on chromosome length. The IQR of chromosome 5 was the longest, reaching 41.63 cM; the IQR of chromosome 11 was the shortest, about 1.74 cM; the other 17 chromosomes were similar to chromosome 1, which was about 16.94 cM (Figure 3). In other words, the overall strength of CO interference was related to the genetic distance of the chromosome (Figure 4). Chromosomes 2, 3, 4, and 6 were locally linearly fitted (blue line) with an adjusted R2 of 0.71. Simultaneously, the other chromosomes were fitted (red line) with an adjusted R2 of 0.85 (Figure 4). Although the two fitted curves had different slopes, they both increased with the length of the chromosome. These results suggest that the correlation between the genetic distance of chromosomes and the overall high-dimensional CO interference strength was significant.
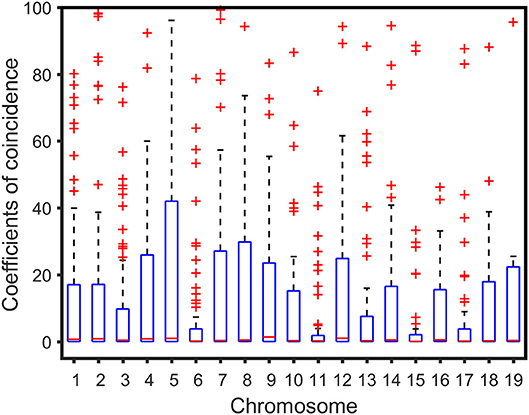
Figure 3. Boxplot of crossover interference over the Populus euphratica genome composed of 19 chromosomes.
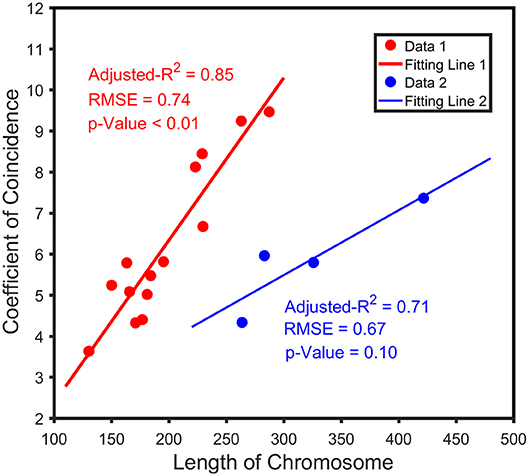
Figure 4. Relationship between the length of the chromatid and the coefficient of coincidence (CoC). The blue line indicates the trend between crossover interference and the chromosome length of chromosomes 2, 3, 4, and 6; the red line indicates the trend of genetic interference of the remaining chromosomes with chromosome length.
We plotted the first three of the 19 chromosomes to visualize the distribution of high dimensional CO interference on different chromosome parts (NO.1, NO.2, and NO.3) (Figure 5). The CO interference strength of each chromosome part differed in terms of intensity interval. For example, on chromosome 1, there was no CO interference in the first part (interval of 60–80 cM), whereas chromosome 2 exhibited CO interference. Therefore, different intervals along the chromosome contained different strengths and distributions of CO interference.
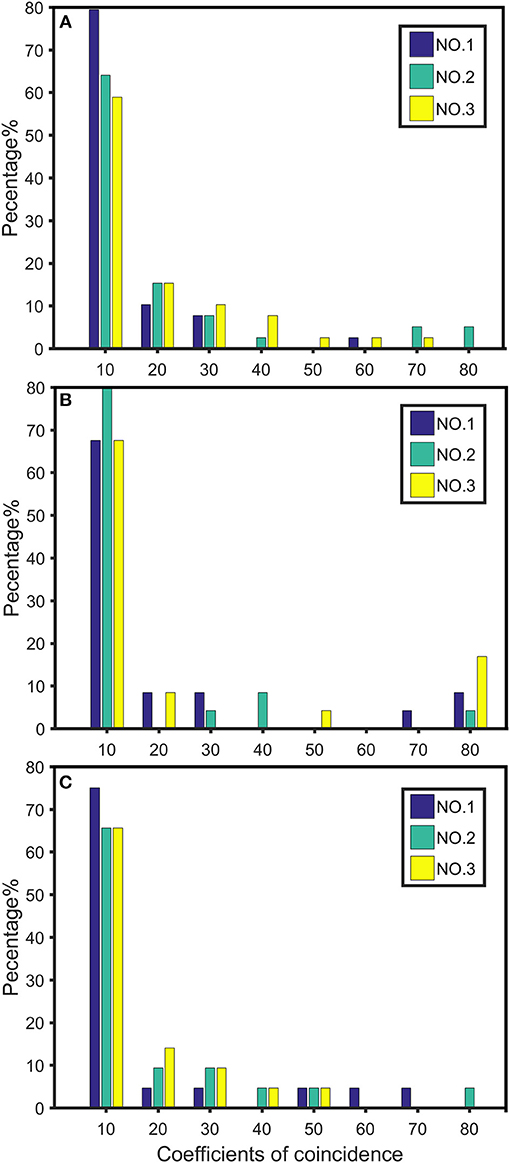
Figure 5. Distribution of crossover interference strength on chromosomes 1 (A), 2 (B), and 3 (C). NO.1 represents the distribution strength of the first third of the chromosome length; NO.2 represents the distribution strength of the middle third of the chromosome; NO.3 indicates the distribution strength of the last third of the chromosome.
The difference ratio was used to compare the differences among the three intervals on each chromosome and study the distribution of high dimensional CO interference strength in different regions of the chromosome. The difference ratios of NO.1-NO.2, NO.2-NO.3, and NO.1-NO.3 in each chromosome were 0.1429-0.9474, 0.0952-1.1250, and 0.2353-0.8750, respectively (Figure 6). Moreover, fluctuations of CO interference strength between the first region and the third region were small, whereas the CO interference strength between the second region and the third region fluctuated greatly (Figure 6). The high dimensional CO interference strength between the middle region and both side regions on the chromosome was very different. Thus, the overall strength of high dimensional CO interference was not only related to the length of the chromosome, but also varied among chromosome regions.
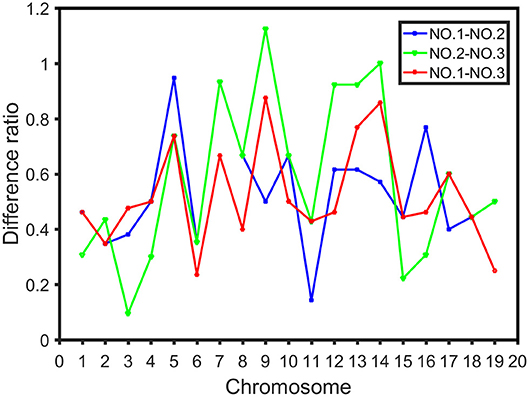
Figure 6. Difference ratio in the distribution of CO interference between the three parts of the chromosome, where the blue line represents the difference ratio between the first part (NO.1) and the middle part (NO.2), the green line represents the difference ratio between the middle part (NO.2) and the third part (NO.3), and the red line indicates the difference ratio between the first part (NO.1) and the third part (NO.3).
Discussion
The phenomenon of CO interference has been observed in most organisms. Within eukaryotes, interference may be quite long. For example, in the nematode C. elegans, interference can span a fusion chromosome of 50 Mb (Lian et al., 2008). The results of this study provide strong evidence for the existence of high-order CO interference. We assessed CO interference in the full-sib family of P. euphratica by mapping the distributions of CO interferences in different dimensions along 19 chromosomes. We observed that high-dimensional CO interference existed to varying degrees on all 19 chromosomes, and found that these high-dimensional interferences were even stronger than one- or two-dimensional CO interferences. The discovery of CO interference in the full-sib family of P. euphratica and the relationship between the strength of the overall CO interference and the chromosome structure can not only help identify and quantify CO interference in the entire genome, but also has the potential to impact further inference on the genome structure, organization, and evolution of P. euphratica populations.
We correlated the genetic length of the chromosome with the strength of the overall high-dimensional CO interference, and found that the mean of CO interference strength on each chromosome had a linear relationship with the genetic length of the chromosome. CO rates and chromosome lengths were previously found to be relevant in other eukaryotic species, including humans, mice, Arabidopsis, and zebrafish (Kleckner et al., 2003). In addition, CO interference affects the CO rate and is affected by the length of the chromosome. In some species, such as yeast, dogs, mice, and pigeons, small chromosomes often have a higher CO density (Froenicke et al., 2002; Basheva et al., 2008; Mancera et al., 2008). Surprisingly, the CO interference strength in this study increased with chromosome length, with longer chromosomes containing a higher CO interference density and a correspondingly smaller CO density. This finding has far-reaching implications on biological evolution. Due to the existence of CO interference, the occurrence of CO events is regulated accordingly (Broman et al., 2002). The length of chromosomes indirectly affects the total strength of heritage interference, thereby affecting genetic diversity and having important implications for evolution.
According to previous studies, the occurrence of CO events is closely related to the center and terminal regions on chromosomes (Chelysheva et al., 2007). Meanwhile, CO interference has variable intensities and distributions in different regions of the chromosome. Moreover, CO interference can have different regulatory effects on a CO event in the corresponding region and exerts subtle influences on biological inheritance and evolution. We further studied the distribution and difference of CO interference between different regions on the chromosome, finding that the distribution of CO interference strength differed among regions. By defining the range of difference ratios, we found a difference in CO interference strength among chromosome regions. Studies of Arabidopsis chromosomes have shown that CO rates correlate with different genomic features associated with chromosome structure, such as the GC content and CpG ratio. Therefore, the differences in CO interference are also clearly related to these factors.
In this study, we used multi-point analysis methods to measure CO interference in the full-sib family of P. euphratica, extending from traditional linkage analysis to analyze multiple markers simultaneously. Previous studies have demonstrated that this method is a powerful tool for identifying and estimating CO interference (Wang J. et al., 2016). Accurate estimates of high-dimensional CO interference have significant implications in genomic research (Weeks et al., 1994). First, previous studies of interference in experimental organisms generally only involved adjacent interval groups, whereas multi-point analysis can not only accurately estimate the recombination rate between two adjacent markers, but also between multiple marker intervals and provide additional information about genomic structure and organization. Second, using this method, the strength and distribution of CO interferences between adjacent intervals along a chromosome can be estimated and the results can be used to study the relationship with the structure of the chromosome.
An increasing number of studies have investigated the phenomenon of CO interference. It has been found that CO interference is highly related to many evolutionary and developmental processes, such as gender differences, heterogeneity, senescence, and stress tolerance. The distribution of recombination achieved by CO interference can be determined by genetic background, gender, and many environmental factors, such as temperature and age. However, most genetic mapping studies have not considered CO interference. Regardless, multi-point analysis using genetic mapping has been used to estimate the degree of correlation between CO interference and evolution, and can capture this important phenomenon without extra cost. Similarly, Aggarwal et al. (2015) used multi-point analysis to determine the rules of recombinant frequency and CO interference in fruit flies that were targeted by dry, hypoxia, or high-oxygen tolerance. Here, we have expanded the research on CO interference, allowing for future studies to explore the molecular mechanism of CO in the P. euphratica genome through combination of multi-point analysis with cytology, clarify the development and evolution of COs, and investigate whether specific genes regulate CO interference.
Author Contributions
PW performed data analysis. PW, MY, and XZ interpreted the result. RW and LJ conceived of the idea and designed the model. PW and LJ wrote the manuscript.
Funding
This work is supported by Fundamental Research Funds for the Central Universities (NO. BLYJ201605, NO. BLX201715, NO. 2015ZCQ-SW-06), grant 31700576 from National Natural Science Foundation of China, grant 31600536 from National Natural Science Foundation of China, grant 201404102 from the State Administration of Forestry of China, NSF/IOS award No. 0923975, and the Thousand-person Plan Award.
Conflict of Interest Statement
The authors declare that the research was conducted in the absence of any commercial or financial relationships that could be construed as a potential conflict of interest.
References
Aggarwal, D. D., Rashkovetsky, E., Michalak, P., Cohen, I., Ronin, Y., Zhou, D., et al. (2015). Experimental evolution of recombination and crossover interference in Drosophila caused by directional selection for stress-related traits. BMC. Biol. 13:101. doi: 10.1186/s12915-015-0206-5
Albini, S. M. (2010). A karyotype of the Arabidopsis thaliana genome derived from synaptonemal complex analysis at prophase I of meiosis. Plant. J. 5, 665–672. doi: 10.1111/j.1365-313X.1994.00665.x
Anderson, C. M., Oke, A., Yam, P., Zhuge, T., and Fung, J. C. (2015). Reduced crossover interference and increased ZMM-independent recombination in the absence of Tel1/ATM. Plos. Genet. 11:e1005478. doi: 10.1371/journal.pgen.1005478
Basheva, E. A., Bidau, C. J., and Borodin, P. M. (2008). General pattern of meiotic recombination in male dogs estimated by MLH1 and RAD51 immunolocalization. Chromosome. Res. 16:709. doi: 10.1007/s10577-008-1221-y
Berchowitz, L. E., and Copenhaver, G. P. (2010). Genetic interference: don't stand so close to me. Curr. Genom. 11, 91–102. doi: 10.2174/138920210790886835
Broman, K. W., Rowe, L. B., Churchill, G. A., and Paigen, K. (2002). Crossover interference in the mouse. Genetics. 160, 1123–1131.
Broman, K. W., and Weber, J. L. (2000). Characterization of human crossover interference. Am. J. Hum. Genet. 66, 1911–1926. doi: 10.1086/302923
Campbell, C. L., Furlotte, N. A., Eriksson, N., Hinds, D., and Auton, A. (2015). Escape from crossover interference increases with maternal age. Nat. Commun. 6:6260. doi: 10.1038/ncomms7260
Chelysheva, L., Gendrot, G., Vezon, D., Doutriaux, M. P., Mercier, R., and Grelon, M. (2007). Zip4/Spo22 is required for class I CO formation but not for synapsis completion in Arabidopsis thaliana. PLoS. Genet. 3:e83. doi: 10.1371/journal.pgen.0030083
Conesa, A., Götz, S., García-Gómez, J. M., Terol, J., Talón, M., and Robles, M. (2005). Blast2GO: a universal tool for annotation, visualization and analysis in functional genomics research. Bioinformatics. 21, 3674–3676. doi: 10.1093/bioinformatics/bti610
Dempster, A. P., Laird, N. M., and Rubin, D. B. (1977). Maximum likelihood from incomplete data via the EM algorithm. J. R. Stat. Soc. B. 39, 1–22. doi: 10.1111/j.2517-6161.1977.tb01600.x
Froenicke, L., Anderson, L. K., Wienberg, J., and Ashley, T. (2002). Male mouse recombination maps for each autosome identified by chromosome painting. Am. J. Hum. Genet. 71, 1353–1368. doi: 10.1086/344714
Getz, T. J., Banse, S. A., Young, L. S., Banse, A. V., Swanson, J., Wang, G. M., et al. (2008). Reduced mismatch repair of heteroduplexes reveals “non”-interfering crossing over in wild-type Saccharomyces cerevisiae. Genetics. 178, 1251–1269. doi: 10.1534/genetics.106.067603
Giraut, L., Falque, M., Drouaud, J., Pereira, L., Martin, O. C., and Mézard, C. (2011). Genome-wide crossover distribution in Arabidopsis thaliana meiosis reveals sex-specific patterns along chromosomes. PLoS. Genet. 7:e1002354. doi: 10.1371/journal.pgen.1002354
Hillers, K. J. (2004). Crossover interference. Curr. Biol. 14, R1036–R1037. doi: 10.1016/j.cub.2004.11.038
Housworth, E. A., and Stahl, F. W. (2003). Crossover interference in humans. Am. J. Hum. Genet. 73, 188–197. doi: 10.1086/376610
Hultén, M. A. (2011). On the origin of crossover interference: a chromosome oscillatory movement (COM) model. Mol. Cytogenet. 4:10. doi: 10.1186/1755-8166-4-10
Jan, D., Raphaël, M., Liudmila, C., Aurélie, B., Matthieu, F., Olivier, M., et al. (2007). Sex-specific crossover distributions and variations in interference level along Arabidopsis thaliana chromosome 4. PLoS. Genet. 3:e106. doi: 10.1371/journal.pgen.0030106
Joshi, N., Barot, A., Jamison, C., and Börner, G. V. (2009). Pch2 links chromosome axis remodeling at future crossover sites and crossover distribution during yeast meiosis. PLoS. Genet. 5:e1000557. doi: 10.1371/journal.pgen.1000557
King, J. S., and Mortimer, R. K. (1990). A polymerization model of chiasma interference and corresponding computer simulation. Genetics. 126, 1127–1138.
Kleckner, N., Storlazzi, A., and Zickler, D. (2003). Coordinate variation in meiotic pachytene SC length and total crossover/chiasma frequency under conditions of constant DNA length. Trends. Genet. 19, 623–628. doi: 10.1016/j.tig.2003.09.004
Lam, S. Y., Horn, S. R., Radford, S. J., Housworth, E. A., Stahl, F. W., and Copenhaver, G. P. (2005). Crossover interference on nucleolus organizing region-bearing chromosomes in Arabidopsis. Genetics 170, 807–812. doi: 10.1534/genetics.104.040055
Lian, J., Yin, Y., Oliver-Bonet, M., Liehr, T., Ko, E., Turek, P., et al. (2008). Variation in crossover interference levels on individual chromosomes from human males. Hum. Mol. Genet. 17, 2583–2594. doi: 10.1093/hmg/ddn158
Lu, Q., Cui, Y., and Wu, R. (2004). A multilocus likelihood approach to joint modeling of linkage, parental diplotype and gene order in a full-sib family. BMC Genet. 5:20. doi: 10.1186/1471-2156-5-20
Mancera, E., Bourgon, R., Brozzi, A., Huber, W., and Steinmetz, L. M. (2008). High-resolution mapping of meiotic crossovers and non-crossovers in yeast. Nature. 454, 479–485. doi: 10.1038/nature07135
Qiu, Q., Ma, T., Hu, Q., Liu, B., Wu, Y., Zhou, H., et al. (2011). Genome-scale transcriptome analysis of the desert poplar, Populus euphratica. Tree. Physiol. 31, 452–461. doi: 10.1093/treephys/tpr015
Sun, L., Wang, J., Sang, M., Jiang, L., Zhao, B., Cheng, T., et al. (2017). Landscaping crossover interference across a genome. Trends. Plant. Sci. 22, 894–907. doi: 10.1016/j.tplants.2017.06.008
Szatkiewicz, J. P., Neale, B. M., O'Dushlaine, C., Fromer, M., Goldstein, J. I., Moran, J. L., et al. (2013). Detecting large copy number variants using exome genotyping arrays in a large Swedish schizophrenia sample. Mol. Psychiatr. 18, 1178–1184. doi: 10.1038/mp.2013.98
Wang, J., Sun, L., Jiang, L., Sang, M., Ye, M., Cheng, T., et al. (2016). A high-dimensional linkage analysis model for characterizing crossover interference. Brief. Bioinform. 18:382. doi: 10.1093/bib/bbw033
Wang, S., Zickler, D., Kleckner, N., and Zhang, L. (2015). Meiotic crossover patterns: obligatory crossover, interference and homeostasis in a single process. Cell. Cycle. 14, 305–314. doi: 10.4161/15384101.2014.991185
Wang, Z., Shen, B., Jiang, J., Li, J., and Ma, L. (2016). Effect of sex, age and genetics on crossover interference in cattle. Sci. Rep. 6:37698. doi: 10.1038/srep37698
Waterworth, D. (2000). Analysis of human genetic linkage. By J. O TT. Baltimore, London: Johns Hopkins University Press. 1999. Pp.382. Ann. Hum. Genet. 64, 89–92. doi: 10.1017/S0003480000227899
Weeks, D. E., Ott, J., and Lathrop, G. M. (1994). Detection of genetic interference: simulation studies and mouse data. Genetics 136, 1217–1226.
Yant, L., Hollister, J. D., Wright, K. M., Arnold, B. J., Higgins, J. D., Franklin, F. C. H., et al. (2013). Meiotic adaptation to genome duplication in Arabidopsis arenosa. Curr. Biol. 23, 2151–2156. doi: 10.1016/j.cub.2013.08.059
Youds, J. L., Mets, D. G., Mcilwraith, M. J., Martin, J. S., Ward, J. D., Oneil, N. J., et al. (2010). RTEL-1 enforces meiotic crossover interference and homeostasis. Science 327, 1254–1258. doi: 10.1126/science.1183112
Zhang, M., Bo, W., Xu, F., Li, H., Ye, M., Jiang, L., et al. (2017). The genetic architecture of shoot-root covariation during seedling emergence of a desert tree, Populus euphratica. Plant. J. 90, 918–928. doi: 10.1111/tpj.13518
Keywords: euphrates poplar, genetic interference, mapping population, meiotic crossover, four-point analysis
Citation: Wang P, Jiang L, Ye M, Zhu X and Wu R (2019) The Genomic Landscape of Crossover Interference in the Desert Tree Populus euphratica. Front. Genet. 10:440. doi: 10.3389/fgene.2019.00440
Received: 11 October 2018; Accepted: 29 April 2019;
Published: 15 May 2019.
Edited by:
Ancha Baranova, George Mason University, United StatesReviewed by:
Xiyin Wang, North China University of Science and Technology, ChinaLongjiang Fan, Zhejiang University, China
Copyright © 2019 Wang, Jiang, Ye, Zhu and Wu. This is an open-access article distributed under the terms of the Creative Commons Attribution License (CC BY). The use, distribution or reproduction in other forums is permitted, provided the original author(s) and the copyright owner(s) are credited and that the original publication in this journal is cited, in accordance with accepted academic practice. No use, distribution or reproduction is permitted which does not comply with these terms.
*Correspondence: Libo Jiang, bGlib2ppYW5nQGJqZnUuZWR1LmNu