 Shuhui Su
 Lei Zhang2
 Jian Liu
- 1School of Computer Science and Technology, Harbin Institute of Technology, Harbin, China
- 2School of Biological and Chemical Engineering, Zhejiang University of Science and Technology, Hangzhou, China
Motivation: In order to create controlled vocabularies for shared use in different biomedical domains, a large number of biomedical ontologies such as Disease Ontology (DO) and Human Phenotype Ontology (HPO), etc., are created in the bioinformatics community. Quantitative measures of the associations among diseases could help researchers gain a deep insight of human diseases, since similar diseases are usually caused by similar molecular origins or have similar phenotypes, which is beneficial to reveal the common attributes of diseases and improve the corresponding diagnoses and treatment plans. Some previous are proposed to measure the disease similarity using a particular biomedical ontology during the past few years, but for a newly discovered disease or a disease with few related genetic information in Disease Ontology (i.e., a disease with less disease-gene associations), these previous approaches usually ignores the joint computation of disease similarity by integrating gene and phenotype associations.
Results: In this paper we propose a novel method called GPSim to effectively deduce the semantic similarity of diseases. In particular, GPSim calculates the similarity by jointly utilizing gene, disease and phenotype associations extracted from multiple biomedical ontologies and databases. We also explore the phenotypic factors such as the depth of HPO terms and the number of phenotypic associations that affect the evaluation performance. A final experimental evaluation is carried out to evaluate the performance of GPSim and shows its advantages over previous approaches.
Introduction
The emergence of massive biomedical data offers a marvelous opportunity for the life science research and modern disease diagnosis. The wealth of knowledge contained in biomedical big data also brings great challenges, since many biologists chronically construct their biomedical database applications by using their own terms to represent biomedical knowledge. In order to create controlled vocabularies for the shared use of knowledge, a large number of biomedical ontologies such as Disease Ontology [DO (Schriml et al., 2012; Kibbe et al., 2014)] and Human Phenotype Ontology [HPO (Köhler et al., 2014)], etc., are created in the bioinformatics community. Biomedical ontologies (Lee et al., 2008; Köhler et al., 2009; Meehan et al., 2013; Groza et al., 2015; Patel et al., 2015; Denny et al., 2018; Lovering et al., 2018) reduce the complexity of life science's concepts and make innovative contributions to advance the understanding of human diseases with controllable terminology. Currently, these ontologies have been used in a variety of biomedical applications. For example, HPO-based analysis tools have been used to assist in clinical diagnosis (Westbury et al., 2015) and exon sequencing research (Peng et al., 2018), etc. In addition, by using DO, researchers build the chain knowledge base of etiology (Harrow et al., 2017; Kozaki et al., 2017) and annotate human genes to improve the coverage of disease genes' annotations (Osborne et al., 2009).
Exploring the associations (Landrum et al., 2014) among diseases by using biomedical ontologies has attracted a significant attention in biomedical domains (Zhao and Halang, 2006; Zhang et al., 2008; Zeng et al., 2017). Quantitative measures of these associations among diseases could help researchers gain a deep insight of human diseases, since similar diseases are usually caused by similar molecular origins or have similar phenotypes. Deducing the semantic similarity of disease is beneficial to reveal the common attributes (e.g., the classification of diseases, disease-related genes, disease-related symptoms, etc.) of these diseases, which could facilitate the understanding of underlying causes and improve the disease diagnoses and treatment plans. For example, the gene “SH2D3C” is one of the common genes of “Amnesia” and “Alzheimer's disease,” which reveals that they may involve the same biological processes. The greater similarity means that the more closely related these two concepts are, and that the more common information they have (Liu and Yan, 2016; Liu and Zhang, 2017; Liu et al., 2017). A good quantitative method for computing the similarity among diseases could directly help researchers obtain the information of diseases having close relationships from massive biomedical data and do the corresponding experiments for the further analysis, which could significantly reduce the experimental cost and improve the efficiency of discovering potential pathogenic mechanism and drugs.
DO regulates the controlled vocabularies about diseases, and integrates the diseases' terms and medical data through external links. It provides the accurate, non-duplicative terms with high disease coverage and has been used to compute the degree of correlation among diseases during last decade (i.e., the disease similarity) (Osborne et al., 2009). DO is usually selected as the source of disease terms for the disease similarity calculation. Several previous approaches, including those based on information content (IC) (Resnik, 1995; Lin, 1998; Schlicker et al., 2006; Wang et al., 2007; Bandyopadhyay and Mallick, 2014), ontology Directed Acyclic Graph (DAG) structure (Kim et al., 1993; Zhang et al., 2010; Santos et al., 2012) and biological function process (Mathur and Dinakarpandian, 2012; Cheng et al., 2014; Jeong and Chen, 2015; Zou et al., 2016; Yang et al., 2017; Ni et al., 2018), have been proposed with the aim to measure the disease similarity by using DO. For the IC-based approaches, Resnik (1995) use IC of the most informative common ancestor (MICA) to measure the similarity of two diseases. To improve the efficiency of the Resnik's method, Lin (1998) propose the ratio of the amount of IC of MICA and that of two DO terms and then Schlicker et al. (2006) improve the Lin's approach through the Bernoulli probability distribution to reduce the impact of shallow annotations (Li et al., 2010). However, IC-based approaches only focus on the semantic information of two terms in different layers of ontology DAG. They ignore the information from the ontology DAG structure, and it is difficult to reveal the semantic differences between two terms under the same MICA. DAG-based approaches are susceptible to shallow annotations since the shallow concepts are too generalized to have much information (Li et al., 2010). For the DAG-based approaches, Kim et al. (1993) consider that the reciprocal of the shortest distance of two disease in DAG to measure their similarity. Zhang et al. (2010) take into account not only the shortest distance, but also the depth of the least common ancestor. For the methods based on biological functional processes, BOG (Mathur and Dinakarpandian, 2012) calculates by the overlapping of related gene sets as the disease similarity. PSB (Cheng et al., 2014) takes account of the gene similarity additionally to improve BOG's performance. By adding associations obtained from external databases, BOG and PSB perform better performance than previous IC-based and DAG-based approaches. Nevertheless, they ignore the joint computation of disease similarities by integrating gene and phenotype associations, and have poor performance when evaluating disease similarities for the disease with less genetic information such as viral infectious disease (Common Wart, DOID:11165) and vein disease (Esophageal Varix, DOID:112) in DO.
To effectively evaluate the similarities of newly discovered diseases or diseases with few genetic information in current medical research (i.e., diseases with less disease-gene associations), we propose a novel semantic similarity measure method called GPSim in this paper. GPSim takes genes, diseases and phenotypes into account, and calculates the similarities by jointly utilizing their associations extracted from multiple biomedical ontologies and databases. Besides, we explore the phenotypic factors influencing the performance of GPSim. The experimental results show that, in comparison with previous similarity evaluation methods, our proposed approach has the best performance in terms of ROC (receiver operating characteristic curve) and AUC (area under curve).
Methods
In this section, we introduce the details of our proposed method GPSim. GPSim relies on the associations of disease-gene and disease-phenotype. We firstly integrate the association data extracted from HPO, DO, and other biomedical databases, and then compute the corresponding disease similarity.
Disease-Genetic and Disease-Phenotypic Relationship Integrations
Disease-phenotype and disease-gene-phenotype mapping relations mainly come from the HPO mapping file (Download from http://compbio.charite.de/jenkins/job/hpo.annotations.monthly/lastStableBuild/artifact/annotation/ALL_SOURCES_ALL_FREQUENCIES_diseases_to_genes_to_phenotypes.txt). The disease information is extracted from the DO, which has totally 11191 disease terms and 2,140 of them have disease-gene and disease-phenotype mapping relations, and 808 have disease-phenotype mapping relations. Additionally, we integrate the proven disease-gene relationships in the SIDD (Cheng et al., 2014) and the Dancer databases (Download from http://wodaklab.org/dancer/ downloads). Through the completely matching names and synonyms of DO terms, we identify the DO terms and obtain the corresponding disease-gene mapping from Dancer. In this scenario, the number of terms having disease-gene and disease-phenotype mapping relations is 2505.
As shown in Figure 1, we extract the disease terms including disease's id, label, definition, synonyms, related databases, parents, and children from DO (Peng et al., 2013). Then we gain the disease-gene associations from Dancer, SIDD and HPO, and their relationships among diseases and phenotypes from HPO. The format of data from Dancer is “Disease's name: GeneID.” We identify the disease term in Dancer through totally matching the disease's name, obtaining the association such as “DOID: GeneID.” The format of data obtained from SIDD and HPO is “OMIMID/ORPHA ID/DOID: GeneID”, and we get the association through matching their ID information. Similarly, we transform the disease-phenotype associations into available formats “DOID: HPOID” through the id of OMIM, Orphanet, and DO. Finally the associated data of disease-gene and disease-phenotype are loaded and integrated in the database (depicted as DGP).
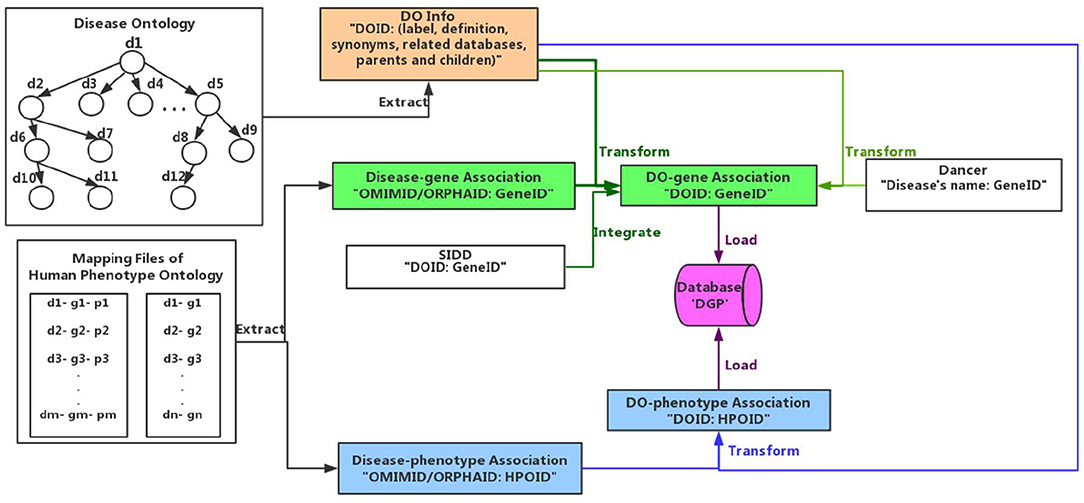
Figure 1. Associated data integrations.
Computing the Similarity
The similarity evaluation of any two DO terms relies on disease-gene and disease-phenotype associations. We firstly compute the similarity of disease-related gene set and the similarity of disease-related phenotype set, and then integrate them as follows:
Here, simGPSim represents the disease similarity computed by using GPSim. For two DO terms d1 and d2, G1, and G2 represent the disease-related gene sets of d1 and d2, respectively. P1 and P2 represent the disease-related phenotype sets of d1 and d2, respectively. simGeneSet represents the similarity between G1 and G2. simHPOSet represents the similarity between P1 and P2. β is the weight tuning the contribution of genes and phenotypes to the similarities of diseases, and the value of β depends on the quality of disease-gene and disease-phenotype associations (e.g., the association number, the depth of terms in HPO) of diseases in the tested dataset.
Computing the similarity of two gene sets relies on the gene-gene similarity network. We extract the network from the HumanNet (Lee et al., 2011). The HumanNet is a probabilistic functional gene network. Each interaction in the HumanNet is a log-likelihood score (LLS) which measures the probability of a true functional linkage between two genes. The functional similarity of two genes by normalizing the HumanNet (denoted as LLSN) are computed as follows (Cheng et al., 2014):
Here, LLSmin and LLSmax represent the minimum and maximum in the HumanNet, respectively. simgene represents the similarity of two genes g1 and g2. If there is no linkage of two genes in HumanNet, then their similarity is 0. Thus, the similarity measurement of two gene sets is defined as follows (Cheng et al., 2014):
Here gi represents a gene in the gene set G1 and gi' represents a gene in the gene set G2. k represents a gene in a gene set. G represents a gene set and ki represents any gene in G. We define the similarity between a gene k and a gene set G as the maximum of the similarity of k and ki in G. As shown in Figure 2 and formula (4), we compute the similarity of every gene gj (j = 1, 2,…,m) in gene set G1 and that of every gene gj' (j = 1, 2,…,n) and gene set G2 respectively, and then calculate the average value of all similarities representing the similarities of two gene sets G1 and G2.
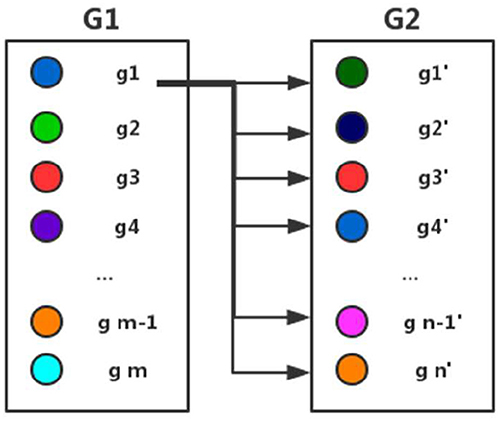
Figure 2. Computing the similarity between two gene sets.
Computing the similarity of two disease-related phenotype sets relies on the association of diseases and phenotypes. We could measure the similarity of two phenotype sets by their overlaps, the similarity between two phenotype sets could be defined as follows:
The total process of the disease similarity computation is shown in Figure 3. For instant, to calculate the similarity of two disease terms, “Alzheimer's disease” (DOID:10652) and “schizophrenia” (DOID:5419). We firstly get the disease-related gene sets and disease-related phenotype sets of two diseases respectively, from the integrated DGP database in Disease-Genetic and Disease-Phenotypic Relationship Integrations. By using formula (4) and (5), the similarity of two gene sets is calculated as 0.4784. The similarity result of two phenotype sets by using formula (6) is 0.1111. Finally, we integrate the similarity of gene sets and phenotype sets by using formula (1), in this scenario the corresponding similarity value is 0.4417.
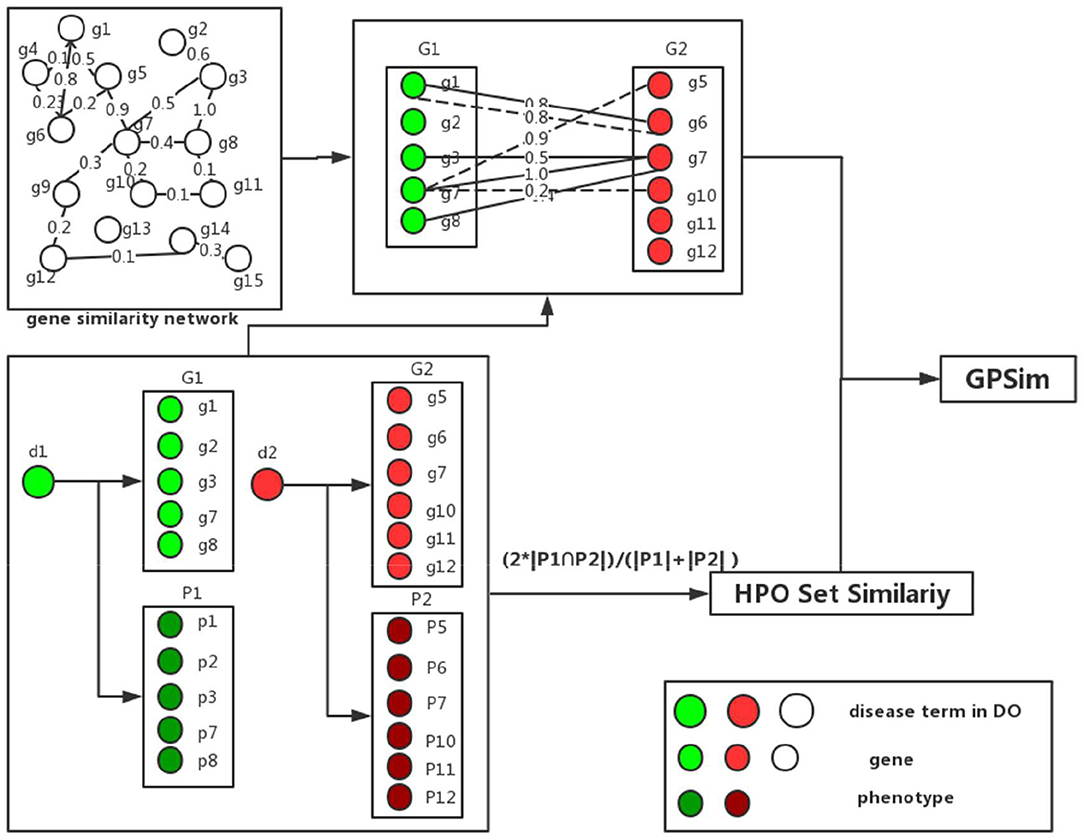
Figure 3. The similarity calculation by using GPSim.
Let N be the total number of diseases in DO, and K and L be the sizes of disease-related gene and disease-related phenotype sets, respectively. There are N2 pairs of diseases and it costs O(N2) to compute all the similarities. For each disease pair, we need to compute both the similarities based on disease-related gene and disease-related phenotype sets. Calculating two diseases' similarity based on disease-related gene sets costs O(K2) to obtain the corresponding similarity. The intersection between two disease-related phenotype sets takes O(L). As a result, it takes O(N2 *(K2 +L)) to compute the similarity of all disease pairs.
Results
In our experiments, we explore the phenotypic factors including the depth of HPO terms and the number of disease-phenotype associations when each disease has few disease-gene associations and compare GPSim with previous disease similarity measurement methods, including Resnik (Resnik, 1995), Zhang (Zhang et al., 2010), BOG (Mathur and Dinakarpandian, 2012) and SemFunSim(Cheng et al., 2014).
All the experiments are performed on 2.50 GHz Intel Core i7 CPU with 8.00 GB RAM running on Windows 10 64-bit system. We implemented all the approaches in Java with JDK 1.8.0 and Python 3.0.
To provide a fair comparison with previous approaches, we select the disease pairs with disease-gene and disease-phenotype associations from the SIDD benchmark and carry out the experiments by using the tested method used in previous approach (Cheng et al., 2014). In particular, we take the disease pairs in the benchmark set as the positive examples, and randomly generate 500 disease pairs as the negative examples, combining the positive examples and the negative examples as a tested set. To reduce test error we generate 100 tested sets to compare the performance of different methods and get the average value of 100 test results. For each tested set, we calculate the similarity of each disease pair by using the Resnik's method, Zhang's, BOG, SemFunSim and GPSim, and the performance comparisons are performed by using a receiver operating characteristic curve (ROC). ROC curve is a curve drawn with true positive rate (TPR) as Y axis and false positive rate (FPR) as X axis according to a series of different dichotomies (boundary values or decision thresholds). Generally, the closer to the upper left corner the ROC is, the more accurate the corresponding method is. For showing the performance of different methods more directly, the area under curve (AUC) of the ROC was also given. The greater AUC is, the better the performance is.
In the first sets of experiments, for diseases having less genetic associations (e.g., <9) in DO, we firstly calculate the similarities by using GPSim with different values of the beta (see formula 1 in Computing the Similarity). From the results observed from Figure 4A, we see that beta value of 0.9 is an optimum threshold in the tested dataset, which also reveals that jointly using disease-gene and disease-phenotype associations could improve the effect of disease similarity measurements. In this scenario, we also investigate the impact of the phenotypic factors such as the depth of HPO terms and the number of the disease-phenotype associations. To test the impact of similarity evaluation using different depth of HPO terms, we vary the HPO terms' depth from 3, 5, 7, 9, and 11. As shown in the Figure 4B, we see that, when the HPO terms' depth is >5, after obtained the corresponding disease-phenotype associations (depth ≥5), GPSim obtains the best the performance (the AUC is 81.51%), which illustrates that the performance of calculating disease similarity is declined by using the shallow HPO disease-phenotype associations. Figure 4C shows the experimental results using different number of disease-phenotype associations in the deep layer of the HPO (e.g., depth ≥5). From the figure, we see that, the more the number of disease-phenotype associations, the better the effect of GPSim.
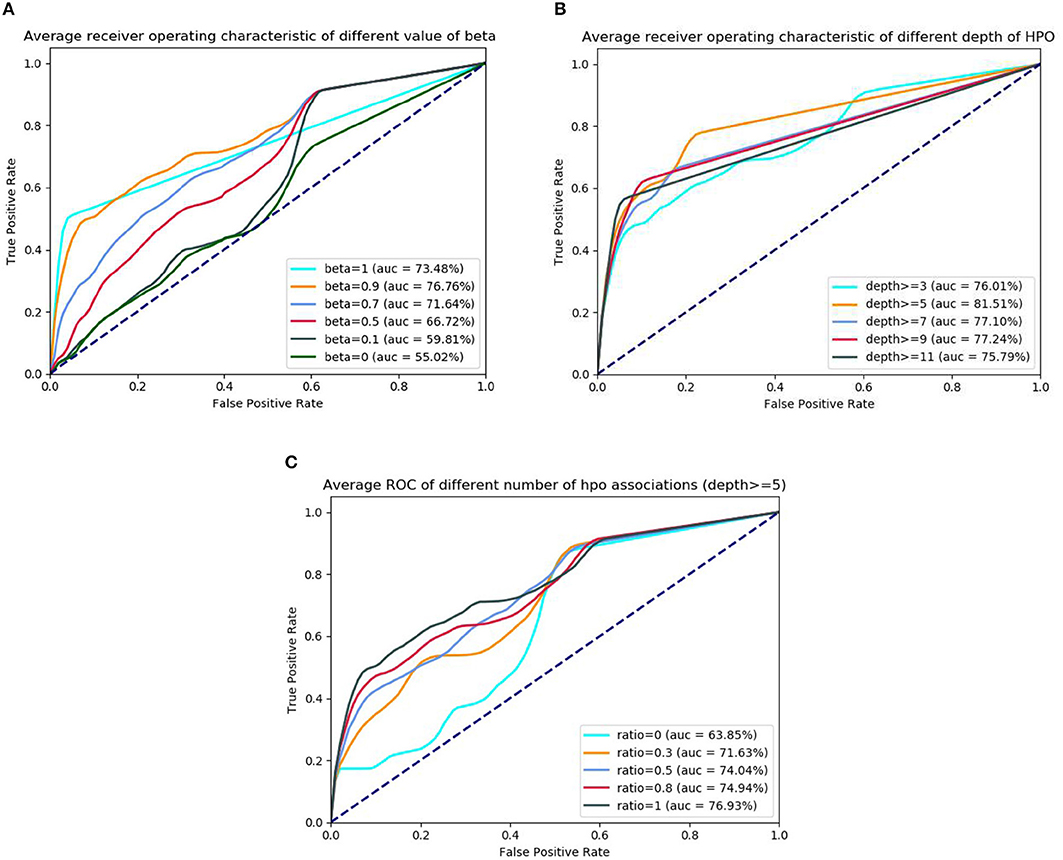
Figure 4. The ROC and AUC using different phenotypic factors. (A) ROC of different beta. (B) ROC of different HPO's depth. (C) ROC of different HPO's quantity.
In the second sets of experiments, we firstly compare the performance of Resnik, Zhang, BOG, SemFunSim and GPSim in terms of ROC and the AUC, for the scenarios of diseases with few disease-gene associations (e.g., <9). As shown in Figure 5, GPSim also presents the best performance. Figure 6 shows the performance for the scenarios of diseases with multiple disease-gene associations, and the consistent results are obtained and GPSim has the best performance. In particular, we see that the AUCs of GPSim, SemFunSim, BOG, Zhang and Resnik are 99.05, 97.69, 80.99, 67.80, and 59.05% respectively. Note that, since the negative samples are randomly generated, the average values of AUC of these methods may have a 2% float, and their corresponding floating directions are consistent. This is because (i) the similarity evaluation of Resnik's and Zhang's methods are centered on Disease Ontology only, and additional information such as associations among genes and diseases are not taken into account, (ii) BOG and SemFunSim improve the similarity measurement method by adding associations among genes and diseases to alleviate information insufficiency, (iii) GPSim further integrate gene, disease and phenotype associations extracted from multiple biomedical ontologies and databases, and it jointly utilizes these associations to effectively deduce the semantic similarity. Therefore, GPSim is more suitable for the similarity evaluation, which is what we have expected.
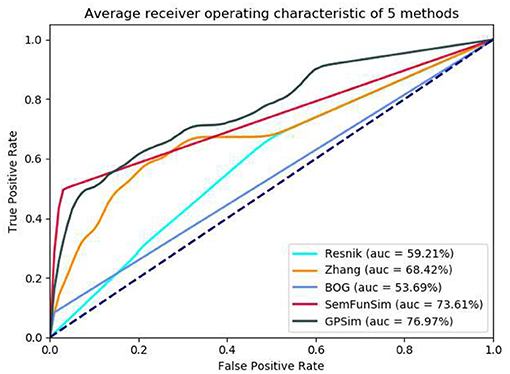
Figure 5. Performance comparisons based on the dataset with few genetic information.
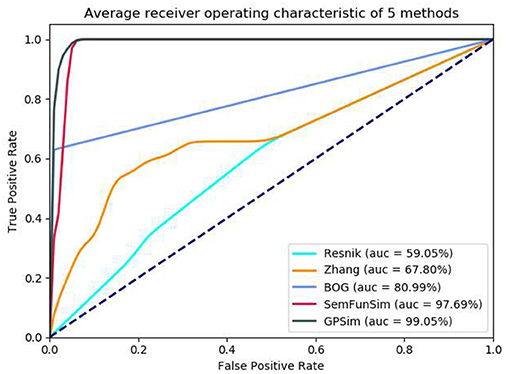
Figure 6. Performance comparisons based on all associations.
Conclusion
The vast amount of biomedical data has brought huge benefits to disease diagnosis and life science research, but it has also brought challenges to the understanding and searching of biological information in different disease terms. Thus, a large number of biomedical ontologies with controlled vocabularies are created for the biomedical knowledge share. Currently, quantitative measures of the associations among diseases by using biomedical ontologies have become the research hotspot. In this paper, we focus on the joint computation of disease similarities by integrating gene and phenotype associations. In particular, we propose an effective method to measure the similarity of diseases in Disease Ontology with disease-related gene and phenotype associations extracted from HPO and other biomedical databases, which calculates the similarities by jointly utilizing their associations. The final experiments show that, our proposed method has the best performance in terms of ROC and AUC, compared with previous methods. In the future, we plan to apply GPSim to the disease annotation applications for providing researchers with a more powerful annotation tool based on biomedical ontologies. Additionally, we would like to involve more information, such as gene sequence, expression information, to improve our disease similarity model.
Data Availability
All datasets analyzed for this study are included in the manuscript and the supplementary files. The source code of GPSim is freely available at https://github.com/lyotvincent/GPSim.
Author Contributions
JL conceived the project, conceptualized the method, designed the studies, and contributed to writing the manuscript. JL, SS, and LZ implemented the algorithms, performed the analysis and contributed to writing the manuscript. All authors read and approved the final version of the manuscript.
Funding
The work was partially supported by the National Key R&D Program of China (2017YFC1200200, 2017YFC1200205, 2018YFC1603800, and 2018YFC1603802), National Natural Science Foundation of China (61602130 and 61872115), China Postdoctoral Science Foundation funded project (2015M581449 and 2016T90294), Heilongjiang Postdoctoral Fund (LBH-Z14089), Natural Science Foundation of Heilongjiang Province of China (QC2015067), Fundamental Research Funds for the Central Universities (HIT.NSRIF.2017036), and Shanghai Municipal Science and Technology Major Project (Grant No. 2017SHZDZX01).
Conflict of Interest Statement
The authors declare that the research was conducted in the absence of any commercial or financial relationships that could be construed as a potential conflict of interest.
Acknowledgments
The authors thank the referees for their valuable comments and suggestions.
References
Bandyopadhyay, S., and Mallick, K. (2014). A new path based hybrid measure for gene ontology similarity. IEEE/ACM Trans. Comput. Biol. Bioinform. 11, 116–127. doi: 10.1109/TCBB.2013.149
Cheng, L., Li, J., Ju, P., Peng, J., and Wang, Y. (2014). SemFunSim: a new method for measuring disease similarity by integrating semantic and gene functional association. PLoS ONE 9:e99415. doi: 10.1371/journal.pone.0099415
Denny, P., Feuermann, M., Hill, D. P., Lovering, R. C., Plun-Favreau, H., and Roncaglia, P. (2018). Exploring autophagy with Gene Ontology. Autophagy 2018, 1–18. doi: 10.1080/15548627.2017.1415189
Groza, T., Köhler, S., Moldenhauer, D., Vasilevsky, N., Baynam, G., Zemojtel, T., et al. (2015). The human phenotype ontology: semantic unification of common and rare disease. Am. J. Hum. Genet. 97, 111–124. doi: 10.1016/j.ajhg.2015.05.020
Harrow, I., Jiménez-Ruiz, E., Splendiani, A., Romacker, M., Woollard, P., Markel, S., et al. (2017). Matching disease and phenotype ontologies in the ontology alignment evaluation initiative. J. Biomed. Sem. 8:55. doi: 10.1186/s13326-017-0162-9
Jeong, J. C., and Chen, X. (2015). A new semantic functional similarity over gene ontology. IEEE/ACM Trans Comput Biol Bioinform. 12, 322–334. doi: 10.1109/TCBB.2014.2343963
Kibbe, W. A., Arze, C., Felix, V., Mitraka, E., Bolton, E., Fu, G., et al. (2014). Disease ontology 2015 update: an expanded and updated database of human diseases for linking biomedical knowledge through disease data. Nucleic Acids Res. 43:D1071–8. doi: 10.1093/nar/gku1011
Kim, M. H., Lee, Y. J., and Lee, J. H. (1993). Information retrieval based on conceptual distance in is - a hierarchies. J. Docum. 49, 188–207. doi: 10.1108/eb026913
Köhler, S., Doelken, S. C., Mungall, C. J., Bauer, S., Firth, H. V., Bailleul-Forestier, I., et al. (2014). The Human phenotype ontology project: linking molecular biology and disease through phenotype data. Nucleic Acids Res. 42, 966–74. doi: 10.1093/nar/gkt1026
Köhler, S., Schulz, M. H., Krawitz, P., Bauer, S., Dölken, S., Ott, C. E., et al. (2009). Clinical diagnostics in human genetics with semantic similarity searches in ontologies. Am. J. Hum. Genet. 85, 457–464. doi: 10.1016/j.ajhg.2009.09.003
Kozaki, K., Yamagata, Y., Mizoguchi, R., Imai, T., and Ohe, K. (2017). Disease compass - a navigation system for disease knowledge based on ontology and linked data techniques. J. Biomed. Sem. 8:22. doi: 10.1186/s13326-017-0132-2
Landrum, M. J., Lee, J. M., Riley, G. R., Jang, W., Rubinstein, W. S., Church, D. M., et al. (2014). ClinVar: public archive of relationships among sequence variation and human phenotype. Nucleic Acids Res. 42:D980. doi: 10.1093/nar/gkt1113
Lee, I., Blom, U. M., Wang, P. I., Shim, J. E., Marcotte, E. M., Lee, I., Blom, U. M., Wang, P. I., et al. (2011). Prioritizing candidate disease genes by network-based boosting of genome-wide association data. Genome Res. 21:1109. doi: 10.1101/gr.118992.110
Lee, I., Lehner, B., Crombie, C., Wong, W., Fraser, A. G., and Marcotte, E. M. (2008). A single gene network accurately predicts phenotypic effects of gene perturbation in Caenorhabditis elegans. Nat. Genet. 40, 181–188. doi: 10.1038/ng.2007.70
Li, B., Wang, J. Z., Feltus, F. A., Zhou, J., Luo, F., et al. (2010). Effectively integrating information content and structural relationship to improve the GO-based similarity measure between proteins. Comput. Eng. Finan. Sci. arXiv 166–172.
Lin, D. (1998). “An information-theoretic definition of similarity,” in International Conference on Machine Learning (San Francisco, CA), 296–304.
Liu, J., and Yan, D. (2016). Answering approximate queries over XML data. IEEE Transac. Fuzzy Syst. 24, 288–305. doi: 10.1109/TFUZZ.2015.2453168
Liu, J., and Zhang, X. (2017). Efficient keyword search in fuzzy XML. Fuzzy Sets Syst. 317, 68–87 doi: 10.1016/j.fss.2016.05.015
Liu, J., Zhang, X., and Zhang, L. (2017). Tree pattern matching in heterogeneous fuzzy XML databases. Knowl. Based Syst. 122, 119–130 doi: 10.1016/j.knosys.2017.02.003
Lovering, R. C., Roncaglia, P., Howe, D. G., Laulederkind, S. J. F., Khodiyar, V. K., Berardini, T. Z., et al. (2018). Improving interpretation of cardiac phenotypes and enhancing discovery with expanded knowledge in the gene ontology. Circ. Genom. Precis. Med. 11:e001813. doi: 10.1161/CIRCGEN.117.001813
Mathur, S., and Dinakarpandian, D. (2012). Finding disease similarity based on implicit semantic similarity. J. Biomed. Inform. 45, 363–371. doi: 10.1016/j.jbi.2011.11.017
Meehan, T. F., Vasilevsky, N. A., Mungall, C. J., Dougall, D. S., Haendel, M. A., Blake, J. A., et al. (2013). Ontology based molecular signatures for immune cell types via gene expression analysis. BMC Bioinformatics 14:263. doi: 10.1186/1471-2105-14-263
Ni, P., Wang, J., Zhong, P., Li, Y., Wu, F., and Pan, Y. (2018). Constructing disease similarity networks based on disease module theory. IEEE/ACM Transac. Comp. Biol. Bioinform. 99:1. doi: 10.1109/TCBB.2018.2817624
Osborne, J. D., Flatow, J., Holko, M., Lin, S. M., Kibbe, W. A., Zhu, L. J., et al. (2009). Annotating the human genome with disease ontology. BMC Genomics 10:S6. doi: 10.1186/1471-2164-10-S1-S6
Patel, S., Roncaglia, P., and Lovering, R. C. (2015). Using Gene Ontology to describe the role of the neurexin-neuroligin-SHANK complex in human, mouse and rat and its relevance to autism. BMC Bioinformatics 16:186. doi: 10.1186/s12859-015-0622-0
Peng, J., Xue, H., Hui, W., Lu, J., Chen, B., Jiang, Q., et al. (2018). An online tool for measuring and visualizing phenotype similarities using HPO. BMC Genom. 19(Suppl. 6), 185–193. doi: 10.1186/s12864-018-4927-z
Peng, K., Xu, W., Zheng, J., Huang, K., Wang, H., Tong, J., et al. (2013). The Disease and Gene Annotations (DGA): an annotation resource for human disease. Nucleic Acids Res. 41, D553–D560. doi: 10.1093/nar/gks1244
Resnik, P. (1995). Using information content to evaluate semantic similarity in a taxonomy. arXiv 448–453.
Santos, R. F. D., Boedihardjo, A. P., and Lu, C. T. (2012). “Towards ontological similarity for spatial hierarchies,” in ACM Sigspatial International Workshop on Querying and Mining Uncertain Spatio-Temporal Data (California, CA).
Schlicker, A., Domingues, F. S., Rahnenführer, J., and Lengauer, T. (2006). A new measure for functional similarity of gene products based on Gene Ontology. BMC Bioinformatics 7:302. doi: 10.1186/1471-2105-7-302
Schriml, L. M., Arze, C., Nadendla, S., Chang, Y. W., Mazaitis, M., Felix, V., et al. (2012). Disease Ontology: a backbone for disease semantic integration. Nucleic Acids Res. 40:940–6. doi: 10.1093/nar/gkr972
Wang, J. Z., Du, Z., Payattakool, R., Yu, P. S., and Chen, C. F. (2007). A new method to measure the semantic similarity of GO terms. Bioinformatics 23, 1274–1281. doi: 10.1093/bioinformatics/btm087
Westbury, S. K., Turro, E., Greene, D., Lentaigne, C., Kelly, A. M., Bariana, T. K., et al. (2015). Human Phenotype Ontology annotation and cluster analysis to unravel genetic defects in 707 cases with unexplained bleeding and platelet disorders. Genome Med. 7:36. doi: 10.1186/s13073-015-0151-5
Yang, H., Meng, Z., Shi, H., Ju, H., Jiang, Q., and Cheng, L. (2017). Measuring disease similarity and predicting disease-related ncRNAs by a novel method. BMC Med. Genom. 10(Suppl. 5):71. doi: 10.1186/s12920-017-0315-9
Zeng, X., Ding, N., Rodríguez-Patón, A., and Zou, Q. (2017). Probability-based collaborative filtering model for predicting gene-disease associations. BMC Med. Genom. 10(Suppl. 5):76. doi: 10.1186/s12920-017-0313-y
Zhang, C., Wang, Y. J., Cui, B., and Cong, G. (2008). “Semantic similarity based on compact concept ontology,” in International Conference on World Wide Web, WWW 2008 (Beijing: DBLP), 1125–1126. doi: 10.1145/1367497.1367688
Zhang, S., Shang, X., Wang, M., and Diao, J. (2010). “A new measure based on gene ontology for semantic similarity of genes,” in Wase International Conference on Information Engineering (Washington, DC: IEEE Computer Society). doi: 10.1109/ICIE.2010.28
Zhao, Y., and Halang, W. (2006). “Rough concept lattice based ontology similarity measure,” in International Conference on Scalable Information Systems, Infoscale 2006, (Hong Kong: DBLP), 15. doi: 10.1145/1146847.1146862
Keywords: disease similarity, phenotype association, genomic annotation, disease ontology, biomedical ontology
Citation: Su S, Zhang L and Liu J (2019) An Effective Method to Measure Disease Similarity Using Gene and Phenotype Associations. Front. Genet. 10:466. doi: 10.3389/fgene.2019.00466
Received: 15 March 2019; Accepted: 30 April 2019;
Published: 21 May 2019.
Edited by:
Quan Zou, University of Electronic Science and Technology of China, ChinaReviewed by:
Jun Wan, Indiana University, United StatesWuritu Yang, Inner Mongolia University, China
Copyright © 2019 Su, Zhang and Liu. This is an open-access article distributed under the terms of the Creative Commons Attribution License (CC BY). The use, distribution or reproduction in other forums is permitted, provided the original author(s) and the copyright owner(s) are credited and that the original publication in this journal is cited, in accordance with accepted academic practice. No use, distribution or reproduction is permitted which does not comply with these terms.
*Correspondence: Jian Liu, amlhbmxpdUBoaXQuZWR1LmNu