 Carlo Maj1*†
 Tiago Azevedo2†
 Valentina Giansanti3†
 Oleg Borisov1
 Giovanna Maria Dimitri2
 Simeon Spasov2Alzheimer’s Disease Neuroimaging Initiative
 Pietro Lió2*
 Ivan Merelli3*
- 1Institute for Genomic Statistics and Bioinformatics, University Hospital Bonn, Bonn, Germany
- 2Department of Computer Science and Technology, University of Cambridge, Cambridge, United Kingdom
- 3National Research Council, Institute for Biomedical Technologies, Milan, Italy
The genetic component of many common traits is associated with the gene expression and several variants act as expression quantitative loci, regulating the gene expression in a tissue specific manner. In this work, we applied tissue-specific cis-eQTL gene expression prediction models on the genotype of 808 samples including controls, subjects with mild cognitive impairment, and patients with Alzheimer's Disease. We then dissected the imputed transcriptomic profiles by means of different unsupervised and supervised machine learning approaches to identify potential biological associations. Our analysis suggests that unsupervised and supervised methods can provide complementary information, which can be integrated for a better characterization of the underlying biological system. In particular, a variational autoencoder representation of the transcriptomic profiles, followed by a support vector machine classification, has been used for tissue-specific gene prioritizations. Interestingly, the achieved gene prioritizations can be efficiently integrated as a feature selection step for improving the accuracy of deep learning classifier networks. The identified gene-tissue information suggests a potential role for inflammatory and regulatory processes in gut-brain axis related tissues. In line with the expected low heritability that can be apportioned to eQTL variants, we were able to achieve only relatively low prediction capability with deep learning classification models. However, our analysis revealed that the classification power strongly depends on the network structure, with recurrent neural networks being the best performing network class. Interestingly, cross-tissue analysis suggests a potentially greater role of models trained in brain tissues also by considering dementia-related endophenotypes. Overall, the present analysis suggests that the combination of supervised and unsupervised machine learning techniques can be used for the evaluation of high dimensional omics data.
Introduction
Nowadays researchers can access omics data at different levels, such as genomics (e.g., dbGaP1), transcriptomics (e.g., GEO expression2) and also at multi-omics levels (e.g., GTEx3, Encode4). Given the advancement of high-throughput technologies, the increasing availability of omics data can be expected over time. This will allow researchers to better analyze complex systems characterized by many interacting features as the biological systems.
Traditional analytical methods on omics data, such as Genome-wide association study (GWAS) and differential expression analysis, usually rely on univariate approaches with specific statistical modelling (Visscher et al., 2017; McDermaid et al., 2018). These approaches, despite being robust, are limited in detecting potential combinatorial effects in the underlying biological system. Indeed, biological networks can be highly complex with many feedback regulatory loops (Franco and Galloway, 2015). A comprehensive analysis of interaction effects is not feasible with traditional approaches due to the combinatorial explosion of the input factor space (Berger et al., 2013).
On the other hand, machine learning methods have proved to be efficient for the analysis of high dimensional complex systems, although the application of machine learning methods in omics data is still relatively uncommon due to the limited interpretability of the outcome of machine learning frameworks (Li et al., 2016). In this work, we investigate the applicability of different machine learning methods on omics data using, as a case study, matrices of tissue-specific predicted transcriptomic profiles in Alzheimer’s disease (AD). AD is a progressive neurodegenerative disorder, representing the predominant form of dementia (Wang et al., 2017), and is characterized by progressive deterioration of memory and cognitive functions that can be tested with different clinical tests (Kirsebom et al., 2017). The pathophysiology of AD involves the formation of the characteristic extracellular amyloid plaques and intracellular neurofibrillary tangles (Kuznetsov and Kuznetsov, 2018).
A lot of research has been done in order to identify the genetics factor contributing to AD. In cases of specific familiar forms of AD, which are recurrent among family members and are characterized by early onset (i.e., age < 65), disease causing mutations in specific genes have been identified, namely amyloid precursor protein (APP), Presenilin 1 PSEN1 and Presenilin 2 PSEN2 (Piaceri et al., 2013). This is not the case of the most common sporadic AD forms, characterized by late onset (age > 65), representing about 95% of AD cases (Bali et al., 2012), for which the “4 allele of Apolipoprotein E (APOE) is the only strong identified genetic risk factor (Dorszewska et al., 2016).
However, the relatively high heritability also of sporadic AD, estimated to be around 60% to 80% (Van Cauwenberghe et al., 2016), combined with the identification of a number of genetic risk loci from GWAS, suggests the presence of a polygenic component in late onset AD (Escott-Price et al., 2015). Indeed, GWAS hits can be associated with different biological pathways, such as cholesterol and lipid metabolism, immune system, inflammatory response, and endosomal vesicle cycling (Lambert et al., 2013). Moreover, several susceptibility loci are localized in gene-dense regions, but it remains unknown which genes of these regions are responsible for the association (Van Cauwenberghe et al., 2016). In fact, identifying the functional role of variants in intergenic regions is not a trivial process, since the related genes might not be the closest to the loci (e.g., chromatin 3D structure can place in proximity relatively distant region in the primary DNA sequence) (Dekker et al., 2013). Moreover, many complex phenotypes have a polygenic architecture, in which many variants have minor effects over a phenotype, and polygenic risk score modeling is capable of finding significant genetic associations for traits with no monogenic causes, but with relatively high heritability (Chatterjee et al., 2016).
Different works show a co-localization between Expression Quantitative Loci (eQTL) and GWAS hits indicating that the biological effect of non-coding variants can be exerted through the regulation of gene expression (Hormozdiari et al., 2016; Wen et al., 2017), that is a polygenic trait in which many variants may be involved. Indeed, different tools model the combined effect of eQTL signals, considering both strong functional SNP effects and additive effects for modest-strength signals (Gamazon et al., 2015; Gusev et al., 2016). Conducting gene association on the basis of the genetic component of gene expression regulation, also called Transcription Wide Association Study (TWAS), proved to be particularly efficient in finding associations with many traits (Gusev et al., 2016).
There are many advantages in testing the genetic component of gene expression rather than evaluating the nominal variant GWAS association: I) the aggregation of multiple eQTL into one gene can boost the association by including additive effect among variants; II) genes are more interpretable biological unit in comparison with variants; III) the statistical power is increased due to the reduction of multiple-comparison tests from hundreds of thousands/million variants (before/after imputation) to the order of thousands of genes (after filtering for gene expression heritability); IV) eQTL are tissue specific and therefore it is possible to perform gene association analysis in the target tissue for the phenotypes and also in secondary tissues for potential peripheral biomarkers (e.g., blood).
Noteworthy, the evaluation of the solely genetic component of gene expression is less comprehensive than the actual gene expression analysis, but has the advantage to focus only on the genetic/heritable component, avoiding environmental confounding effects (Gamazon et al., 2015). Since polygenic effects can be expected also at gene expression level, given the complexity of biochemical systems, performing multi-gene evaluation can provide greater insights concerning potential biological associations (Marigorta et al., 2017). Therefore, machine learning and deep learning methodologies have proved to be efficient at identifying transcriptomic profiles associated with specific phenotypes, considering different input data, such as measured RNA-seq data (Wang et al., 2018), single cell expression (Hu et al., 2016), and also imputed transcriptomic data (Gottlieb et al., 2017).
In this work, we tested multiple machine learning and deep learning approaches to study multi-tissue imputed transcriptomic profiles in the Alzheimer’s Disease Neuroimaging Initiative (ADNI) cohort (Weiner et al., 2013). Noteworthy, the analysis of imputed transcriptomic profiles on ADNI data has been already performed at single gene level identifying, suggesting potential specific gene-tissue associations with amyloid deposition (Hohman et al., 2017). In the following sections we introduce the supervised and unsupervised methods we exploited in this work, the results achieved combining these approaches, and a discussion of the achieved outcomes.
Methods
Machine Learning Methods in Bioinformatics
Machine Learning (ML) algorithms have proved to be particularly useful for the analysis of complex big biological data (Olson et al., 2017). For instance ML has been applied to detect epistasis within the human genome (McKinney et al., 2006) suggesting that ML can reveal non-linear behavior in biological systems. In the same direction, more recent deep learning approaches have been profitably exploited to analyze genotype/phenotype associations (Min et al., 2017) as well as to extract relevant information from many data modalities, including text, images, and sounds (Li et al., 2019).
Deep learning methods follow a data-driven approach and are therefore well-designed to detect nonlinear-behaviors, which are relatively common in natural systems (Tang et al., 2019). Networks can vary depending on the number of layers and type of nodes and not all of them perform equally well on different data typology. Convolutional Neural Networks (CNN) are generally applied to recognize objects in a pattern, Recurrent Neural Networks (RNN) to analyze temporal data, but it is not mandatory to use any kind of network only for a specific task. For instance, CNNs were successfully used to predict the enhancer-promoter interactions with DNA sequences (Zhuang et al., 2019) and for accurate clustering of sequences (Aoki and Sakakibara, 2018). RNNs were used instead for predicting transcription factor binding sites (Shen et al., 2018) and to dissect the regulation of mRNA to protein-coding translation (Hill et al., 2018).
Noteworthy, also variational autoencoders (VAEs) showed good performance in capturing biologically relevant feature in gene expression data analysis (Way and Greene, 2017a). VAEs are part of a large branch of deep learning architectures, the so called generative models (Goodfellow, 2016). These architectures are based on an encoding-decoding approach and, differently from the standard autoencoders, they assume a stochasticity in the modelling of the data. The original input matrices of features are compressed in a lower dimensional space, the so called encoding phase, and are reconstructed back in a second step, called decoding phase. Both phases are composed by neural networks. VAEs have seen increasing success in many different applications in the last few years, among the unsupervised methodologies recently developed, and they are widely used in different types of data such as time series, images or gene expressions (Goodfellow, 2016; Goodfellow et al., 2016; Way and Greene, 2017b).
Tissue Specific Gene Expression Imputation
Data used for the preparation of this article were obtained from the Alzheimer’s Disease Neuroimaging Initiative (ADNI) database (adni.loni.usc.edu). ADNI was launched in 2003 as a public-private partnership led by Michael W. Weiner, MD. The primary goal of ADNI has been to test whether serial Magnetic Resonance Imaging (MRI), Positron Emission Tomography (PET), other biological markers, clinical and neuropsychological assessment can be combined to measure the progression of mild cognitive impairment (MCI) and early Alzheimer’s disease (AD). In the present work, we analyzed the ADNI1-GWAS dataset including gene array genotyping data for 808 samples available on ADNI portal.
Rigorous quality control has been performed. Namely, samples have been checked for sex, missing genotype rates lower than 0.05 and heterozygosity levels F < 0.2, while variants with Hardy–Weinberg p-value < 1e – 10 have been removed. Then, using the tool by W. Rayner5 we checked SNPs for strand consistency, allele names, position, Ref/Alt assignments and minor allele frequency (MAF) in comparison to the reference panel. In order to increase the available genetic information, we imputed our data using Sanger Imputation Server6 exploiting Eagle2 for phasing (Loh et al., 2016) and Positional Burrows–Wheeler Transform (Durbin, 2014), considering Haplotype Reference Consortium version 1.1 (McCarthy et al., 2016) as reference panel. As a postimputation quality control, we removed variants with info quality level < 0.6. Genotype calls with posterior probability < 0.9 were set to missing. Post-QC imputed data was used to estimate gene expression regulation across the different samples.
In order to predict the genetic component of gene expression, we used PrediXcan that evaluates the aggregate effects of cis-regulatory variants (within 1MB upstream or downstream of genes of interest) on gene expression via an elastic net regression method (Gamazon et al., 2015). PediXcan needs a reference dataset in which both genome variation and gene expression levels have been measured to build prediction models for gene expression. We exploited already available models trained on GTEX data7 to impute tissues specific transcriptomic profiles in a total of 42 tissues (we excluded sex specific tissues, e.g., prostate, ovary, etc.). The imputed transcriptomic profiles were subsequently analyzed using different machine learning approaches (Figure 1). On the one hand, unsupervised machine learning methods were used to analyze data structure, on the other hand, supervised methods were used to test for the presence of “signal” compared to AD related phenotypes.
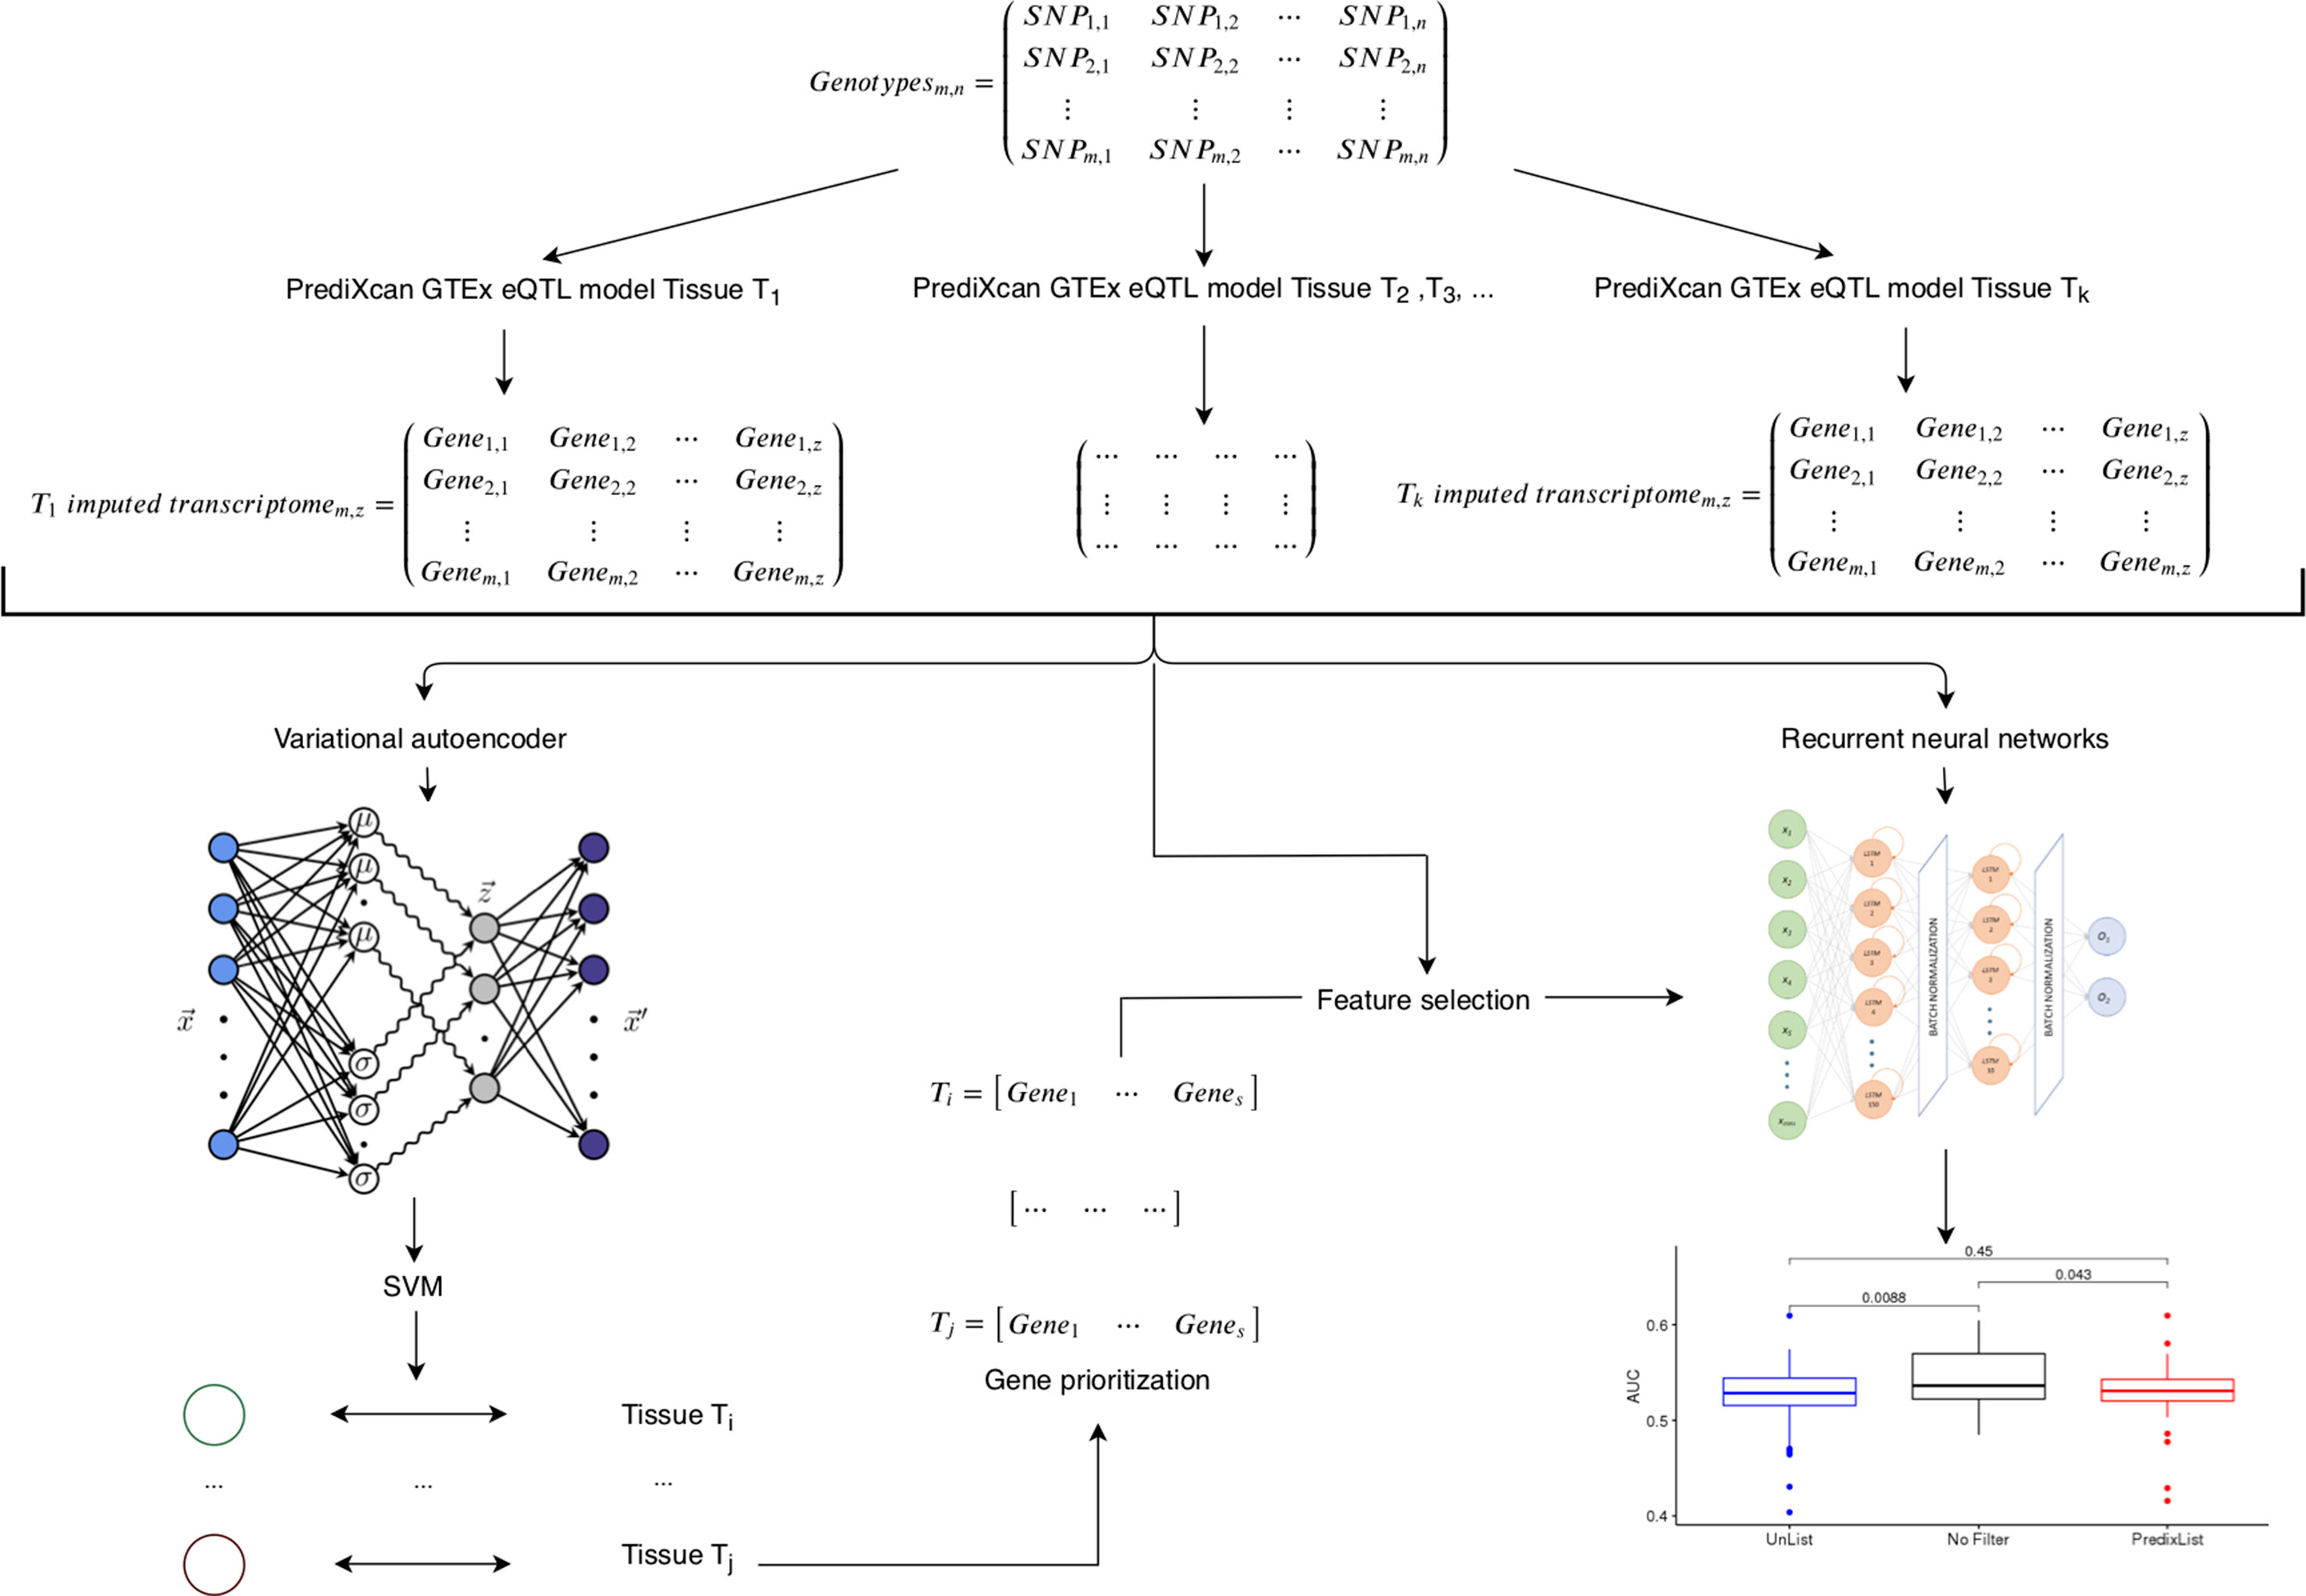
Figure 1 Framework of integrative analysis of multi-tissues expression profiles. Starting from genotyping data (m individuals per n variants) we imputed tissues specific transcriptomic profiles (for any tissue Ti, where i = 1‚…‚ k) by means of cis-eQTL PrediXcan models trained on GTEx data. Variational autoencoder followed by support vector machine (SVM) latent dimension-tissue match on the imputed gene expression matrices (m individuals per z genes) is used as a feature selection to identify the most relevant genes per tissue (Ti = gene1‚…‚ genes where i is the ith tissue and s in the number of prioritized genes) to provide as input of the recurrent neural network classifier.
Gene Prioritization
Gene prioritization was performed considering as input the predicted transcriptomic matrices from ADNI1-GWAS (excluding sex-specific tissues) resulting in a total of 42 tissues with 808 samples each (42 × 808 = 33, 936 samples overall). We performed an independent analysis involving 528 “cases”, that included people affected by dementia and/or with cognitive dysfunction (AD and MCI) for a total of 528 × 42 = 22, 176 input data, and 280 controls including healthy subjects for a total of 280 × 42 = 11, 760 input data. Each sample was comprised of 24, 203 genes in total.
To identify relevant genes we used variational autoencoders (VAEs) with a single hidden layer with a dimension of 42 units, hence matching the number of tissues. We adapted the code publicly provided by Way and Greene (2017b) to implement our VAE’s architecture. In the encoding phase, the network inputs are the original dataset features representation . These are transformed by means of non-linear activation functions in a hidden representation that we denominated and that we assume being characterized by a Gaussian probability density function. In this phase the 2 latent representations of μ and λ of the distribution are learned.
The second part of the architecture that we denoted as the decoder is again built as a neural network. The input this time is the vector i.e. the latent stochastic representation of the input dataset and the output will be the reconstructed representation of the original input vector . A representation of the VAE architecture can be seen in Figure 1. The loss function of the VAE consists of two parts: the first part being the reconstruction loss (negative log-likelihood) and the second part being the function expressing the Kullback–Leibler (KL) divergence considering the learned hidden distribution and a priori Gaussian distribution (Wetzel, 2017).
The first term of the loss function is considered over the encoder distribution of the hidden representation and it “encourages” the decoding phase to correctly reconstruct the input data (Altosaar, 2019). KL divergence is used to enforce the similarity between the distribution of the latent representation and the normal distribution.
We used separate VAEs to encode the gene expression of the cases and healthy classes. Original data include positive (upregulated genes) and negative values (downregulated genes). In order to compute VAE analysis, input data have been scaled between 0 and 1. Noteworthy, different genes can be present in different tissues while VAE pipeline requires an equal number of gene as input, thus NaN (non-existent/Not a Number) values during VAE input preprocessing were set to 0. The input samples were randomly split in training (80%) and test sets (20%) using a stratified approach to maintain the same proportion of samples per tissue. We used the Adam optimizer (Kingma and Ba, 2014) with a learning rate of 0:001 over 75 epochs over the data, rectified linear units during the encoding stage, sigmoid activation during the decoding stage, batch size of 500, and warmup (ĸ) of 1. Hyperparameters were manually selected using a VAE that was not used further in the analysis, to achieve optimal reconstruction performance without overfitting. The entire autoencoding procedure was repeated 75 times separately for the healthy and AD classes in order to study the repeatability of results.
The main goal of the unsupervised analysis was to identify the up or down-regulation of certain genes in specific tissue types in cases and healthy samples. We used a two-step procedure to achieve this association: we identified the tissue(s) encoded in each latent dimension unit of the VAE models, and then we identified the genes most strongly connected to the given latent dimension unit.
In order to identify the tissue(s) encoded in each latent dimension, we used the activations of the hidden layer in the VAEs as an input feature to 42 binary Support Vector Machine (SVM) classifiers, one for each tissue. We trained each SVM classifier to predict whether the input sample to the VAE belonged to a specific tissue relying on the activation value of a single unit from the embedded latent dimension of the VAE. We repeated this tissue-latent unit association procedure for each tissue and each unit in the hidden VAE layer. We performed a 5-fold stratified cross-validation using a linear SVM (C = 1 with class weight balance), thus running a total of 5 × 42 × 42 SVM classifiers for each VAE (a 5-fold cross validation procedure, for 42 binary classifiers, for each one of the 42 hidden layer’s unit). We considered a given latent VAE unit to be predictive of a specific tissue type, hence associated with it, if the F1 score was greater than 0.8. We found that some hidden units encode more than 1 tissue type.
It is noteworthy to mention that we tried other unsuccessful approaches. Firstly, we tried to use a single VAE with both cases and controls, trying to find subclusters besides the tissues which cluster very well (see Figure 2) in the VAE’s latent dimension as well as in the original data. We also tried to use a single VAE for each tissue in separate. No obvious structures were found when trying to match the results of t-SNE algorithm with all the available phenotypes, including case/control status. Filtering the input for genes within each tissue that show nominal significance for case/control status using standard simple univariate tests did not improve the results. Filtering genes with R2 > 0.15 of expression prediction using the same threshold as in Hohman et al.ʹs work (Hohman et al., 2017) did not improve the results as well. In order to understand the features important for classification, we also implemented a saliency map approach. This method is able to detect where the attention of the network (VAEs in our study) is focused (Itti et al., 1998), which can be seen as a sensitivity analysis approach. Saliency maps are generally applied in computer vision but, they can be used in other areas. In our case, the maps were computed on the encoder part of the VAEs and the information extracted is the importance of each gene in the analysis, which is coded as an rgb color code. From this analysis we were not able to identify significative patterns in the input data.
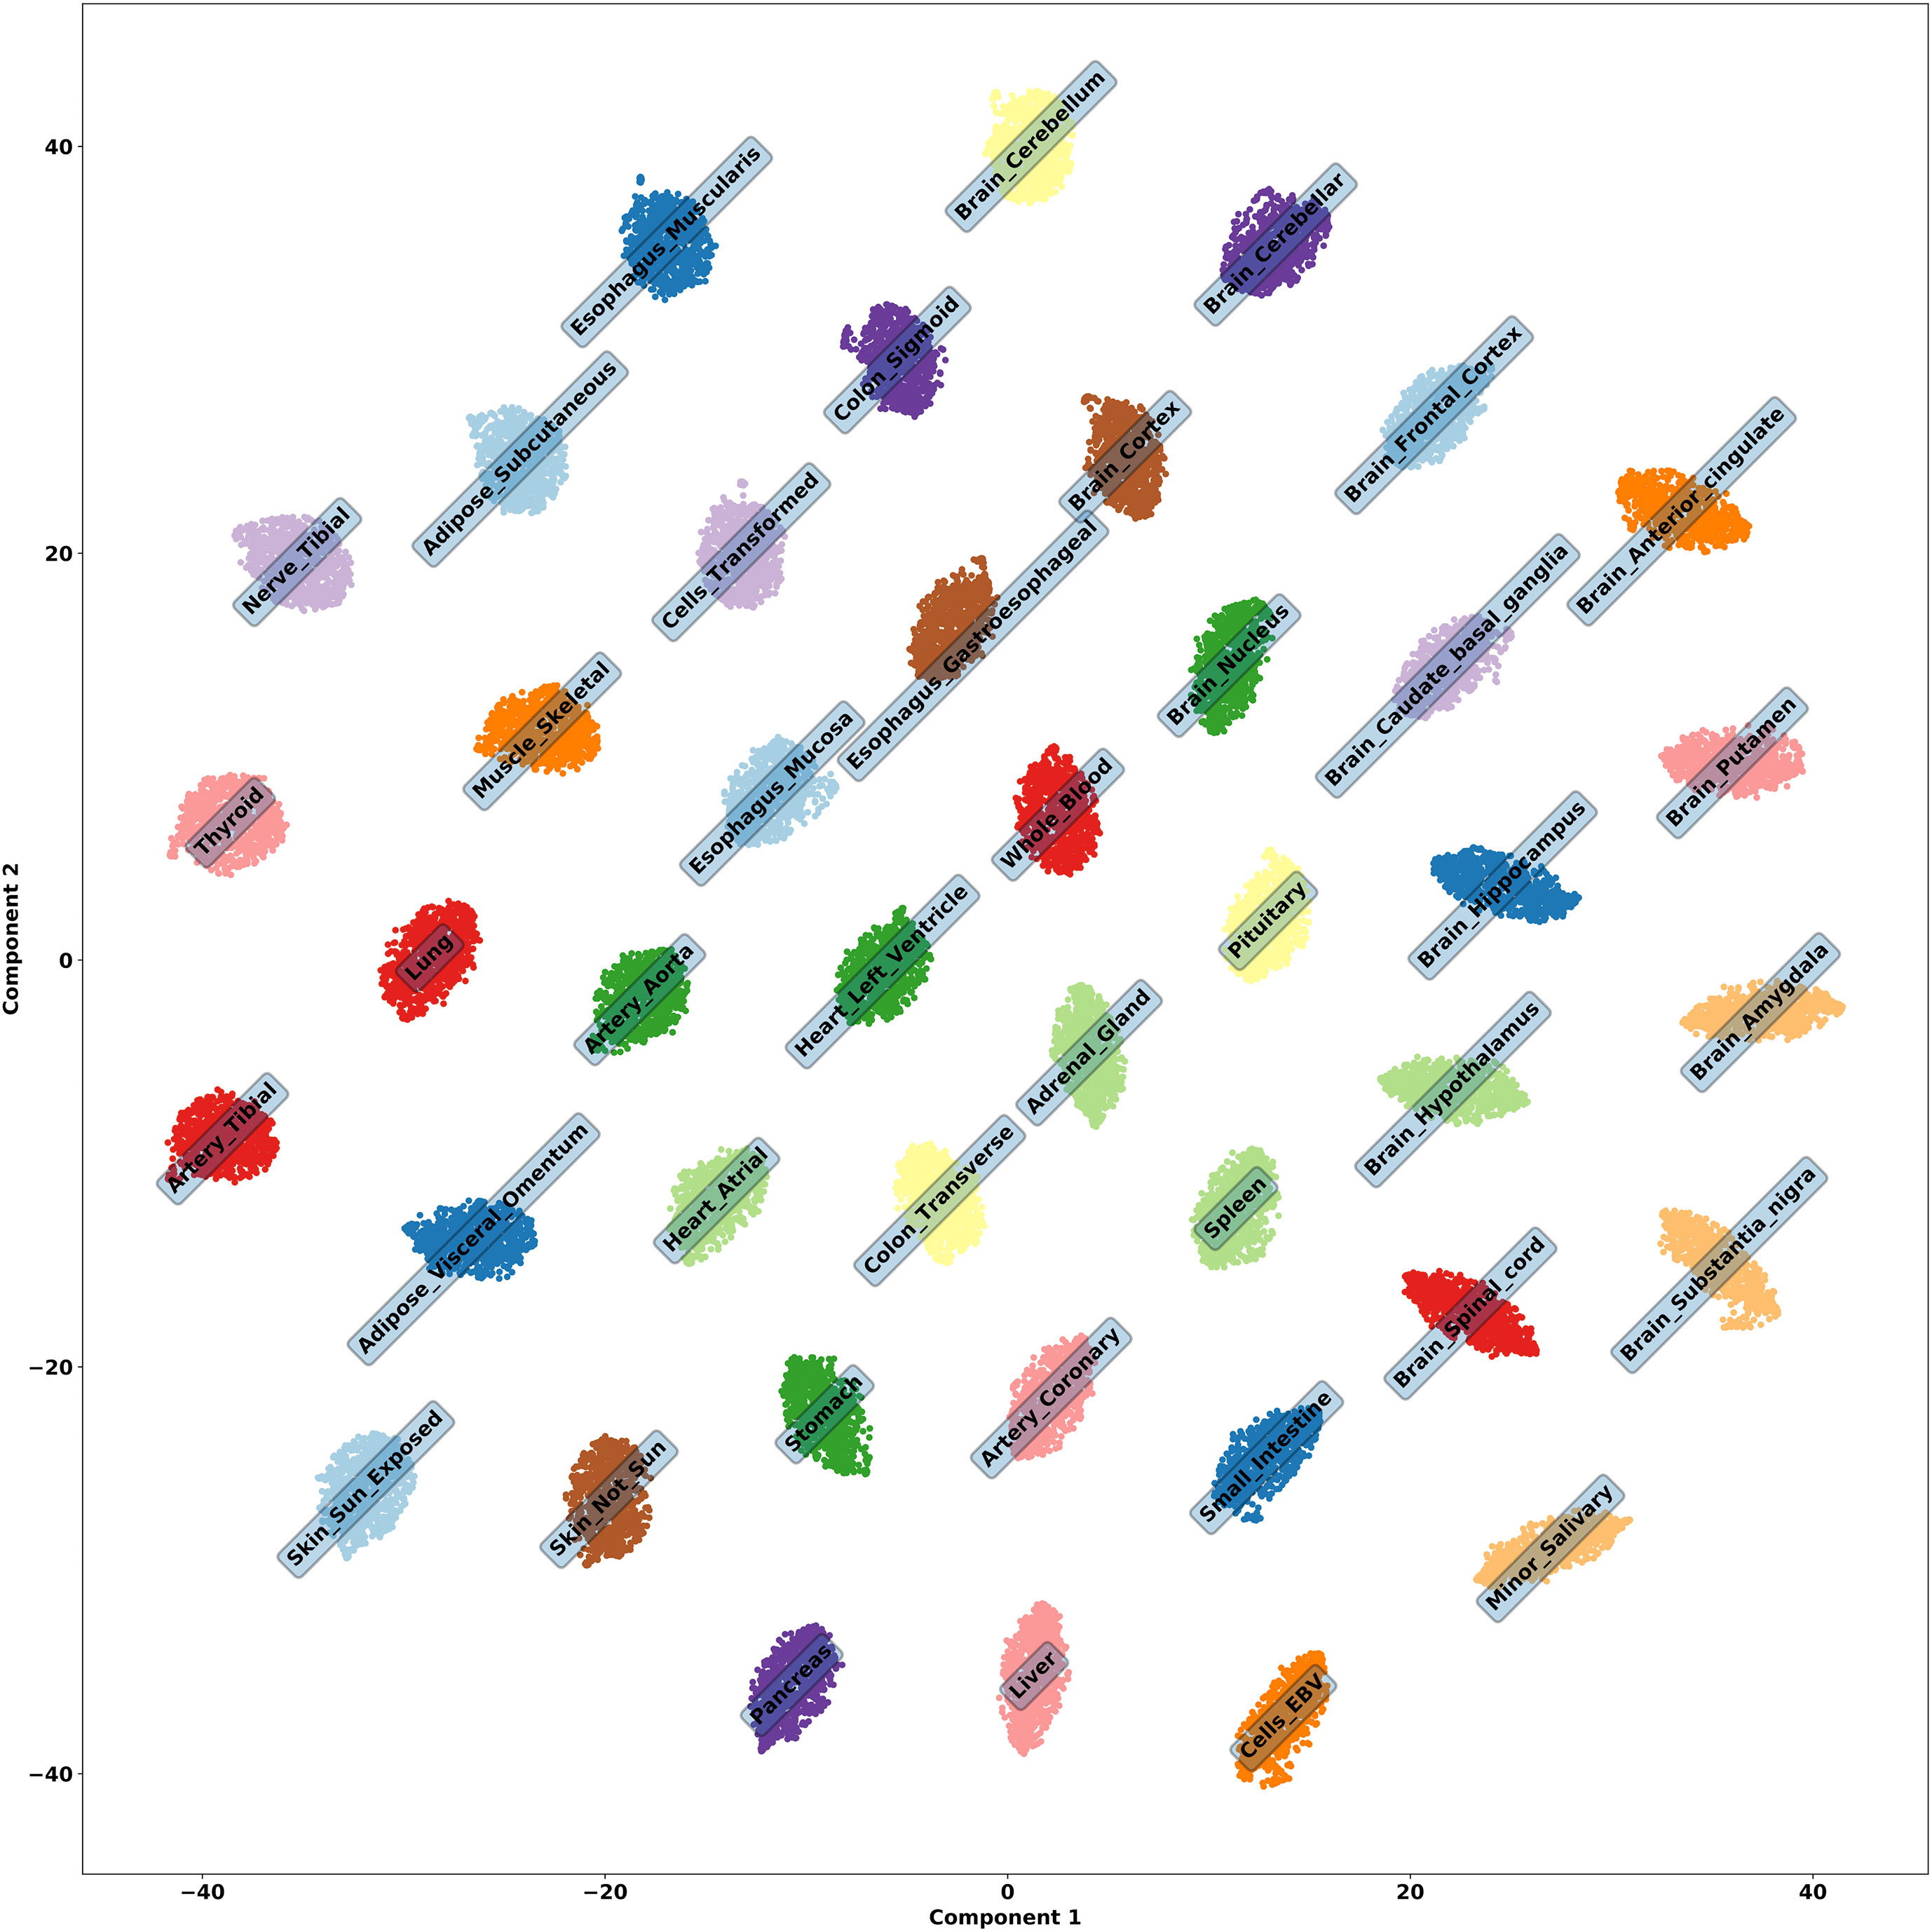
Figure 2 t-SNE embedding of tissue genes, run using the 42 activations on the latent dimension of a VAE to check the embedded structure of all samples. It is obvious that the latent activations are encoding information about each tissue.
Considering the VAE used in this work, the association of the genes with the latent dimension units can be performed solely relying on the magnitude of the corresponding network weights. Given that each VAE has a single hidden layer, each latent dimension unit is connected directly to every output unit, i.e. reconstructed gene, via a linear transformation. Since each reconstructed gene is a summation of the weighted contribution of each latent unit, we could rank the relative importance of the units in the hidden layer relying on the magnitude of the weights. Thus, we selected the 100 most positive and 100 most negative weights for each latent unit encoding a given tissue. This resulted in a set of 100 upregulated and 100 downregulated genes, respectively for each of the trained VAEs. The entire association procedure was performed for the 75 VAEs from healthy and AD samples. We counted the total number of times a given gene was considered up or downregulated by our association procedure and kept it if it appeared more than three times overall. As a result, we produced a list of up or down regulated genes associated with each of the 42 types of tissues. We used this list as an input for pathway enrichment analysis.
In order to perform enrichment analysis, we used Fast Gene Set Enrichment Analysis (FGSEA), a tool developed by Sergushichev et al. (Sergushichev, 2016). The approach implemented by FGSEA deals with quantitative data having inherently directionality like gene expression. The model is based on gene statistic array S = Si‚…Sn where N is the number of samples and Si > 0 represent over-expression of gene i while Si < 0 represent down-expression. The absolute value of Si represents a magnitude of the change. The list of gene sets P of length m usually contains groups of genes that are commonly regulated in certain biological process. To quantify a co-regulation of genes in a gene set pSubramanian et al. (2005) introduced a gene set enrichment score function sr(p) that uses gene rankings (values of S). Given a gene set p the more positive is the value of sr(p) the more enriched the gene set is in positively-regulated genes g with Sg > 0, accordingly, negative sr(p) corresponds to enrichment of negatively regulated genes. To deal with multiple-comparison issues an empirical p-value is computed by randomly sampling gene sets of the same size of p.
The lists of downregulated and upregulated genes per tissue (referred as List-unsupervised) have been considered also as a feature selection step to build prediction models. We also tested other approaches to identify the most relevant genes as considering: I) nominal significantly associated genes from logistic association test between predicted gene expression levels and phenotype status (referred as List-PrediXcan), II) nominal associated genes derived by the combination of single tissue-trait association using generalized Berk–Jones test (referred as List-UTMOST) obtained with UTMOST tool (Hu et al., 2019).
Phenotype Prediction Models From Imputed Transcriptomic Matrices
Several supervised analysis techniques were tested in order to understand which one could achieve better results in identifying cases and controls from the transcriptomic profiles: Logistic Regression (LR), Support Vector Machine (SVM), Random Forest (RF) and Deep Learning networks. The latter are known to achieve better results compared to other machine learning methods, especially when the relationships between the observed features is not supposed to be linear (LeCun et al., 2015).
Since we imputed data according to specific tissues, we searched the model that would perform better among them. For this reason, we randomly selected 6 of the 42 tissues (Adipose Subcutaneous, Artery Aorta, Brain Spinal, Colon Transverse, Thyroid, Whole Blood) and trained the models on 600 of the 808 samples from ADNI1-GWAS, considering that the dataset is slightly unbalanced, as it contains more AD samples (528) than controls (280). SVM, RF and LR were not capable of learning how to classify cases and controls, since they assigned the samples only to the majority class. Concerning Deep Learning, the first accomplishment was understanding the appropriate architecture to elaborate transcriptomic data: we tested two Dense Neural Networks (DNN), two CNNs and an RNN.
The first DNN (DNN-1) consisted of 6 layers with respectively 800, 500, 400, 200, 40 and 2 nodes (called neurons). The second DNN (DNN-2) tested consisted of only three layers with 800, 200 and 2 neurons. The first CNN (CNN-1) had 6 layers: a convolutional layer of 10 filters, a convolutional layer of 5 filters after which a dropout regularization was applied, another convolutional layer of 5 filters, a dense layer of 200 neurons with a dropout, and two dense layers of 100 and 2 neurons in the end. The second CNN (CNN-2) was a pure convolutional network of two convolutional layers of 10 and 5 filters, with a dropout regularization applied between them, and a dense layer with 2 neurons as the output layer. The RNN had 3 layers: two Long Short-Term Memory cells (LSTM) with output dimension of 30 and 20 and a final dense layer of 2 neurons.
Looking at the preliminary training results (Table 3) we decided to select and optimize the RNN, manually searching the optimal network’s size and then identifying the hyperparameters with the Grid Search algorithm (batch size = 100, epochs = 100). The final architecture consisted of the input and output layers and two hidden LSTM layers of 150 and 10 output dimensions. After every hidden layer a batch normalization was applied to maintain the mean activation close to 0 and the activation standard deviation close to 1. The input layer dimension was equal to the number of genes characterizing the tissue transcriptomic profile, while the output layer was a dense layer of dimension two to make possible the classification of the samples in AD and not-AD.
Considering all the 42 tissues, we had the chance to perform two types of analysis: a tissue-specific analysis and a cross-tissue analysis. In the tissue-specific analysis, we trained models on transcriptomic data specific for each tissue. Therefore, we implemented predictive models that could impute the case/control condition on new transcriptomic data related to the same tissue. The input dimensions of the networks were in the order of thousands, but different for every tissue: the minimum was 2,041 characterizing the Brain Substantia Nigra tissue, and the maximum was reached by the Thyroid tissue with 9,655.
The aim of the cross-tissue analysis was, on the other hand, to observe the similarities between tissues in relationship with the Alzheimer’s disease. Models were trained on each single tissue, taking as input the genes shared by all the 42 tissue transcriptomic profiles (24, 203). The column reporting the information for a gene was filled with zeros if it was not possible to impute the transcriptomic profile of that gene in a specific tissue. Comparing the maximum number of genes imputed for the tissues and the total number of genes identified in all the analysis, it was clear that the new arranged matrices of 24, 203 genes for 808 samples were particularly sparse. The models were then used to impute the case/control condition on tissues different to the one used for the training.
Both in single tissue and cross-tissue analyses all the models were trained on 600 samples from ADNI1-GWAS and the tests were performed on the remaining 208 samples. The network architecture was in all cases the one in Figure 1, adjusting the input dimension according to the different analysis. A 10-fold cross validation was applied and models compiled with the Adam optimizer and the binary cross-entropy as the optimization score function. The monitored scores were the accuracy, area under the curve (AUC), precision, recall, and F1. The saliency map was applied in the first LSTM layer, therefore we could observe if some samples were more informative than other for the classification purpose. Keras8 and Scikit-learn9 Python libraries were used, built on top of TensorFlow10 to implement the networks.
We then worked on features selection to find groups of genes that were likely to improve the model performance regarding the samples partition in case/control, both in the single-tissue and cross-tissues approaches. The identification of such groups in single-tissue analysis can bring to the determination of tissue specific markers, on the other hand in the cross-tissues section we could focus on the set of genes that explained the relationship between tissues. We used three different filter lists: List-unsupervised, List-PrediXcan and List-UTMOST (see Supplementary Materials Section 3). Using these lists the input dimensions for all the tissues decreased: the number of unique genes identified by the List-unsupervised was 2,016, 4,984 with List-PrediXcan. List-UTMOST (649 genes) was used only in the cross-tissue analysis as it doesn’t provide tissue-specific information.
All the steps described above (except the architecture selection and saliency map) were also performed considering Cognitive Decline over time rather than diagnosis at screening. This dataset consisted of 528 samples (some samples did not have this information), 281 controls and 247 cases. Cognitive Decline has been calculated by considering the difference between the Mini-Mental State Examination (MMSE) score 4 years after recruitment and the MMSE score at recruitment. Then, regardless of the original recruitment diagnosis, we classified the samples into two groups: one group showing no cognitive decline (difference equal or greater than 0) and the other showing a cognitive decline (difference minor than 0). The genes imputed for each tissue were therefore the same in ADNI1-GWAS dataset and Cognitive Decline dataset. To consider the effect of AD related variables, we also performed the same analyses by stratifying by sex and early/late onset for dementia and AD [using 65 years of age as a cutoff (Roberts and Petersen, 2014)] as well as for carrier and noncarrier of APOE ∊4 isoform.
Results
We predicted the genetic component of gene expression across 42 non-sex-specific tissues for all the samples included in ADNI1-GWAS dataset. We exploited tissues specific eQTL models available on precictDB11 and used PrediXcan tool12 to derive tissue specific matrices representing individual levels of the genetic component of gene expression. The gene levels obtained by these sample matrices represent transcriptomic profiles based on eQTL across tissues in the analyzed dataset.
In the present work the matrices of imputed expression were analyzed using several machine learning strategies to identify potential tissue specific transcriptomic profiles associated with cognitive decline in Alzheimer’s.
Gene-Based Results Per Tissue
We runned t-SNE (Maaten and Hinton, 2008) using the 42 activations on each latent dimension of a VAE to check the embedded structure of all samples, whose result can be seen in Figure 2. Although interpretations of Euclidean distances between points in a t-SNE plot is not straightforward (Wattenberg et al., 2016), it is clear from the clusters that information about tissues are being encoded. Indeed, we were able to identify associations between latent dimensions of VAE and tissue.
The evaluation of the weights associated with the latent dimension (see Methods) allow us to rank gene importance per tissue considering case/control status. Table 1 shows the most upregulated and downregulated genes from Brain Nucleus. Check Supplementary Table S1 for complete information over all 42 tissues.
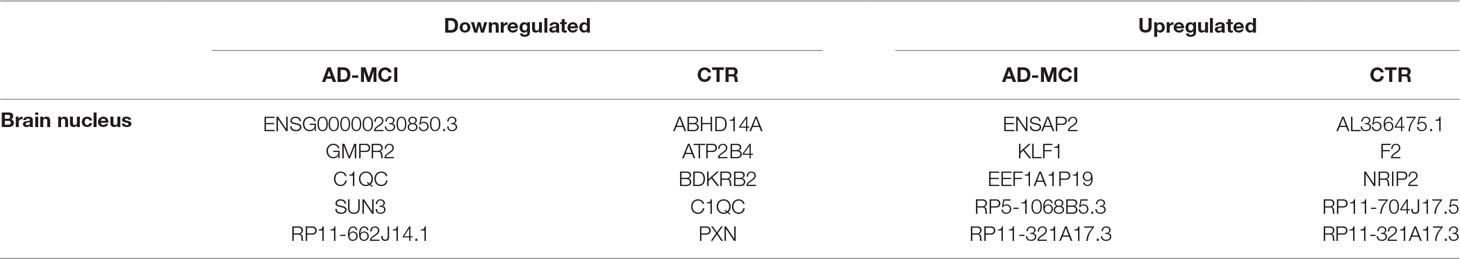
Table 1 Most upregulated and downregulated genes from the brain nucleus.
The saliency map implementation returned not useful information. If taken individually, genes don’t have much impact: it is evident also with this result that the AD phenotype is due to a combination of many genes and environmental factors.
In order to investigate the presence of specific gene expression regulation associated with case/control status we considered the lists of tissue-specific up and down regulated genes derived by VAE analysis. Additionally, for each tissue we considered the genes that were differentially regulated in cases but not in controls, that is representing a disease-specific signature. The enrichment analysis have been performed considering Gene ontology13, KEGG14 and reactome15 and pathway databases (Croft et al., 2013; Kanehisa et al., 2016). Complete enrichment analysis results are available as supplementary files (see Supplementary Materials Section 1) while significant enrichment tissues specific pathways after FDR correction are shown in Table 2.
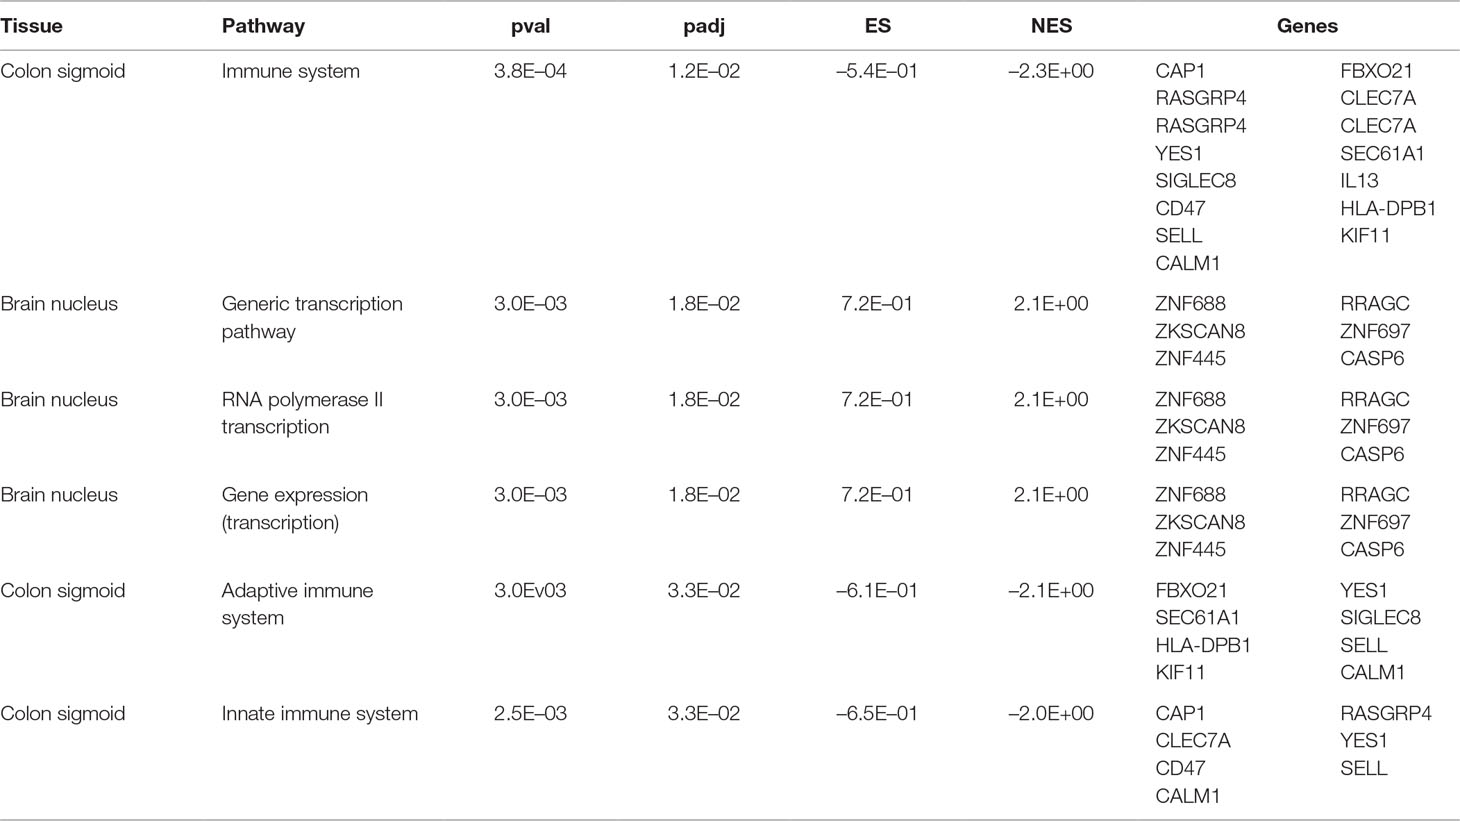
Table 2 Significant tissue-pathways enrichment analysis using Reactome database.
Interestingly enrichment analysis shows the presence of tissue specific signal in a specific brain tissue (i.e., brain nucleus) concerning pathways involved in gene expression regulation and in immune-related pathways in colon (Figure S2). The most significant alterations in brain pathways concern the brain nucleus accumbens (basal ganglia) region. Interestingly, this region has been found to be associated with AD (Nie et al., 2017; Nobili et al., 2017; Li et al., 2018). Instead, the detected downregulation of immune system pathways in cases in comparison to controls could indicate a higher level of inflammation in dementia. This is in line with the association observed between inflammatory bowel diseases and AD (McCaulley and Grush, 2015; Sochocka et al., 2019). Given the pivotal role of APOE (Liu et al., 2013) in AD a specific evaluation was performed to evaluate the effect of APOE related genes.
APOE gene expression is not predicted by gene expression imputation GTEx based models, due to the absence of eQTL explaining a relevant fraction of APOE expression level. However, AD susceptibility due to APOE isoforms (∫2, ∫3 and ∫4), which are well known to confer a different risk for AD depending on the presence of missense coding variants, are associated with APOE gene functionality and can be independent from the genetic component of gene expression regulation. We investigated if other genes directly interacting with APOE, according to string functional database16, have a significant association in our analysis (see Supplementary Materials Section S3).
One of the 11 genes identified, namely APOC2 (Shao et al., 2018), is among the top differentially regulated genes from variational autoencoder gene prioritization list in brain putamen, an area of the brain associated with AD (Coupé et al., 2019). Interestingly, the same gene is also the only one (among the 11 APOE interacting genes) significantly associated with AD according to a transcription wide association analysis performed according to a GWAS on AD in UK Biobank dataset (Marioni et al., 2018) and public available on TWAS hub17. This suggests a potential role for APOC2 associated with the gene expression regulation and, interestingly, a recent work showed that the methylation profile in such a gene (which in turn affect gene expression) is associated with AD (Shao et al., 2018).
Tissue-Specific and Cross-Tissues Classification
To understand which network performs better on different tissues, we tested five models on six sample tissues. In Table 3, accuracy and AUC obtained during their preliminary 10 cross-validation training on 600 of 808 samples are reported: although all methods could perform well at least on one tissue during the training, in that phase only the RNN was capable of reaching an accuracy higher than 90% for all of them. Therefore we decided to optimize the RNN and obtained the network structure described in Phenotype Prediction Models From Imputed Transcriptomic Matrices, which was then applied for the single-tissue and cross-tissue analysis on ADNI1-GWAS and Cognitive Decline dataset.
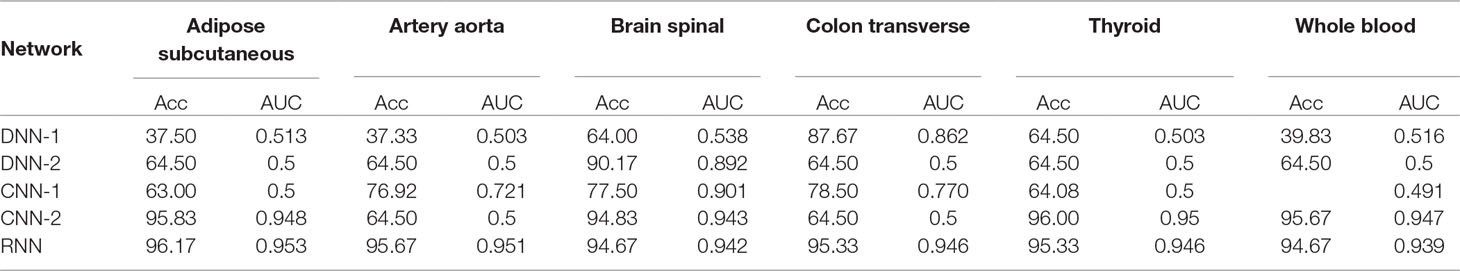
Table 3 Preliminary networks training performance on six sample tissues: accuracy (Acc) and area under the curve (AUC).
Without the feature selection, we observed a great performance during the training in terms of AUC, accuracy, precision, recall and F1 scores (see Supplementary Materials Section 2) on both datasets. On test set (composed of 208 samples for tissue for ADNI1-GWAS and 128 for Cognitive Decline) the metrics reached values below expectations, with AUCs near 0:5 especially for ADNI1-GWAS.
On ADNI1-GWAS (Figure 3), models trained for single-tissue analysis improved their AUCs thanks to the List-unsupervised and List-PrediXcan feature selection: when the AUCs were below 0:5, the filters application returned a score above the threshold for at least one list. We did not observe a major impact of a list in this phase but the t-test confirmed a significant improvement compared to the no filter approach (p-value = 0.001474 for List-unsupervised and p-value = 2.693e – 06 for List-PrediXcan). Models trained for the cross-tissue analysis instead had a less evident improvement with the lists filter: only the List unsupervised returned a slightly significant improvement (p-value = 0.04084). List-UTMOST did not give any improvement and, as we could not use it on single-tissue models, we decided not to further analyze it.
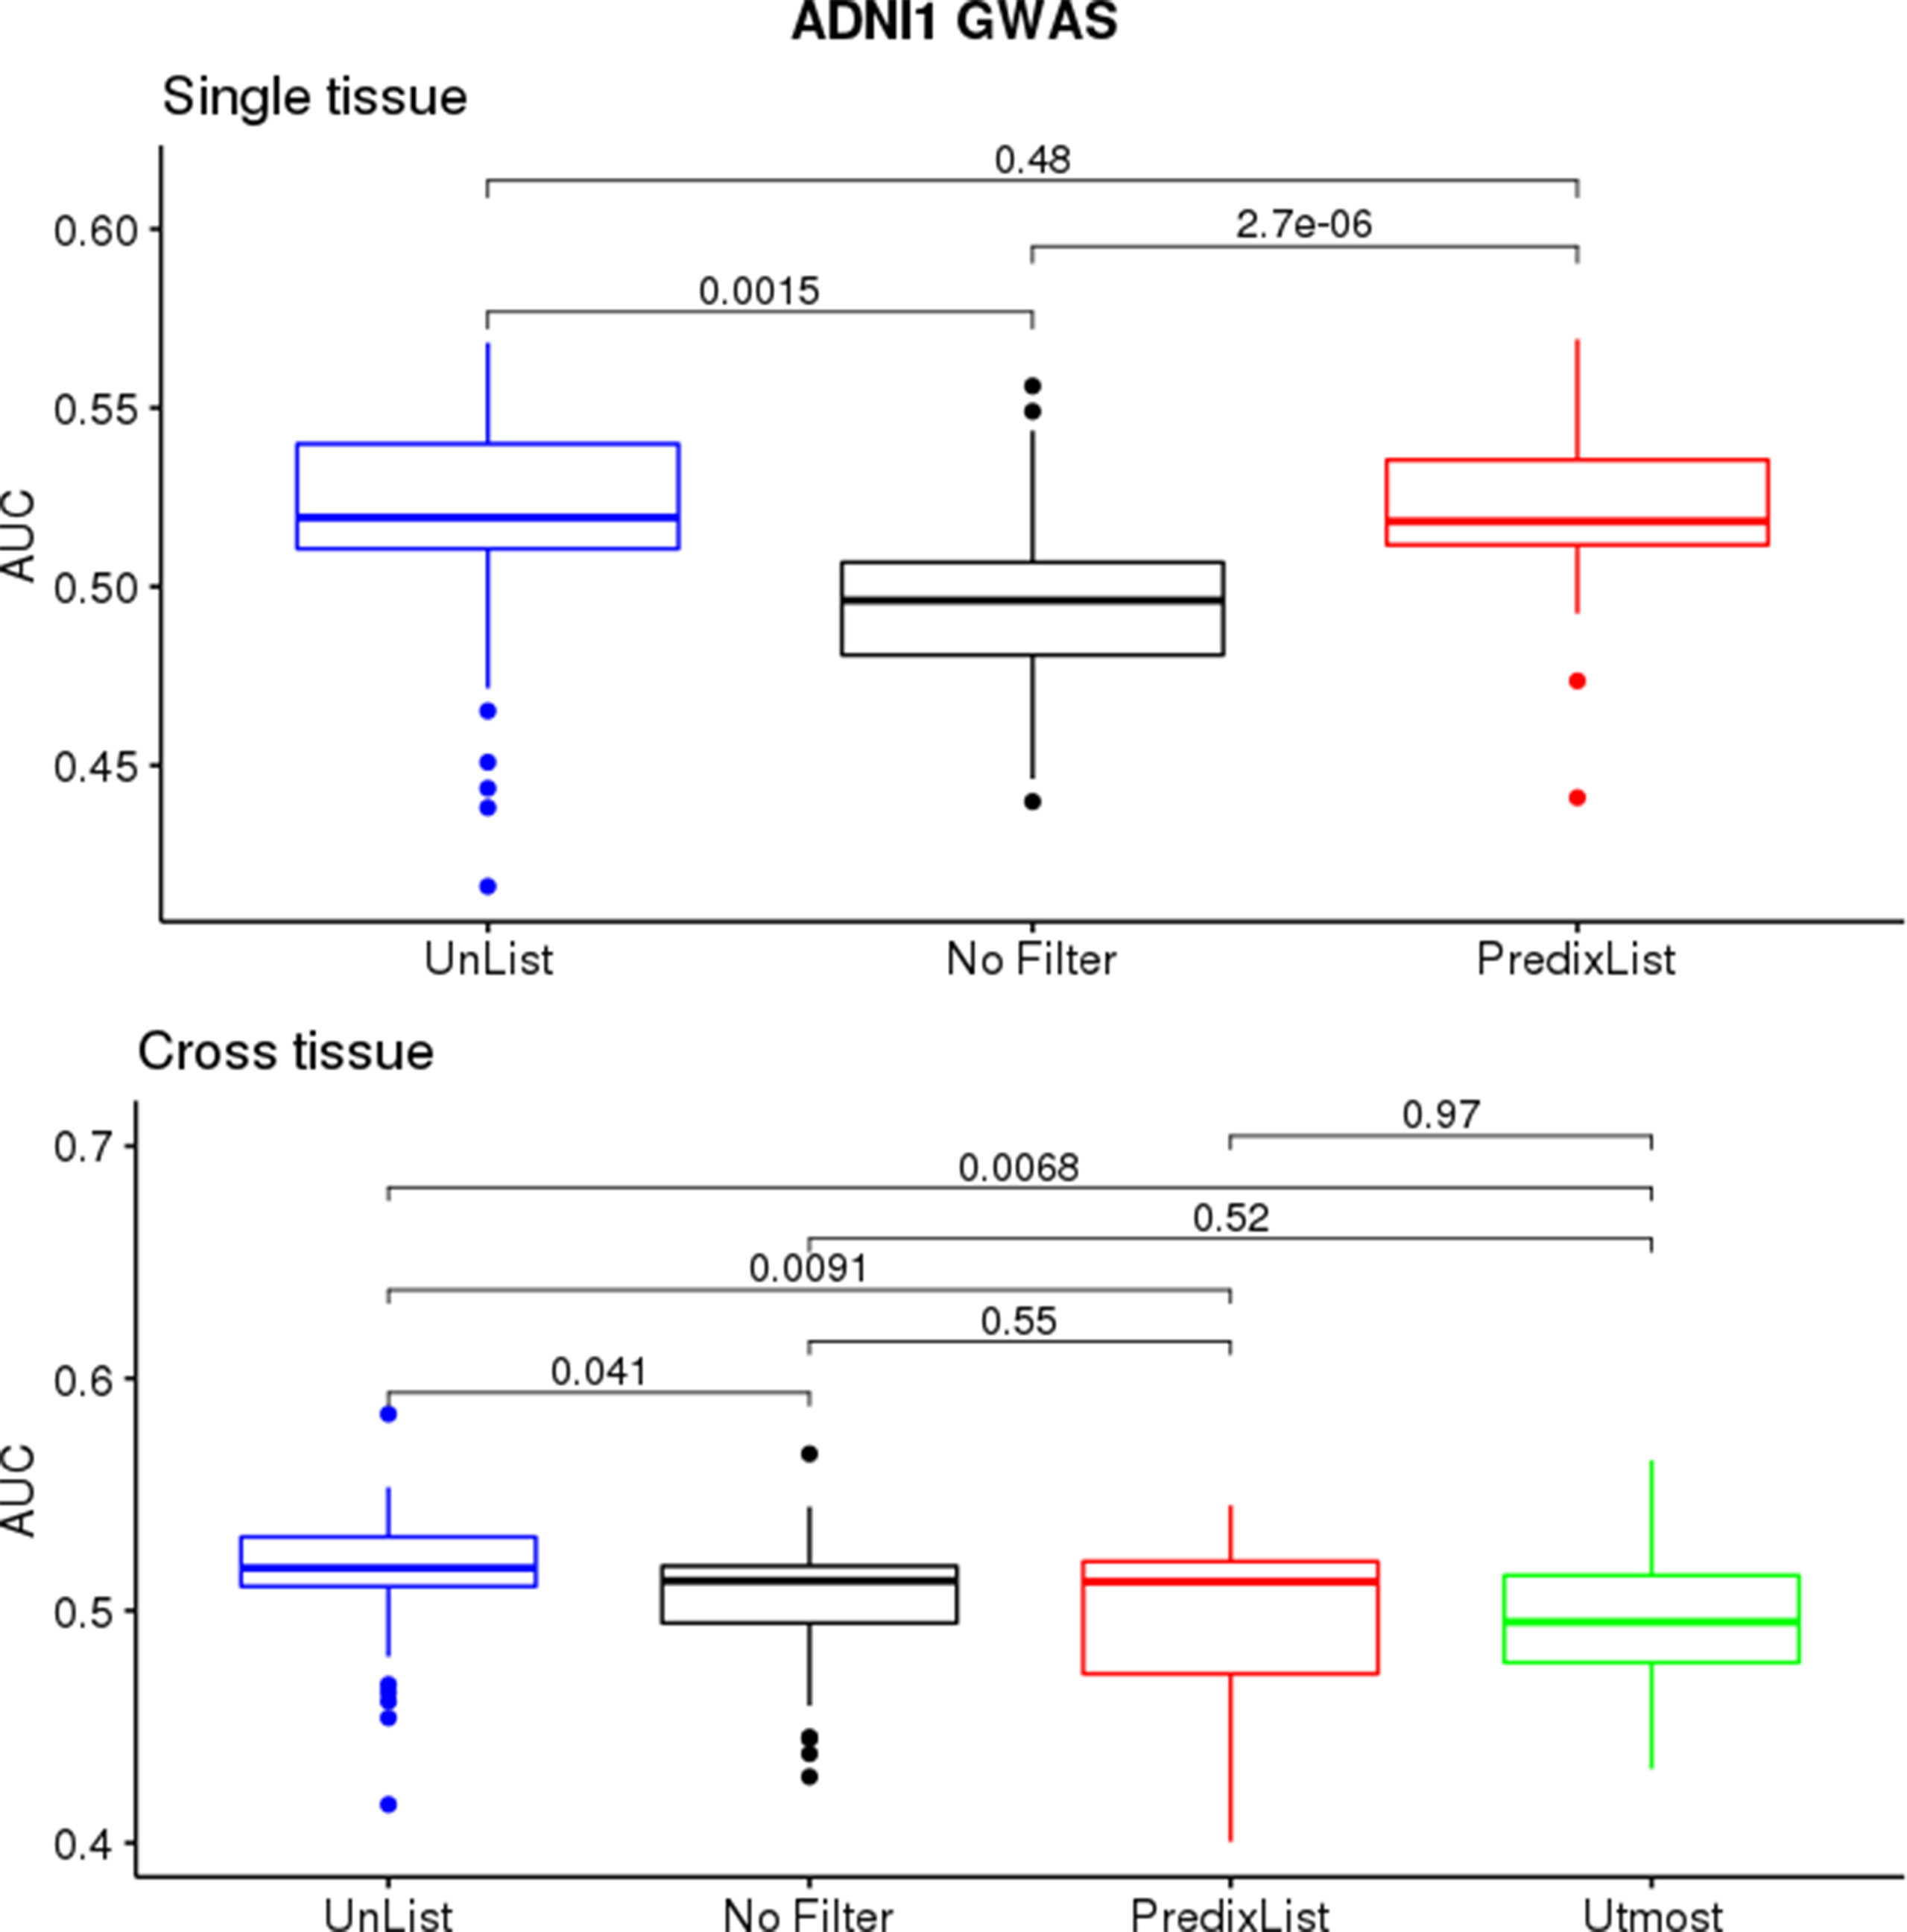
Figure 3 ADNI1-GWAS feature selection evaluation. The single-tissue models (top panel) significantly improved their ability to classify case/control condition thanks to both List-unsupervised (blue) and List-PrediXcan (red) compared to the no filtering approach (black). On cross-tissue models (bottom panel), where there is also the performance with the List-UTMOST (green), the improvement was less evident.
Cognitive Decline models performed better than ADNI1-GWAS, both in single-tissue and cross-tissue analysis (Figure 4). The lists application on Cognitive Decline models also led to an improvement for tissues with borderline or below the threshold performance (Figure S5), reaching AUCs between 0:51 and 0:6. On cross-tissue models we obtained a significant p-value = 0.008766 for List-unsupervised and p-value = 0.04346 for List-PrediXcan.
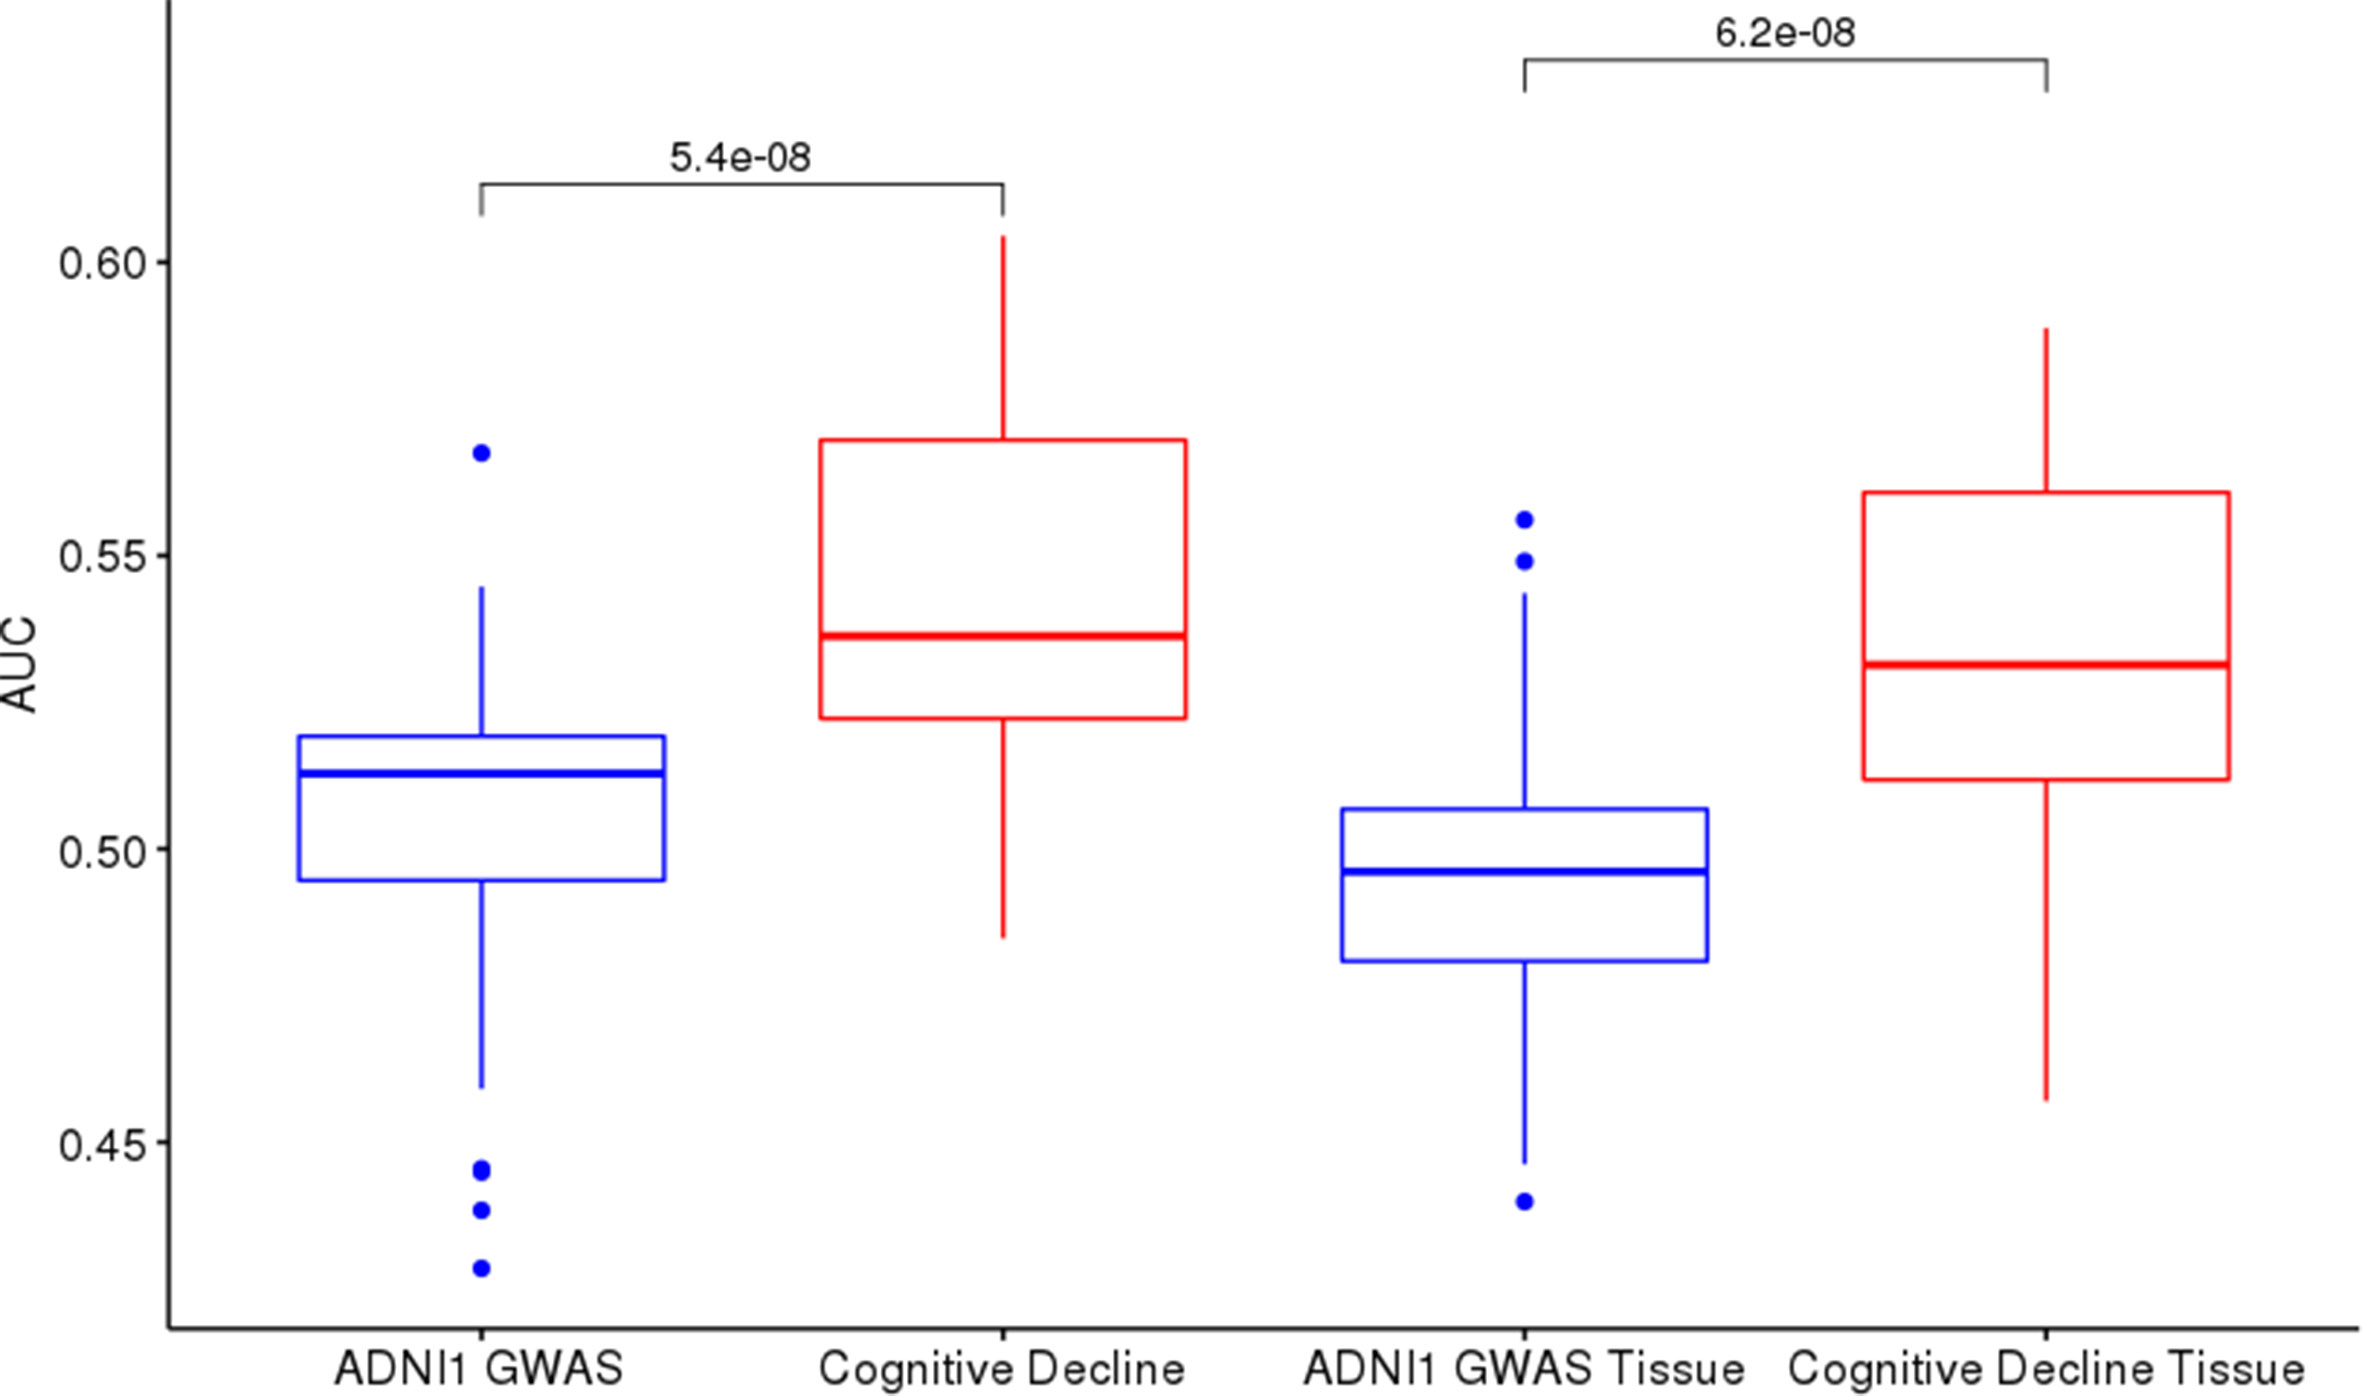
Figure 4 ADNI1-GWAS and Cognitive Decline comparison: Cognitive Decline (red boxes) returns higher AUCs on test sets than ADNI1-GWAS (blue boxes) both in cross-tissue models (left) and in single-tissue models (right).
Comparing the two lists on ADNI1-GWAS, List-unsupervised showed the bigger improvement on cross-tissue models: the t-test returned a p-value of 0:009123, but on single-tissue the difference was not significant. Also on Cognitive Decline we observed a slightly major impact of List-unsupervised both for the single-tissue and cross-tissue models. In Figure 5, a focus on the improvement achieved with the filter on the Brain tissue is shown in both datasets, in Figure S4 the evaluation for all tissues is shown.
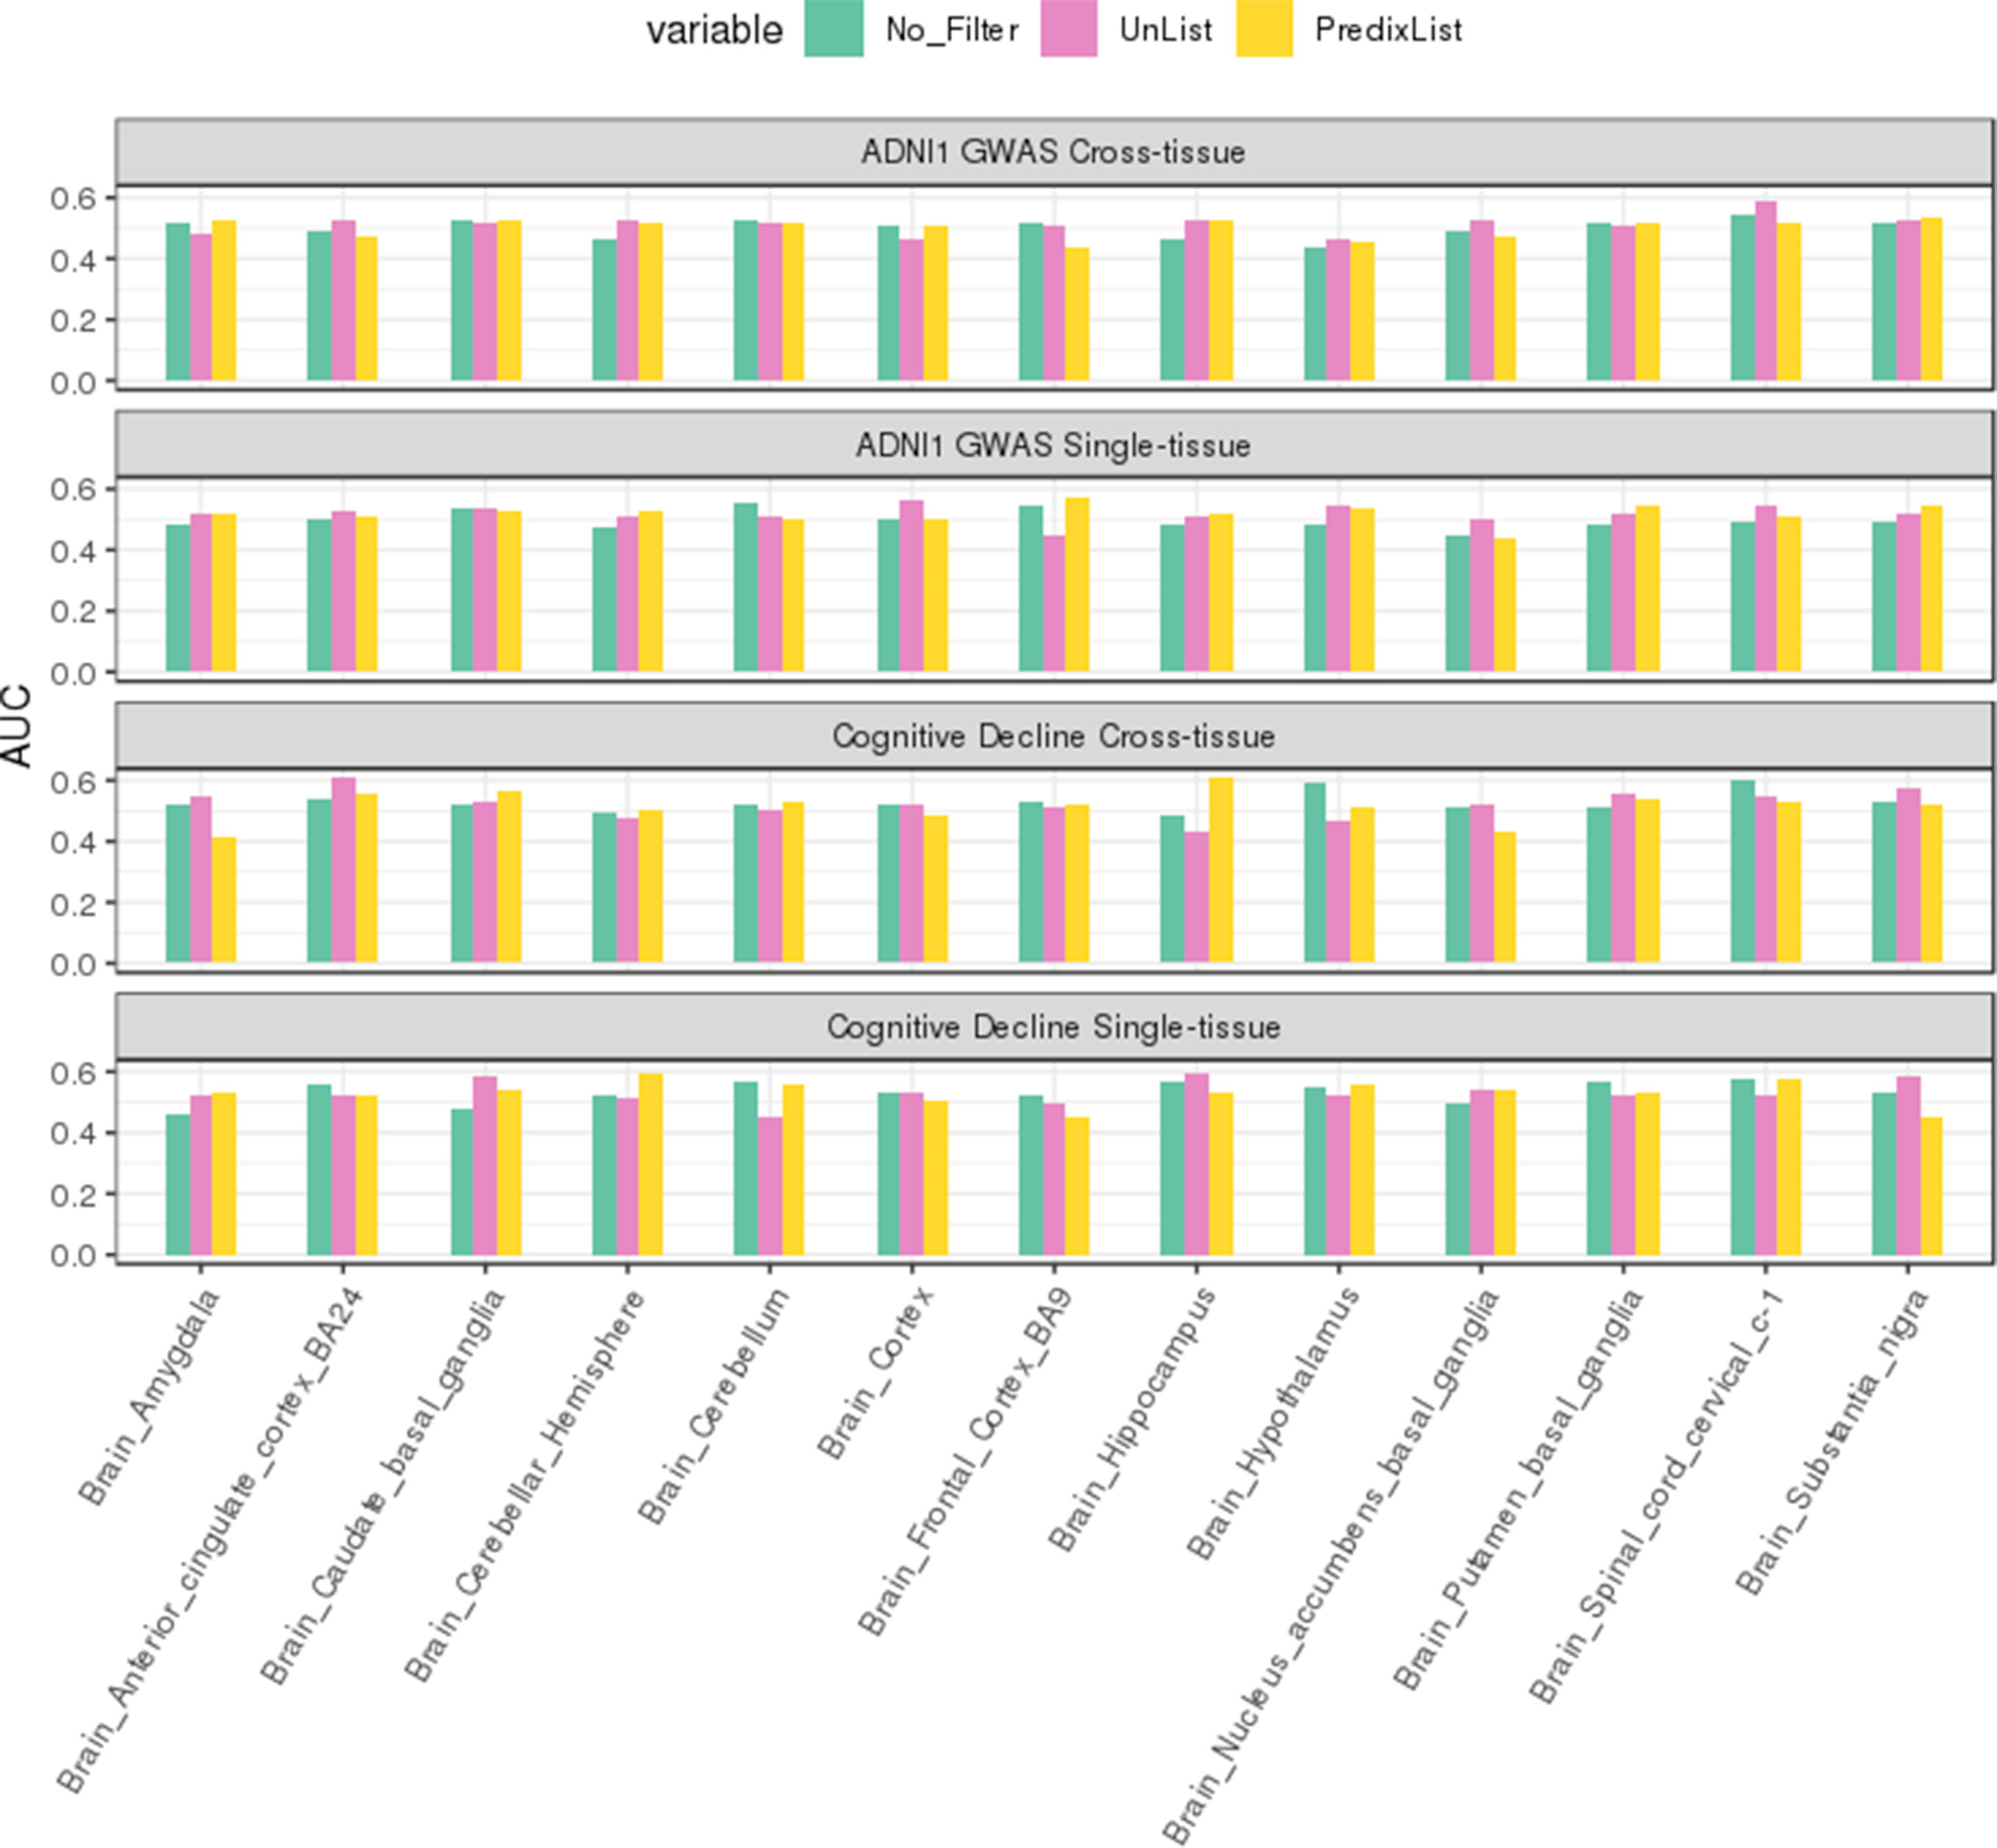
Figure 5 Brain tissues analysis. In green the AUCs on test sets for the no filter application are reported, in red for List-unsupervised and in yellow for List-PrediXcan. The top two panels report respectively the cross-tissue and single-tissue models performance on ADNI1-GWAS dataset, the third and fourth panels on Cognitive Decline. In both datasets, feature filtering improved the classification in almost all the Brain tissues.
Figure 6 reports, by columns, the AUC achieved by ADNI1-GWAS cross-tissue models when they were applied on other tissues from the same dataset. The top heatmap describes the relationships between tissue when no filter is applied: we could observe that models trained on Brain tissues, if they were able to correctly identify the AD subjects on a non-Brain tissue, they could do the same on all the other non-Brain tissues. Instead, models trained on non-Brain tissue could identify AD-MCI/CTRL subjects only on a subset of tissues. We performed the same analysis on ADNI1-GWAS models filtered by List-PrediXcan and List-unsupervised, respectively the middle and bottom heatmaps of Figure 6: List-unsupervised removed all the information of cross-tissue relationships, when instead List-PrediXcan mitigate them, pointing out the non-Brain models relationships.
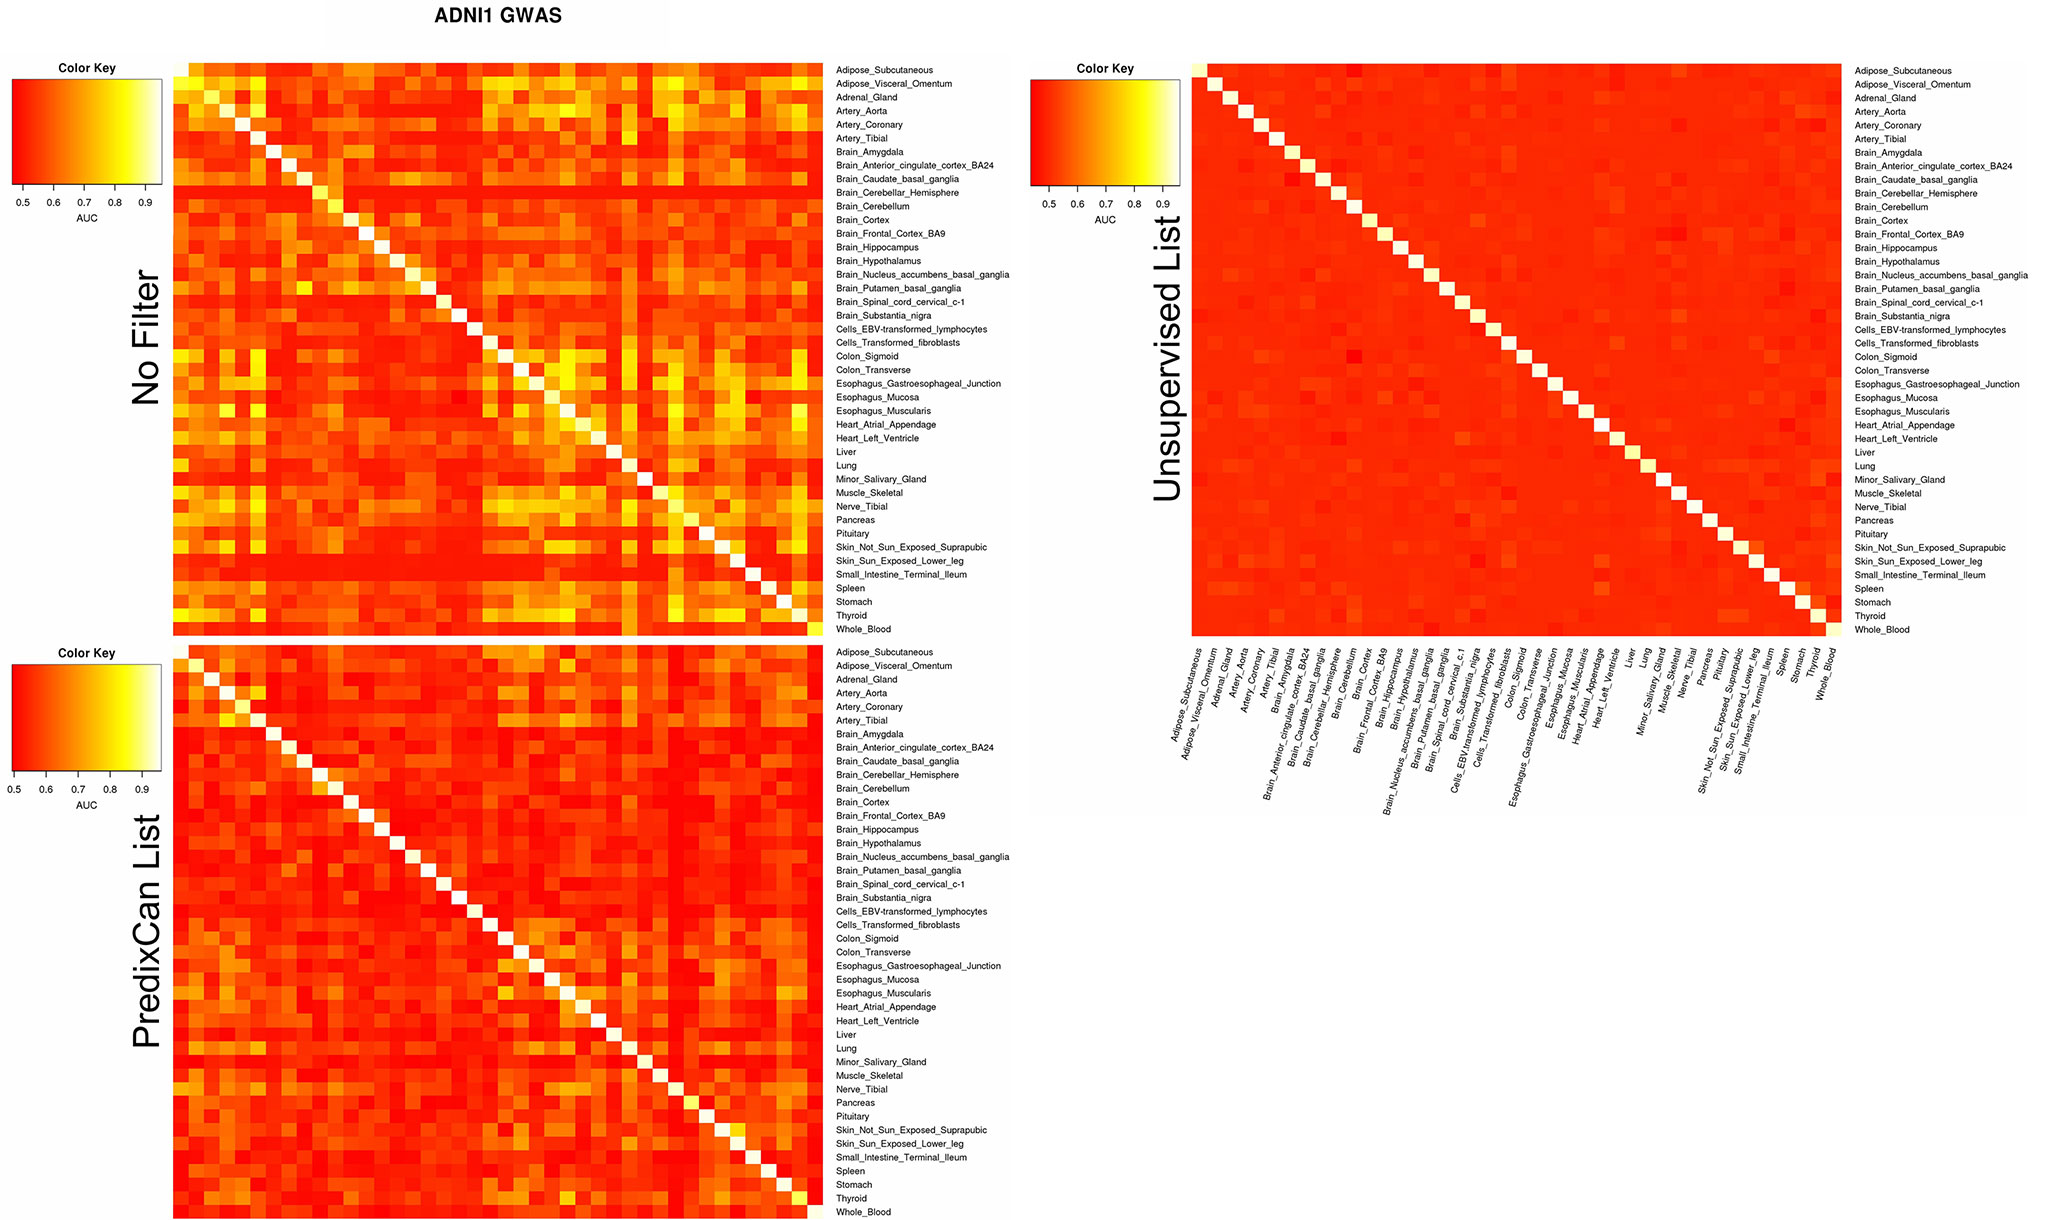
Figure 6 ADNI1-GWAS cross-tissues performance. By column we can observe how much a model trained on a tissue is able to recognize without mistakes (AUC) AD/non-AD subjects from data related to different tissues. On the diagonal for each tissue the AUC obtained for that model during the training is reported. The top panel reports the cross-tissue results without any filter application, the middle panel when using List-PrediXcan and the bottom using List-unsupervised.
We also tested the stratification for sex, age, APOE effect, and AD condition on ADNI1-GWAS dataset for single-tissue and cross-tissue analysis. It returned no considerable variation in the performance. The saliency map application was also not informative: each sample has the same importance. Lastly, we performed the filter analyses on Cognitive Decline, pointing out the same results (Figure S6).
Discussion
In the present work we dissected the tissue specific genetic component of gene expression in association to AD related cognitive decline. Our analysis consisted on the imputation of tissue specific gene expression profiles by using a TWAS-like approach (Mancuso et al., 2017). However, contrary to the standard TWAS analysis, we did not specifically focus on univariate analysis (e.g., gene association based on logistic or linear regression). Instead, we dissected individual transcriptomic levels using different machine learning approaches. We believe that our approach can be of particular interest since is capable of capturing data structure and non-linear behaviour in the system. In fact, it is well known that gene expression levels are not independent, since many genes are actually correlated in terms of regulation (Michalopoulos et al., 2012) and functionality, which means that also epistatic interactions can play a major role in the regulation of biochemical pathways (Sameith et al., 2015).
Interestingly, we observed that a combination of unsupervised and supervised machine learning methods on matrices of predicted expression provided complementary information that can be integrated in order to get new insights in gene expression regulation. On one hand, the VAE combined with enrichment analysis suggests the presence of a specific biochemical pathways alteration in dementia occurring in a specific brain area and in the gut. The identified alteration occur in brain nucleus, a brain region found to be associated with AD by several studies (Cho et al., 2014; Wang et al., 2014; Kuhn et al., 2015; Liu et al., 2015).
This alteration seems to be related to the regulation of gene expression and 436 therefore possibly associated to tissue-specific pathways regulation. Instead, the enriched pathways in gut are related to immune systems and noteworthy, it is well established that immune system dysfunctions can lead to a greater increase of inflammation in AD (Serpente et al., 2014; Heppner et al., 2015; Le Page et al., 2018). These results suggest that our analytical approach can identify relevant biological alterations occurring in AD. Noteworthy, enrichment analysis identified alteration in biological pathway specifically in a brain area and gut, which is in line with the presence of a gut-brain axis dysfunction in AD. Indeed, several researchers pointed out that brain-gut axis can be associated with many neurological disorders (Giau et al., 2018; La Rosa et al., 2018).
In the present work, APOE genotype has not been directly included as covariate in prediction models since our aim was to identify other genetic factors that can explain part of the missing heritability on the established polygenic component in AD (Escott-Price et al., 2017; Tosto et al., 2017). However, APOE is expected to be by far the most influencing risk factor for late onset AD. Though estimation of APOE contribution on the heritability component of AD is still not well defined, ranging from 10% to 28% of the overall genetic heritability (Van Cauwenberghe et al., 2016; Stocker et al., 2018). Moreover, in the present work, gene-expression derived genetic signals neglect not-eQTL effects and therefore we have limited analytical power. This justifies the relatively low AUC values in comparison to other prediction models in AD, including the complete genome-wide polygenic signal and using APOE as a covariate (Escott-Price et al., 2017; Tosto et al., 2017). Our aim was indeed to test whether or not there is a genetic signal associated with AD that could be apportioned to tissue specific gene-expression regulation rather than identify a prediction model. It is also known that genetics is just one of the component involved in AD susceptibility and therefore the use of multimodal data (e.g., imaging data, clinical features, metabolomic, and environmental factors) should be taken into account in order to build a reliable classifier in term of translational application (Sapkota et al., 2018). Despite that, our classification models were still capable of finding a signal between cases and controls (overall AUC > 0:5) suggesting that part of the genetic signal in AD related dementia can be associated with tissue-specific gene expression regulation. Moreover, we observed that feature selection can play a major role in the performance of deep learning networks classification.
We are aware that our work presents some limitations. We performed a genetic association with dementia by considering ADNI data evaluating the solely genetic component of gene expression, which neglects other potential genetics effect not related to gene-expression regulation. Our models are also limited by the current version of GTEx data, which has a relatively small size, therefore it is expected that over time new models will optimize eQTL estimation leading to more precise analyses of the genetic component of gene expression. We also focused on non-sex specific tissues, since we wanted to study general potential alterations not involving sex-specific organs, but this could also be a limitation given the different prevalence of AD in females and males (Mazure and Swendsen, 2016).
Conclusion
In the present work, we performed an analysis of the predicted genetic component of gene expression in ADNI1-GWAS dataset in association with AD cognitive decline. We dissected the predicted tissue specific gene expression by means of different supervised and unsupervised machine learning approaches. Our results suggest that a framework including unsupervised and supervised methods in data-analysis can provide complementary information and thus leading to better insights into the underlying system.
In particular, variational autoencoder pre-processing of input data proved to be efficient for features selection prior to the implementation of deep learning classification models. However, the limited AUC prediction performance of the developed models suggests that the evaluation of the solely genetic component of gene expression by exploiting up to date available GTEx models is currently under-powered in comparison to genome-wide polygenic risk score modeling.
This is not surprising since we are neglecting the effect of non-eQTL variants. On the other hand, we can disclose tissue specific effects and reveal potential biological mechanisms associated with a given phenotype. In this regard, our analysis showed that brain tissues are more associated with dementia status and that inflammatory processes in brain-gut axis can play a role in AD.
Author’s Note
Data used in preparing this article were obtained from the Alzheimer’s Disease Neuroimaging Initiative (ADNI) database (adni.loni.usc.edu). As such, many investigators within the ADNI contributed to the design and implementation of ADNI and/or provided data but did not participate in analysis or writing of this report. A complete listing of ADNI investigators can be found at: http://adni.loni.usc.edu/wp-content/uploads/how_to_apply/ADNI_Acknowledgement_List.pdf
Data Availability
Publicly available datasets were analyzed in this study. This data can be found here: http://adni.loni.usc.edu/. Supplementary data and the code used in this work is available at https://github.com/imerelli/DeepNeuro.
Author Contributions
CM, TA and VG equally contributed to the work. They conceived the idea and developed the algorithms. OB, GD, and SS contributed to data analysis. PL and IM supervised the whole study. All authors contributed to final revision of the manuscript.
Conflict of Interest Statement
The authors declare that the research was conducted in the absence of any commercial or financial relationships that could be construed as a potential conflict of interest.
Acknowledgments
We would like to thank John Hatton (CNR-ITB) for proofreading the manuscript. ADNI data collection and sharing was funded by the Alzheimer’s Disease Neuroimaging Initiative (National Institutes of Health Grant U01 AG024904) and DOD ADNI (Department of Defense award number W81XWH-12-2-0012). ADNI is funded by the National Institute on Aging, the National Institute of Biomedical Imaging and Bioengineering, and through generous contributions from the following: AbbVie, Alzheimer’s Association; Alzheimer’s Drug Discovery Foundation; Araclon Biotech; BioClinica, Inc.; Biogen; Bristol-Myers Squibb Company; CereSpir, Inc.; Cogstate; Eisai Inc.; Elan Pharmaceuticals, Inc.; Eli Lilly and Company; EuroImmun; F. Hoffmann-La Roche Ltd and its affiliated company Genentech, Inc.; Fujirebio; GE Healthcare; IXICO Ltd.; Janssen Alzheimer Immunotherapy Research & Development, LLC.; Johnson & Johnson Pharmaceutical Research & Development LLC.; Lumosity; Lundbeck; Merck & Co., Inc.; Meso Scale Diagnostics, LLC.; NeuroRx Research; Neurotrack Technologies; Novartis Pharmaceuticals Corporation; Pfizer Inc.; Piramal Imaging; Servier; Takeda Pharmaceutical Company; and Transition Therapeutics. The Canadian Institutes of Health Research is providing funds to support ADNI clinical sites in Canada. Private sector contributions are facilitated by the Foundation for the National Institutes of Health (http://www.fnih.org). The grantee organization is the Northern California Institute for Research and Education, and the study is coordinated by the Alzheimer’s Therapeutic Research Institute at the University of Southern California. ADNI data are disseminated by the Laboratory for Neuro Imaging at the University of Southern California. TA is funded by the W. D. Armstrong Trust Fund, University of Cambridge, UK. GD is supported by the EPSRC International Doctoral Scholarship. SS is supported 511 by the Engineering and Physical Sciences Research Council [EP/L015889/1].
Footnotes
- ^ https://www.ncbi.nlm.nih.gov/gap
- ^ https://www.ncbi.nlm.nih.gov/geo/
- ^ https://gtexportal.org/home/index.html
- ^ https://www.encodeproject.org/
- ^ http://www.well.ox.ac.uk/wrayner/tools
- ^ https://imputation.sanger.ac.uk/
- ^ https://gtexportal.org/home
- ^ https://keras.io/
- ^ https://scikit-learn.org/stable/
- ^ https://www.tensorflow.org/
- ^ http://predictdb.org/
- ^ https://github.com/hakyimlab/PrediXcan
- ^ http://geneontology.org/
- ^ https://www.genome.jp/kegg/pathway.html
- ^ https://reactome.org/
- ^ https://string-db.org/cgi/network.pl
- ^ http://twas-hub.org/
Supplementary Material
The Supplementary Material for this article can be found online at: https://www.frontiersin.org/articles/10.3389/fgene.2019.00726/full#supplementary-material
References
Aoki, G., Sakakibara, Y. (2018). Convolutional neural networks for classification of alignments of non-coding RNA sequences. Bioinformatics 34, i237–i244. doi: 10.1093/bioinformatics/bty228
Bali, J., Gheinani, A. H., Zurbriggen, S., Rajendran, L. (2012). Role of genes linked to sporadic Alzheimer’s disease risk in the production of β-amyloid peptides. Proc. Natl. Acad. Sci. 109, 15307–15311. doi: 10.1073/pnas.1201632109
Berger, B., Peng, J., Singh, M. (2013). Computational solutions for omics data. Nat. Rev. Genet. 14, 333. doi: 10.1038/nrg3433
Chatterjee, N., Shi, J., García-Closas, M. (2016). Developing and evaluating polygenic risk prediction models for stratified disease prevention. Nat. Rev. Genet. 17, 392. doi: 10.1038/nrg.2016.27
Cho, H., Kim, J.-H., Kim, C., Ye, B. S., Kim, H. J., Yoon, C. W., et al. (2014). Shape changes of the basal ganglia and thalamus in Alzheimer’s disease: a three-year longitudinal study. J. Alzheimers Dis. 40, 285–295. doi: 10.3233/JAD-132072
Coupé, P., Manjon, J. V., Lanuza, E., Catheline, G. (2019). Lifespan changes of the human brain in Alzheimer’s disease. Sci. Rep. 9, 3998. doi: 10.1038/s41598-019-39809-8
Croft, D., Mundo, A. F., Haw, R., Milacic, M., Weiser, J., Wu, G., et al. (2013). The reactome pathway knowledgebase. Nucleic Acids Res. 42, D472–D477. doi: 10.1093/nar/gkt1102
Dekker, J., Marti-Renom, M. A., Mirny, L. A. (2013). Exploring the three-dimensional organization of genomes: interpreting chromatin interaction data. Nat. Rev. Genet. 14, 390. doi: 10.1038/nrg3454
Dorszewska, J., Prendecki, M., Oczkowska, A., Dezor, M., Kozubski, W. (2016). Molecular basis of familial and sporadic Alzheimer’s disease. Alzheimers Dis. Res. 13, 952–963. doi: 10.2174/1567205013666160314150501
Durbin, R. (2014). Efficient haplotype matching and storage using the Positional Burrows–Wheeler Transform (PBWT). Bioinformatics 30, 1266–1272. doi: 10.1093/bioinformatics/btu014
Escott-Price, V., Shoai, M., Pither, R., Williams, J., Hardy, J. (2017). Polygenic score prediction captures nearly all common genetic risk for Alzheimer’s disease. Neurobiol. Aging 49, 214–2e7. doi: 10.1016/j.neurobiolaging.2016.07.018
Escott-Price, V., Sims, R., Bannister, C., Harold, D., Vronskaya, M., Majounie, E., et al. (2015). Common polygenic variation enhances risk prediction for Alzheimer’s disease. Brain 138, 3673–3684. doi: 10.1093/brain/awv268
Franco, E., Galloway, K. E. (2015). “Feedback loops in biological networks,” in Computational Methods in Synthetic Biology (Springer), 193–214. doi: 10.1007/978-1-4939-1878-2_10
Gamazon, E. R., Wheeler, H. E., Shah, K. P., Mozaffari, S. V., Aquino-Michaels, K., Carroll, R. J., et al. (2015). A gene-based association method for mapping traits using reference transcriptome data. Nat. Genet. 47, 1091. doi: 10.1038/ng.3367
Giau, V., Wu, S., Jamerlan, A., An, S., Kim, S., Hulme, J. (2018). Gut microbiota and their neuroinflammatory implications in Alzheimer’s disease. Nutrients 10, 1765. doi: 10.3390/nu10111765
Goodfellow, I. (2016). Nips 2016 tutorial: Generative adversarial networks. arXiv preprintarXiv:1701.00160.
Gottlieb, A., Daneshjou, R., DeGorter, M., Bourgeois, S., Svensson, P. J., Wadelius, M., et al. (2017). Cohort-specific imputation of gene expression improves prediction of warfarin dose for African Americans. Genome Med. 9, 98. doi: 10.1186/s13073-017-0495-0
Gusev, A., Ko, A., Shi, H., Bhatia, G., Chung, W., Penninx, B. W., et al. (2016). Integrative approaches for large-scale transcriptome-wide association studies. Nat. Genet. 48, 245. doi: 10.1038/ng.3506
Heppner, F. L., Ransohoff, R. M., Becher, B. (2015). Immune attack: the role of inflammation in Alzheimer disease. Nat. Rev. Neurosci. 16, 358. doi: 10.1038/nrn3880
Hill, S. T., Kuintzle, R., Teegarden, A., Merrill, E., III, Danaee, P., Hendrix, D. A. (2018). A deep recurrent neural network discovers complex biological rules to decipher RNA protein-coding potential. Nucleic Acids Res. 46, 8105–8113. doi: 10.1093/nar/gky567
Hohman, T. J., Dumitrescu, L., Cox, N. J., Jefferson, A. L., Alzheimer’s Disease Neuroimaging Initiative. (2017). Genetic resilience to amyloid related cognitive decline. Brain Imaging Behav. 11, 401–409. doi: 10.1007/s11682-016-9615-5
Hormozdiari, F., Van De Bunt, M., Segre, A. V., Li, X., Joo, J. W. J., Bilow, M., et al. (2016). Colocalization of GWAS and eQTL signals detects target genes. Am. J. Hum. Genet. 99, 1245–1260. doi: 10.1016/j.ajhg.2016.10.003
Hu, Y., Hase, T., Li, H. P., Prabhakar, S., Kitano, H., Ng, S. K., et al. (2016). A machine learning approach for the identification of key markers involved in brain development from single-cell transcriptomic data. BMC Genomics 17, 1025. doi: 10.1186/s12864-016-3317-7
Hu, Y., Li, M., Lu, Q., Weng, H., Wang, J., Zekavat, S. M., et al. (2019). A statistical framework for cross-tissue transcriptome-wide association analysis. Tech. rep., Nature Publishing Group. doi: 10.1038/s41588-019-0345-7
Itti, L., Koch, C., Niebur, E. (1998). A model of saliency-based visual attention for rapid scene analysis. IEEE Trans. Pattern Anal. Mach. Intell. 1254–1259. doi: 10.1109/34.730558
Kanehisa, M., Furumichi, M., Tanabe, M., Sato, Y., Morishima, K. (2016). Kegg: new perspectives on genomes, pathways, diseases and drugs. Nucleic Acids Res. 45, D353–D361. doi: 10.1093/nar/gkw1092
Kirsebom, B.-E., Espenes, R., Waterloo, K., Hessen, E., Johnsen, S. H., Bråthen, G., et al. (2017). Screening for alzheimer’s disease: cognitive impairment in self-referred and memory clinic-referred patients. J. Alzheimers Dis. 60, 1621–1631. doi: 10.3233/JAD-170385
Kuhn, J., Hardenacke, K., Lenartz, D., Gruendler, T., Ullsperger, M., Bartsch, C., et al. (2015). Deep brain stimulation of the nucleus basalis of Meynert in Alzheimer’s dementia. Mol. Psychiatry 20, 353. doi: 10.1038/mp.2014.32
Kuznetsov, I., Kuznetsov, A. (2018). How the formation of amyloid plaques and neurofibrillary tangles may be related: a mathematical modelling study. Philos. Trans. R. Soc. Lond. A 474, 20170777. doi: 10.1098/rspa.2017.0777
La Rosa, F., Clerici, M., Ratto, D., Occhinegro, A., Licito, A., Romeo, M., et al. (2018). The gut-brain axis in Alzheimer’s disease and omega-3. a critical overview of clinical trials. Nutrients 10, 1267. doi: 10.3390/nu10091267
Lambert, J.-C., Ibrahim-Verbaas, C. A., Harold, D., Naj, A. C., Sims, R., Bellenguez, C., et al. (2013). Meta-analysis of 74,046 individuals identifies 11 new susceptibility loci for Alzheimer’s disease. Nat. Genet. 45, 1452. doi: 10.1038/ng.2802
Le Page, A., Dupuis, G., Frost, E. H., Larbi, A., Pawelec, G., Witkowski, J. M., et al. (2018). Role of the peripheral innate immune system in the development of Alzheimer’s disease. Exp. Gerontol. 107, 59–66. doi: 10.1016/j.exger.2017.12.019
LeCun, Y., Bengio, Y., Hinton, G. (2015). Deep learning. Nature 521 (7553), 436. doi: 10.1038/nature14539
Li, Y., Huang, C., Ding, L., Li, Z., Pan, Y., Gao, X. (2019). Deep learning in bioinformatics: introduction, application, and perspective in big data era. arXiv preprint arXiv:1903.00342. doi: 10.1101/563601
Li, Y., Wu, F.-X., Ngom, A. (2016). A review on machine learning principles for 596 multi-view biological data integration. Brief Bioinform. 19, 325–340. doi: 10.1093/bib/bbw113
Li, Z., Chen, Z., Fan, G., Li, A., Yuan, J., Xu, T. (2018). Cell-type-specific afferent innervation of the nucleus accumbens core and shell. Front Neuroanat. 12. doi: 10.3389/fnana.2018.00084
Liu, A. K. L., Chang, R. C.-C., Pearce, R. K., Gentleman, S. M. (2015). Nucleus basalis of Meynert revisited: anatomy, history and differential involvement in Alzheimer’s and Parkinson’s disease. Acta Neuropathol. 129, 527–540. doi: 10.1007/s00401-015-1392-5
Liu, C.-C., Kanekiyo, T., Xu, H., Bu, G. (2013). Apolipoprotein E and Alzheimer disease: risk, mechanisms and therapy. Nat. Rev. Neurol. 9, 106. doi: 10.1038/nrneurol.2012.263
Loh, P.-R., Danecek, P., Palamara, P. F., Fuchsberger, C., Reshef, Y. A., Finucane, H. K., et al. (2016). Reference-based phasing using the haplotype reference consortium panel. Nat. Genet. 48, 1443. doi: 10.1038/ng.3679
Mancuso, N., Shi, H., Goddard, P., Kichaev, G., Gusev, A., Pasaniuc, B. (2017). Integrating gene expression with summary association statistics to identify genes associated with 30 complex traits. Am. J. Hum. Genet. 100, 473–487. doi: 10.1016/j.ajhg.2017.01.031
Marigorta, U. M., Denson, L. A., Hyams, J. S., Mondal, K., Prince, J., Walters, T. D., et al. (2017). Transcriptional risk scores link GWAS to eQTLs and predict complications in Crohn’s disease. Nat. Genet. 49, 1517. doi: 10.1038/ng.3936
Marioni, R. E., Harris, S. E., Zhang, Q., McRae, A. F., Hagenaars, S. P., Hill, W. D., et al. (2018). GWAS on family history of Alzheimer’s disease. Transl. Psychiatry. 8, 99. doi: 10.1038/s41398-018-0150-6
Mazure, C. M., Swendsen, J. (2016). Sex differences in Alzheimer’s disease and other dementias. Lancet Neurol. 15, 451–452. doi: 10.1016/S1474-4422(16)00067-3
McCarthy, S., Das, S., Kretzschmar, W., Delaneau, O., Wood, A. R., Teumer, A., et al. (2016). A reference panel of 64,976 haplotypes for genotype imputation. Nat. Genet. 48, 1279. doi: 10.1038/ng.3643
McCaulley, M. E., Grush, K. A. (2015). Alzheimer’s disease: exploring the role of inflammation and implications for treatment. Int. J. Alzheimers Dis. 2015, 515248. doi: 10.1155/2015/515248
McDermaid, A., Monier, B., Zhao, J., Liu, B., Ma, Q. (2018). Interpretation of differential gene expression results of RNA-seq data: review and integration. Brief Bioinform. doi: 10.1093/bib/bby067
McKinney, B. A., Reif, D. M., Ritchie, M. D., Moore, J. H. (2006). Machine learning for detecting gene-gene interactions. Appl. Bioinformatics 5, 77–88. doi: 10.2165/00822942-200605020-00002
Michalopoulos, I., Pavlopoulos, G. A., Malatras, A., Karelas, A., Kostadima, M.-A., Schneider, R., et al. (2012). Human gene correlation analysis (HGCA): a tool for the identification of transcriptionally co-expressed genes. BMC Res Notes 5, 265. doi: 10.1186/1756-0500-5-265
Min, S., Lee, B., Yoon, S. (2017). Deep learning in bioinformatics. Brief Bioinform. 18, 851–869. doi: 10.1093/bib/bbw068
Nie, X., Sun, Y., Wan, S., Zhao, H., Liu, R., Li, X., et al. (2017). Subregional structural alterations in hippocampus and nucleus accumbens correlate with the clinical impairment in patients with Alzheimer’s disease clinical spectrum: parallel combining volume and vertex-based approach. Front. Neurol. 8, 399. doi: 10.3389/fneur.2017.00399
Nobili, A., Latagliata, E. C., Viscomi, M. T., Cavallucci, V., Cutuli, D., Giacovazzo, G., et al. (2017). Dopamine neuronal loss contributes to memory and reward dysfunction in a model of Alzheimer’s disease. Nat. Commun 8, 14727. doi: 10.1038/ncomms14727
Olson, R. S., La Cava, W., Mustahsan, Z., Varik, A., Moore, J. H. (2017). Data-driven advice for applying machine learning to bioinformatics problems. arXiv preprint arXiv:1708.05070. doi: 10.1142/9789813235533_0018
Piaceri, I., Nacmias, B., Sorbi, S. (2013). Genetics of familial and sporadic Alzheimer’s disease. Front. Biosci. (Elite Ed) 5, 167–177. doi: 10.2741/E605
Roberts, R. O., Petersen, R. C. (2014). Predictors of early-onset cognitive impairment. Brain 137, 1280–1281. doi: 10.1093/brain/awu089
Sameith, K., Amini, S., Koerkamp, M. J. G., van Leenen, D., Brok, M., Brabers, N., et al. (2015). A high-resolution gene expression atlas of epistasis between gene-specific transcription factors exposes potential mechanisms for genetic interactions. BMC Biol. 13, 112. doi: 10.1186/s12915-015-0222-5
Sapkota, S., Huan, T., Tran, T., Zheng, J., Camicioli, R., Li, L., et al. (2018). Alzheimer’s biomarkers from multiple modalities selectively discriminate clinical status: relative importance of salivary metabolomics panels, genetic, lifestyle, cognitive, functional health, and demographic risk markers. Front. Aging Neurosci. 10, 296. doi: 10.3389/fnagi.2018.00296
Sergushichev, A. (2016). An algorithm for fast preranked gene set enrichment analysis using cumulative statistic calculation. BioRxiv 060012. doi: 10.1101/060012
Serpente, M., Bonsi, R., Scarpini, E., Galimberti, D. (2014). Innate immune system and inflammation in Alzheimer’s disease: from pathogenesis to treatment. Neuroimmunomodulation 21, 79–87. doi: 10.1159/000356529
Shao, Y., Shaw, M., Todd, K., Khrestian, M., D’Aleo, G., Barnard, P. J., et al. (2018). DNA methylation of TOMM40-APOE-APOC2 in Alzheimer’s disease. J. Hum. Genet. 63, 459. doi: 10.1038/s10038-017-0393-8
Shen, Z., Bao, W., Huang, D.-S. (2018). Recurrent neural network for predicting transcription factor binding sites. Sci. Rep. 8, 15270. doi: 10.1038/s41598-018-33321-1
Sochocka, M., Donskow-Łysoniewska, K., Diniz, B. S., Kurpas, D., Brzozowska, E., Leszek, J. (2019). The gut microbiome alterations and inflammation-driven pathogenesis of Alzheimer’s disease—a critical review. Mol. Neurobiol. 56, 1841–1851. doi: 10.1007/s12035-018-1188-4
Stocker, H., Möllers, T., Perna, L., Brenner, H. (2018). The genetic risk of Alzheimer’s disease beyond APOE ε4: systematic review of Alzheimer’s genetic risk scores. Transl. Psychiatry 8, 166. doi: 10.1038/s41398-018-0221-8
Subramanian, A., Tamayo, P., Mootha, V. K., Mukherjee, S., Ebert, B. L., Gillette, M. A., et al. (2005). Gene set enrichment analysis: a knowledge-based approach for interpreting genome-wide expression profiles. Proc. Natl. Acad. Sci. 102, 15545–15550. doi: 10.1073/pnas.0506580102
Tang, B., Pan, Z., Yin, K., Khateeb, A. (2019). Recent advances of deep learning in bioinformatics and computational biology. Front. Genet. 10. doi: 10.3389/fgene.2019.00214
Tosto, G., Bird, T. D., Tsuang, D., Bennett, D. A., Boeve, B. F., Cruchaga, C., et al. (2017). Polygenic risk scores in familial Alzheimer disease. Neurology 88, 1180–1186. doi: 10.1212/WNL.0000000000003734
Van Cauwenberghe, C., Van Broeckhoven, C., Sleegers, K. (2016). The genetic landscape of Alzheimer disease: clinical implications and perspectives. Med. Genet. 18, 421. doi: 10.1038/gim.2015.117
Visscher, P. M., Wray, N. R., Zhang, Q., Sklar, P., McCarthy, M. I., Brown, M. A., et al. (2017). 10 years of GWAS discovery: biology, function, and translation. Am. J. Hum. Genet. 101, 5–22. doi: 10.1016/j.ajhg.2017.06.005
Wang, D., Li, Y.-Y., Luo, J.-H., Li, Y.-H. (2014). Age-related iron deposition in the basal ganglia of controls and Alzheimer disease patients quantified using susceptibility weighted imaging. Arch. Gerontol. Geriatr. 59, 439–449. doi: 10.1016/j.archger.2014.04.002
Wang, J., Gu, B. J., Masters, C. L., Wang, Y.-J. (2017). A systemic view of Alzheimer disease—insights from amyloid-β metabolism beyond the brain. Nat. Rev. Neurol. 13, 612. doi: 10.1038/nrneurol.2017.111
Wang, L., Xi, Y., Sung, S., Qiao, H. (2018). RNA-seq assistant: machine learning based methods to identify more transcriptional regulated genes. BMC genomics 19, 546 683. doi: 10.1186/s12864-018-4932-2
Wattenberg, M., Viégas, F., Johnson, I. (2016). How to use t-sne effectively. Distill. doi: 10.23915/distill.00002
Way, G. P., Greene, C. S. (2017a). Extracting a biologically relevant latent 685 space from cancer transcriptomes with variational autoencoders. BioRxiv, 174474. doi: 10.1101/174474
Way, G. P., Greene, C. S. (2017b). “Extracting a biologically relevant latent space from cancer transcriptomes with variational autoencoders,” in Biocomputing 2018 (World Scientific). doi: 10.1142/9789813235533_0008
Weiner, M. W., Veitch, D. P., Aisen, P. S., Beckett, L. A., Cairns, N. J., Green, R. C., et al. (2013). The Alzheimer’s disease neuroimaging initiative: a review of papers published since its inception. Alzheimers Dement. 9, e111–e194. doi: 10.1016/j.jalz.2013.05.1769
Wen, X., Pique-Regi, R., Luca, F. (2017). Integrating molecular QTL data into genome-wide genetic association analysis: probabilistic assessment of enrichment and colocalization. PLoS Genet. 13, e1006646. doi: 10.1371/journal.pgen.1006646
Wetzel, S. J. (2017). Unsupervised learning of phase transitions: From principal component analysis to variational autoencoders. Phys. Rev. E 96, 022140. doi: 10.1103/PhysRevE.96.022140
Keywords: eQTL, gene expression imputation, GTEx, variational autoencoder, support vector machine, deep learning, recurrent neural networks, Alzheimer’s
Citation: Maj C, Azevedo T, Giansanti V, Borisov O, Dimitri GM, Spasov S, Alzheimer’s Disease Neuroimaging Initiative , Lió P and Merelli I (2019) Integration of Machine Learning Methods to Dissect Genetically Imputed Transcriptomic Profiles in Alzheimer’s Disease. Front. Genet. 10:726. doi: 10.3389/fgene.2019.00726
Received: 18 April 2019; Accepted: 10 July 2019;
Published: 03 September 2019.
Edited by:
Dominik Heider, University of Marburg, GermanyReviewed by:
Shefali S. Verma, University of Pennsylvania, United StatesHuiluo Cao, The University of Hong Kong, Hong Kong
Yu Li, King Abdullah University of Science and Technology, Saudi Arabia, in collaboration with reviewer HC
Copyright © 2019 Maj, Azevedo, Giansanti, Borisov, Dimitri, Spasov, Alzheimer’s Disease Neuroimaging Initiative, Lió and Merelli. This is an open-access article distributed under the terms of the Creative Commons Attribution License (CC BY). The use, distribution or reproduction in other forums is permitted, provided the original author(s) and the copyright owner(s) are credited and that the original publication in this journal is cited, in accordance with accepted academic practice. No use, distribution or reproduction is permitted which does not comply with these terms.
*Correspondence: Carlo Maj, Y21hakB1bmktYm9ubi5kZQ==; Pietro Lió, cGwyMTlAY2FtLmFjLnVr; Ivan Merelli, aXZhbi5tZXJlbGxpQGl0Yi5jbnIuaXQ=
†These authors have contributed equally to this work