 Sadia Akter1
 Dong Xu1,2,3
 Susan C. Nagel4
 John J. Bromfield4†
 Katherine Pelch4†
 Gilbert B. Wilshire5
 Trupti Joshi1,3,6*
- 1Informatics Institute, University of Missouri, Columbia, MO, United States
- 2Electrical Engineering and Computer Science, University of Missouri, Columbia, MO, United States
- 3Christopher S. Bond Life Sciences Center, University of Missouri, Columbia, MO, United States
- 4OB/GYN and Women’s Health, University of Missouri School of Medicine, Columbia, MO, United States
- 5Boone Hospital Center, Columbia, MO, United States
- 6Health Management and Informatics, University of Missouri, Columbia, MO, United States
Endometriosis is a complex and common gynecological disorder yet a poorly understood disease affecting about 176 million women worldwide and causing significant impact on their quality of life and economic burden. Neither a definitive clinical symptom nor a minimally invasive diagnostic method is available, thus leading to an average of 4 to 11 years of diagnostic latency. Discovery of relevant biological patterns from microarray expression or next generation sequencing (NGS) data has been advanced over the last several decades by applying various machine learning tools. We performed machine learning analysis using 38 RNA-seq and 80 enrichment-based DNA methylation (MBD-seq) datasets. We experimented how well various supervised machine learning methods such as decision tree, partial least squares discriminant analysis (PLSDA), support vector machine, and random forest perform in classifying endometriosis from the control samples trained on both transcriptomics and methylomics data. The assessment was done from two different perspectives for improving classification performances: a) implication of three different normalization techniques and b) implication of differential analysis using the generalized linear model (GLM). Several candidate biomarker genes were identified by multiple machine learning experiments including NOTCH3, SNAPC2, B4GALNT1, SMAP2, DDB2, GTF3C5, and PTOV1 from the transcriptomics data analysis and TRPM6, RASSF2, TNIP2, RP3-522J7.6, FGD3, and MFSD14B from the methylomics data analysis. We concluded that an appropriate machine learning diagnostic pipeline for endometriosis should use TMM normalization for transcriptomics data, and quantile or voom normalization for methylomics data, GLM for feature space reduction and classification performance maximization.
Introduction
Endometriosis is a complex and common gynecological disorder, and the etiology is poorly understood (Halme et al., 1984). The impact of endometriosis is very high. About 176 million women worldwide and about 8.5 million women in North America suffer from endometriosis (David Adamson et al., 2010). Five to ten percent of women who are of reproductive age, 20–30% of women with subfertility, and 40–60% of women with chronic pelvic pain and infertility are suffering from endometriosis (Selçuk and Bozdağ, 2013). Nearly 70% of teens with pelvic pain are later diagnosed with endometriosis (Yeung et al., 2011). Endometriosis is a leading cause of the 600,000 hysterectomies performed in the US every year (Burkett et al., 2011) and significantly impairs mental and physical quality of life in patients. Moreover, work performance for women with endometriosis is seriously compromised. Endometriosis causes a large economic burden due to loss of workdays and the health-care costs due to outpatient visits, hospitalization, and medications, which in the US have been estimated to be $22 billion each year (Simoens et al., 2007).
A gold standard for endometriosis diagnostic approach is laparoscopy, which is an invasive procedure. Due to the lack of definitive clinical diagnostic symptoms and an easy-to-perform molecular diagnostic approach, current diagnostic latency is on average 4 to 11 years (Agarwal et al., 2019). Therefore, early intervention is crucial for reducing suffering and expenses related to the disease. A minimally invasive diagnostic approach, such as endometrial biopsy, would be very useful for reducing diagnostic latency. Endometriosis patients have an altered methylome (DNA methylation) and transcriptome (RNA-seq), and these differences in DNA methylation and gene expression could lead to the identification of biomarkers for developing a minimally invasive diagnostic technique for endometriosis (Eyster et al., 2007; Wu et al., 2007; Xue et al., 2007a; Xue et al., 2007b; Lee et al., 2009). In a DNA microarray study comparing eutopic endometrium and ectopic endometrium suggested that alterations of cell adhesion-associated genes may contribute to the adhesive and invasive properties of ectopic endometrium (Eyster et al., 2007). In a mouse model of endometriosis with bisulphite-based DNA methylation suggested that significant changes occur in multiple markers of endometrial receptivity in the eutopic endometrium after induction of endometriosis (Lee et al., 2009). A cross-sectional measurement of gene expression levels of DNMT1, DNMT3A, and DNMT3B on endometriotic tissue demonstrated that those genes were overexpressed in the ectopic endometrium as compared with normal control subjects or the eutopic endometrium of women with endometriosis (Wu et al., 2007). Also, differential methylation of a CpG island at the ESR2 promoter region (Xue et al., 2007a) and SF-1 promoter and exon I regions (Xue et al., 2007b) may be key mechanisms related to endometriosis.
Discovery of relevant biological patterns from microarray expression data or next generation sequencing data have been advanced over the last several decades by applying various machine learning tools (Tarca et al., 2007; Liu et al., 2013; Neelima and Prasad Babu, 2017). Both unsupervised and supervised machine learning methods have been applied widely on microarray expression data (Vandesompele et al., 2002; Libbrecht and Noble, 2015). In the unsupervised machine learning application, some studies evaluated the clustering techniques such as hierarchical clustering and K-means clustering for identifying the groups of genes that share similar functions or expressions (Mudge et al., 2013; GTEx Consortium, 2015; Melé et al., 2015). For the application of supervised machine learning methods, some studies evaluated the application of disease vs. healthy classification tasks using various methods such as decision trees, random forests, artificial neural networks (ANN), support vector machines (SVM), and Bayesian networks (Pirooznia et al., 2008). Availability of both transcriptomics and methylomics data have greatly increased in recent years, which created the opportunity for using those data in clinical diagnostics (Mikeska et al., 2012; Byron et al., 2016). Unlike microarray gene expression data, application of machine learning classifiers on transcriptomics or methylomics data have been limited with various success (Bhasin et al., 2005; Wei et al., 2006; Bock, 2012; Cai et al., 2015; Thompson et al., 2016; Johnson et al., 2018). The difference of gene expressions in transcriptomics data or the difference of DNA methylation in methylomics data can provide avenues for the development of endometriosis diagnostic method (Eyster et al., 2007; Wu et al., 2007; Xue et al., 2007a; Xue et al., 2007b; Lee et al., 2009). In this work, we assess various supervised machine learning methods trained on both transcriptomics and methylomics data for classifying endometriosis samples from the control for creating highly accurate diagnostic predictive models.
An earlier work evaluated the performance of classification models using transcriptomics data (Akter et al., 2018). This work aims to systematically examine how well various state-of-the art supervised machine learning methods perform in classifying endometriosis and control samples using both transcriptomics and methylomics data. The assessment was done from three different perspectives: a) implication of three different normalization techniques on prediction performances, b) implication of differential analysis on prediction performances. In addition, network and functional enrichment analysis was conducted using the genes identified from different machine learning models.
Materials and Methods
Subjects and Tissue Collection
Subjects for the study were aged between 18 and 49 years and all undergoing a laparoscopy procedure—either diagnostic laparoscopy for pain or infertility or seeking laparoscopic sterilization. Prior to surgery, the physician obtained informed consent following the IRB protocol. Endometrial biopsies, which yield ≥250 mg of tissue, were collected using suction pipelles (Cooper Surgical Uterine Explora Model I) under general anesthesia prior to surgery. Endometrial biopsy is a quick, minimally invasive procedure, lasting ≤5 min, with minimal risk of infection, uterine perforation, or bleeding. During laparoscopy, the physician thoroughly examined the peritoneal cavity and visually confirmed the presence or absence of endometriosis. If present, at least one endometriotic lesion was sent to pathology for histological confirmation of endometriosis. Endometriosis patients had visually and histologically confirmed endometriosis.
Table 1 presents the inclusion and exclusion criteria for the two populations. Samples were collected from three different institutes: 1) Women’s and Children’s Hospital, University of Missouri; 2) Boone Hospital, Columbia, MO; and 3) University of California, San Francisco. The tissue samples were processed for generating high-throughput mRNA (RNA-Seq) data and enrichment-based DNA methylation (MBD-seq) data using the Illumina Next Seq NGS technology. Our transcriptomics dataset includes 38 single-end RNA-seq samples (22 controls and 16 endometriosis). The methylomics dataset includes 80 enrichment-based DNA methylation samples (36 controls and 44 endometriosis) where 77 (35 controls and 42 endometriosis) met the quality control criteria.
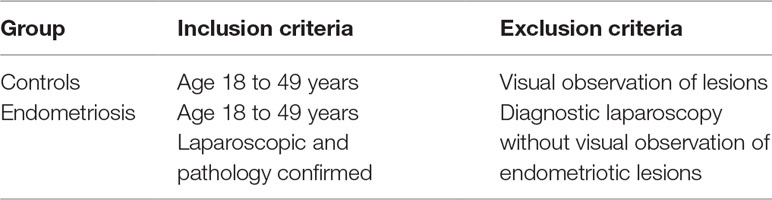
Table 1 Inclusion and exclusion criteria.
Transcriptomics and Methylomics Data Preprocessing Workflow
We preprocessed our data using several widely accepted bioinformatics tools. The transcriptomics dataset was processed in five steps, and the methylomics dataset was processed in seven steps. Steps 1 to 3 were same for both datasets. In the first step, all raw data were checked for quality control using FastQC (Andrews). In the second step, Cutadapt (Martin, 2011) was used to remove reads with low-quality bases, adapter sequences, and other contaminating sequences. In step three, Bowtie2 (Langmead et al., 2009) was applied to align sequence reads to the reference genome hg38. In the fourth step for RNA-seq, TopHat (Trapnell et al., 2009) was used to discover the locations of short sequence reads with respect to the reference. In step five for RNA-seq, HTSeq (Anders et al., 2015) was applied to generate the read count data, which was then filtered to remove very low count genes. The filtering criterion was to keep the genes that have at least 1 count per million (cpm) reads mapped in at least n samples where n is the smallest group size. In the fourth step for DNA methylation, each sample’s read was aligned against the reference genome hg38 using Bowtie2 (Langmead et al., 2009). In the fifth step for DNA methylation, we used Samtools (Li et al., 2009) and Picard (Picar) for sorting and removing duplicate reads. In the sixth step for DNA methylation, we segmented the genome sequence into 1,000 bases tiling windows, which is widely used. The seventh step for DNA methylation is to record the number of reads that are mapped to each methylated region. Read counts are the number of aligned reads that uniquely map to the hg38 reference genome. Several R packages (MEDIPS, BSgenome, BSgenome.Hsapiens.UCSC.hg38) were applied to generate the read count data, which was then filtered to remove very low count methylated regions. The filtering criterion was to keep the regions that have nonzero counts per million (cpm) reads mapped in at least n samples where n is the smallest group size. A study on comparing normalization techniques in RNA-seq analysis demonstrated that normalization methods have impacts on the results (Lin et al., 2016). In this study, the read count data were normalized using three different techniques: a) logarithm of counts per million (logCPM) of trimmed mean of M values (TMM) (Smyth, 2004), b) quantile normalization (qNorm) (Bolstad et al., 2003), and c) Voom normalization (vNorm) (Smyth, 2004).
In the methylomics data analysis, our goal is to identify the methylated regions of interest (MROI) and find the nearby genes. Mapping of an MROI to the reference annotation information helped us to extract the nearest genes from that MROI. Our goal is to identify the genomic features such as the protein-coding genes, long intergenic noncoding RNA (lincRNA) genes, microRNA (miRNA) genes, ribosomal ribonucleic acid (rRNA) genes, small nucleolar RNA (snoRNA) genes, and small nuclear RNA (snRNA) genes. The distance threshold for the MROI position to the genomic region was set to 10,000 bp.
Differential Analysis
To identify the differentially expressed genes (DEGs) in the transcriptomics dataset or the differentially methylated regions (DMRs) in the methylomics dataset between the control and endometriosis cases, a generalized linear model (GLM) was applied followed by likelihood ratio test using the edgeR (Robinson et al., 2010) package. The trimmed mean of M values (TMM) normalization was performed to normalize read counts among different samples. The significance of the genes was defined by using an adjusted p-value cutoff set at 5% using the false discovery rate (FDR) method for multiple testing (Benjamini and Hochberg, 1995).
Network and Functional Enrichment Analysis
We used the GeneMANIA (Montojo et al., 2014) application in Cytoscape (Shannon et al., 2003) for the network analysis and functional enrichment analysis. For a given gene list, GeneMANIA can build a weighted functional interaction network using a database of almost 2,300 networks. The networks are organized into different groups such as co-expression, physical interaction, genetic interaction, shared protein domains, co-localization, pathway, etc. To generate a network, Pearson correlation is used as the degree of interaction strength between each pair of genes. Utilizing the publicly available datasets, the GeneMANIA algorithm can predict genes or gene products that are highly related to the original gene list. Hypergeometric test was applied for the functional enrichment analysis with q-values cutoff of 0.10 using the Benjamini–Hochberg procedure.
Machine Learning Classifiers
Decision Tree
Decision tree is a tree-based algorithm that can be described as IF–THEN rules (Quinlan, 1993). There are many varieties of the decision tree algorithm based on the attribute selection criteria such as Iterative Dichotomiser 3 (ID3) (Quinlan, 1986), Classification and Regression Trees (CART) (Breiman et al., 1984), and C4.5 (Quinlan, 1993). Decision tree is constructed in two phases. First, a large tree is grown to fit the data closely. Second, the tree is pruned by removing parts that are predicted to have a relatively high error rate. C4.5 is a popular algorithm for decision tree construction that uses entropy minimization or information gain for attribute selection criteria. We used an improved version of C4.5 called C5.0/see5 (Data Mining Tools See5 and C5.0) for constructing the decision tree in this study. Confidence factor is used as a parameter for tree pruning in C5.0. The default value for confidence factor is 25% or 0.25. If the value of confidence factor is smaller than 0.25, it causes more pruning and vice versa.
Biosigner
Biosigner is an enhanced algorithm for detecting biomarkers (Rinaudo et al., 2016). The Biosigner algorithm includes four steps: 1) bootstrap resampling (default is boot = 50), 2) feature ranking, 3) selection of significant features called signature set, and 4) building the final model that is restricted to the features from the signature set. In Biosigner, three different machine learning classifier algorithms [partial least squares discriminant analysis (PLSDA) (Wold et al., 2001; Barker and Rayens, 2003), random forest (RF) (Breiman, 2001), and support vector machine (SVM) (Boser et al., 1992)] were used for constructing three different models. As the input to the Biosigner algorithm, we used the TMM normalized data as expression data.
Machine Learning Experimental Approach
We performed six different experiments using the decision tree classifier (see Table 2). Performance measures of each model were computed using the cross-validation approach described previously. We used the default value of confidence factor (0.25) so that the decision tree is optimally pruned. GLM was applied on the whole dataset for the decision tree experiments.
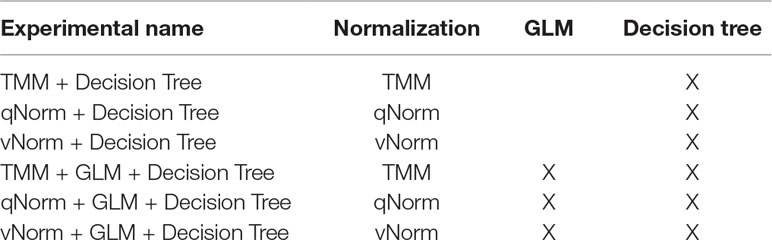
Table 2 Machine learning experimental approach using decision tree.
For testing with the Biosigner algorithm, we used TMM as the expression data. The TMM data were then used for constructing the classifier models (PLSDA, random forest, and SVM) using Biosigner. We used the default value for the boot parameter, which is 50. In some iterations of the leave-one-out cross-validation, Biosigner was unable to produce a prediction result for the test record using the predict function that uses the signature model, if the signature model was not produced in those iterations. In such a scenario, the model with tier A was used for prediction.
The dataset were filtered for low read count genes for the transcriptomics datasets and for low read count methylated regions for the methylomics dataset. For the transcriptomics dataset, the experiments were conducted in two scenarios: a) all genes including protein-coding, lincRNA gene, miRNA gene, rRNA gene, etc. are present in the dataset after removing the genes with lower read counts, and b) only protein-coding genes are present in the dataset after removing the genes with lower read counts. For the methylomics dataset, all methylated regions except lower read counts were present.
Cross-Validation and Model Performance
For model validation and comparing results between the methods, we applied the leave-one-out cross-validation for computing the performance measures. This ensures two things: 1) the record used for model validation is not used for model construction, and 2) all records are used for model validation. This technique is useful for dataset with smaller number of samples such as in our study. The final model is constructed using all records. We computed several model performance measures: accuracy, sensitivity, specificity, precision, F1 score, Matthews correlation coefficient (MCC), and area under the receiver operating characteristics curve (AUC); the leave-one-out cross-validation approach was used for calculating these measures.
Results
Data Preprocessing and Differential Analysis
There were a total of 38 samples in the transcriptomics dataset. After preprocessing of the RNA-seq data of each samples, we created a dataset containing the read counts of 58,050 genes in which 18,852 genes were protein-coding. After applying the filtering criteria for low count genes, 14,154 genes were included in the dataset in which 11,687 of them were protein-coding genes. We performed differential analysis using the GLM followed by likelihood ratio test on 14,154 genes and found 28 DEGs: 5 upregulated and 23 downregulated genes. We also performed the differential analysis on the 11,687 protein-coding genes only and found 11 protein-coding DEGs: one upregulated and 10 downregulated genes.
In the methylomics dataset, out of the 80 samples, 77 samples met the quality control criteria (35 controls and 42 endometriosis). After preprocessing of the enrichment-based DNA methylation (MBD-seq) data of each sample, we created a dataset containing the read counts of 3,088,281 methylated regions. After applying the filtering criteria for lower read counts, 2,577,382 methylated regions were included in the dataset. We performed the differential analysis using GLM on 2,577,382 methylated regions and found 365 DMRs in which 303 of them were hypermethylated and 62 of them were hypomethylated.
Decision Tree Results Using Transcriptomics Data
For the experiments using both the protein-coding and nonprotein-coding genes (denoted as “all genes” in this article), we used 14,154 genes in these experiments. For the experiments using only the protein-coding genes, we used only the protein-coding genes that include 11,687 genes. We applied the six experiments (separately for all genes and protein-coding genes) using the decision tree algorithm. Table 3 presents the decision tree models from those experiments. A total of 13 candidate biomarker genes were identified from the transcriptomics experiments using decision tree. Among those genes, eight genes were differentially expressed (seven downregulated and one upregulated). Six genes were identified from the models using all genes in which three of them are protein-coding. Nine genes were identified from the models using protein-coding genes. Two genes (NOTCH3 and TMEM106B) were found common between the two groups of results (all vs. protein-coding genes). NOTCH3 was present in all models, and KLF2P1 was present in three models using decision tree. “TMM + GLM + Decision Tree” experiments (all vs. protein-coding genes) achieved the best performances (see Performance Evaluation section for more details). Figure 1 presents the gene interaction network among all the genes from different decision tree models of the transcriptomics dataset. Most of the query genes and predicted genes are linked by co-expression network with weight 99.70. There were no significant GO annotation from the functional enrichment analysis of these genes.
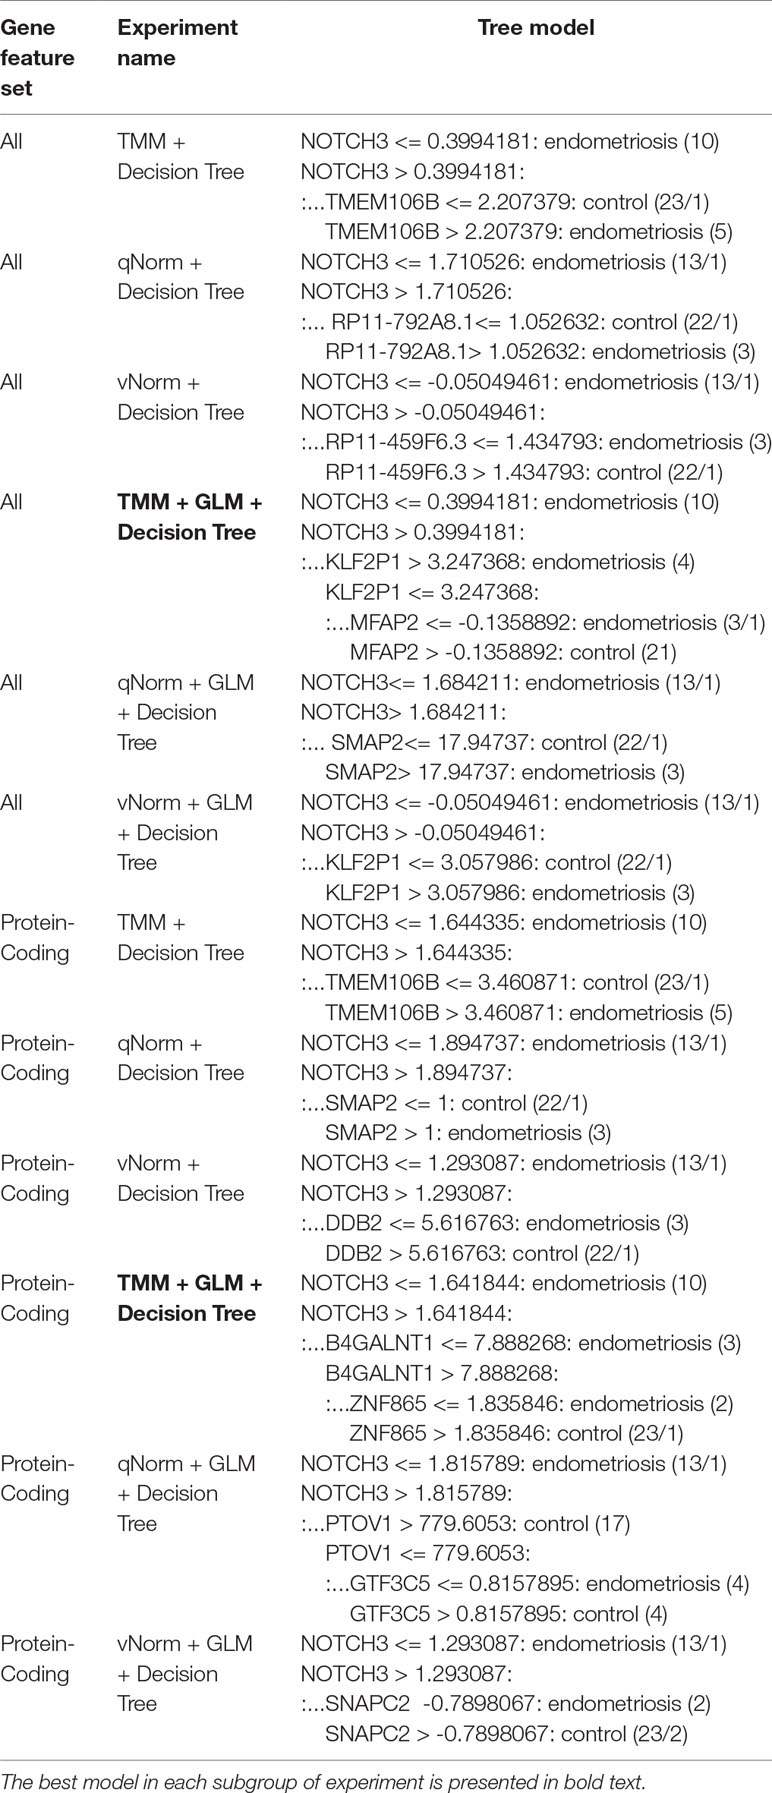
Table 3 Decision tree models using transcriptomics data.
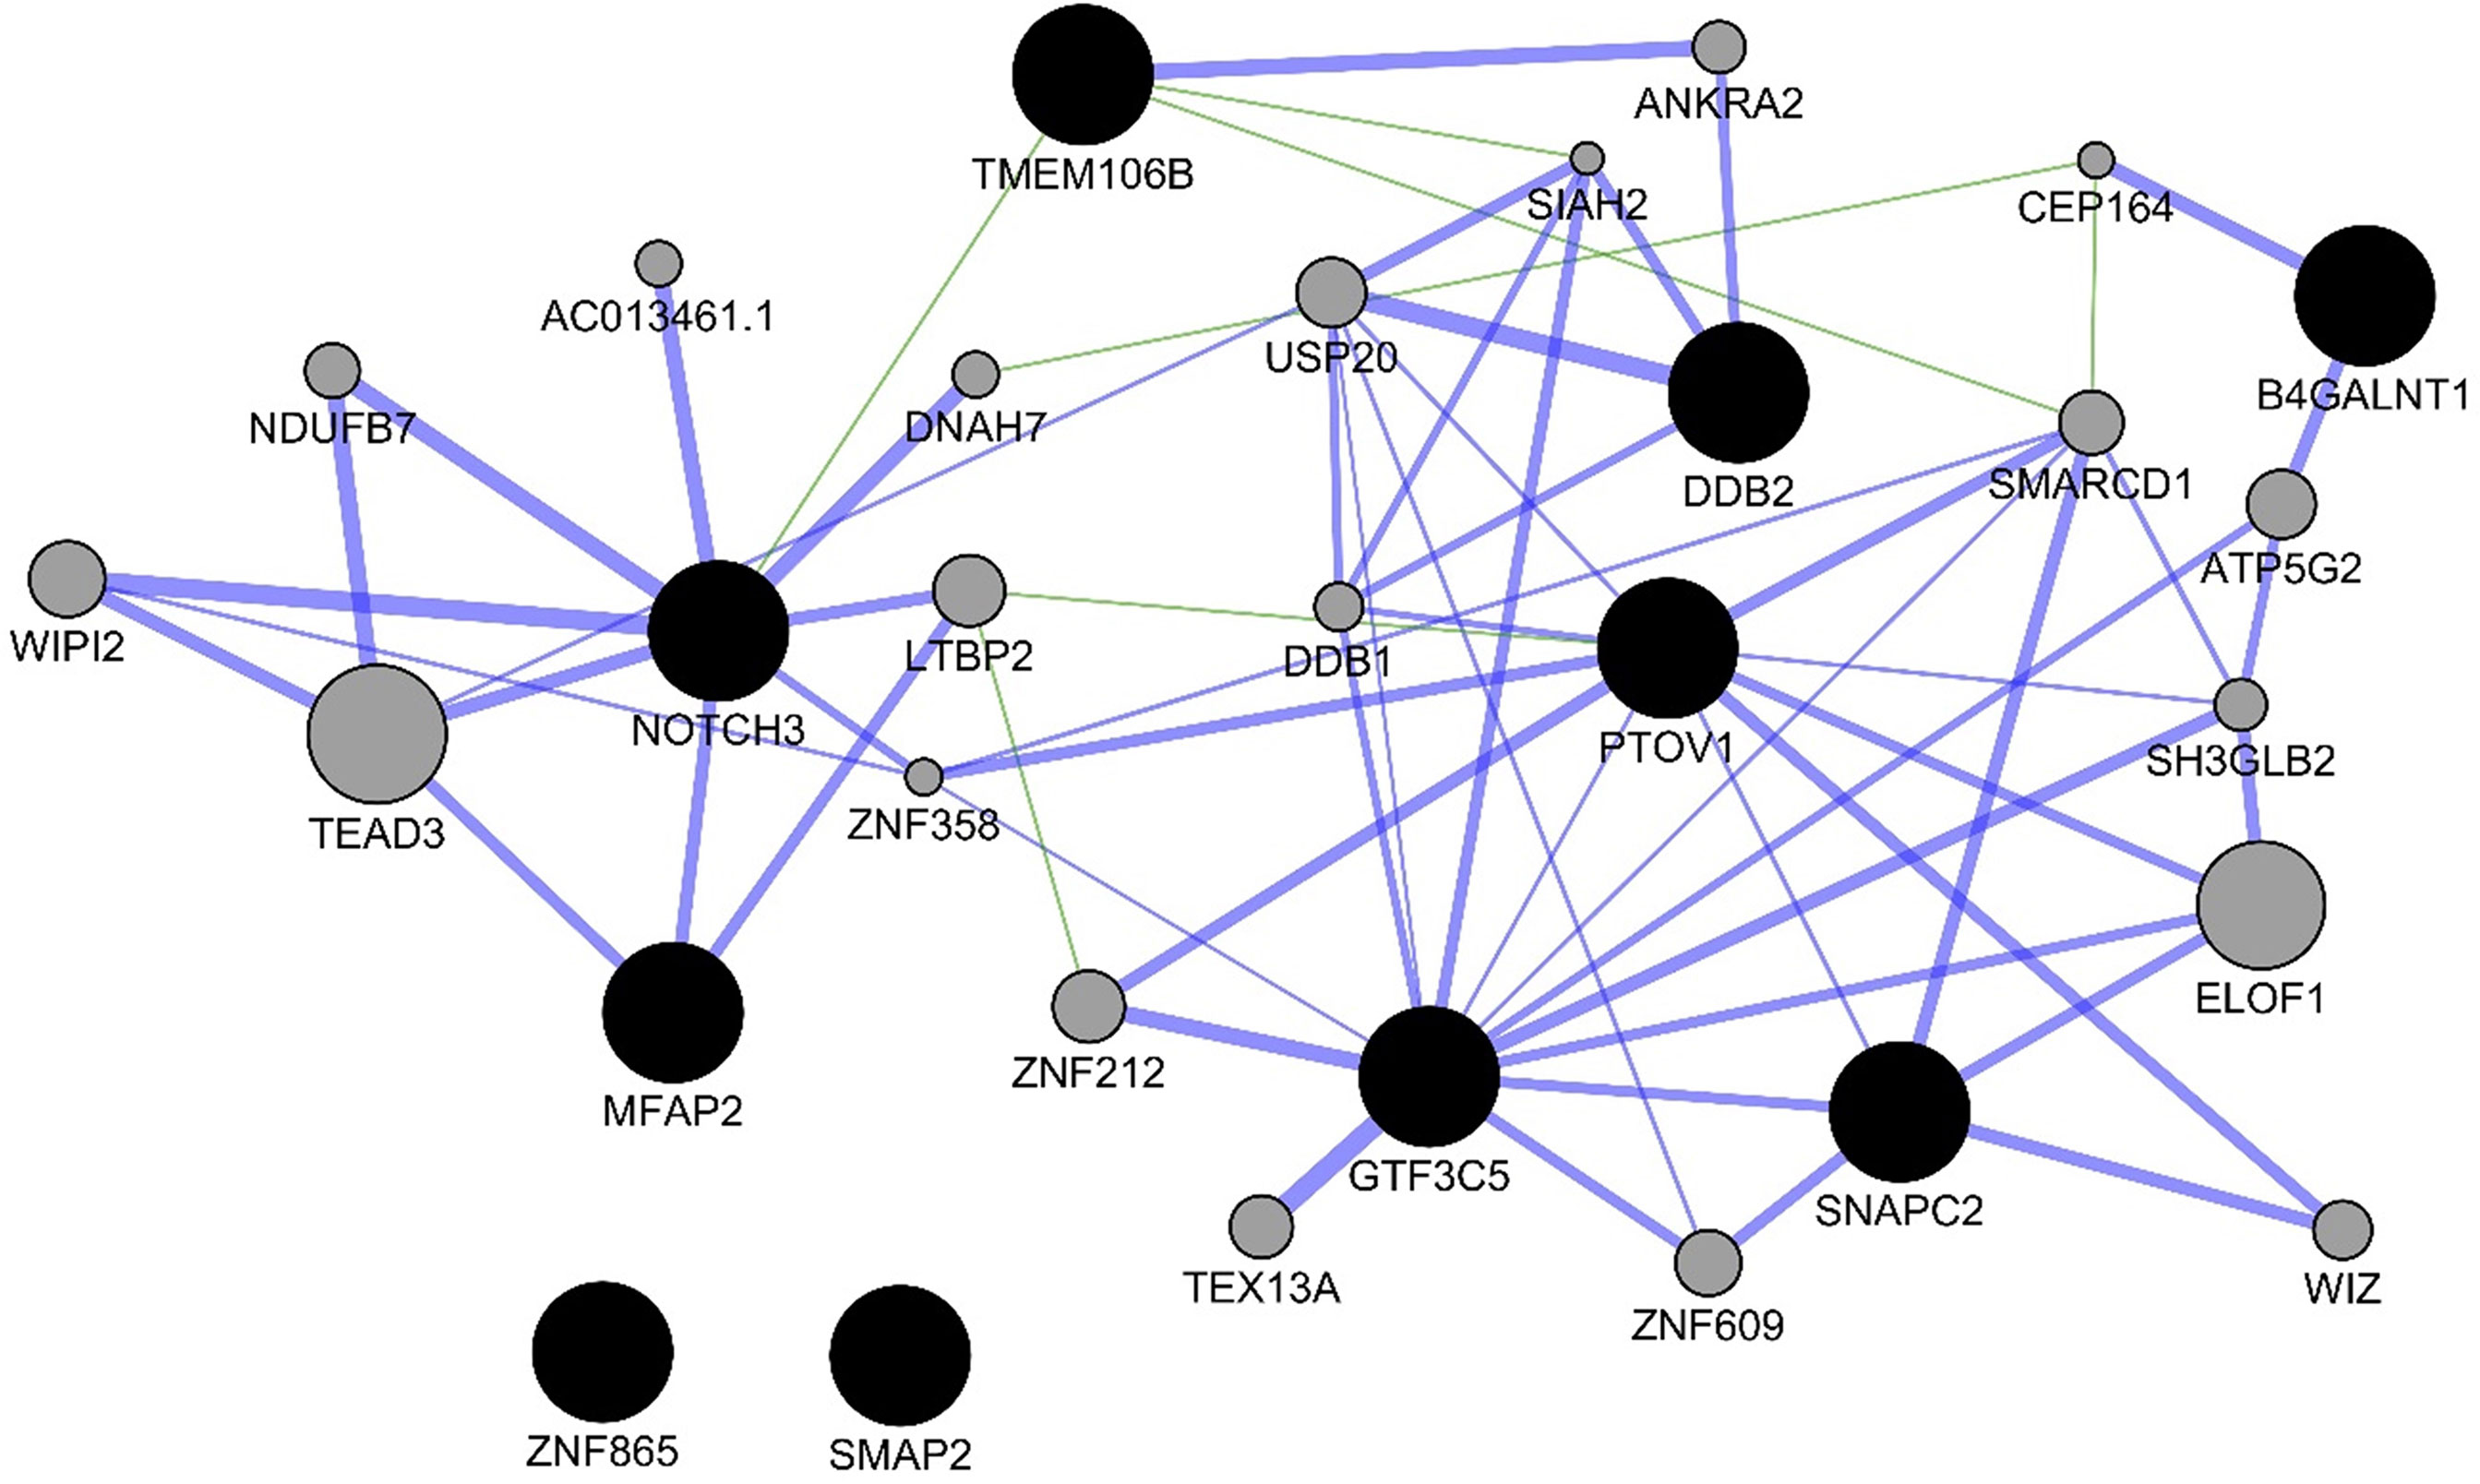
Figure 1 Gene interaction network among the genes from the decision tree models using the protein-coding genes of transcriptomics data. Black circles denote the candidate biomarkers genes, and gray circles denote the GeneMANIA-predicted genes. Blue and green edges represent co-expression (network weight 99.70) and genetic interactions (network weight 0.33), respectively.
Biosigner Results Using Transcriptomics Data
We applied the Biosigner algorithm on 14,154 genes including both the protein-coding and nonprotein-coding genes (denoted as “all genes” in this article) and on 11,687 protein-coding genes only, separately. As the input of the Biosigner algorithm, we used the TMM normalized data as the expression data. The Biosigner algorithm constructed three different models: PLSDA, random forest, and SVM. Figure 2A presents the gene tier plot (S = signature genes; A–E = A is a higher tier gene and E is a lower tier genes). Biosigner identified three genes as the potential set of biomarkers: NOTCH3, RP4-782L23.2, and SEMA3B-AS1 using all genes. Figure 2B presents the gene tier plot of four genes as the potential set of biomarkers identified by Biosigner: NOTCH3, SNAPC2, ILDR1, and C1QL3 using protein-coding genes only. Table 4 presents the candidate biomarker genes that were identified from the transcriptomics experiments using Biosigner, in which three genes were differentially expressed (two downregulated and one upregulated). Three genes were identified from the models using all genes in which one of them is protein-coding, and four genes were identified from the models using the protein-coding genes. One gene (NOTCH3) was found common between the two groups of results (all vs. protein-coding genes). NOTCH3 was present in all the models, and SNAPC2 and RP4-782L23.2 were present in two models using Biosigner. Unlike the decision tree experiments, the results were opposite in Biosigner; the models using protein-coding genes performed either similar or better results than the models using all genes. We also compared the gene list found between the decision tree models and the Biosigner models; NOTCH3 and SNAPC2 were found common between those two sets of genes. Both of these genes are protein-coding and were found downregulated in the differential analysis.
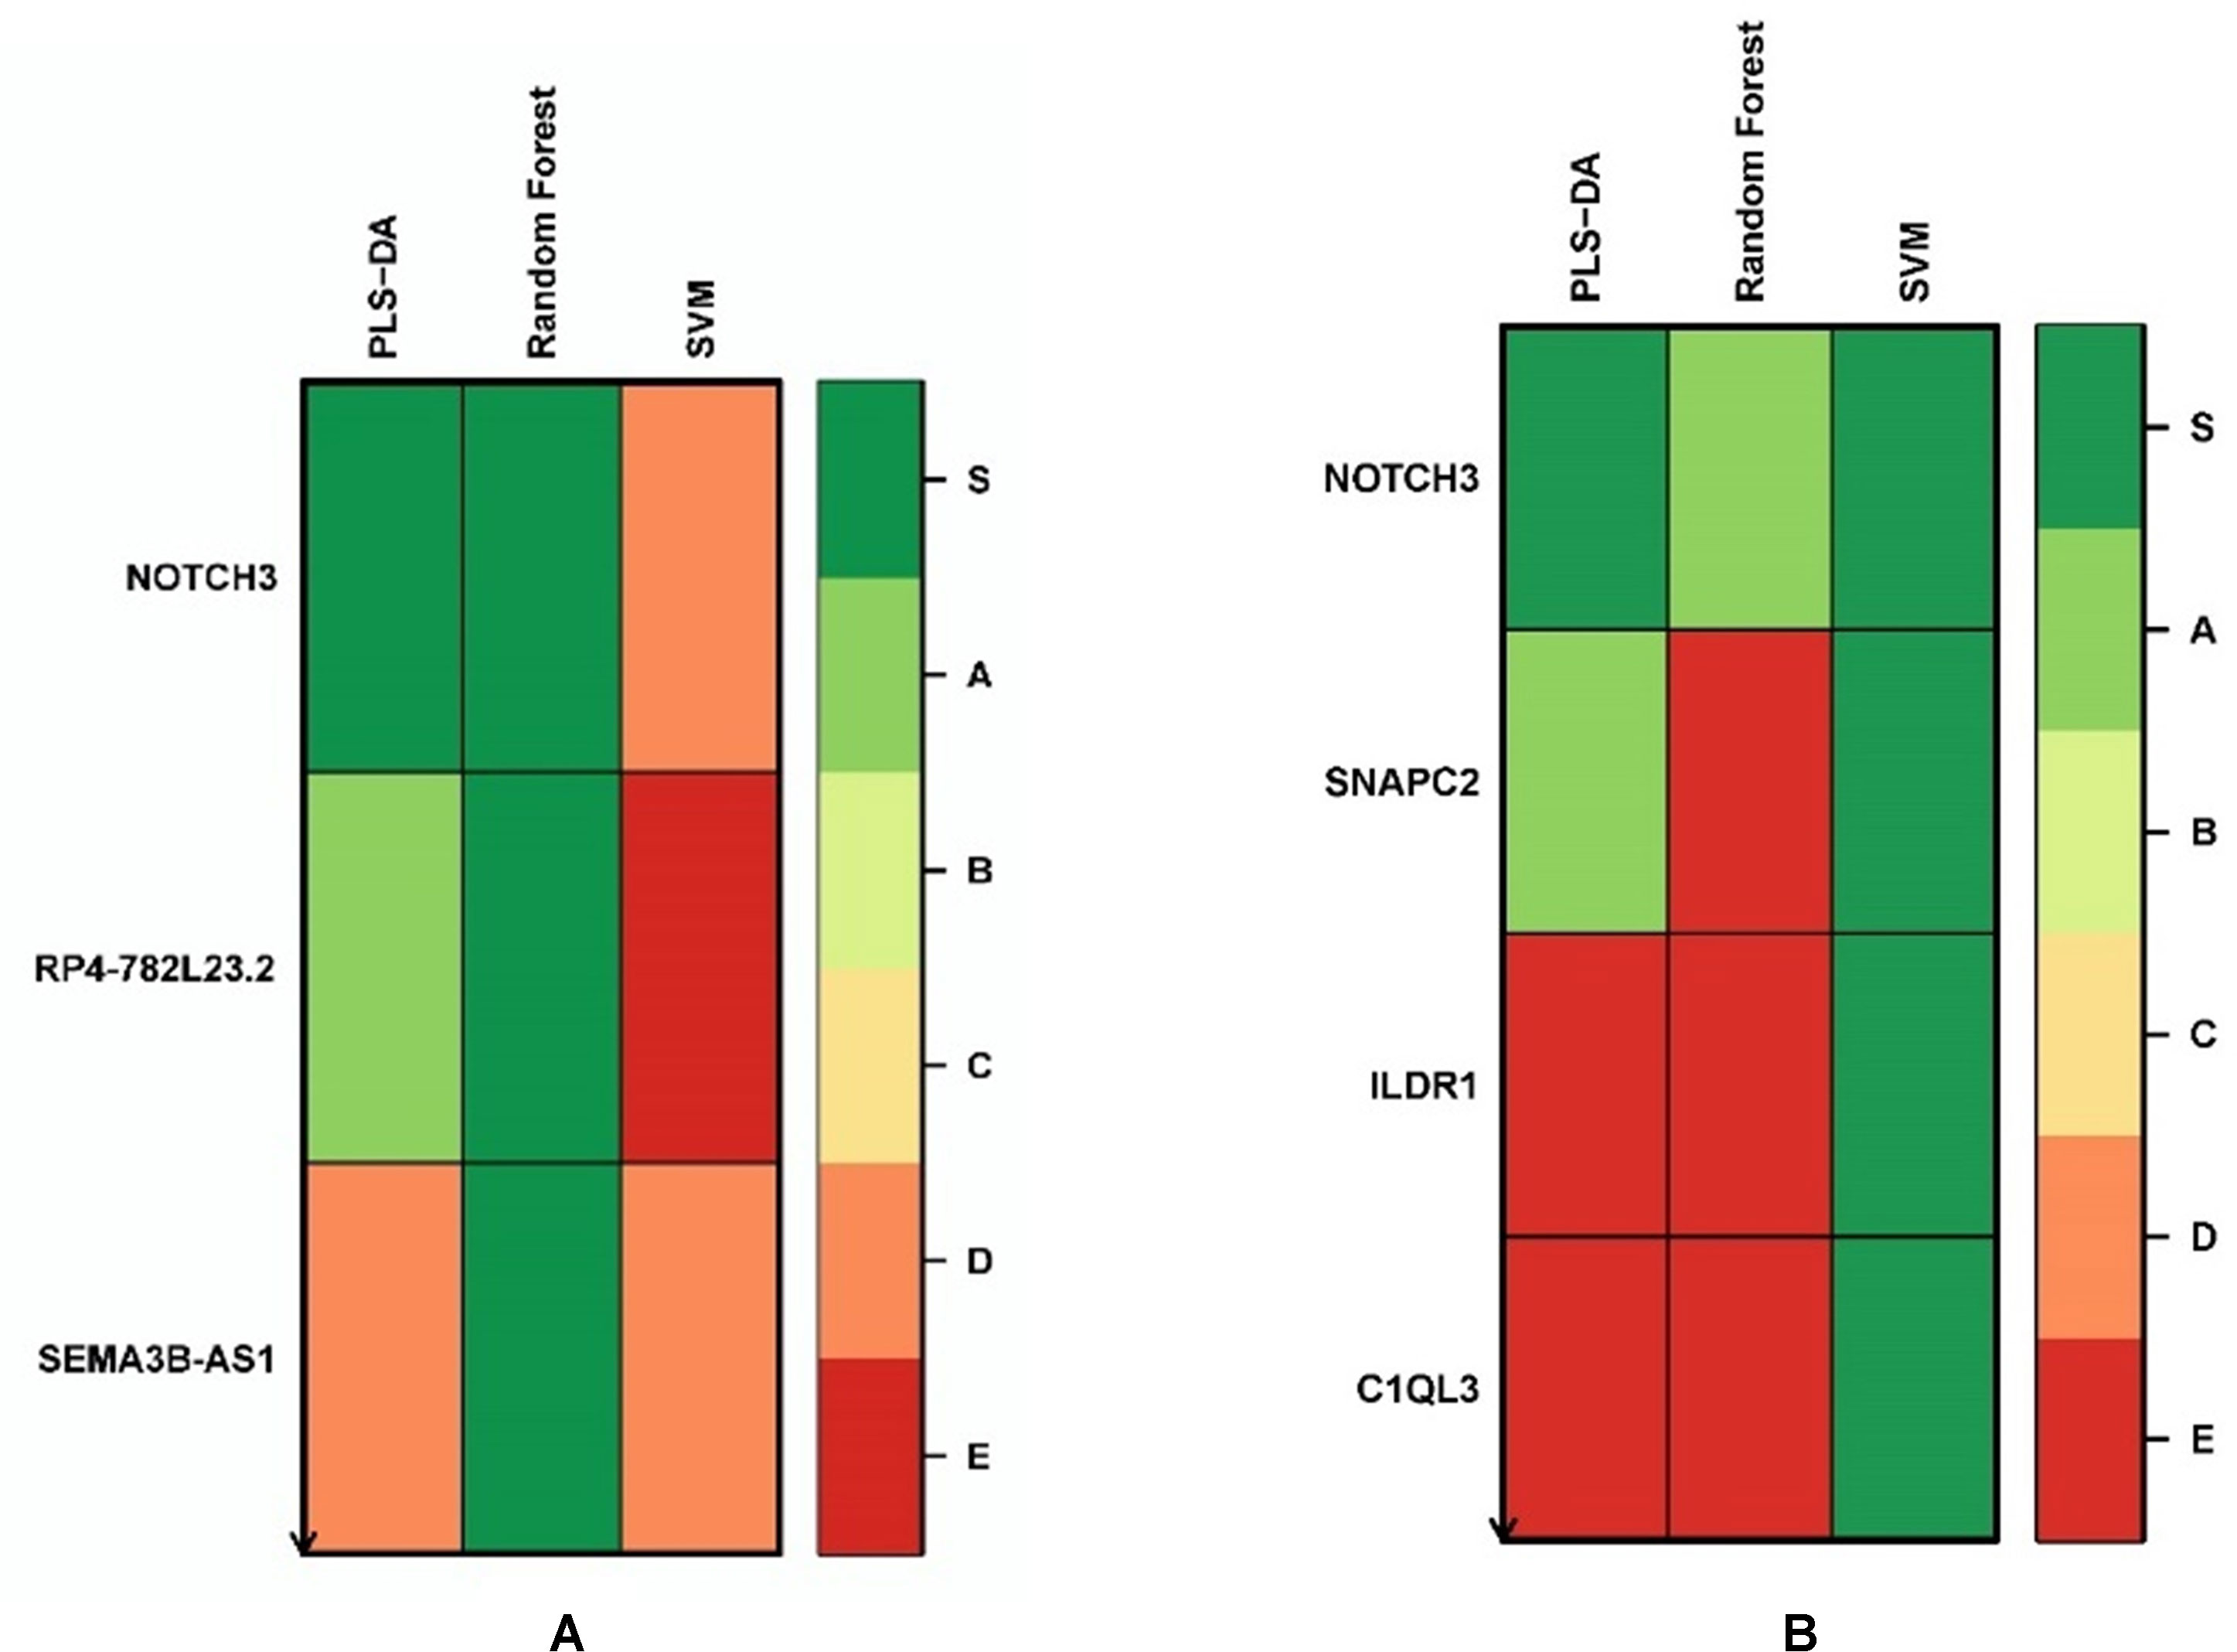
Figure 2 Gene tier plot from Biosigner using transcriptomics data from the experiments using: (A) all genes, (B) protein-coding genes only; S, signature genes; A–E=A is a higher tier, and E is a lower tier.
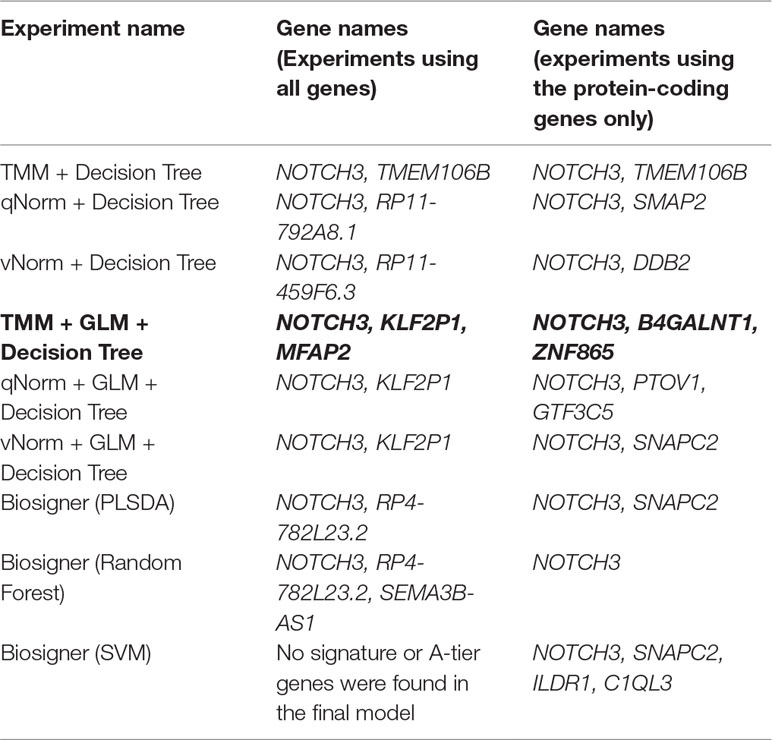
Table 4 Candidate biomarker genes from transcriptomics analysis.
Performance Evaluation of Models Using Transcriptomics Data
The results of the decision tree performance measures on the transcriptomics dataset using all genes are presented in Table 5. We observed that the models using all genes performed better than the models using protein-coding genes. This is mainly because, in case of all genes, the models took the benefit of using genes that are not protein-coding. When the decision tree was created on three different normalized data (TMM, qNorm, and vNorm), the model tends to perform better on the TMM data. The “TMM + Decision Tree” experiment achieved the accuracy of 71.1%, with sensitivity of 68.8%, specificity of 72.7%, and precision of 64.7%. The F1 score of the “TMM + Decision Tree” experiment is 0.677, MCC is 0.412, and AUC is 0.665. We also applied the GLM technique on the 14,154 genes and identified 28 DEGs: five genes were upregulated, and 23 genes were down regulated. When the decision tree was created using those 28 DEGs, the performance measures improved significantly on all three different normalized data (TMM, qNorm, and vNorm). Among these experiments, the “TMM + GLM + Decision Tree” experiment achieved the best performance followed by the “qNorm + GLM + Decision Tree” experiment that achieved the second best performance. The “TMM + GLM + Decision Tree” experiment achieved the accuracy of 89.5%, with sensitivity of 81.3%, specificity of 95.5%, and precision of 92.9%. The F1 score of the “TMM + GLM + Decision Tree” experiment is 0.867, MCC is 0.785, and AUC is 0.92. Table 3 presents the decision tree model that was created using the “TMM + GLM + Decision Tree” experiment.
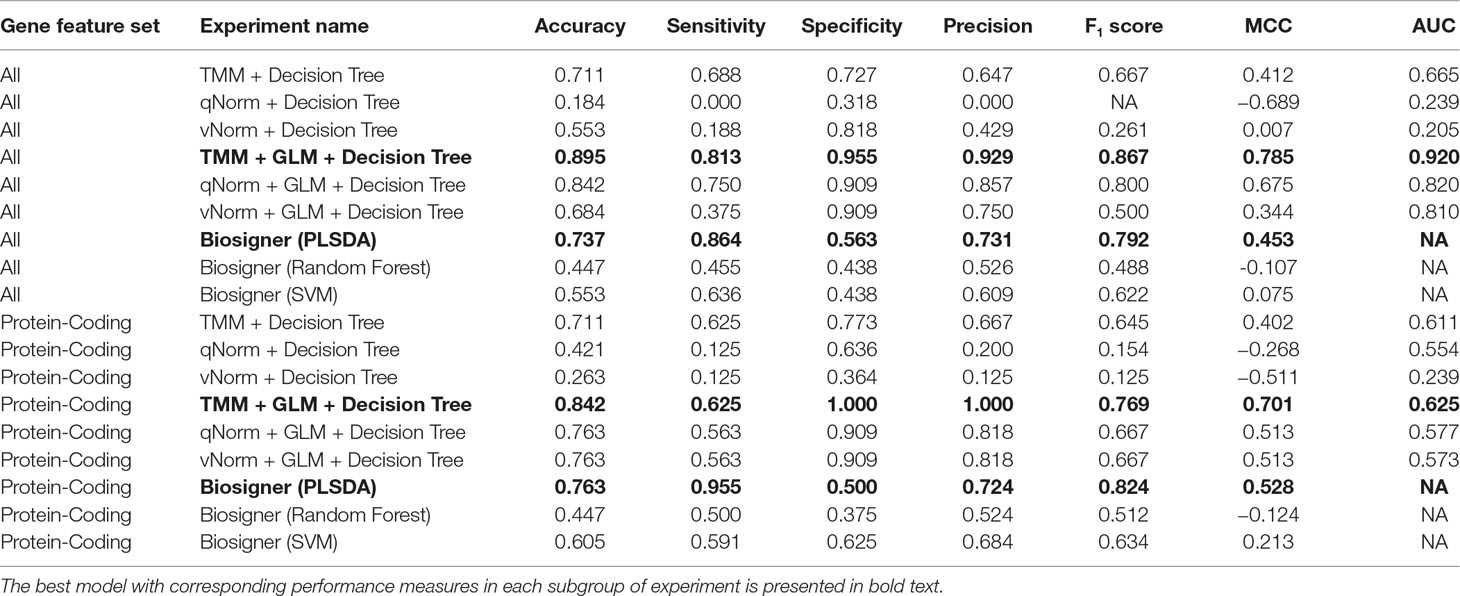
Table 5 Performance measures using transcriptomics data by leave-one-out cross-validation.
For the experiments using only the protein-coding genes, the decision tree model tends to perform better on the TMM data. This is consistent with the experiments using all genes. The “TMM + Decision Tree” experiment achieved the accuracy of 71.1%, with sensitivity of 62.5%, specificity of 77.3%, and precision of 66.7%. The F1 score of the “TMM + Decision Tree” experiment is 0.645, MCC is 0.402, and AUC is 0.611. We also applied the GLM technique on the 11,687 protein-coding genes and identified 11 protein-coding genes that were differentially expressed in which one gene was upregulated and 10 genes were downregulated. When the decision tree was created using those 11 protein-coding DEGs, the performance measures improved significantly on all three different normalized data (TMM, qNorm, and vNorm). This is also consistent with the experiments using all genes. Among these experiments, the “TMM + GLM + Decision Tree” experiment achieved the best performance, which is 84.2% accuracy, 62.5% sensitivity, 100% specificity, and 100% precision. The F1 score of the “TMM + GLM + Decision Tree” experiment is 0.769, MCC is 0.701, and AUC is 0.625. Table 3 presents the decision tree model that was created using the “TMM + GLM + Decision Tree” experiment; the model shows the gene names that were identified in the decision tree models differentiating endometriosis vs. control.
Table 5 presents the Biosigner performance measures that were computed using the leave-one-out cross-validation approach. For both groups of results (all vs. protein-coding genes), the best performance was observed using the PLSDA model. For all genes, the PLSDA achieved the accuracy of 73.7%, sensitivity of 86.4%, specificity of 56.3%, precision of 73.1%, F1 score of 0.792%, and MCC of 0.453. For the protein-coding genes, the PLSDA achieved the accuracy of 76.3%, sensitivity of 95.5%, specificity of 50.0%, precision of 72.4%, F1 score of 0.824, and MCC of 0.528. The performance measures for random forest and SVM are significantly lower in comparison with those for PLSDA using all genes. However, SVM has a higher specificity than PLSDA and random forest using protein-coding genes.
A bar chart comparison of accuracy, sensitivity, and specificity for experiments using all genes is presented in Figure 3. In this scenario, the “TMM + Decision Tree” experiment has a balanced accuracy, sensitivity, and specificity but does not outperform all of the experiments. The “TMM + GLM + Decision Tree” experiment produced the highest accuracy, specificity, and precision among all the experiments and outperformed all of the experiments by F1 score and MCC. A bar chart comparison of accuracy, sensitivity, and specificity for experiments using the protein-coding genes is presented in Figure 4. In this scenario, the SVM in Biosigner has a balanced accuracy, sensitivity, and specificity but does not outperform all of the experiments. The PLSDA in Biosigner achieved the best sensitivity and F1 score but has a poor specificity. The “TMM + GLM + Decision Tree” experiment produced the highest accuracy, specificity, and precision among all of the experiments and outperformed all experiments based on MCC. In both scenarios (all vs. protein-coding genes), GLM was useful for improving the overall performance in case of the decision tree application.
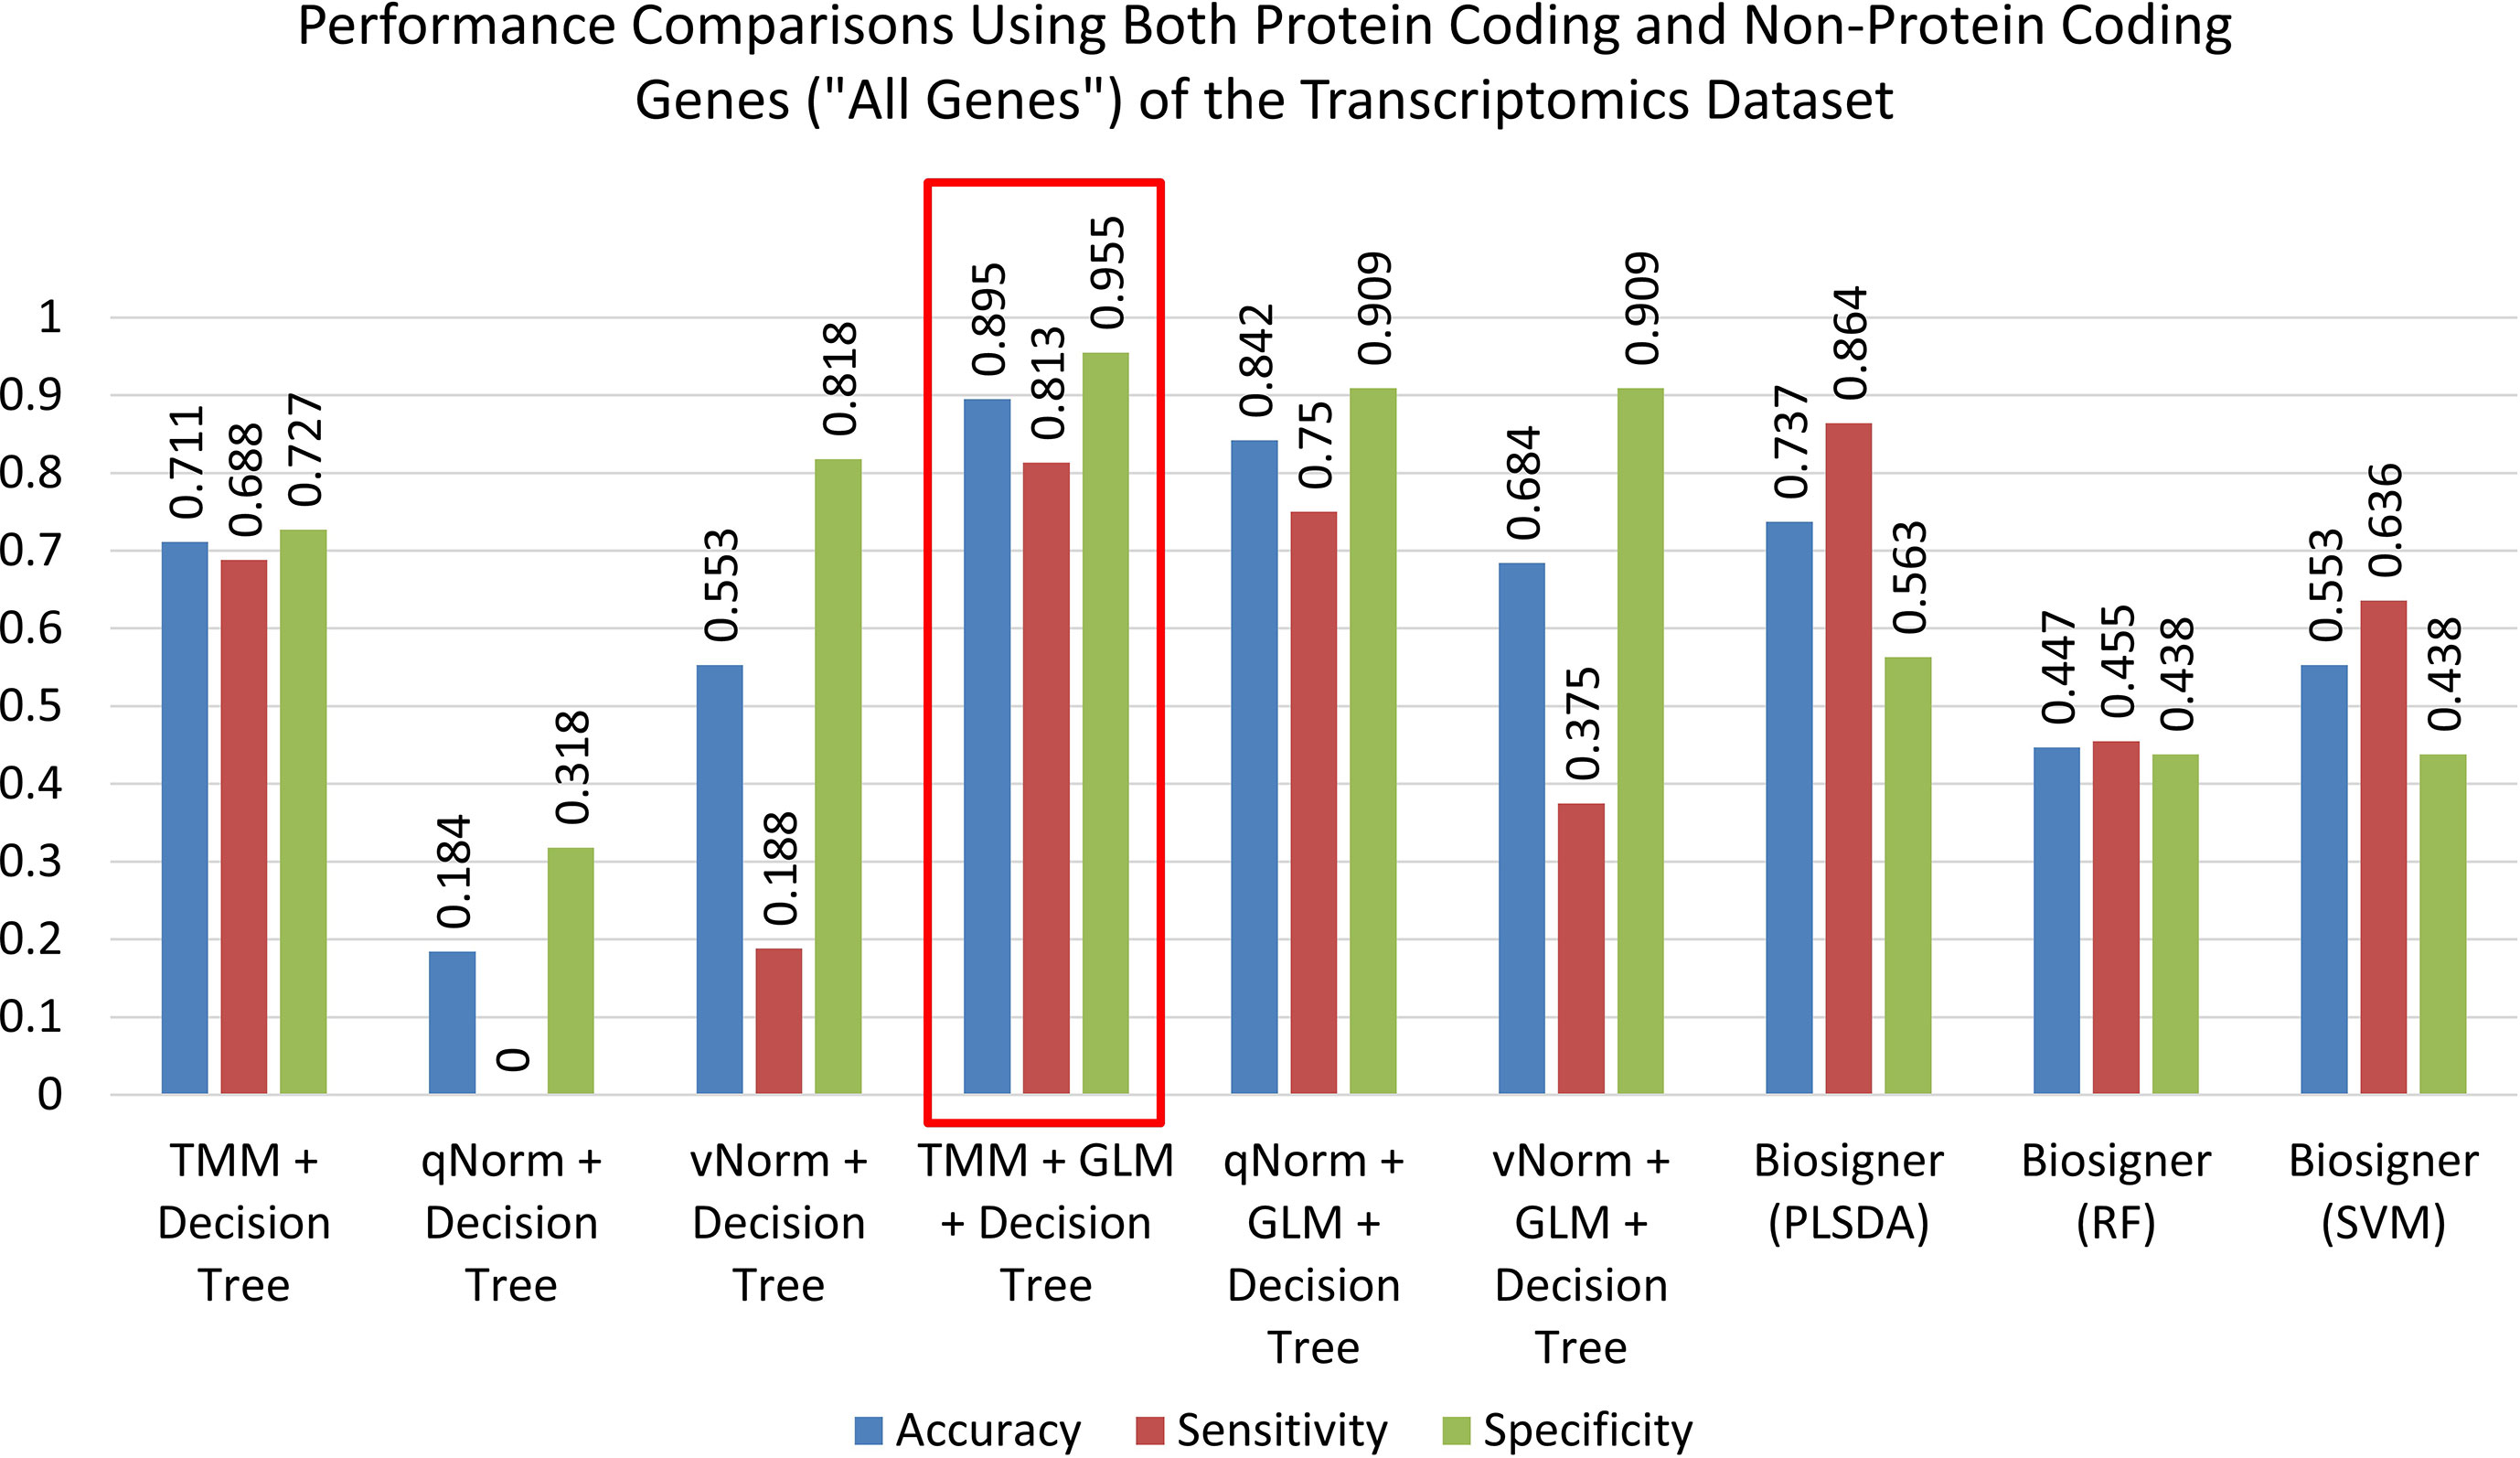
Figure 3 Performance comparisons using both protein-coding and nonprotein-coding genes (“all genes”) of the transcriptomics dataset.
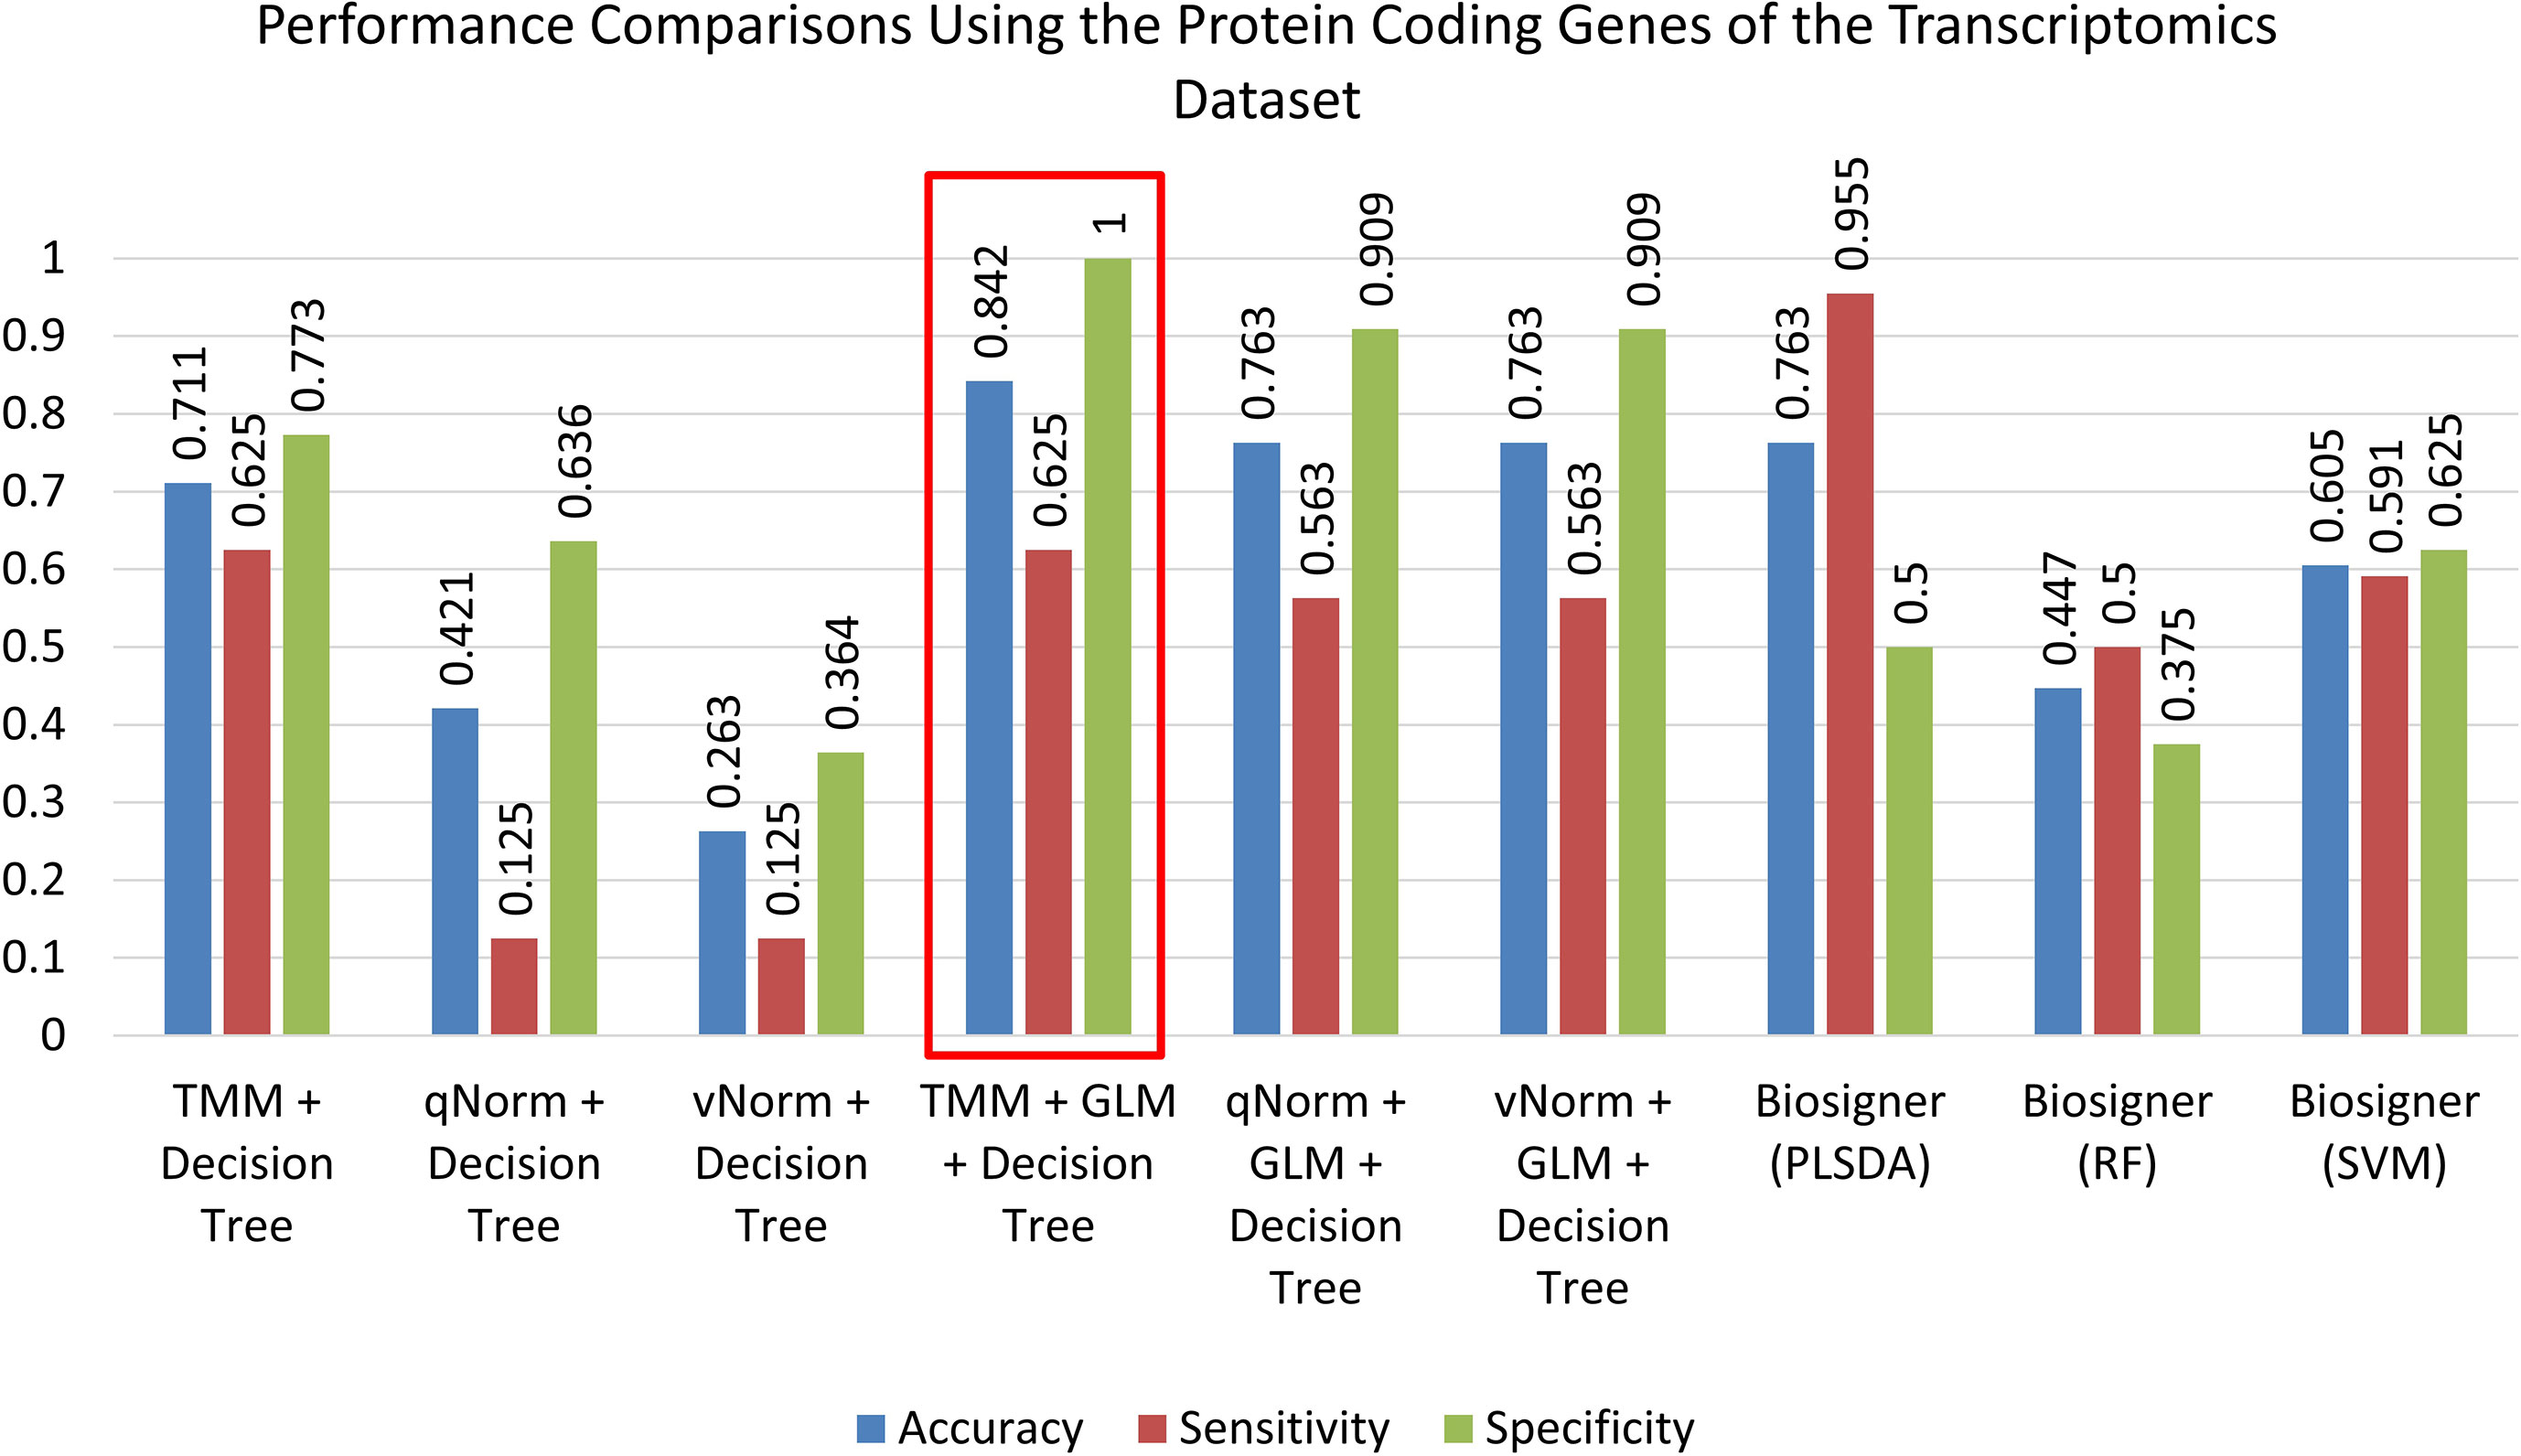
Figure 4 Performance comparisons using the protein-coding genes of the transcriptomics dataset.
Decision Tree Results Using Methylomics Data
For the six decision tree experiments using the methylomics dataset, we used 2,577,382 methylated regions in these experiments. Table 6 presents the decision tree models from different experiments. The methylated regions of interest (MROI) were extracted from the decision tree models, and the nearby genes of those MROIs were extracted using the process described in the Methods section. All the MROIs and nearby genes are presented in Table 7. Among those 17 MROIs, eight regions were differentially methylated and hypo-methylated. We found eight nearby genes of those 17 MROIs within the distance of 10,000 bp, in which five genes are protein-coding (e.g., MFSD14B, RASSF2, TRPM6, TNIP2, and FGD3), two genes are lincRNA (e.g., RP11-734K21.4 and RP3-522J7.6), and one is pseudogene (e.g., RPL37AP1). Also, the MROIs related to five genes (e.g., MFSD14B, RASSF2, RP11-734K21.4, RP3-522J7.6, and TNIP2) were found upstream and three genes (e.g., RPL37AP1, TRPM6, and FGD3) overlapped with the regions. Figure 5 presents the gene–gene interaction network comprising all the nearby genes of the MROIs identified by the decision tree models. GeneMANIA predicted many genes that are closely related to the query genes. The gene interaction network includes physical interaction network (weight 67.64), co-expression network (weight 13.50), predicted functional relationships between genes (weight 6.35), co-localization network (6.17), pathway network (weight 4.35), genetic interaction network (weight 1.40), and shared protein domain network (weight 0.59). Some of the top gene ontologies from the functional enrichment analysis include regulation of endothelial cell apoptotic process, toll-like receptor signaling pathway, innate immune response-activating signal transduction, Fc receptor signaling pathway, and regulation of I-kappaB kinase/NF-kappaB signaling. More detail is presented in the Supplementary Table 1.
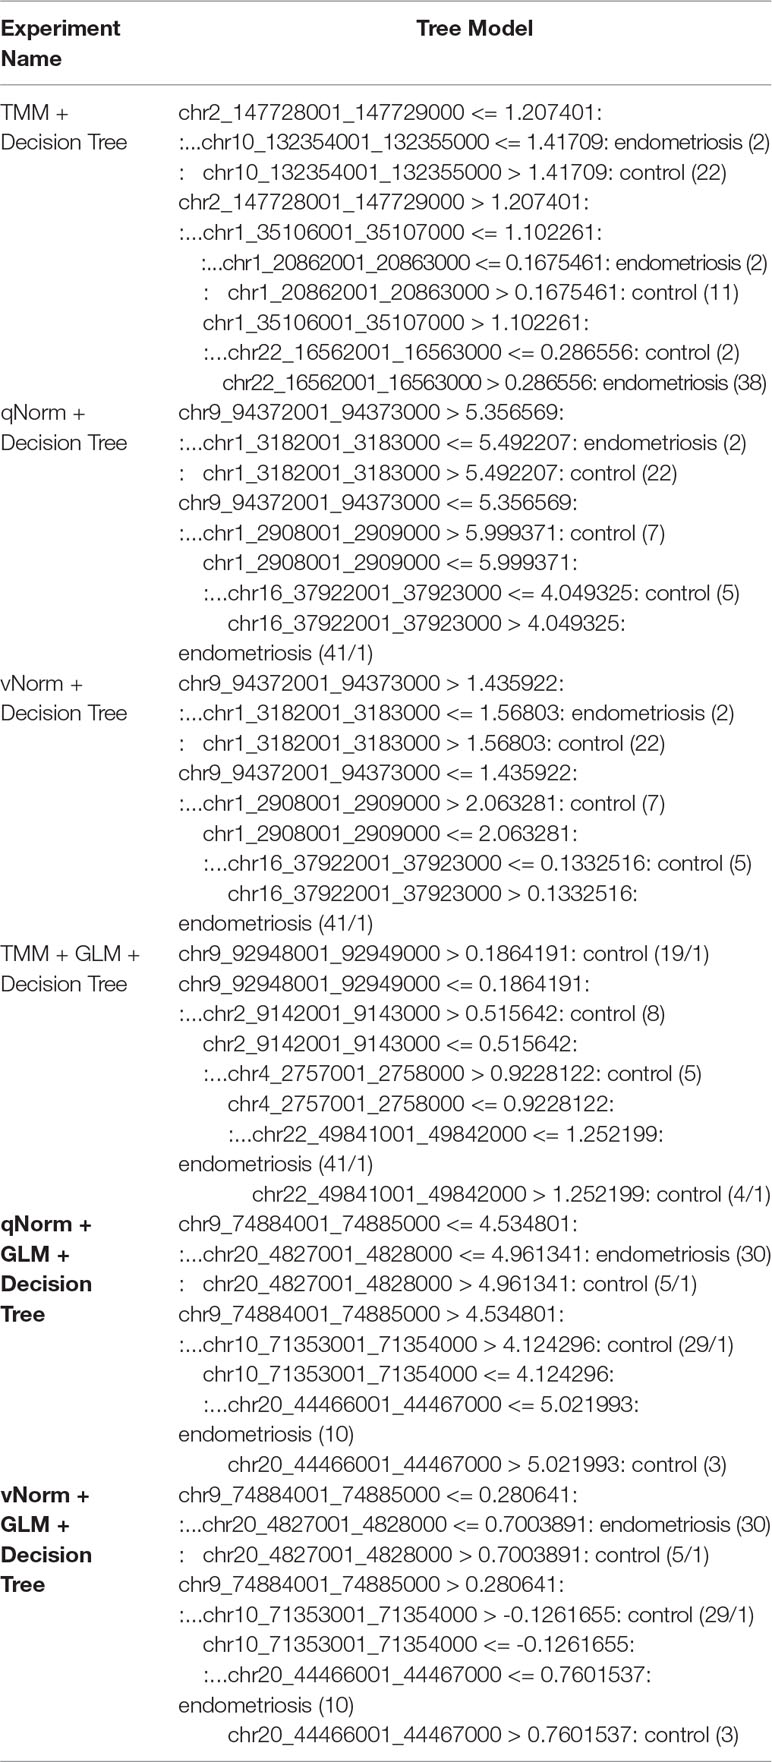
Table 6 Decision tree models using methylomics data.
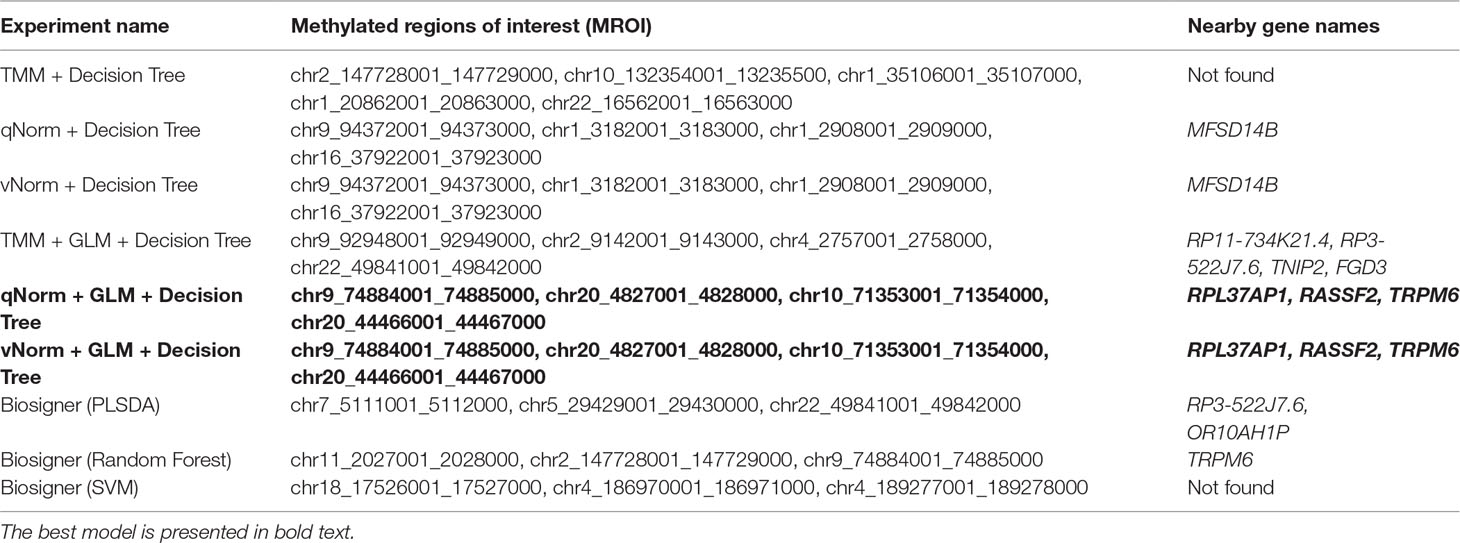
Table 7 Methylated regions of interest (MROI) and candidate biomarker genes from methylomics analysis.
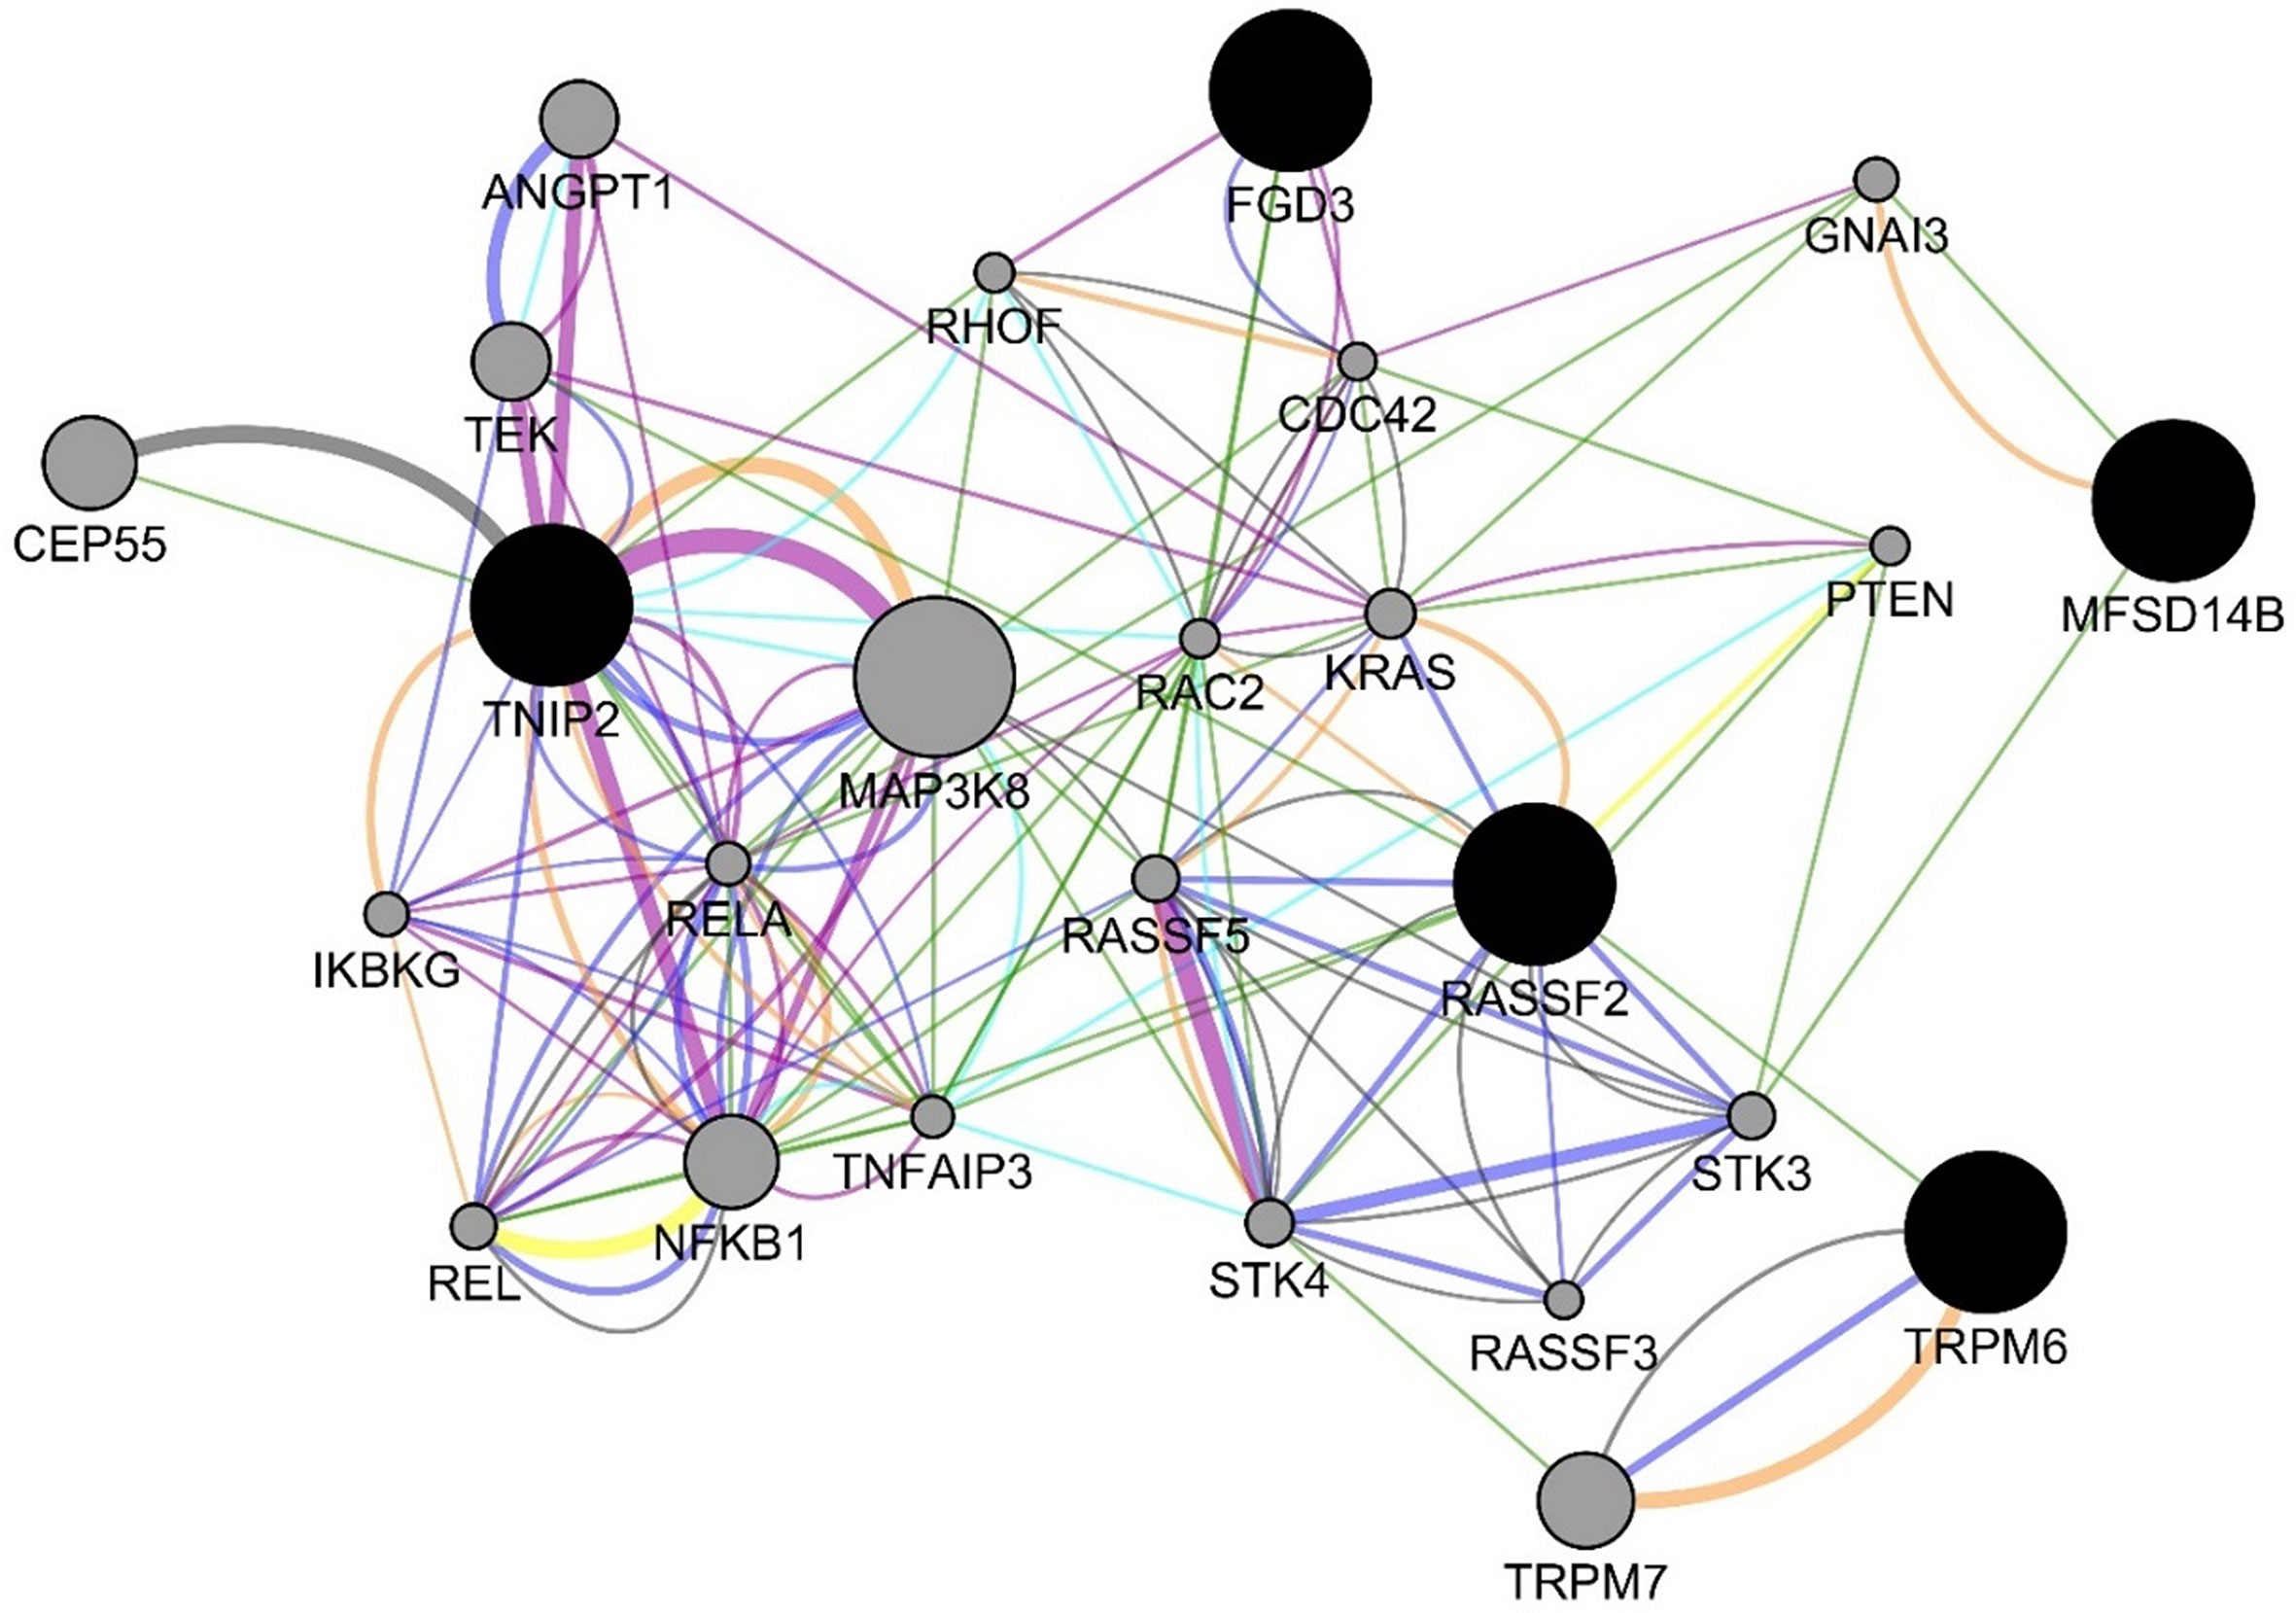
Figure 5 Gene interaction network among the genes from the decision tree models using the methylomics data. The blue, green, orange, teal, purple, yellow, and gray edges represent various GeneMANIA networks: physical interaction network (weight 67.64), co-expression network (weight 13.50), predicted functional relationships between genes (weight 6.35), co-localization network (6.17), pathway network (weight 4.35), genetic interaction network (weight 1.40), and shared protein domain network (weight 0.59), respectively.
Biosigner Results Using Methylomics Data
We applied the Biosigner algorithm on 2,577,382 methylated regions. As the input of the Biosigner algorithm, we used the TMM normalized data as the methylation expression data. The Biosigner algorithm constructed three different models: PLSDA, random forest, and SVM. Figure 6 presents the tier plot of the methylated regions (here, S = signature genes; A–E = A is a higher tier gene and E is a lower tier genes). Biosigner identified nine methylated regions as the potential set of biomarkers. The MROIs (n = 9) were extracted from the Biosigner models, and the nearby genes of those MROIs were extracted using the experiments described in the Methods section. Among those nine MROIs, four regions were differentially methylated (three hypo-methylated and one hyper-methylated). We found three genes (see Table 7) within the distance of 10,000 bp from those nine MROIs, in which one gene is protein-coding (e.g., TRPM6), one is lincRNA (e.g., RP3-522J7.6), and one is pseudogene (e.g., OR10AH1P). Also, the MROIs related to two genes (e.g., RP3-522J7.6 and OR10AH1P) were found upstream and one (e.g., TRPM6) overlapped with the regions. We compared the genes found from the decision tree and the Biosigner experiments and found two common genes (e.g., TRPM6 and RP3-522J7.6).
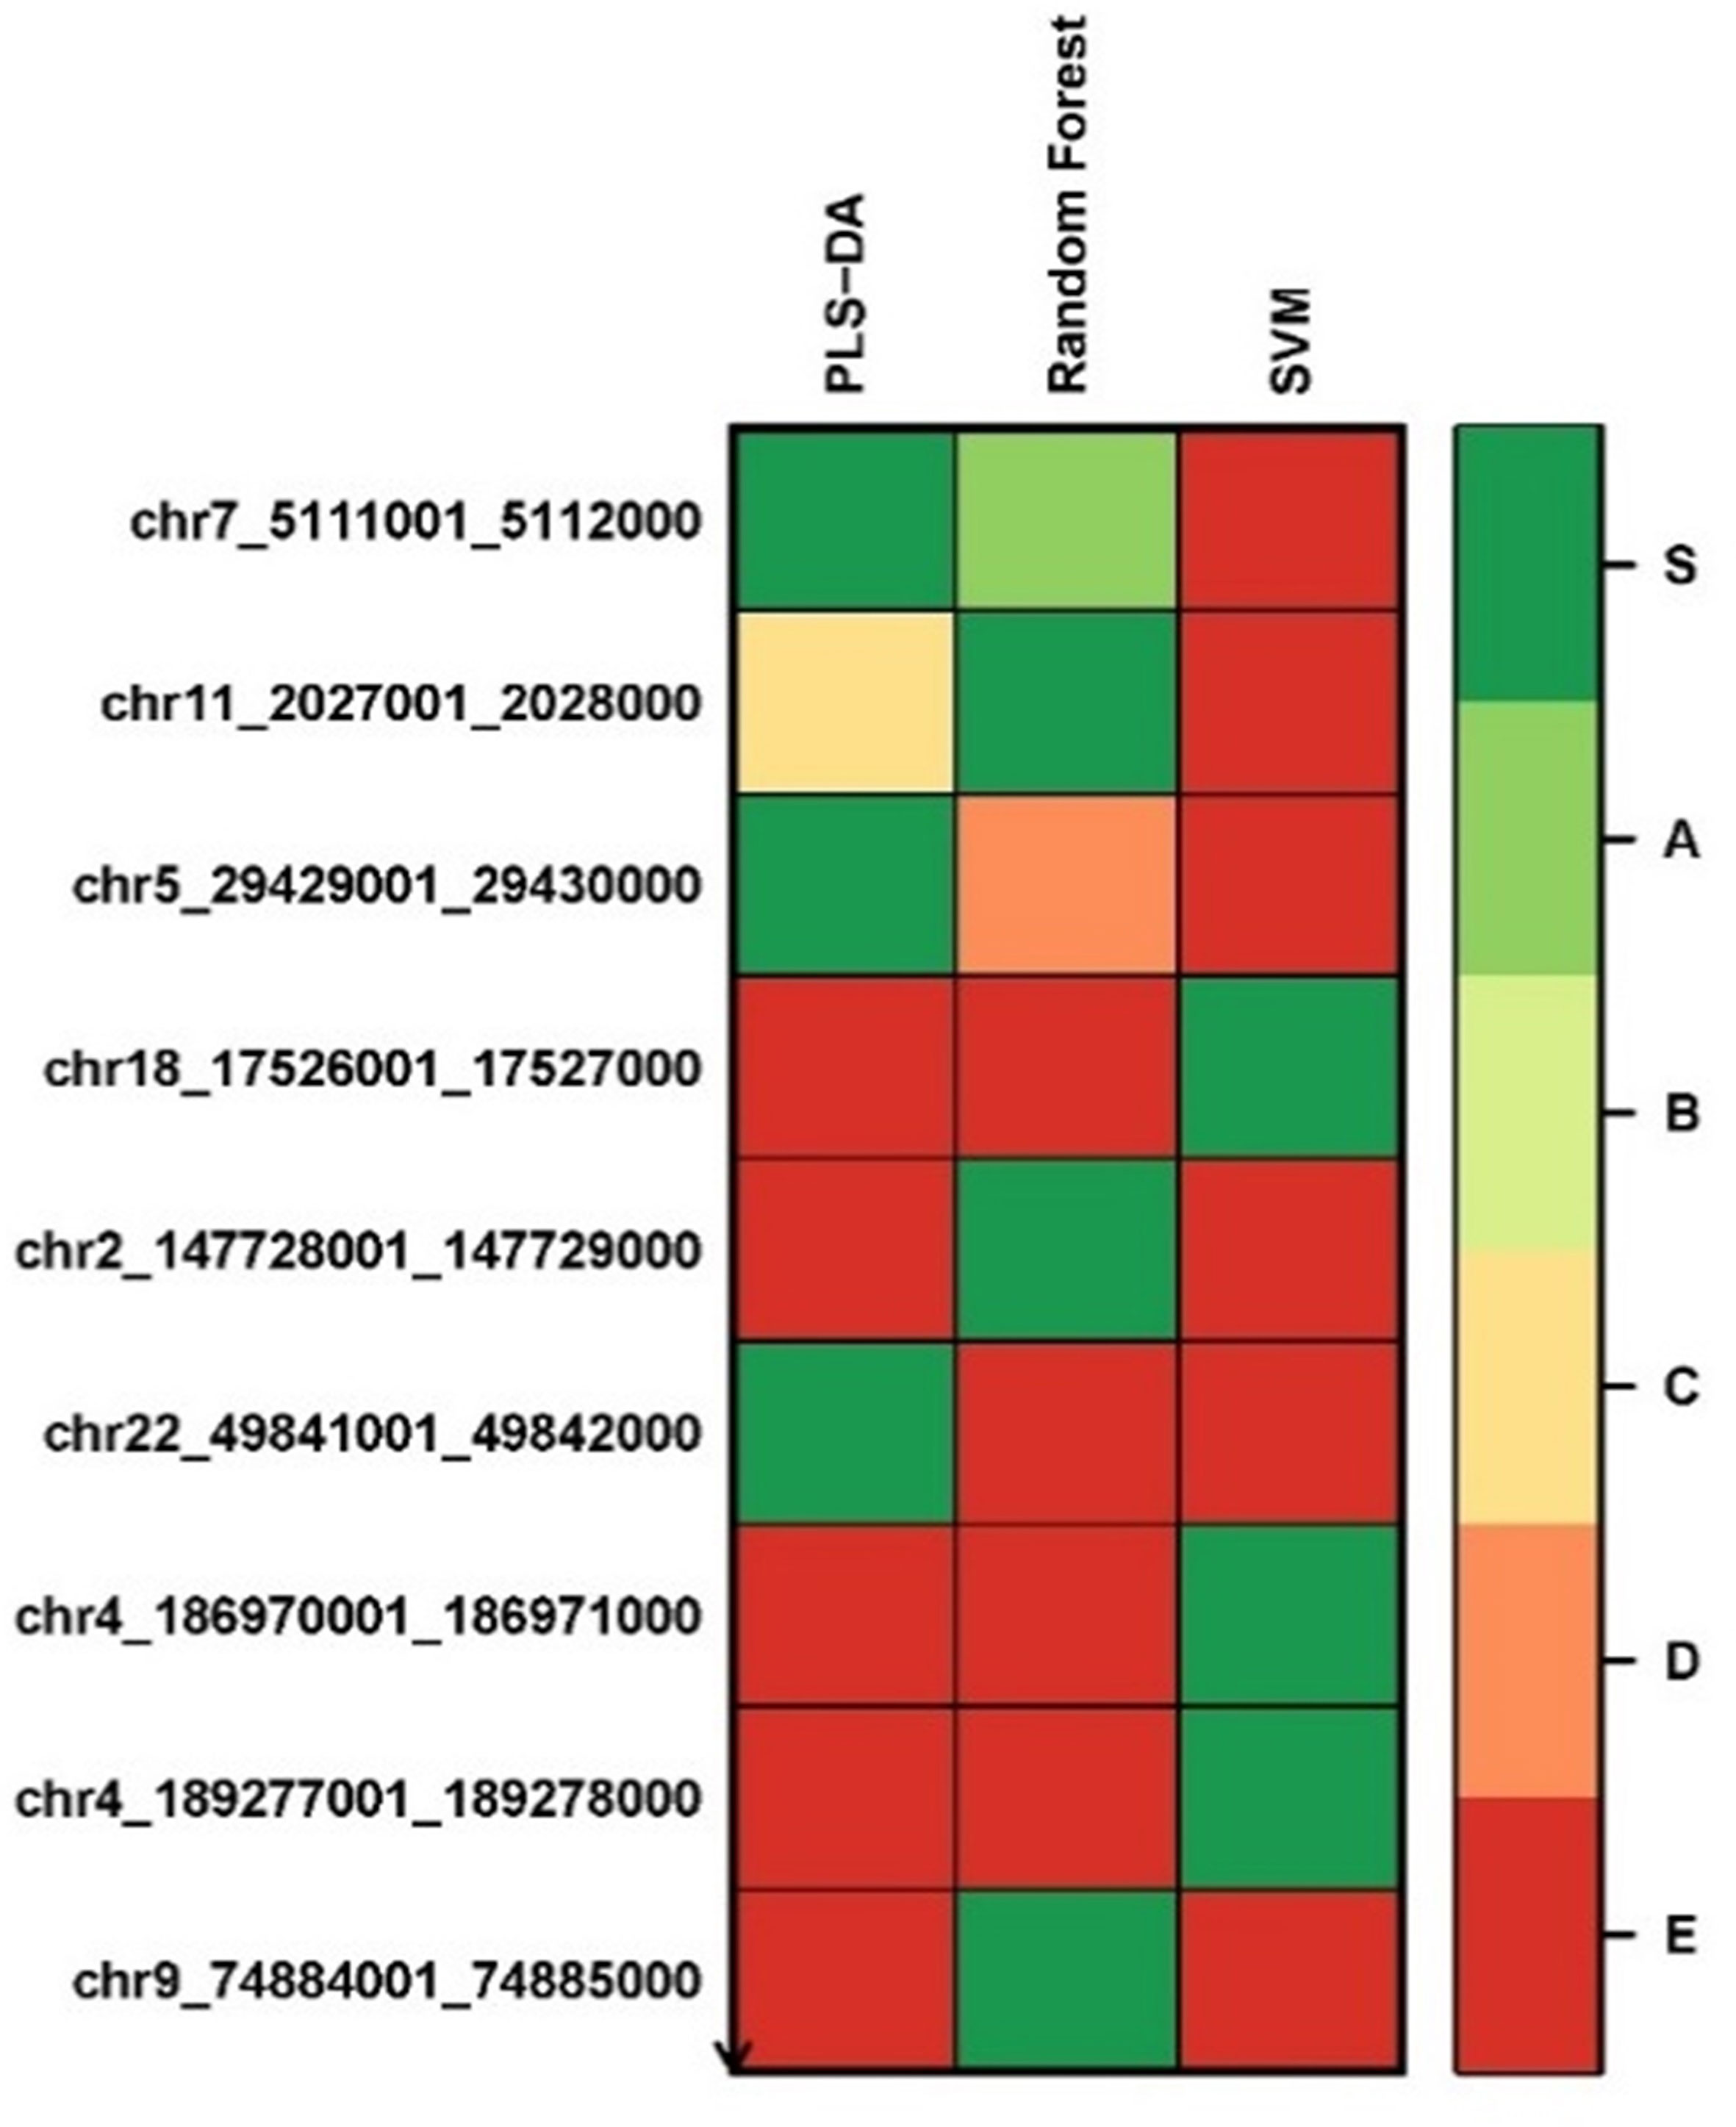
Figure 6 Methylated region tier plot from biosigner using methylomics data; S, signature genes; A–E=A is a higher tier, and E is a lower tier.
Performance Evaluation of Models Using Methylomics Data
The experimental results of the decision tree performance measures on the methylomics dataset are presented in Table 8. When the decision tree was created on three different normalized data (TMM, qNorm, and vNorm), the model tends to perform better on TMM normalization. The “TMM + Decision Tree” experiment achieved the accuracy of 40.3%, with sensitivity of 52.4%, specificity of 25.7%, and precision of 45.8%. The F1 score of the “TMM + Decision Tree” experiment is 0.489, MCC is −0.225, and AUC is 0.414. We also applied the differential analysis using GLM on the 2,577,382 methylated regions and identified 365 DMRs. When the decision tree was created using those 365 DMRs, the performance measures improved significantly on all three different normalized data. Among these experiments, both “qNorm + GLM + Decision Tree” and “vNorm + GLM + Decision Tree” experiments achieved the best performance. These experiments achieved the accuracy of 77.9%, with sensitivity of 76.2%, specificity of 80.0%, and precision of 82.1%. The F1 score of these experiments is 0.790, MCC is 0.560, and AUC is 0.721.
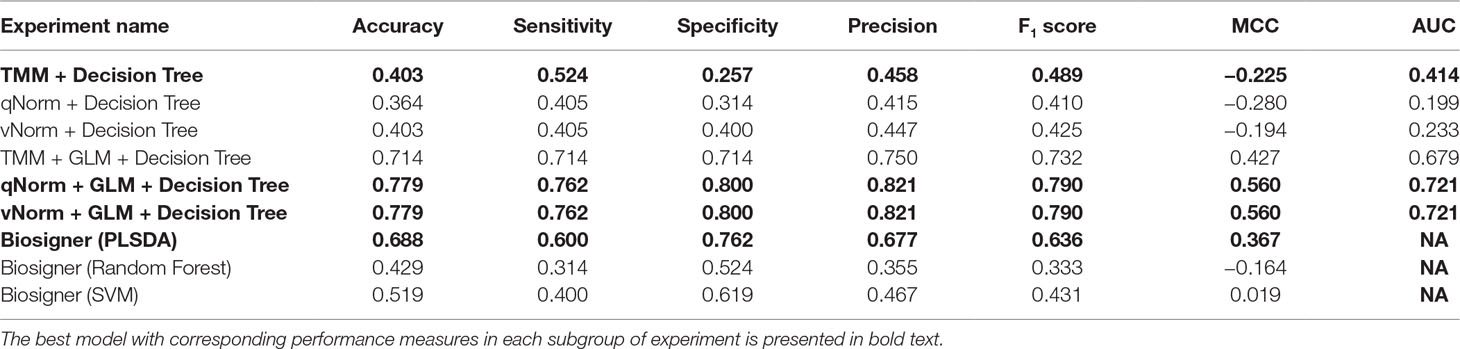
Table 8 Performance measures using methylomics data by leave-one-out cross-validation.
Table 8 presents the Biosigner performance measures that were computed using the leave-one-out cross-validation approach. The best performance was observed using the PLSDA model, with accuracy of 68.8%, sensitivity of 60.0%, specificity of 76.2%, precision of 67.7%, F1 score of 0.636%, and MCC of 0.367. The performance measures for random forest and SVM are significantly lower in comparison with those for PLSDA.
A bar chart comparison of accuracy, sensitivity, and specificity for experiments using the methylomics dataset is presented in Figure 7. The “qNorm + GLM + Decision Tree” and “vNorm + GLM + Decision Tree” experiments have a balanced accuracy, sensitivity, and specificity and outperform all of the experiments. Both the “qNorm + GLM + Decision Tree” and “vNorm + GLM + Decision Tree” experiments produced the highest accuracy, sensitivity, and specificity among all the experiments and outperformed all of the experiments by F1 score, and MCC. GLM was useful for improving the overall performance in case of decision tree application.
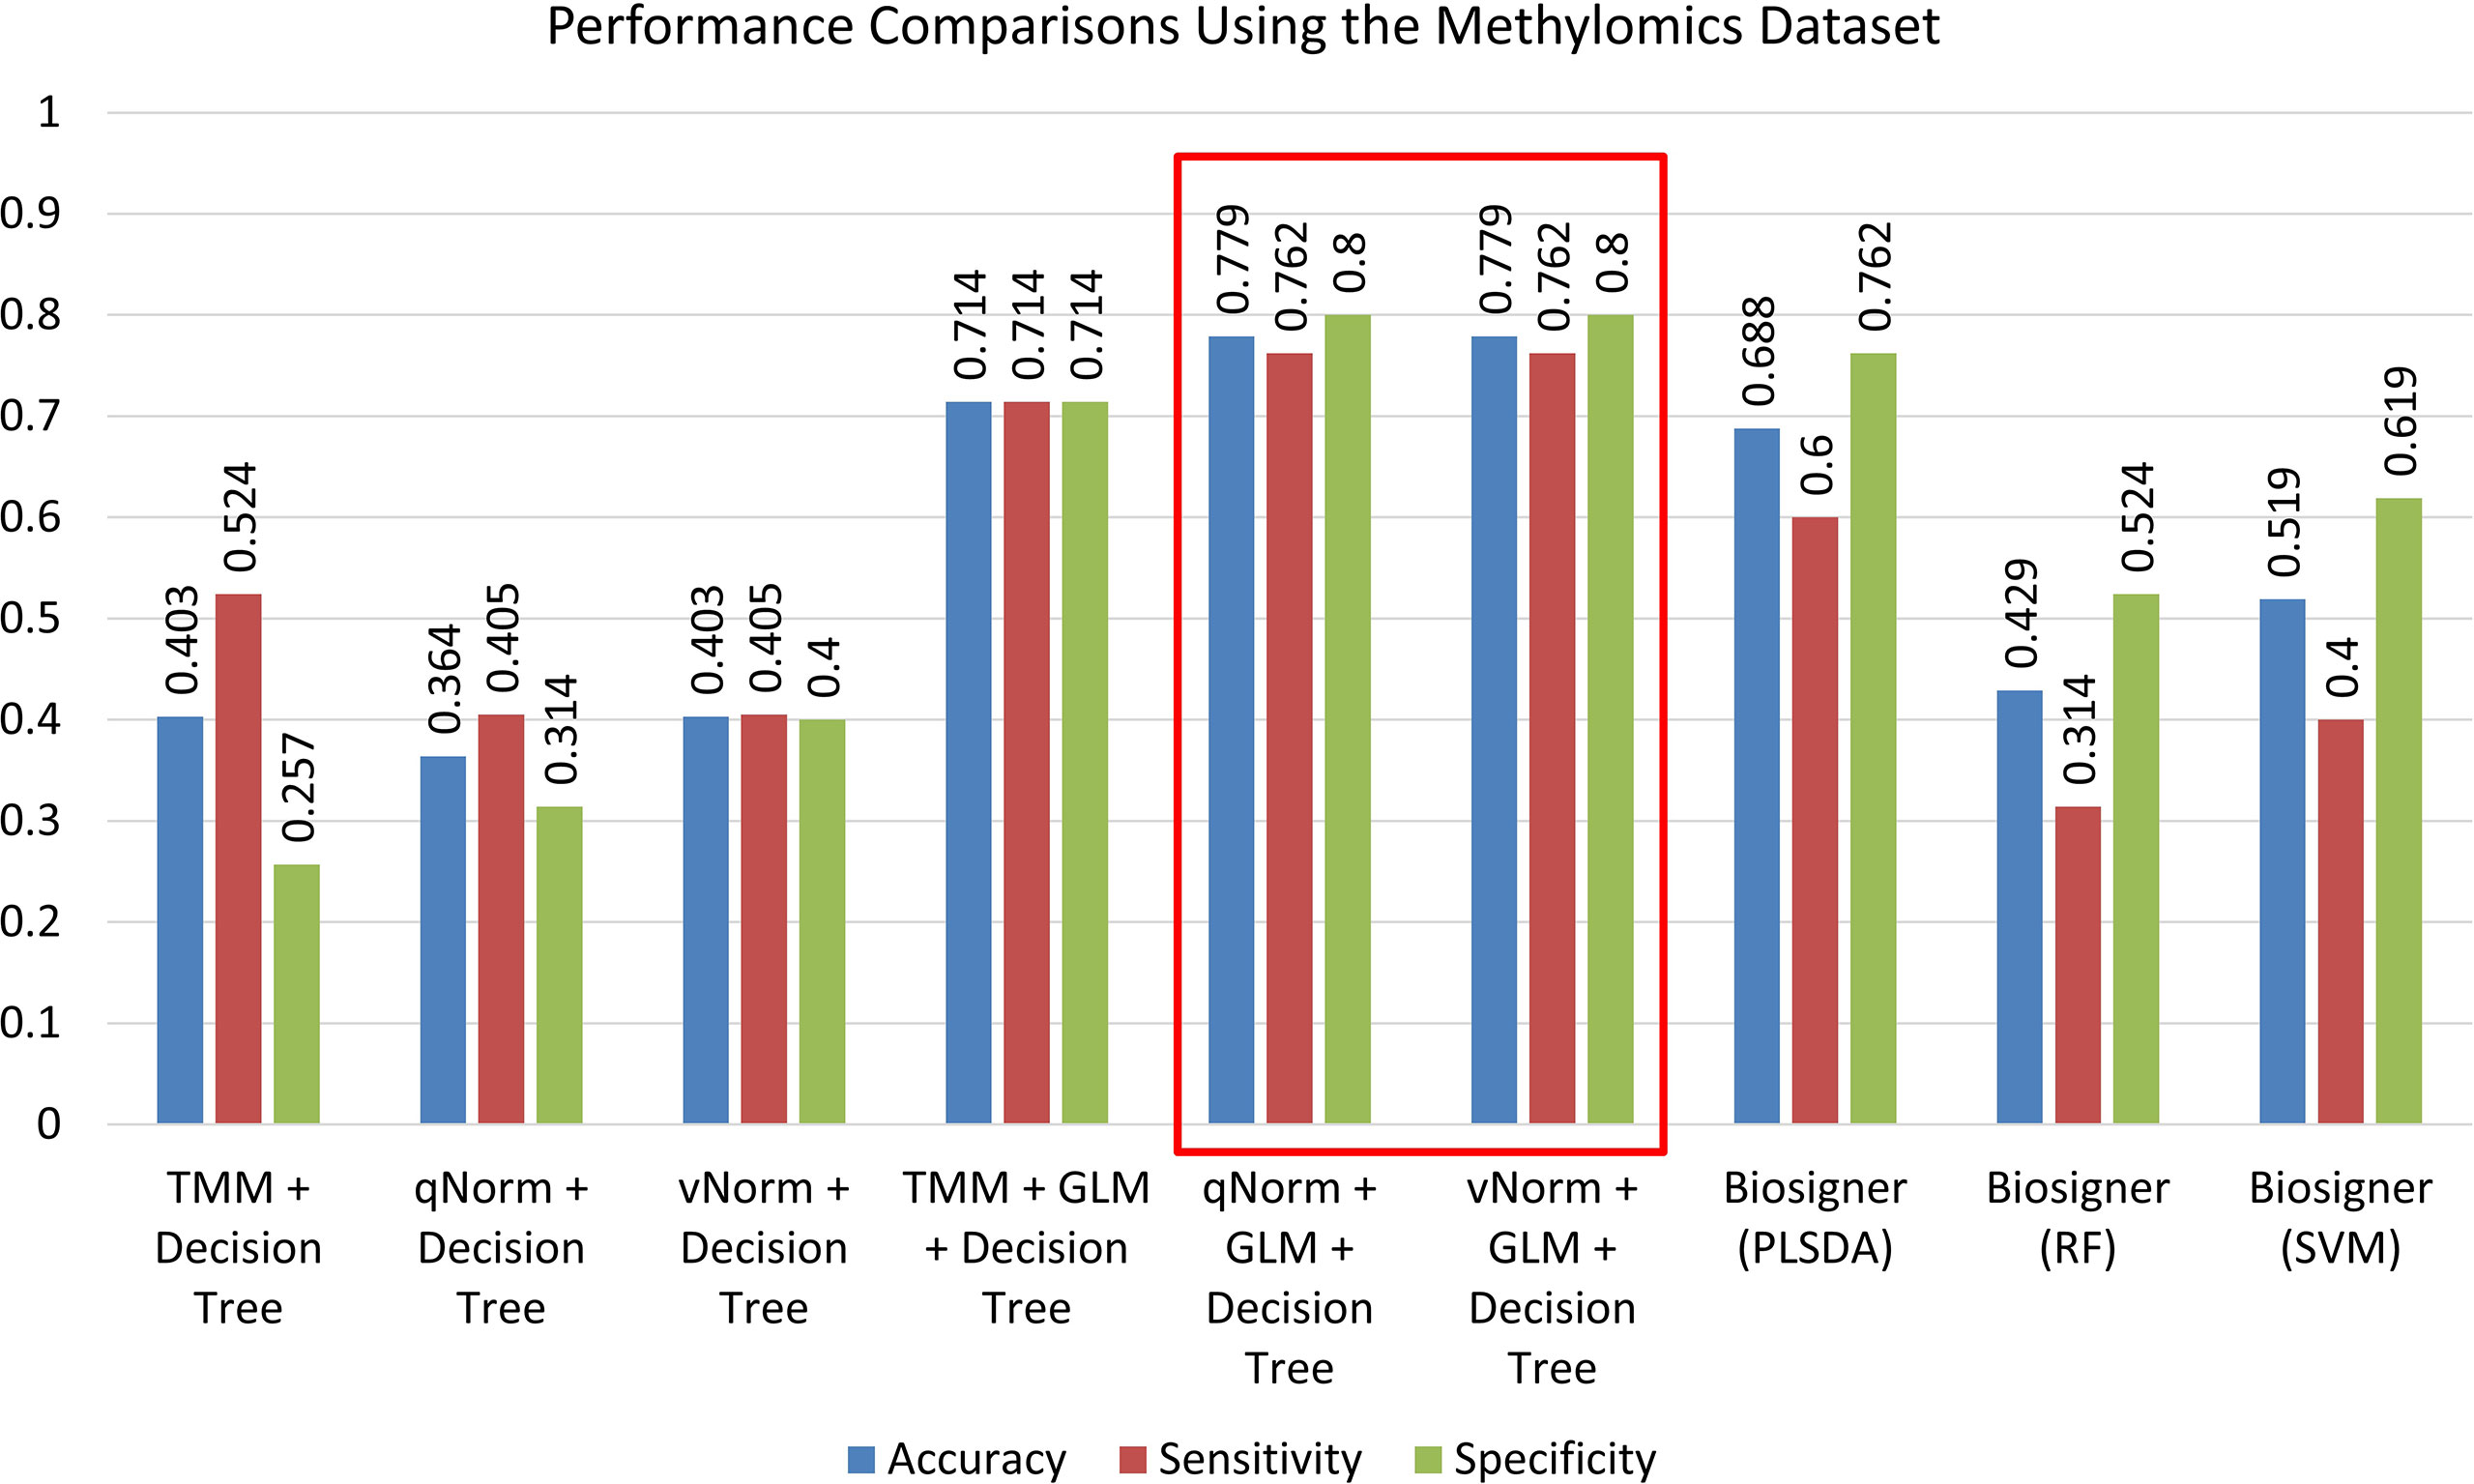
Figure 7 Performance comparisons using the methylomics dataset.
Discussion
This work achieves the aim of broadly assessing how well the supervised machine learning classifiers perform in classifying endometriosis vs. control samples using the whole genome next generation transcriptomics data and methylomics data as well as facilitate identifying candidate biomarker genes. Since the machine learning training process is a data-driven approach, we wanted to assess multiple aspects by various experiments and several important conclusions were made.
First, we evaluated three different normalization techniques. We found that the performance of machine learning classifiers varied depending on the normalization techniques, but the choice of normalization should be based on the type of dataset. For the endometriosis classification task, our experiment revealed that TMM normalization performed the best for the transcriptomics dataset, and both qNorm and vNorm performed the best for the methylomics dataset. This finding is consistent with the results demonstrated by the study on comparing normalization techniques using transcriptomics data (Lin et al., 2016).
Second, the differential analysis using the GLM is an established method for identifying the DEGs from the transcriptomics datasets and for identifying the DMRs from the methylomics datasets. We used GLM in combination with decision tree. We found that GLM was useful for improving the performance of decision tree models.
Third, candidate biomarker genes can be extracted from the machine learning models. From the transcriptomics analysis, NOTCH3 has been identified as a candidate biomarker by all of the methods, which is a protein-coding gene and found to be differentially expressed and downregulated. In all the variations of the decision tree experiments in this work, NOTCH3 was chosen as the primary differentiating criteria (root node). Recent studies recommend that NOTCH3 signaling may play a major role in oncogenesis, tumor maintenance, and resistance to chemotherapy (Aburjania et al., 2018). Prior study also reported that dysregulation and decrease in NOTCH signaling pathway are associated with endometriosis (Su et al., 2015; González-Foruria et al., 2017). NOTCH3 has also been reported as a major driver for breast cancer development (Braune et al., 2018). It plays an important role in maintaining the tumor phenotype in pancreatic ductal adenocarcinoma (PDAC) (Song et al., 2018), lung carcinogenesis (Su et al., 2018), and endometrial carcinoma (Mitsuhashi et al., 2012). Also, from the transcriptomics data analysis, SNAPC2 was identified by the decision tree and Biosigner experiments. A recent genome-wide methylation study proposes SNAPC2 as a biomarker for glioblastoma prediction (Ma et al., 2015). Other candidate biomarker genes are also reported to be associated with endometriosis and/or different types of cancers. Another study identified B4GALNT1 to be related to endometrial cancer (Trimarchi et al., 2017). GTF3C5 has been reported as differently expressed between endometrioid endometrial cancer and non-endometrioid endometrial cancer. TMEM106B was found upregulated in ectopic versus eutopic endometrium of women with endometriosis (Meola et al., 2010). MFAP2 stimulates epithelial–mesenchymal transition in gastric cancer cells by activating TGFβ signaling pathway that supports survival and metastasis of endometrial cancer cells (Lei et al., 2009). MFAP2 is also related to human endometrial receptivity (Díaz-Gimeno et al., 2011) and has been defined as biochemical pregnancy biomarkers (Fung et al., 2018). Other study found MFAP2 as differentially expressed in severe vs. mild endometriosis (Fung et al., 2018). SMAP2 was reported to be involved in microsatellite instability oncogenesis (Sangar et al., 2014). A recent study reported that overexpressed PTOV1 plays a major role in tumorigenesis and progression of esophageal cancer (Li et al., 2017) and in prostate cancer (Benedit et al., 2001). ZNF865 coordinates the functionality of cancer networks (Ghanat Bari et al., 2017). DDB2 enhances tumorigenesis and different types of cancers (Romieu-Mourez et al., 2001; Barakat et al., 2010; Meola et al., 2010; Han et al., 2014). ILDR1 was identified as a diagnostic marker for cancer progression (Hauge et al., 2004). Further details of these genes are provided in the Supplementary Table 2.
From the methylomics analysis, two genes (e.g., TRPM6 and RP3-522J7.6) were identified by both the decision tree and Biosigner experiments. TRPM6 is known to be related to two pathways (e.g., CREB Pathway and Ion channel transport) and associated with a disease named Hypomagnesemia. GO annotations of TRPM6 include protein serine/threonine kinase activity and calcium channel activity. Serine/threonine kinase activity has been reported to be associated with endometriosis (Kao et al., 2003). RP3-522J7.6 is a lincRNA. Methylomics analysis also revealed some other clinically significant genes. RASSF2 is a tumor suppressor gene and was proposed as a novel methylation marker for screening several cancers (Cooper et al., 2008). RASSF2 has been reported to be associated with ovarian endometriosis (Ren et al., 2014). The GO annotations related to TNIP2 includes protein kinase binding and polyubiquitin modification-dependent protein binding. TNIP2 is a hub protein in the NF-κB network (Banks et al., 2016), and NF-kB has an important role in the pathophysiology of endometriosis (Kaponis et al., 2012). FGD3 was reported to be associated with six distinct breast cancer cohorts and four TCGA cancer cohorts and was proposed as an important clinical biomarker for cancers (Willis et al., 2017). MFSD14B is known as neuronal and affected by nutrient availability (Lekholm et al., 2017), and GO annotations include transporter activity. Three of the RAS-association domain family members (RASSF2, RASSF3, and RASSF5) were involved in the network analysis (Figure 5) using all methylomics decision tree models, which are known as tumor suppressor genes and epigenetically inactivated in different tumor types. RASSF2 was reported to be associated with ovarian endometriosis, breast cancer, gastric cancer, and childhood acute lymphoblastic leukemia (Ren et al., 2014; Perez-Janices et al., 2015; Aydin et al., 2016; Singh et al., 2016) and has been proposed as a novel methylation marker for screening several cancers (Cooper et al., 2008). RASSF3 is an oncogene and mutated in nearly one third of all human cancers. Somatic mutations and other genomic abnormalities were also found in patients with endometriosis that are associated in cancer development. PTEN is a tumor suppressor gene and mostly occurs in endometrial and ovarian cancers. Somatic mutations in the PTEN gene were identified in 20% ovarian endometrioid carcinomas, 8.3% clear cell carcinomas, and 20.6% solitary endometrial cysts (Sato et al., 2000). KRAS plays a role in promoting oncogenic events in colorectal cancer. Mutations in the KRAS gene were found in patients with endometriosis (Vestergaard et al., 2011; Anglesio et al., 2017). MAP3K8 activation is critically involved in both inflammation and oncogenetic events (Vougioukalaki et al., 2011; Lee et al., 2015). MAP3K8 was identified as an oncogene in endometrial cancer, breast cancer, colon cancer, renal cancer, gastric cancer, and nasopharyngeal carcinoma (Lee et al., 2015), but it is a tumor suppressor gene in lung and intestinal cancers (Gkirtzimanaki et al., 2013; Zhang et al., 2016) as well. MAP3K8 was found upregulated in multiple tumor types and closely related to tumorigenesis (Sperger et al., 2003; D’Errico et al., 2009).
The findings of many cancer-associated genes in our study were surprising but not new. Though endometriosis is considered to be a benign condition, some of the characteristics of endometriosis are similar to cancer; for example, both endometriosis and cancer can be metastatic, angiogenic, and resistant to apoptosis. In the past, several studies examined if endometriosis has any relation with cancer. Recent studies have found cancer-associated mutations in endometriotic lesions (Sato et al., 2000; Thomas and Campbell, 2000) and also in deep infiltrating endometriosis without coexisting cancer (Anglesio et al., 2017). Other studies have shown that endometrial cancer and endometriosis (both are estrogen dependent and a disease of chronic inflammation) appear to have a moderate but significant shared genetic correlation (Wenzl et al., 2003; Painter et al., 2018). A recent study, based on The National Health Insurance Research Databases in Taiwan, has claimed that there is a potential association between endometriosis and endometrial cancer. This study has reported that the endometriosis patients have higher risk for developing endometrial cancer in their later life, with an adjusted hazard ratio (aHR) of 2.83 [95% confidence interval (CI) = 1.49 to 5.35], and for older women (age >40) diagnosed with endometriosis, the ratio was higher (aHR = 7.08, 95% CI = 2.33 to 21.55) (Yu et al., 2015). Another study has identified that 85% of atypical endometriosis lesions have a cancer-like immunological gene signature (Edwards et al., 2015). It has been reported that endometriosis is associated with ovarian cancer (Jimbo et al., 1997) and has a fourfold increased risk of developing the ovarian cancer (Kok et al., 2015). Also, there is a shared genetic risks between endometriosis and epithelial ovarian cancer (Lu et al., 2015). There is a significant risk of developing breast cancer in patients with endometriosis (Schairer et al., 1997; Chuang et al., 2015). The overall cancer risk has been found higher, with a standardized incidence ratio (SIR) of 1.2 (95% CI 1.1 to 1.3) in a study on 20,686 endometriosis patients who were hospitalized during the period 1969 to 1983 in Sweden. The SIR was 1.3 (95% CI 1.1 to 1.4) for breast cancer, 1.9 for ovarian cancer (95% CI 1.3 to 2.8), and 1.4 (95% CI 1.0 to 1.8) for hematopoietic malignancies (Brinton et al., 1997). Another study, based on 63,630 women with endometriosis, has found that endometriosis patients has an increased risk for several malignancies. The SIR for endocrine tumors was 1.38, ovarian cancer was 1.37, renal cancer was 1.36, thyroid cancer was 1.33, brain tumors was 1.27, malignant melanoma was 1.23, and breast cancer was 1.08 (Melin et al., 2007). Endometriosis has been found to be associated with an increased overall risk of skin cancer, with a hazard ratio (HR) of 1.28 (95% CI 1.05 to 1.55) and melanoma risk with HR 1.64 (95% CI 1.15 to 2.35) (Farland et al., 2017).
Fifth, machine learning classifiers can be trained for creating highly accurate models for classifying endometriosis with high sensitivity and specificity thus creating the opportunity for precision medicine application for endometriosis. The diagnostic latency of endometriosis is very high, with an average delay of 4–11 years mainly because of complexity in diagnosis techniques. The machine learning models in this study achieved a high F1 score (0.867) for the transcriptomics dataset and a high F1 score (0.79) for the methylomics dataset. The current diagnostic process is highly invasive in nature, but we anticipate a future where a minimally invasive endometrial biopsy with a machine learning predictive diagnostic model as demonstrated in this study can be used for diagnosing endometriosis. In recent years, we have seen the success of deep learning in various domains including bioinformatics such as described in a review article (Li et al., 2019). Another study demonstrated the application of deep learning for mutation map analysis (Umarov et al., 2019). A future extension of this study could be to apply the deep learning techniques for classifying endometriosis and demonstrate a process for interpretation of the models for biomarker detection.
Finally, we found that the type of whole genome sequencing data has an impact on the predictive performance. Transcriptomic dataset achieved higher accuracy in comparison with the methylomics dataset. An interesting investigation would be to develop an integrative classification model by integrating both transcriptomes and methylomics data to train a single model and measure the predictive performance. This aim is supported by our rationale that an integrative multi-omics approach may increase predictive performance thus providing a highly accurate predictive diagnostic model. Further study is needed for investigating such hypothesis.
In summary, this study demonstrated that a supervised machine learning method leveraging transcriptomics or methylomics data is a reliable approach for classifying endometriosis. We concluded that an appropriate machine learning diagnostic pipeline for endometriosis should use a) either transcriptomics or methylomics data, b) TMM normalization for the transcriptomics data, or qNorm or vNorm for the methylomics data, and c) GLM for feature space reduction and classification performance maximization. The conclusion was made based on the use case of endometriosis classification in this study. Further study is needed to generalize the results across multiple disease classification cases as well as using publicly available data on multiple populations.
Data Availability
The datasets GENERATED for this study can be found in the gene Expression Omnibus, https://www.ncbi.nlm.nih.gov/geo/query/acc.cgi?acc=GSE134052; https://www.ncbi.nlm.nih.gov/geo/query/acc.cgi?acc=GSE134056
Ethics Statement
The protocol was approved by the University of Missouri Institutional Review Board. The physician obtained informed consent following the IRB protocol. All subjects gave informed consent in accordance with the Declaration of Helsinki.
Author Contributions
SA, TJ, DX, and SN contributed in the conception and design of the study; SN, TJ, JB, KP, and GW contributed in the acquisition of the samples and data. SA organized and preprocessed the data, performed the machine learning analysis, and wrote the first draft of the manuscript. All authors contributed to the manuscript revision and read and approved the submitted version.
Funding
This work was supported by NIEHS R21 ES020039, University of Missouri Institute for Clinical and Translational Science, NIH/National Center for Advancing Translational Sciences (NCATS) grant UL1TR002345, and University of Missouri Research Council Grant.
Conflict of Interest Statement
The authors declare that the research was conducted in the absence of any commercial or financial relationships that could be construed as a potential conflict of interest.
Acknowledgments
The biological samples were collected in collaboration with the Women’s and Children’s Hospital, University of Missouri, Boone Hospital, Columbia, MO, and University of California, San Francisco. Some tissue samples were provided by the NIH SCCPIR Human Endometrial Tissue Bank and DNA Bank at UCSF, funded under NIH HD055764-06. We are thankful to Stacy Syrcle, Sarah Crowder, Danny J. Schust, and Breton Barrier for their help with sample collection.
An earlier work evaluated the performance of classification models using transcriptomics data (Akter et al., 2018) that was published in 2018 IEEE International Conference on Bioinformatics and Biomedicine (BIBM).
Supplementary Material
The Supplementary Material for this article can be found online at: https://www.frontiersin.org/articles/10.3389/fgene.2019.00766/full#supplementary-material
References
Aburjania, Z., Jang, S., Whitt, J., Jaskula-Stzul, R., Chen, H., Rose, J. B. (2018). The role of notch3 in cancer. Oncologist 23, 900–911. doi: 10.1634/theoncologist.2017-0677
Agarwal, S. K., Chapron, C., Giudice, L. C., Laufer, M. R., Leyland, N., Missmer, S. A., et al. (2019). Clinical diagnosis of endometriosis: a call to action. Am. J. Obstet. Gynecol. 220, 354.e1–354.e12. doi: 10.1016/j.ajog.2018.12.039
Akter, S., Xu, D., Nagel, S. C., Joshi, T. (2018). A data mining approach for biomarker discovery using transcriptomics in endometriosis in 2018 IEEE International Conference on Bioinformatics and Biomedicine (BIBM) (Madrid Spain) (IEEE), 969–972. doi: 10.1109/BIBM.2018.8621150
Anders, S., Pyl, P. T., Huber, W.HTSeq–a Python framework to work with high-throughput sequencing data. Bioinformatics.15;31(2), 166–169. doi: 10.1093/bioinformatics/btu638
Andrews, S. FastQC: a quality control tool for high throughput sequence data. Available at: http://www.bioinformatics.babraham.ac.uk/projects/fastqc/ [Accessed September 7, 2017].
Anglesio, M. S., Papadopoulos, N., Ayhan, A., Nazeran, T. M., Noë, M., Horlings, H. M., et al. (2017). Cancer-associated mutations in endometriosis without cancer. N. Engl. J. Med. 376, 1835–1848. doi: 10.1056/NEJMoa1614814
Aydin, D., Bilici, A., Kayahan, S., Yavuzer, D., Basar, M., Aliustaoglu, M. (2016). Prognostic importance of RASSF2 expression in patients with gastric cancer who had undergone radical gastrectomy. Clin. Transl. Oncol. 18, 608–616. doi: 10.1007/s12094-015-1405-9
Banks, C. A. S., Boanca, G., Lee, Z. T., Eubanks, C. G., Hattem, G. L., Peak, A., et al. (2016). TNIP2 is a hub protein in the NF-κB network with both protein and RNA mediated interactions. Mol. Cell. Proteomics 15, 3435–3449. doi: 10.1074/mcp.M116.060509
Barakat, B. M., Wang, Q.-E., Han, C., Milum, K., Yin, D.-T., Zhao, Q., et al. (2010). Overexpression of DDB2 enhances the sensitivity of human ovarian cancer cells to cisplatin by augmenting cellular apoptosis. Int. J. Cancer 127, 977–988. doi: 10.1002/ijc.25112
Barker, M., Rayens, W. (2003). Partial least squares for discrimination. J. Chemom. 17, 166–173. doi: 10.1002/cem.785
Benedit, P., Paciucci, R., Thomson, T. M., Valeri, M., Nadal, M., Càceres, C., et al. (2001). PTOV1, a novel protein overexpressed in prostate cancer containing a new class of protein homology blocks. Oncogene 20, 1455–1464. doi: 10.1038/sj.onc.1204233
Benjamini, Y., Hochberg, Y. (1995). Controlling the false discovery rate: a practical and powerful approach to multiple testing. J. R. Stat. Soc. Ser. B 57, 289–300. doi: 10.1111/j.2517-6161.1995.tb02031.x
Bhasin, M., Zhang, H., Reinherz, E. L., Reche, P. A. (2005). Prediction of methylated CpGs in DNA sequences using a support vector machine. FEBS Lett. 579, 4302–4308. doi: 10.1016/j.febslet.2005.07.002
Bock, C. (2012). Analysing and interpreting DNA methylation data. Nat. Rev. Genet. 13, 705–719. doi: 10.1038/nrg3273
Bolstad, B. M., Irizarry, R. A., Astrand, M., Speed, T. P. (2003). A comparison of normalization methods for high density oligonucleotide array data based on variance and bias. Bioinformatics 19, 185–193. doi: 10.1093/bioinformatics/19.2.185
Boser, B. E., Guyon, I. M., Vapnik, V. N. (1992). “A training algorithm for optimal margin classifiers,” in Proceedings of the fifth annual workshop on Computational learning theory - COLT ‘92 (New York, New York, USA: ACM Press), 144–152. doi: 10.1145/130385.130401
Braune, E.-B., Seshire, A., Lendahl, U. (2018). Notch and Wnt dysregulation and its relevance for breast cancer and tumor initiation. Biomedicines 6, 101. doi: 10.3390/biomedicines6040101
Breiman, L., Friedman, J. H., Olshen, R. A., Stone, C. J. (1984). Classification and Regression Trees. Wadsworth: Wadsworth International Group.
Brinton, L. A., Gridley, G., Persson, I., Baron, J., Bergqvist, A. (1997). Cancer risk after a hospital discharge diagnosis of endometriosis. Am. J. Obstet. Gynecol. 176, 572–579. doi: 10.1016/S0002-9378(97)70550-7
Burkett, D., Horwitz, J., Kennedy, V., Murphy, D., Graziano, S., Kenton, K. (2011). Assessing current trends in resident hysterectomy training. Female Pelvic Med. Reconstr. Surg. 17, 210–214. doi: 10.1097/SPV.0b013e3182309a22
Byron, S. A., Van Keuren-Jensen, K. R., Engelthaler, D. M., Carpten, J. D., Craig, D. W. (2016). Translating RNA sequencing into clinical diagnostics: opportunities and challenges. Nat. Rev. Genet. 17, 257–271. doi: 10.1038/nrg.2016.10
Cai, Z., Xu, D., Zhang, Q., Zhang, J., Ngai, S.-M., Shao, J. (2015). Classification of lung cancer using ensemble-based feature selection and machine learning methods. Mol. Biosyst. 11, 791–800. doi: 10.1039/C4MB00659C
Chuang, S.-C., Wu, G.-J., Lu, Y.-S., Lin, C.-H., Hsiung, C. A. (2015). Associations between medical conditions and breast cancer risk in asians: a nationwide population-based study in Taiwan. PLoS One 10, e0143410. doi: 10.1371/journal.pone.0143410
Cooper, W. N., Dickinson, R. E., Dallol, A., Grigorieva, E. V., Pavlova, T. V., Hesson, L. B., et al. (2008). Epigenetic regulation of the ras effector/tumour suppressor RASSF2 in breast and lung cancer. Oncogene 27, 1805–1811. doi: 10.1038/sj.onc.1210805
D’Errico, M., de Rinaldis, E., Blasi, M. F., Viti, V., Falchetti, M., Calcagnile, A., et al. (2009). Genome-wide expression profile of sporadic gastric cancers with microsatellite instability. Eur. J. Cancer 45, 461–469. doi: 10.1016/j.ejca.2008.10.032
Data Mining Tools See5 and C5.0. Available at: http://www.rulequest.com/see5-info.html [Accessed November 21, 2015].
David Adamson, G., Kennedy, S., Hummelshoj, L. (2010). Creating solutions in endometriosis: global collaboration through the World Endometriosis Research Foundation. J. Endometr. 2, 3–6. doi: 10.1177/228402651000200102
Díaz-Gimeno, P., Horcajadas, J. A., Martínez-Conejero, J. A., Esteban, F. J., Alamá, P., Pellicer, A., et al. (2011). A genomic diagnostic tool for human endometrial receptivity based on the transcriptomic signature. Fertil. Steril. 95, 50–60, 60.e1–15. doi: 10.1016/j.fertnstert.2010.04.063
Edwards, R. P., Huang, X., Vlad, A. M. (2015). Chronic inflammation in endometriosis and endometriosis-associated ovarian cancer: new roles for the “old” complement pathway. Oncoimmunology 4, e1002732. doi: 10.1080/2162402X.2014.1002732
Eyster, K. M., Klinkova, O., Kennedy, V., Hansen, K. A. (2007). Whole genome deoxyribonucleic acid microarray analysis of gene expression in ectopic versus eutopic endometrium. Fertil. Steril. 88, 1505–1533. doi: 10.1016/j.fertnstert.2007.01.056
Farland, L. V., Lorrain, S., Missmer, S. A., Dartois, L., Cervenka, I., Savoye, I., et al. (2017). Endometriosis and the risk of skin cancer: a prospective cohort study. Cancer Causes Control 28, 1011–1019. doi: 10.1007/s10552-017-0939-2
Fung, J. N., Mortlock, S., Girling, J. E., Holdsworth-Carson, S. J., Teh, W. T., Zhu, Z., et al. (2018). Genetic regulation of disease risk and endometrial gene expression highlights potential target genes for endometriosis and polycystic ovarian syndrome. Sci. Rep. 8, 11424. doi: 10.1038/s41598-018-29462-y
Ghanat Bari, M., Ung, C. Y., Zhang, C., Zhu, S., Li, H. (2017). Machine learning-assisted network inference approach to identify a new class of genes that coordinate the functionality of cancer networks. Sci. Rep. 7, 6993. doi: 10.1038/s41598-017-07481-5
Gkirtzimanaki, K., Gkouskou, K. K., Oleksiewicz, U., Nikolaidis, G., Vyrla, D., Liontos, M., et al. (2013). TPL2 kinase is a suppressor of lung carcinogenesis. Proc. Natl. Acad. Sci. U. S. A. 110, E1470–E1479. doi: 10.1073/pnas.1215938110
González-Foruria, I., Santulli, P., Chouzenoux, S., Carmona, F., Chapron, C., Batteux, F. (2017). Dysregulation of the ADAM17/Notch signalling pathways in endometriosis: from oxidative stress to fibrosis. MHR Basic Sci. Reprod. Med. 23, 488–499. doi: 10.1093/molehr/gax028
Halme, J., Hammond, M. G., Hulka, J. F., Raj, S. G., Talbert, L. M. (1984). Retrograde menstruation in healthy women and in patients with endometriosis. Obstet. Gynecol. 64, 151–154.
Han, C., Zhao, R., Liu, X., Srivastava, A. K., Gong, L., Mao, H., et al. (2014). Loss of DDB2 enhances the tumorigenicity of ovarian cancer cells through expanding cancer stem-like cell population. Cancer Res. 74, 3874–3874. doi: 10.1158/1538-7445.AM2014-3874
Hauge, H., Patzke, S., Delabie, J., Aasheim, H.-C. (2004). Characterization of a novel immunoglobulin-like domain containing receptor. Biochem. Biophys. Res. Commun. 323, 970–978. doi: 10.1016/j.bbrc.2004.08.188
Jimbo, H., Yoshikawa, H., Onda, T., Yasugi, T., Sakamoto, A., Taketani, Y. (1997). Prevalence of ovarian endometriosis in epithelial ovarian cancer. Int. J. Gynaecol. Obstet. 59, 245–250. doi: 10.1016/S0020-7292(97)00238-5
Johnson, N. T., Dhroso, A., Hughes, K. J., Korkin, D. (2018). Biological classification with RNA-seq data: can alternatively spliced transcript expression enhance machine learning classifiers? RNA 24, 1119–1132. doi: 10.1261/rna.062802.117
Kao, L. C., Germeyer, A., Tulac, S., Lobo, S., Yang, J. P., Taylor, R. N., et al. (2003). Expression profiling of endometrium from women with endometriosis reveals candidate genes for disease-based implantation failure and infertility. Endocrinology 144, 2870–2881. doi: 10.1210/en.2003-0043
Kaponis, A., Iwabe, T., Taniguchi, F., Ito, M., Deura, I., Decavalas, G., et al. (2012). The role of NF-kappaB in endometriosis. Front. Biosci. (Schol. Ed). 4, 1213–1234. doi: 10.2741/s327
Kok, V. C., Tsai, H.-J., Su, C.-F., Lee, C.-K. (2015). The risks for ovarian, endometrial, breast, colorectal, and other cancers in women with newly diagnosed endometriosis or adenomyosis: a population-based study. Int. J. Gynecol. Cancer 25, 968–976. doi: 10.1097/IGC.0000000000000454
Langmead, B., Trapnell, C., Pop, M., Salzberg, S. L. (2009). Ultrafast and memory-efficient alignment of short DNA sequences to the human genome. Genome Biol. 10, R25. doi: 10.1186/gb-2009-10-3-r25
Lee, B., Du, H., Taylor, H. S. (2009). Experimental murine endometriosis induces DNA methylation and altered gene expression in eutopic endometrium. Biol. Reprod. 80, 79–85. doi: 10.1095/biolreprod.108.070391
Lee, H. W., Choi, H. Y., Joo, K. M., Nam, D.-H. (2015). Tumor progression locus 2 (Tpl2) kinase as a novel therapeutic target for cancer: double-sided effects of Tpl2 on cancer. Int. J. Mol. Sci. 16, 4471–4491. doi: 10.3390/ijms16034471
Lei, X., Wang, L., Yang, J., Sun, L.-Z. (2009). TGFbeta signaling supports survival and metastasis of endometrial cancer cells. Cancer Manag. Res. 2009, 15–24. doi: 10.2147/CMAR.S4545
Lekholm, E., Perland, E., Eriksson, M. M., Hellsten, S. V., Lindberg, F. A., Rostami, J., et al. (2017). Putative membrane-bound transporters MFSD14A and MFSD14B are neuronal and affected by nutrient availability. Front. Mol. Neurosci. 10, 11. doi: 10.3389/fnmol.2017.00011
Li, H., Handsaker, B., Wysoker, A., Fennell, T., Ruan, J., Homer, N., et al. (2009). The sequence alignment/map format and SAMtools. Bioinformatics 25, 2078–2079. doi: 10.1093/bioinformatics/btp352
Li, R., Leng, A., Liu, X., Hu, T., Zhang, L., Li, M., et al. (2017). Overexpressed PTOV1 associates with tumorigenesis and progression of esophageal squamous cell carcinoma. Tumour Biol. 39, 1010428317705013. doi: 10.1177/1010428317705013
Li, Y., Huang, C., Ding, L., Li, Z., Pan, Y., Gao, X. (2019). Deep learning in bioinformatics: introduction, application, and perspective in the big data era. Methods. doi: 10.1016/j.ymeth.2019.04.008
Libbrecht, M. W., Noble, W. S. (2015). Machine learning applications in genetics and genomics. Nat. Rev. Genet. 16, 321–332. doi: 10.1038/nrg3920
Lin, Y., Golovnina, K., Chen, Z.-X., Lee, H. N., Negron, Y. L. S., Sultana, H., et al. (2016). Comparison of normalization and differential expression analyses using RNA-Seq data from 726 individual Drosophila melanogaster. BMC Genom. 17, 28. doi: 10.1186/s12864-015-2353-z
Liu, C., Che, D., Liu, X., Song, Y. (2013). Applications of machine learning in genomics and systems biology. Comput. Math. Methods Med. 2013, 587492. doi: 10.1155/2013/587492
Lu, Y., Cuellar-Partida, G., Painter, J. N., Nyholt, D. R., Australian Ovarian Cancer Study, International Endogene Consortium (IEC), et al. (2015). Shared genetics underlying epidemiological association between endometriosis and ovarian cancer. Hum. Mol. Genet. 24, 5955–5964. doi: 10.1093/hmg/ddv306
Ma, J., Hou, X., Li, M., Ren, H., Fang, S., Wang, X., et al. (2015). Genome-wide methylation profiling reveals new biomarkers for prognosis prediction of glioblastoma. J. Cancer Res. Ther. 11 Suppl 2, C212–C215. doi: 10.4103/0973-1482.168188
Martin, M. (2011). Cutadapt removes adapter sequences from high-throughput sequencing reads. EMBnet.journal 17, 10. doi: 10.14806/ej.17.1.200
Melé, M., Ferreira, P. G., Reverter, F., DeLuca, D. S., Monlong, J., Sammeth, M., et al. (2015). Human genomics. Science 348, 660–665. doi: 10.1126/science.aaa0355
Melin, A., Sparén, P., Bergqvist, A. (2007). The risk of cancer and the role of parity among women with endometriosis. Hum. Reprod. 22, 3021–3026. doi: 10.1093/humrep/dem209
Meola, J., Rosa e Silva, J. C., Dentillo, D. B., da Silva, W. A., Veiga-Castelli, L. C., de Souza Bernardes, L. A., et al. (2010). Differentially expressed genes in eutopic and ectopic endometrium of women with endometriosis. Fertil. Steril. 93, 1750–1773. doi: 10.1016/j.fertnstert.2008.12.058
Mikeska, T., Bock, C., Do, H., Dobrovic, A. (2012). DNA methylation biomarkers in cancer: progress towards clinical implementation. Expert Rev. Mol. Diagn. 12, 473–487. doi: 10.1586/erm.12.45
Mitsuhashi, Y., Horiuchi, A., Miyamoto, T., Kashima, H., Suzuki, A., Shiozawa, T. (2012). Prognostic significance of Notch signalling molecules and their involvement in the invasiveness of endometrial carcinoma cells. Histopathology 60, 826–837. doi: 10.1111/j.1365-2559.2011.04158.x
Montojo, J., Zuberi, K., Rodriguez, H., Bader, G. D., Morris, Q. (2014). GeneMANIA: fast gene network construction and function prediction for Cytoscape. F1000Research 3, 153. doi: 10.12688/f1000research.4572.1
Mudge, J. M., Frankish, A., Harrow, J. (2013). Functional transcriptomics in the post-ENCODE era. Genome Res. 23, 1961–1973. doi: 10.1101/gr.161315.113
Neelima, E., Prasad Babu, M. S. (2017). A comparative study of machine learning classifiers over gene expressions towards cardio vascular diseases prediction. Int. J. Comput. Intl. Res. 13(3), 403–424 Available at: http://www.ripublication.com [Accessed January 28, 2019].
Painter, J. N., O’Mara, T. A., Morris, A. P., Cheng, T. H. T., Gorman, M., Martin, L., et al. (2018). Genetic overlap between endometriosis and endometrial cancer: evidence from cross-disease genetic correlation and GWAS meta-analyses. Cancer Med. 7, 1978–1987. doi: 10.1002/cam4.1445
Perez-Janices, N., Blanco-Luquin, I., Torrea, N., Liechtenstein, T., Escors, D., Cordoba, A., et al. (2015). Differential involvement of RASSF2 hypermethylation in breast cancer subtypes and their prognosis. Oncotarget 6, 23944–23958. doi: 10.18632/oncotarget.4062
Picard. Available at: http://broadinstitute.github.io/picard/ [Accessed September 7, 2017].
Pirooznia, M., Yang, J. Y., Yang, M. Q., Deng, Y. (2008). A comparative study of different machine learning methods on microarray gene expression data. BMC Genomics 9 Suppl 1, S13. doi: 10.1186/1471-2164-9-S1-S13
Quinlan, J. R. (1993). C4. 5: programs for machine learning. (San Mateo, CA, U.S.A): Morgan Kaufmann.
Quinlan, J. R. R. (1986). Induction of decision trees. Mach. Learn. 1, 81–106. doi: 10.1023/A:1022643204877
Ren, F., Wang, D.-B., Li, T., Chen, Y.-H., Li, Y. (2014). Identification of differentially methylated genes in the malignant transformation of ovarian endometriosis. J. Ovarian Res. 7, 73. doi: 10.1186/1757-2215-7-73
Rinaudo, P., Boudah, S., Junot, C., Thévenot, E. A. (2016). Biosigner: a new method for the discovery of significant molecular signatures from omics data. Front. Mol. Biosci. 3, 26. doi: 10.3389/fmolb.2016.00026
Robinson, M. D., McCarthy, D. J., Smyth, G. K. (2010). edgeR: a bioconductor package for differential expression analysis of digital gene expression data. Bioinformatics 26, 139–140. doi: 10.1093/bioinformatics/btp616
Romieu-Mourez, R., Landesman-Bollag, E., Seldin, D. C., Traish, A. M., Mercurio, F., Sonenshein, G. E., et al. (2001). Roles of IKK kinases and protein kinase CK2 in activation of nuclear factor-kappaB in breast cancer. Cancer Res. 61, 3810–3818. doi: 10.1158/0008-5472.CAN-12-3655
Sangar, F., Schreurs, A.-S., Umaña-Diaz, C., Clapéron, A., Desbois-Mouthon, C., Calmel, C., et al. (2014). Involvement of small ArfGAP1 (SMAP1), a novel Arf6-specific GTPase-activating protein, in microsatellite instability oncogenesis. Oncogene 33, 2758–2767. doi: 10.1038/onc.2013.211
Sato, N., Tsunoda, H., Nishida, M., Morishita, Y., Takimoto, Y., Kubo, T., et al. (2000). Loss of heterozygosity on 10q23.3 and mutation of the tumor suppressor gene PTEN in benign endometrial cyst of the ovary: possible sequence progression from benign endometrial cyst to endometrioid carcinoma and clear cell carcinoma of the ovary. Cancer Res. 60, 7052–7056.
Schairer, C., Persson, I., Falkeborn, M., Naessen, T., Troisi, R., Brinton, L. A. (1997). Breast cancer risk associated with gynecologic surgery and indications for such surgery. Int. J. Cancer 70, 150–154. doi: 10.1002/(SICI)1097-0215(19970117)70:2<150::AID-IJC2>3.0.CO;2-W
Selçuk, I., Bozdağ, G. (2013). Recurrence of endometriosis; risk factors, mechanisms and biomarkers; review of the literature. J. Turkish Ger. Gynecol. Assoc. 14, 98–103. doi: 10.5152/jtgga.2013.52385
Shannon, P., Markiel, A., Ozier, O., Baliga, N. S., Wang, J. T., Ramage, D., et al. (2003). Cytoscape: a software environment for integrated models of biomolecular interaction networks. Genome Res. 13, 2498–2504. doi: 10.1101/gr.1239303
Simoens, S., Hummelshoj, L., D’Hooghe, T. (2007). Endometriosis: cost estimates and methodological perspective. Hum. Reprod. Update 13, 395–404. doi: 10.1093/humupd/dmm010
Singh, S. K., Lupo, P. J., Scheurer, M. E., Saxena, A., Kennedy, A. E., Ibrahimou, B., et al. (2016). A childhood acute lymphoblastic leukemia genome-wide association study identifies novel sex-specific risk variants. Medicine (Baltimore). 95, e5300. doi: 10.1097/MD.0000000000005300
Smyth, G. K. (2004). Linear models and empirical bayes methods for assessing differential expression in microarray experiments. Stat. Appl. Genet. Mol. Biol. 3, Article 3, 1–25 doi: 10.2202/1544-6115.1027
Song, H.-Y., Wang, Y., Lan, H., Zhang, Y.-X. (2018). Expression of Notch receptors and their ligands in pancreatic ductal adenocarcinoma. Exp. Ther. Med. 16, 53–60. doi: 10.3892/etm.2018.6172
Sperger, J. M., Chen, X., Draper, J. S., Antosiewicz, J. E., Chon, C. H., Jones, S. B., et al. (2003). Gene expression patterns in human embryonic stem cells and human pluripotent germ cell tumors. Proc. Natl. Acad. Sci. U. S. A. 100, 13350–13355. doi: 10.1073/pnas.2235735100
Su, R.-W., Strug, M. R., Joshi, N. R., Jeong, J.-W., Miele, L., Lessey, B. A., et al. (2015). Decreased Notch pathway signaling in the endometrium of women with endometriosis impairs decidualization. J. Clin. Endocrinol. Metab. 100, E433–E442. doi: 10.1210/jc.2014-3720
Su, T., Yang, X., Deng, J.-H., Huang, Q.-J., Huang, S.-C., Zhang, Y.-M., et al. (2018). Evodiamine, a novel NOTCH3 methylation stimulator, significantly suppresses lung carcinogenesis in vitro and in vivo. Front. Pharmacol. 9, 434. doi: 10.3389/fphar.2018.00434
Tarca, A. L., Carey, V. J., Chen, X., Romero, R., Drăghici, S. (2007). Machine learning and its applications to biology. PLoS Comput. Biol. 3, e116. doi: 10.1371/journal.pcbi.0030116
Thomas, E. J., Campbell, I. G. (2000). Molecular genetic defects in endometriosis. Gynecol. Obstet. Invest. 50 Suppl 1, 44–50. doi: 10.1159/000052878
Thompson, J. A., Tan, J., Greene, C. S. (2016). Cross-platform normalization of microarray and RNA-seq data for machine learning applications. PeerJ 4, e1621. doi: 10.7717/peerj.1621
Trapnell, C., Pachter, L., Salzberg, S. L. (2009). TopHat: discovering splice junctions with RNA-Seq. Bioinformatics 25, 1105–1111. doi: 10.1093/bioinformatics/btp120
Trimarchi, M. P., Yan, P., Groden, J., Bundschuh, R., Goodfellow, P. J. (2017). Identification of endometrial cancer methylation features using combined methylation analysis methods. PLoS One 12, e0173242. doi: 10.1371/journal.pone.0173242
Umarov, R., Kuwahara, H., Li, Y., Gao, X., Solovyev, V. (2019). Promoter analysis and prediction in the human genome using sequence-based deep learning models. Bioinformatics. doi: 10.1093/bioinformatics/bty1068
Vandesompele, J., De Preter, K., Pattyn, F., Poppe, B., Van Roy, N., De Paepe, A., et al. (2002). Accurate normalization of real-time quantitative RT-PCR data by geometric averaging of multiple internal control genes. Genome Biol. 3, RESEARCH0034, 1–0034.11 doi: 10.1186/gb-2002-3-7-research0034
Vestergaard, A. L., Thorup, K., Knudsen, U. B., Munk, T., Rosbach, H., Poulsen, J. B., et al. (2011). Oncogenic events associated with endometrial and ovarian cancers are rare in endometriosis. Mol. Hum. Reprod. 17, 758–761. doi: 10.1093/molehr/gar049
Vougioukalaki, M., Kanellis, D. C., Gkouskou, K., Eliopoulos, A. G. (2011). Tpl2 kinase signal transduction in inflammation and cancer. Cancer Lett. 304, 80–89. doi: 10.1016/j.canlet.2011.02.004
Wei, S. H., Balch, C., Paik, H. H., Kim, Y.-S., Baldwin, R. L., Liyanarachchi, S., et al. (2006). Prognostic DNA methylation biomarkers in ovarian cancer. Clin. Cancer Res. 12, 2788–2794. doi: 10.1158/1078-0432.CCR-05-1551
Wenzl, R., Kiesel, L., Huber, J. C., Wieser, F. (2003). Endometriosis: a genetic disease. Drugs Today (Barc). 39, 961–972. doi: 10.1358/dot.2003.39.12.799414
Willis, S., Sun, Y., Abramovitz, M., Fei, T., Young, B., Lin, X., et al. (2017). High expression of FGD3, a putative regulator of cell morphology and motility, is prognostic of favorable outcome in multiple cancers. JCO Precis. Oncol. 1, 1–13. doi: 10.1200/PO.17.00009
Wold, S., Sjöström, M., Eriksson, L. (2001). PLS-regression: a basic tool of chemometrics. Chemom. Intell. Lab. Syst. 58, 109–130. doi: 10.1016/S0169-7439(01)00155-1
Wu, Y., Strawn, E., Basir, Z., Halverson, G., Guo, S.-W. (2007). Aberrant expression of deoxyribonucleic acid methyltransferases DNMT1, DNMT3A, and DNMT3B in women with endometriosis. Fertil. Steril. 87, 24–32. doi: 10.1016/j.fertnstert.2006.05.077
Xue, Q., Lin, Z., Cheng, Y.-H., Huang, C.-C., Marsh, E., Yin, P., et al. (2007a). Promoter methylation regulates estrogen receptor 2 in human endometrium and endometriosis. Biol. Reprod. 77, 681–687. doi: 10.1095/biolreprod.107.061804
Xue, Q., Lin, Z., Yin, P., Milad, M. P., Cheng, Y.-H., Confino, E., et al. (2007b). Transcriptional activation of steroidogenic factor-1 by hypomethylation of the 5’ CpG island in endometriosis. J. Clin. Endocrinol. Metab. 92, 3261–3267. doi: 10.1210/jc.2007-0494
Yeung, P., Sinervo, K., Winer, W., Albee, R. B. (2011). Complete laparoscopic excision of endometriosis in teenagers: is postoperative hormonal suppression necessary? Fertil. Steril. 95, 1909–1912.e1. doi: 10.1016/j.fertnstert.2011.02.037
Yu, H.-C., Lin, C.-Y., Chang, W.-C., Shen, B.-J., Chang, W.-P., Chuang, C.-M., et al. (2015). Increased association between endometriosis and endometrial cancer: a nationwide population-based retrospective cohort study. Int. J. Gynecol. Cancer 25, 447–452. doi: 10.1097/IGC.0000000000000384
Keywords: endometriosis, machine learning, classification, methylomics, transcriptomics, DNA methylation, RNA-seq, translational bioinformatics
Citation: Akter S, Xu D, Nagel SC, Bromfield JJ, Pelch K, Wilshire GB and Joshi T (2019) Machine Learning Classifiers for Endometriosis Using Transcriptomics and Methylomics Data. Front. Genet. 10:766. doi: 10.3389/fgene.2019.00766
Received: 18 April 2019; Accepted: 19 July 2019;
Published: 04 September 2019.
Edited by:
Fengfeng Zhou, Jilin University, ChinaReviewed by:
Shravan Sukumar, Corteva Agriscience, United StatesHuiluo Cao, The University of Hong Kong, Hong Kong
Yu Li, King Abdullah University of Science and Technology, Saudi Arabia, in collaboration with reviewer HC
Copyright © 2019 Akter, Xu, Nagel, Bromfield, Pelch, Wilshire and Joshi. This is an open-access article distributed under the terms of the Creative Commons Attribution License (CC BY). The use, distribution or reproduction in other forums is permitted, provided the original author(s) and the copyright owner(s) are credited and that the original publication in this journal is cited, in accordance with accepted academic practice. No use, distribution or reproduction is permitted which does not comply with these terms.
*Correspondence: Trupti Joshi, am9zaGl0ckBoZWFsdGgubWlzc291cmkuZWR1
†Present Address: John Bromfield, Department of Animal Sciences, University of Florida, Gainesville, FL, United States
Katherine Pelch, The Endocrine Disruption Exchange, Eckert, CO, United States