 Yan Wang
 Shuangquan Zhang
 Lili Yang2
 Sen Yang
 Qin Ma
- 1Key Laboratory of Symbol Computation and Knowledge Engineering of Ministry of Education, College of Computer Science and Technology, Jilin University, Changchun, China
- 2Department of Obstetrics, The First Hospital of Jilin University, Changchun, China
- 3School of Artificial Intelligence, Jilin University, Changchun, China
- 4Department of Biomedical Informatics, College of Medicine, The Ohio State University, Columbus, OH, United States
Measuring conditional relatedness, the degree of relation between a pair of genes in a certain condition, is a basic but difficult task in bioinformatics, as traditional co-expression analysis methods rely on co-expression similarities, well known with high false positive rate. Complement with prior-knowledge similarities is a feasible way to tackle the problem. However, classical combination machine learning algorithms fail in detection and application of the complex mapping relations between similarities and conditional relatedness, so a powerful predictive model will have enormous benefit for measuring this kind of complex mapping relations. To this need, we propose a novel deep learning model of convolutional neural network with a fully connected first layer, named fully convolutional neural network (FCNN), to measure conditional relatedness between genes using both co-expression and prior-knowledge similarities. The results on validation and test datasets show FCNN model yields an average 3.0% and 2.7% higher accuracy values for identifying gene–gene interactions collected from the COXPRESdb, KEGG, and TRRUST databases, and a benchmark dataset of Xiao-Yong et al. research, by grid-search 10-fold cross validation, respectively. In order to estimate the FCNN model, we conduct a further verification on the GeneFriends and DIP datasets, and the FCNN model obtains an average of 1.8% and 7.6% higher accuracy, respectively. Then the FCNN model is applied to construct cancer gene networks, and also calls more practical results than other compared models and methods. A website of the FCNN model and relevant datasets can be accessed from https://bmbl.bmi.osumc.edu/FCNN.
Introduction
Conditional relatedness between a pair of genes is a degree of the relation between two genes in a certain condition, e.g. in cancer tissues or inflammation, implying the probability of these genes jointly involved in a biological process under such cell environment (Wang et al., 2019). It is different from gene–gene interaction meaning a 0/1 (non-interacting/interacting) binary relation between a pair of genes. Measuring such relatedness is a basic tool for understanding the biological and functional relations between genes in a real cell environment (Jelier et al., 2005; Mistry and Pavlidis, 2008). And the measured relatedness is classically used as weights on connections of genes for construction of gene networks in different environments for further biological analysis (Amrine et al., 2015; Li et al., 2018).
Traditionally, expression similarity as well as co-expression is used to measuring conditional relatedness, including Pearson correlation coefficient (PCC) (Eisen et al., 1998), Spearman rank correlation (SRC) (Kumari et al., 2012), mutual information (MI) (Song et al., 2012), partial Pearson correlation (PPC) (Baruch and Albert-László, 2013), and conditional mutual information (CMI) (Kim et al., 2010). PCC can express the linear relationship between a pair of genes, SRC and MI represent the nonlinear relationship, and PPC and CMI indicate the direct linear relationship and the direct nonlinear relationship under the condition of excluding other genes’ interferences, respectively. Expression similarities have been successfully applied in measuring conditional relatedness for constructing gene networks, on which Poliakov et al. identify disease-related metabolic pathways (Poliakov et al., 2014). However, when acquiring gene expression data, it often contains some inevitable noise, which causes errors in the calculation of conditional relatedness, well known as high false positive rate.
Another type of similarity, prior-knowledge similarity, is also used to measure gene–gene relatedness, based on the documented biological data and functional annotations in public domain, such as the Gene Ontology (GO) (Consortium, 2004), the KEGG (Kanehisa and Goto, 2000), the Reactome (de Bono et al., 2005), the OrthoDB (Zdobnov et al., 2016), the TRRUST (Han and Puri, 2018), etc. It brings high accuracy (ACC) (Diebold and Mariano, 1995), as the prior-knowledge similarity is confirmed by the biological experiment. But the biological experiment is usually conducted in a normal condition, meaning prior-knowledge similarity is hardly used for measuring conditional relatedness.
By the above understanding, integration of expression and prior-knowledge similarities is an effective way to avoid the shortage of using only one category of similarity to measuring conditional relatedness between genes, as a pair of genes with high expression similarity but low prior-knowledge similarity implies their relatedness is most likely a false prediction by co-expression analysis, and the two genes with low expression similarity but high prior-knowledge similarity implies their relatedness is not specific in the condition. The gene pair with both high expression and prior-knowledge similarities should be scored a high rank and recommended by a model. Wang et al. proposed a support vector machine (SVM) model using both expression and prior-knowledge similarities to measure conditional relatedness between a pair of genes, and their computational results showed the proposed model outperforms the existing co-expression analysis methods and other integration models (Wang et al., 2019). The combination of both kinds of similarities has been also succeeded in other related biological issues, e.g., detection of protein–protein interaction (PPI) (Jing and Ng, 2010), measuring functional similarity of gene products (Mistry and Pavlidis, 2008), and identification of disease-causing gene (Mohammadi et al., 2011).
Because of the fast growth of the deep learning technology, deep learning algorithms have outperformed the state-of-the-art traditional machine learning algorithms in many research field of bioinformatics. Babak et al. adapted the deep learning convolutional neural network to the task of predicting sequence specificities and showed that they compete favorably with the state of the art (Babak et al., 2015), and their results show that their approach outperforms other state-of-the-art methods. Pan and Shen proposed a deep learning-based framework by using a novel hybrid convolutional neural network and deep belief network to predict the RNA-binding proteins (RBP) interaction sites and motifs on RNAs.They validate their method on 31 large-scale datasets, and their experiments show that the average area under the curve (AUC) (Lobo et al., 2010) can be improved by 8% compared to the best single-source-based predictor (Pan and Shen, 2017). Trebeschi et al. applied the deep learning methods to automatic localization and segmentation of rectal cancers on multiparametric MRI, and their results demonstrate that deep learning can perform accurate localization and segmentation of rectal cancer in multiparametric MRI in the majority of patients (Trebeschi et al., 2017). Gao et al. proposed a new computational approach based on deep neural networks to predict tRNA gene sequences, and their proposed methods outperformed the existing methods under different metrics (Gao et al., 2019).
Motivated by the above mentioned, we develop a novel deep learning model of convolutional neural network (CNN) with a fully connected first layer, named fully convolutional neural network (FCNN), to measure conditional relatedness between genes using both expression and prior-knowledge similarities. The goal of our model is to keep and recommend gene pairs with both high expression and prior-knowledge similarities. The fully connected first layer makes our model extracting more useful information than traditional CNN and the rest CNN structure makes our model easier to train than all fully connected deep learning models. In line of the above two advantages and integrating of co-expression and prior-knowledge similarities, FCNN model calls better results than other models and methods for identifying gene–gene interactions and constructing cancer gene networks. First, the FCNN model acquires an average 3.0% and 2.7% higher ACC values on validation and test samples collected from the COXPRESdb, KEGG, and TRRUST databases and a benchmark dataset of Xiao-Yong et al. research (Xiao-Yong et al., 2010). Then we perform a further verification on the samples from the GeneFriends and DIP databases, and the FCNN model obtains an average of 1.8% and 7.6% higher accuracy, respectively. Finally, the FCNN model is utilized to construct cancer gene networks, which also obtains more practical results, comparing with other models and methods. The source code of FCNN, as well as the datasets and results of this research, are freely available in https://bmbl.bmi.osumc.edu/FCNN.
Materials and Methods
Dataset Collection
We take gene pairs with/without expression similarity (co-expression) and prior-knowledge similarity (protein–protein interaction, involvement in a same pathway, and transcriptional regulation) as samples to compose a whole dataset to make our model be trained to predict gene pairs with high expression similarity as well as those with high prior-knowledge similarity at the same time, i.e., to identify gene pairs with both high expression and prior-knowledge similarities. Therefore, the dataset used for training, validation, and test consists of two sub-datasets, so called co-expression sub-dataset and prior-knowledge sub-dataset.
The co-expression sub-dataset is collected from the COXPRESdb database (Release v7.1) (Yasunobu et al., 2015), where co-expressed gene pairs are sorted ascendingly by the mutual rank (MR) (Obayashi and Kinoshita, 2009). The smaller the MR value is, the higher co-expression it has. For each gene, we select the top 30 co-expressed genes to compose 30 co-expressed gene pairs from the Hsa-u.v18-10 and Mmu-u.v18-10 datasets in the COXPRESdb database, respectively. Then we select gene pairs as positive samples that they are commonly co-expressed in Hsa-u.v18-10 and Mmu-u.v18-10 datasets. To relieve the imbalanced problem between positive and negative samples, for each gene, we select middle 60 non-co-expressed genes to compose negative samples, similarly as composing the positives, where negative samples are the non-co-expressed gene pairs with PPC values around 0. There are 32,735 positive samples and 26,782 negative samples in the sub-dataset.
The prior-knowledge sub-dataset is composed of three parts. A) We collect gene-pair samples from the KEGG database (Release Nov 1, 2018) (Kanehisa, 2002) as the first part, where positive samples are gene pairs composited by the genes involved in at least two same pathways, and the negative samples are randomly selected gene pairs composited by the genes never engaged in the same pathway, with the same number of the positives. There are 11,526 positive samples and 11,526 negative samples in the first part. B) Next, for the second part, we use 15,222 gene pairs with PPI from a benchmark dataset of Pan et al. research (Pan et al., 2010) as the positive samples and 21,579 gene pairs without PPI as the negatives. C) In terms of the third part of the sub-dataset, we collect 7,361 gene pairs with the transcriptional regulation records in the TRRUST database (Release v2) (Han et al., 2017) as the positive samples and 7,361 gene pairs by random permutation of the transcription factor and the regulated gene in the positive ones (Nakamura et al., 2004; De et al., 2005; Wang et al., 2019).
Finally, there are a total of 66,844 positive and 67,248 negative samples. Specially, some negative samples were obtained by permutation of the positives and were then selected randomly to ensure the same number of positives for construction of a model with high generalization. And to avoid the bias of random permutation and selection of negative samples, we conduct the above process 100 times, rising to 100 datasets, in each of which a fixed percentage of the samples are used to training, validation, and test, according to the detailed proportion of the sub and sub-sub datasets. Also, the labels for the positive gene pairs are marked as 1s and those for the negatives as 0s. The details of each sub-dataset are showcased in Table 1.
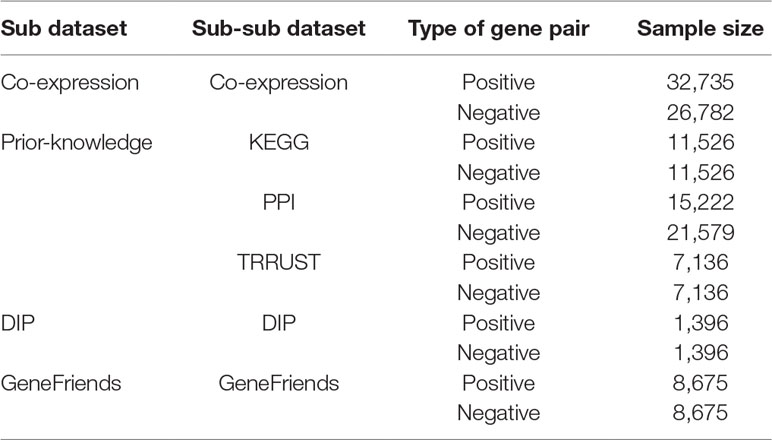
Table 1 The structure of FCNN dataset.
For model verification, the gene pairs downloaded from the GeneFriends (Release v3.1) (Sipko et al., 2015) and DIP (Release Feb 13, 2017) (Xenarios et al.) databases are utilized as samples. In the GeneFriends database, we select overall 8,675 co-expressed gene pairs with top 20 PCC values for each gene as the positive samples. Because there is only a small part of genes that are co-expressed in the human genome, we used 8,675 gene pairs obtained by random permutation of the first and second genes in the positive gene pairs as the negative samples. Similarly, 1,396 gene pairs with direct PPI collected from the DIP database are used as the positive samples. Considering gene pairs with real PPIs are rare in the whole human genome, the 1,396 gene pairs by permutation of the two genes in the positive samples are used as the negatives. To avoid the bias of permutation, we conduct the above process 100 times, rising to 100 datasets from the GeneFriends and DIP databases, respectively.
Gene-Pair Features Calculation
To measure conditional relatedness between a pair of genes and avoid the deficiencies of using a single type of feature, we use two kinds of features of gene pairs, including the expression similarities and prior-knowledge similarities.
In the former one, there are seven features, which are the average expression level of each gene of a gene pair, including Mean1 and Mean2, and five co-expression levels, including PCC, SRC, PPC, MI, and CMI. The expression data for calculation of expression similarities are collected from the GEO datasets (Barrett et al., 2012) based on the Affymetrix Human Genome U133 Plus 2.0 Array platform (released on Nov 2003). Then a pre-processing is executed, including log2 scale and quantile normalization.
The latter one contains five features such as GO similarity (GOsim) (Wang et al., 2007), subcellular location similarity (LCsim) (Yu et al., 2010), hormonology similarity (HGsim) (Chen and Vitkup, 2006), Reactome similarity (RCsim) (David et al., 2014), and transcriptional regulation similarity (FRsim) (Nagafuchi et al., 1991). The details of these features are defined as follows.
where Gi and Gj represent the GO term sets used for annotating gene i and j, respectively; p(g) represents the probability of a gene annotated by an instance of GO term g, and Pms(g,q) represents the minimum probability of a gene annotated by an instance of a common ancestor GO term of g and q. The GO terms of genes used here are the biological process GO terms with experimental evidence downloaded from the GO database (Kumari et al., 2012), where a GO tree is built by the relations among GO terms, including “is a”, “part of”, “has part”, and “regulates”.
where Si and Sj represent the subcellular sets of two proteins encoded by gene i and gene j, respectively. The subcellular information of genes is collected from the GO database.
where vi and vj represent the number of species whose genome contains homologous genes of gene i and j, respectively; L represents the total number of species; and K represents the number of species whose genome contains the homologous gene of both gene i and j.
where di,j represents the shortest distance between gene i and gene j in the graph constructed by gene–gene interactions collected from the Reactome database (Croft et al., 2011), and dmax represents the shortest distance of the farthest gene pair.
where FRsimi,j is equal to 1, if there is a transcriptional regulation between gene i and j recorded in the HTRIdb database (Bovolenta et al., 2012), and is equal to 0, otherwise. Meanwhile, all the databases and relevant data source used to compute these two kinds of gene-pair features are listed in Supplementary Table S5.
Model Construction
In the study, we design a model using CNN with a fully connected first layer, named FCNN to measure conditional relatedness of gene pairs shown as Figure 1. On one hand, the fully connected first layer of FCNN keeps our model from ignoring important feature combination. On the other hand, the CNN structure makes our model easy to train because of its parameter sharing and sparse connections. In detail, the model contains six layers. The first layer is a fully connected layer with 81 neurons and used for getting as much information as possible. The 12 features X = [x1,…,x12] as the inputs are fed into this layer to get the activation score aj of neural j:
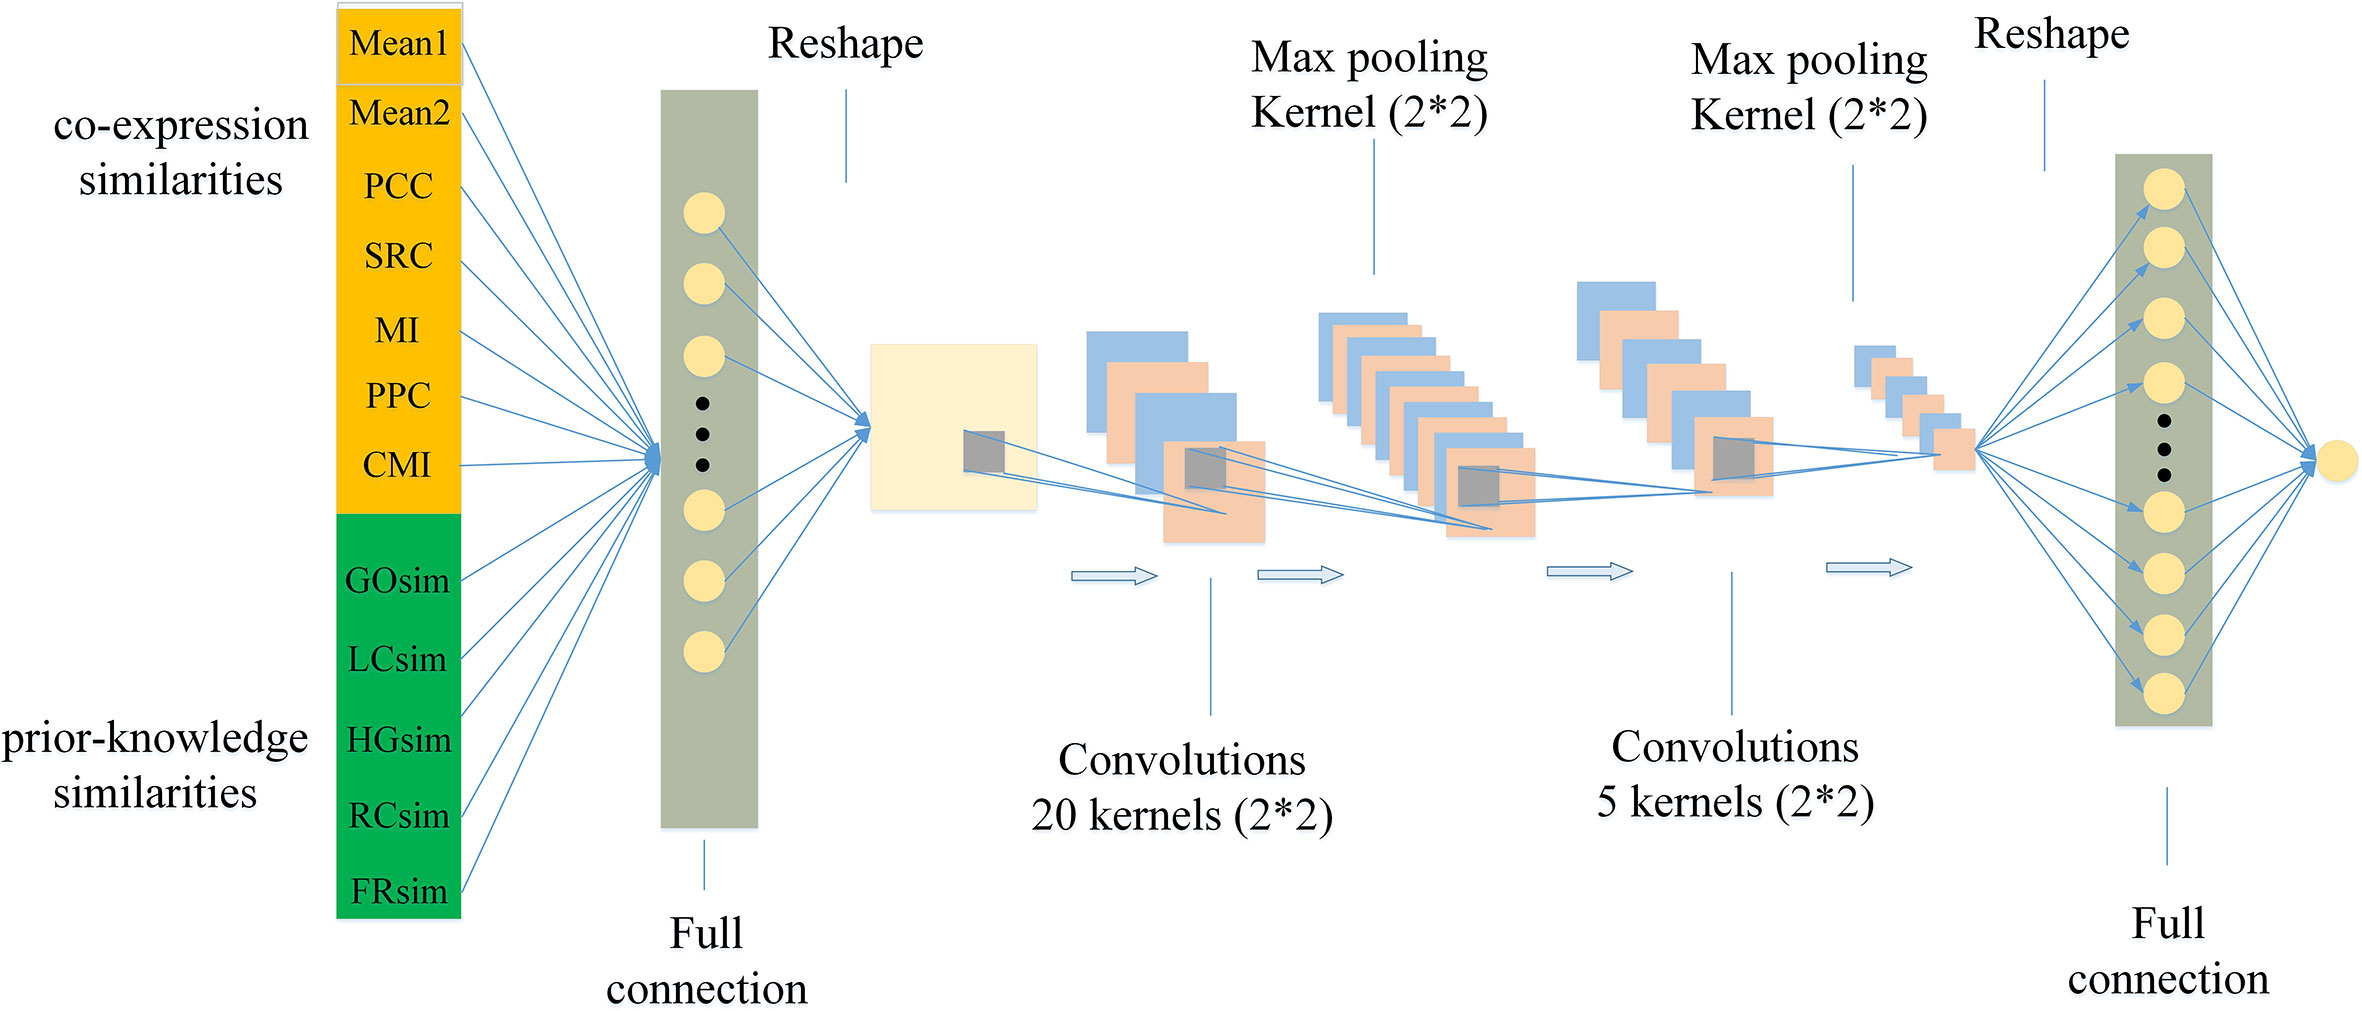
Figure 1 The structure of the FCNN model.
where ωij represents the weight between the xi and neural j; and bj represents the bias. Then we reshape the output A1 = [a1,a2,…,a81] into a 9*9 matrix :
which is convenient to operate the convolution. The second layer is a convolutional layer using 20 convolutional kernels of size 2*2 and stride of 1. The output of each neuron of this layer is the convolution between a kernel matrix and a part of the input. The result A2 of the second layer is defined as:
where Conv(⋅) represents the convolution operation and ReLU(⋅) represents the rectified linear unit function. The third layer is a maximum pooling layer with the kernel of size 2*2 and stride of 2, which is used to down sample and reduce the dim of input by selecting the maximum value in each input. The output from the maximum pooling is recorded as A3:
A dropout operation is used on the third layer to randomly reduce a part of its output to avoid overfitting. The fourth layer is a convolutional layer with five kernels, and its kernel size is 2*2 with stride 1. The fifth layer is a maximum pooling layer with the kernel of size 2*2 and stride of 2. The purpose of using these layers is to further extract the information of the input features and improve the accuracy of the prediction. The results A4 and A5 of the fourth and the fifth layers are defined as
where tanh(.) represents the hyperbolic tangent activation function. The last layer is a fully connected output layer with the predicted conditional relatedness of sample k defined as
where represents the reshaped vector of A5; Wf and bf represent the weight vector and the bias of the final layer, respectively. We apply the Binary Cross Entropy loss (BCEloss) as the loss function of FCNN model defined as
where yk represents ground true label 1/0 of the positive/negative sample k, and K represents the total number of all samples. The optimal algorithm is RMSPROP (Zhang et al., 2019).
Based on the CNN structure with a fully connected first layer, our model is trained by grid-search 10-fold cross-validation, and the hyper-parameters with the highest AUC value of the whole cross-validation are employed, including kernel size, stride, etc. For the detailed description of the architecture and hyper-parameters, see Optimizing the FCNN Model section.
Experimental Design
Herein, our experiment breaks down four parts, depicted as Figure 2, in detail. First, gene-pair samples are collected from three databases and a benchmark dataset to compose the dataset for FCNN construction, which contains co-expression and prior-knowledge sub-datasets. Second, 12 gene-pair features are calculated, including seven expression similarities and five prior-knowledge similarities. Third, FCNN is constructed by grid search in a 10-fold cross-validation process. Finally, FCNN is evaluated by comparing with 12 models and methods in 10-fold cross-validation, test, verification, and construction of gene network.
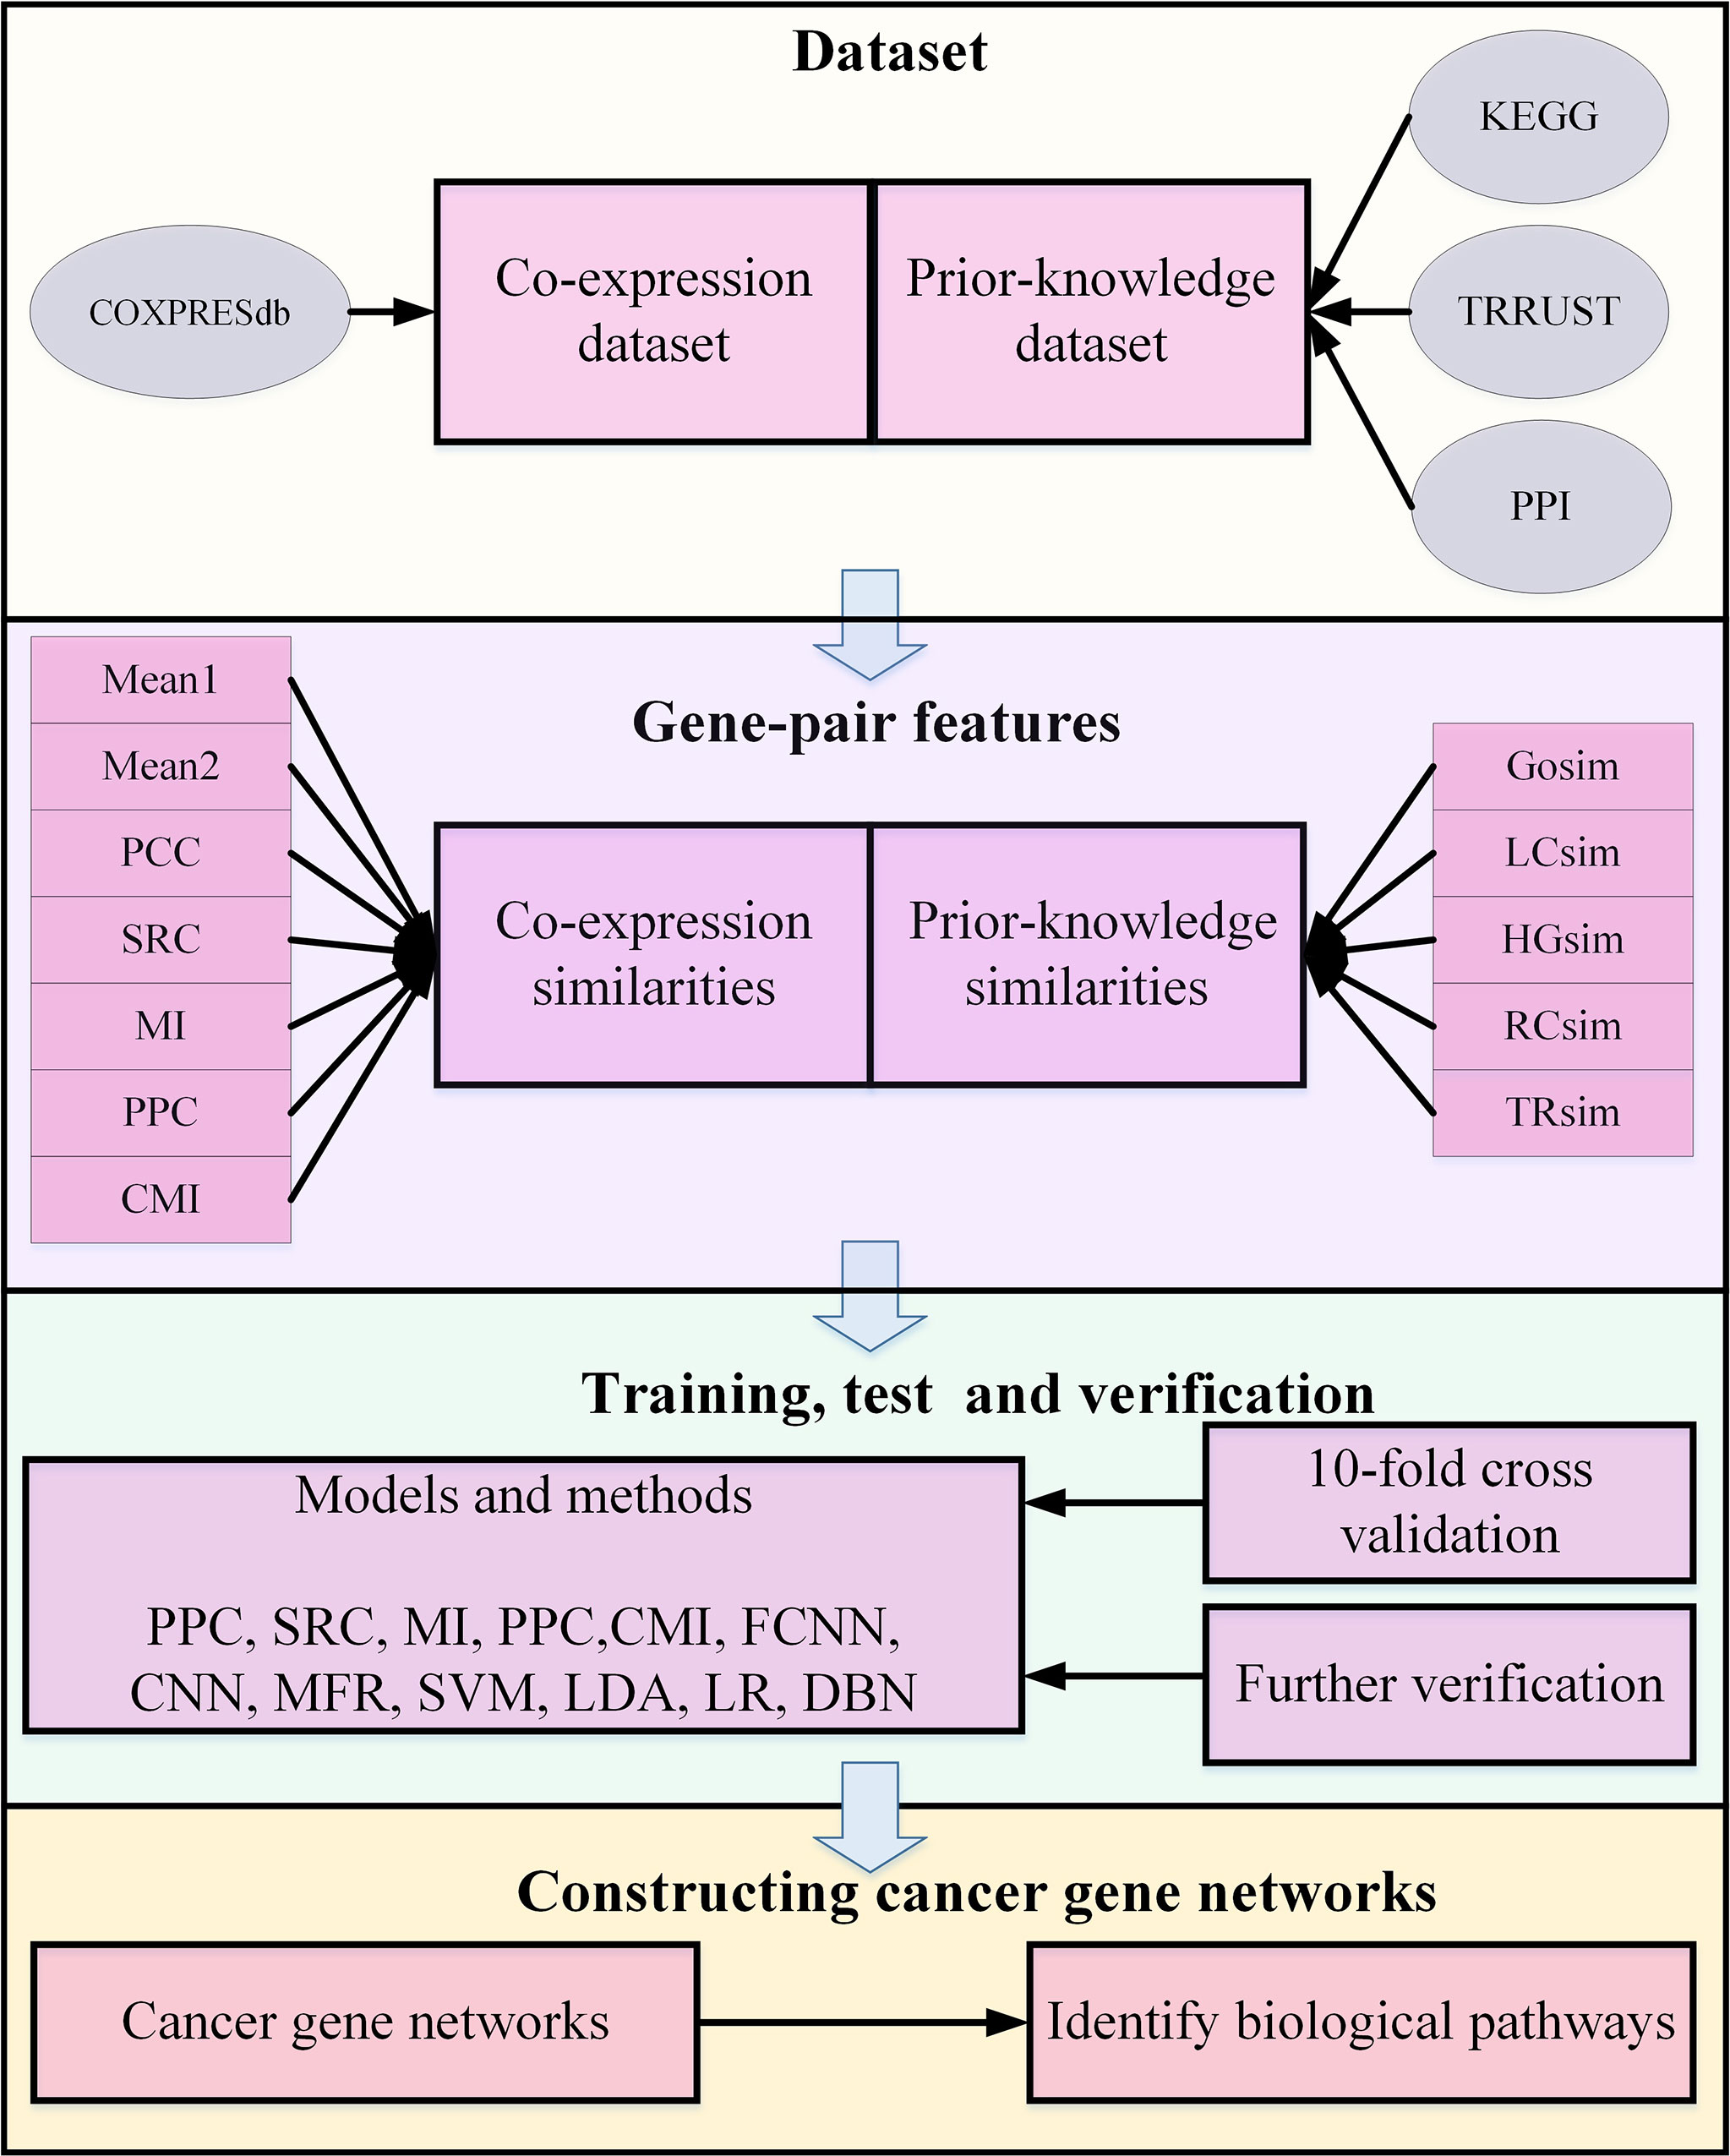
Figure 2 The flowchart of experimental design in biological pathways identification.
The 12 compared models and methods consist by seven models, including logistic regression (LR), linear discriminant analysis (LDA), SVM, deep belief network (DBN), fully connected neural network (FNN), CNN, and MFR (Wang et al., 2019), as well as five co-expression analysis methods, including PCC, SRC, MI, PPC, and CMI. In these models and methods, LR, LDA, and SVM are traditional machine learning technologies applied in many fields (Zhang et al., 2006; AndrewCucchiara, 2012; Asafu-Adjei et al., 2013).
Specifically, the SVM model is constructed with the radial basis kernel function. DBN is a classical deep learning generation model, which combines restricted Boltzmann machine (Pang et al., 2018) and neural network structure. Multi-Features Relatedness (MFR) is a SVM-based model with linear kernel function proposed recently, integrating both expression and prior-knowledge similarities to measuring conditional relatedness. And PCC, SRC, MI, PPC, and CMI are traditional methods for measuring conditional relatedness between a pair of genes.
For each model and method, we conduct 10-fold cross-validation using 81% samples in dataset collected from the COXPRESdb, KEGG, and TRRUST databases and a benchmark dataset of Pan et al. research (Pan et al., 2010) for training, 9% samples for validation, and the rest 10% for test. And the results of validation and test are used to compare models and methods in terms of precision. Moreover, samples obtained from the GeneFriends and DIP databases are used for further verification to compare different models or methods in robustness. We also compare the practicability of models and methods in terms of cancer gene network construction. To compare the performance of each model or method, we select the receiver operating characteristic curve (ROC) with its AUC (Lobo et al., 2010) and the ACC value as the criteria.
Results
Optimizing the FCNN Model
We built our parameterized FCNN model using Pytorch (Aorte et al., 2019). The optimal hyper-parameters are obtained from various combinations based on baseline parameters by grid search within 10-fold cross-validation. We test hyper-parameter combinations containing the kernel size, stride, learning rate, activation functions, dropout probability, etc., and get the experimental results of the different hyper-parameters shown as Table 2. Specially, the FCNN model is trained by minimizing the BCEloss with RMSprop optimizer (Zhao et al., 2019) in the light of the AUC of validation and test datasets. As shown in Table 2, the best hyper-parameters for combination of activation function, the kernel size, stride, the number of neurons in the first layer, learning rate, the dropout probability, and the batch size is Tanh_Tanh, 2, 1, 81, 0.001, 0.1, and 250, respectively.
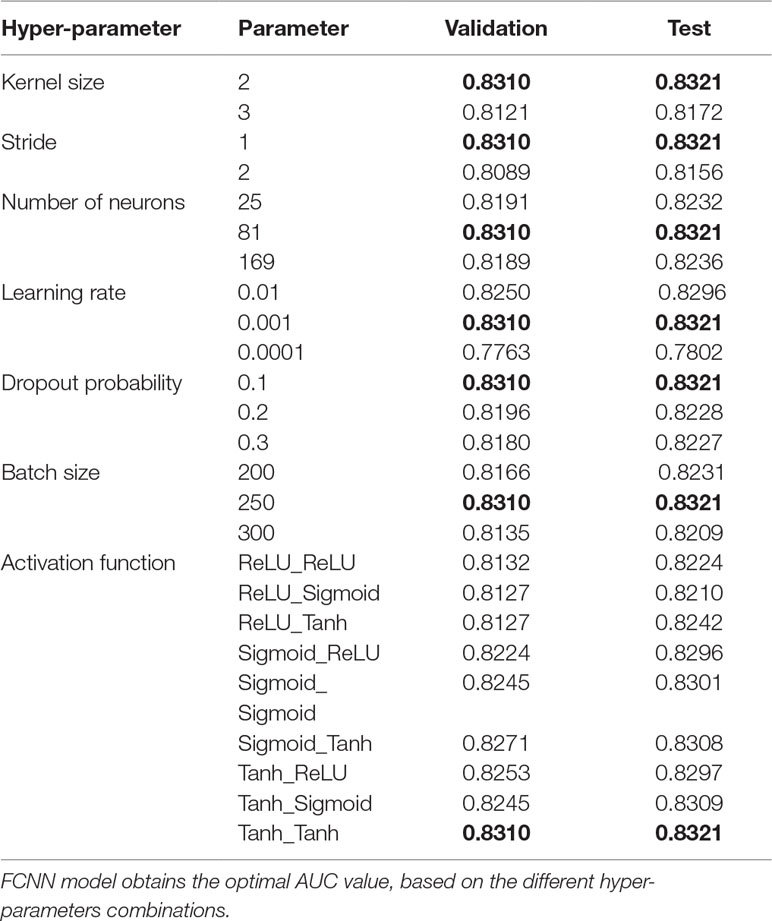
Table 2 Effects of the varied hyper-parameters through a 10-fold cross-validation in terms of AUC based on the validation and test datasets.
Table 2 reflects the experimental results of the combining hyper-parameters. The nine kinds of combination of three activation functions (ReLU, Sigmoid, and Tanh) are evaluated. As a result, combination of Tanh and Tanh is optimal. The kernel size and the stride of the FCNN model are changed to 2 and 3, and 1 and 2, respectively. The kernel of 2 and the stride of 1 are the best suitable for our approach, respectively. The neuron number of the first layer is changed to 5*5, 9*9, and 13*13, and we find 9*9 is optimal. The learning rate is changed to 0.0001, 0.001, and 0.01, and the learning rate of 0.001 shows our approach obtains the best performance in both validation and test AUC. To avoid the overfitting, the dropout probability is applied in our approach, changed to 0.1, 0.2, and 0.3. The dropout probability of 0.1 presents the highest AUC in training and test; meanwhile, the larger the dropout probability, the lower the AUCs on validate and test datasets. And then the batch size for the model is also changed to 200, 250, and 300, which shows that the batch size of 250 gets the best performance. To sum up, the combination of the kernel size of 2, the stride of 1, the neuron number of 81 in the first layer, the learning rate of 0.01, the dropout probability of 0.1, and the batch size of 250 is optimal. And we also list the optimal condition under a single hyper-parameter, based on our experiments.
Comparison With Existing Methods
The best parameters of all models are obtained by grid search within 10-fold cross-validation, and the results of the final models with the best parameters are applied to compare models and methods in terms of precision. As shown in Figures 3A, B, most machine learning models perform better than the co-expression analysis methods, and our FCNN model has the highest AUC value of 0.831 and ACC of 0.761 than the others. CNN model is better than others except for the FCNN model, with an AUC value of 0.796 and ACC of 0.731, but the DBN model performs the worst among all models and methods. In the light of Figures 3C–D, the FCNN model obtains the highest AUC and ACC against all models and methods on the test dataset. And the CNN model yields higher AUC value of 0.799 and ACC value of 0.734, which is better than other models and methods besides the FCNN model.
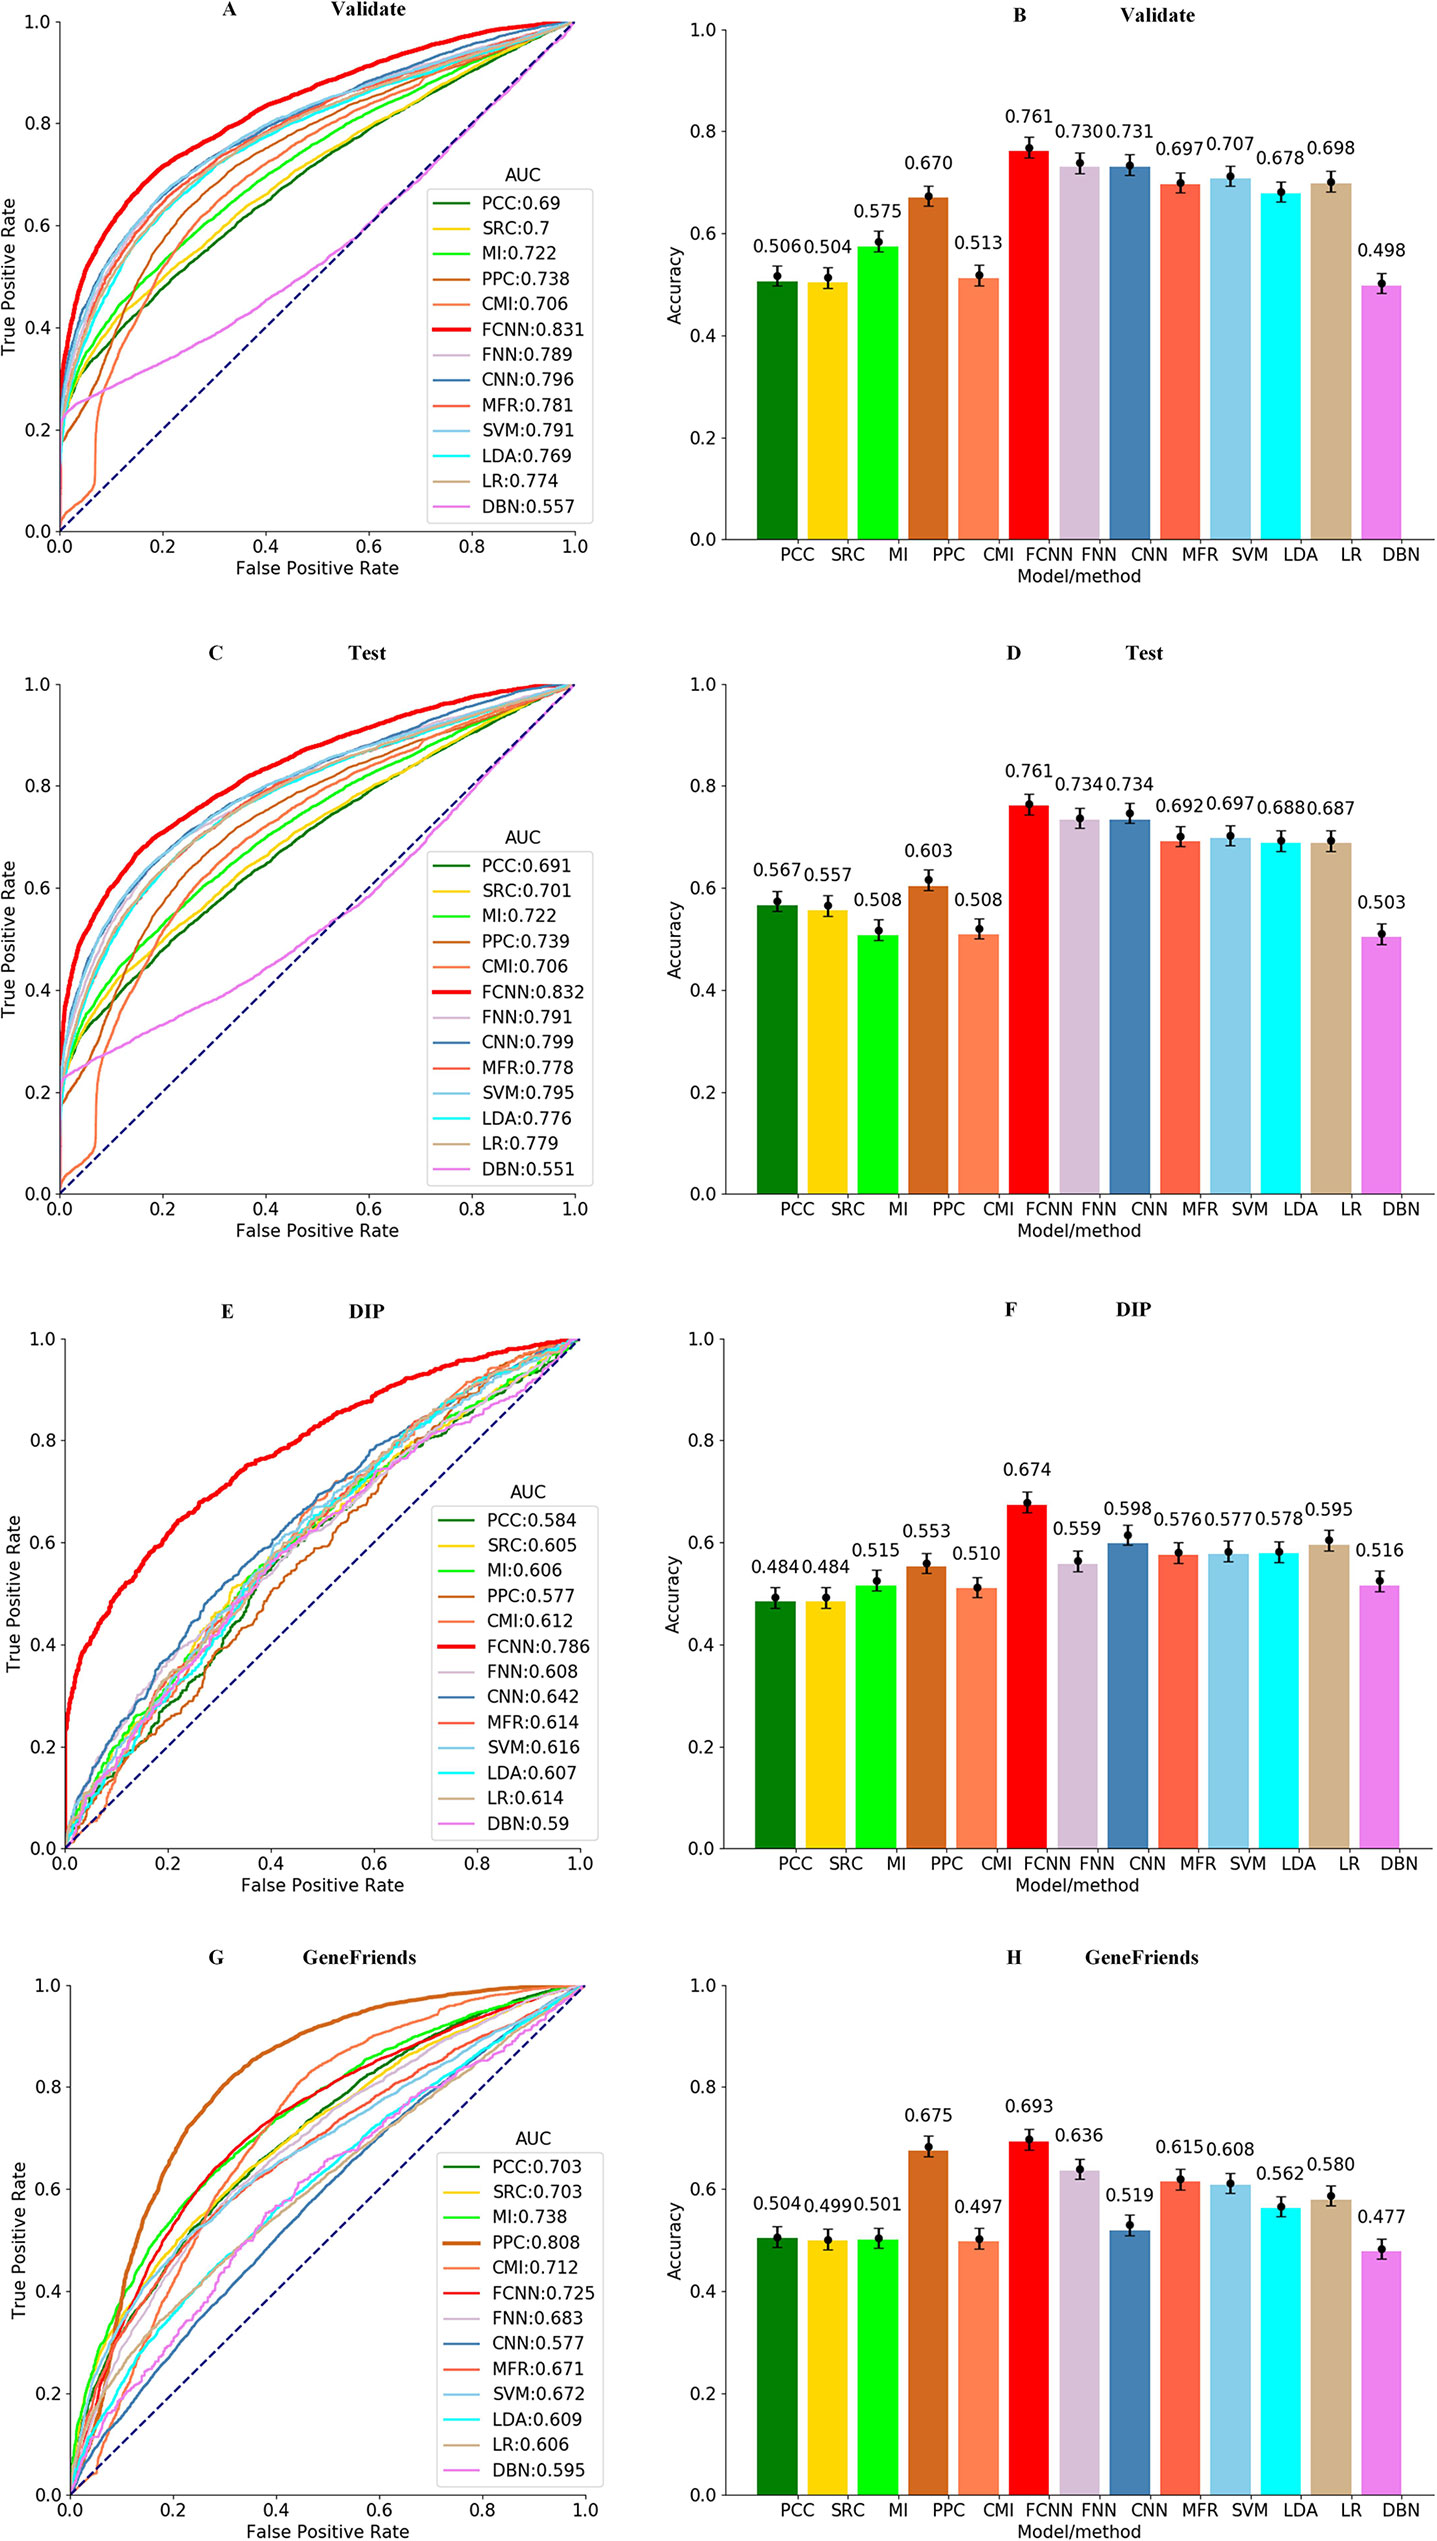
Figure 3 ROCs of all models and methods for identifying gene–gene interactions in the (A) validation, (C) test, (E) DIP, and (G) GeneFriends datasets. ACCs of all models and methods for identifying gene–gene interactions in the (B) validation, (D) test, (F) DIP, and (H) GeneFriends datasets.
To test the generalization and robustness of all models and methods on the samples obtained from the GeneFriends and DIP databases, all models applied on this further verification are trained without samples from the GeneFriends and DIP databases. As shown in Figures 3E–H, the result on the GeneFriends database reflects the robustness of models and methods in detecting gene–gene interactions from co-expression dataset, and the performance on the DIP database indicates generalization in identifying gene–gene interactions from the prior-knowledge datasets. Figures 3E–H shows that FCNN model obtains the third largest AUC value of 0.725 and the highest ACC value of 0.693 among all models and methods on the GeneFriends samples, and AUC and ACC values of FCNN model are better than others on the DIP samples, which are 0.786 and 0.674, respectively.
To clarify the performance of the trained FCNN model on the co-expression, PPI, KEGG, and TRRUST sub-sub datasets, respectively, we applied all models and methods to these four sub-sub datasets and the results shown as Figure S1. According to Figure S1, our approach achieves the highest AUC of 0.938, 0.578, and 0.532 on the co-expression, PPI, and TRRUST datasets, respectively. For the KEGG dataset, AUC of 0.628 of the FCNN model is a little lower than AUC of 0.63 the CNN model obtained. In light of the above results, it is reasonable that the AUC of FCNN model on the co-expression dataset is higher than on the prior-knowledge dataset, which reflects that our models identify the relationship of genes mainly depending on the co-expression information. And the prior-knowledge information only acts as an auxiliary role in the process of identifying gene relationships. To the best of our knowledge, the co-expression information can powerfully reflect the relatedness of genes in a real cell environment, but possibly contains some error messages. And the prior-knowledge information is invested to relieve these error messages, as the relatedness of gene pairs support by the prior-knowledge messages is global, meaning only a small part of those relatedness is activated on a certain condition. Meanwhile, it also implies our model is not suitable for catching the global relatedness of gene pairs support by the prior knowledge.
Constructing Cancer Gene Networks
Genes act as a vital role in many human diseases, most of which often work with each other and affect human health (Li et al., 2018), and the weighed gene network provides an effective method to study the relationship between genes (Yang et al., 2014). There is a property of gene networks in which the genes involved in related biological processes are connected to each other to compose gene subnetworks with density inside connections and sparse outside connections, i.e., genes in a module should be involved in related biological processes (Matteo et al., 2012). Here, the purpose of measuring conditional relatedness between genes is to detect the probability of these genes jointly involving in a biological process. Therefore, the better conditional relatedness is measured by a model for constructing gene network, the more distinctive such property is. Inspired by the above, we use this property to compare each model or method in the construction of gene networks. The conditional relatedness in this research is utilized to construct cancer gene networks, where nodes indicate genes and weights on edges indicate relatedness. The criterion is the number of metabolic pathways predicted significantly influenced by increased serine metabolism in cancers. We choose reprogramming serine metabolism as it is one of the hallmarks of cancer (Yang and Vousden, 2016). It is reported that serine metabolism is increased in various cancers, especially in bladder cancer (Massari et al., 2016), breast cancer (Locasale et al., 2011; Richard et al., 2011; Kim et al., 2014), colon cancer (Duthie, 2011; Jie et al., 2015; Yoon et al., 2015), and lung cancer (Piskac-Collier et al., 2011; Denicola et al., 2015), and supports several metabolic processes that are crucial for the growth and survival of cancer cells, such as DNA/RNA methylation (Maddocks et al., 2016), glutathione biosynthesis (Amelio et al., 2014), one-carbon metabolism (Yang and Vousden, 2016), etc. We conduct enrichment analysis on gene modules identified to be influenced by increased serine metabolism against all the pathways in the KEGG database and obtain significant enriched metabolic pathways (q-value < 0.01) (Storey, 2003). Then we count the number of how many of the significant enriched metabolic pathways are the ones reported to be related to enhanced serine metabolism in cancer tissues. The number shows how well the genes in a module are involved in related biological processes and reflects how well the conditional relatedness is measured by different models for gene network construction.
First, we collect RNA-Seq gene expression data of four cancer types, including bladder urothelial carcinoma (BLCA), breast invasive carcinoma (BRCA), colon adenocarcinoma (COAD), and lung adenocarcinoma (LUAD) from the TCGA database (Hampton, 2006), the details of which are shown in Table 3. Second, up-regulated genes are identified using Limma t-test (Ritchie et al., 2015), with the fold-change of expression level in cancer versus normal tissue > 1.5 and P value < 0.05. Then the relatedness of each pair of up-regulated genes is calculated by FCNN model and 12 other models and methods. Especially, co-expression similarities used as features for each model are calculated using gene expression data in cancers. Third, we construct cancer gene networks, where nodes indicate up-regulated genes, and for each node, we link other nodes with the top 5 relatedness. There are a total of 13*4 gene networks for 13 models and methods in four cancer types. Fourth, we collect 11 enzyme-encoding genes that catalyze biological reactions of serine as the markers for serine metabolism, including CBS, CBSL, PTDSS1, PTDSS2, SDS, SDSL, SHMT1, SHMT2, SPTLC1, SPTLC2, SPTLC3, and SRR. The modules in each network are identified by fast modularity optimization algorithm (Zhang et al., 2009). And the modules with gene markers are defined as modules influenced by increased serine metabolism. We implement gene set enrichment analysis against KEGG pathways on such modules (Christina et al., 2007), by using the hyper-geometric test, with q-value < 0.01. Finally, the metabolic pathways confirmed to be significantly influenced by enhanced serine metabolism in cancer tissues are obtained by intersecting-enriched pathways with the ground truth (see Supplement Tables 1–4). As shown in Figure 4, we detect 13 significantly influenced pathways in FCNN-based gene network in four cancer types, which is the most among all models and methods.
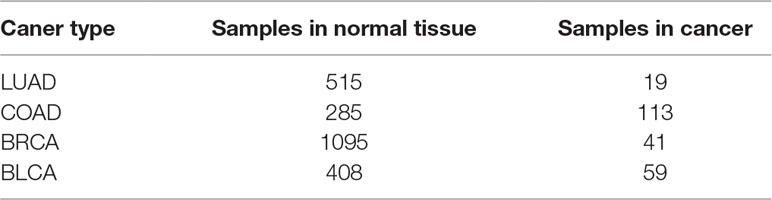
Table 3 The number of samples in cancer and normal tissue.
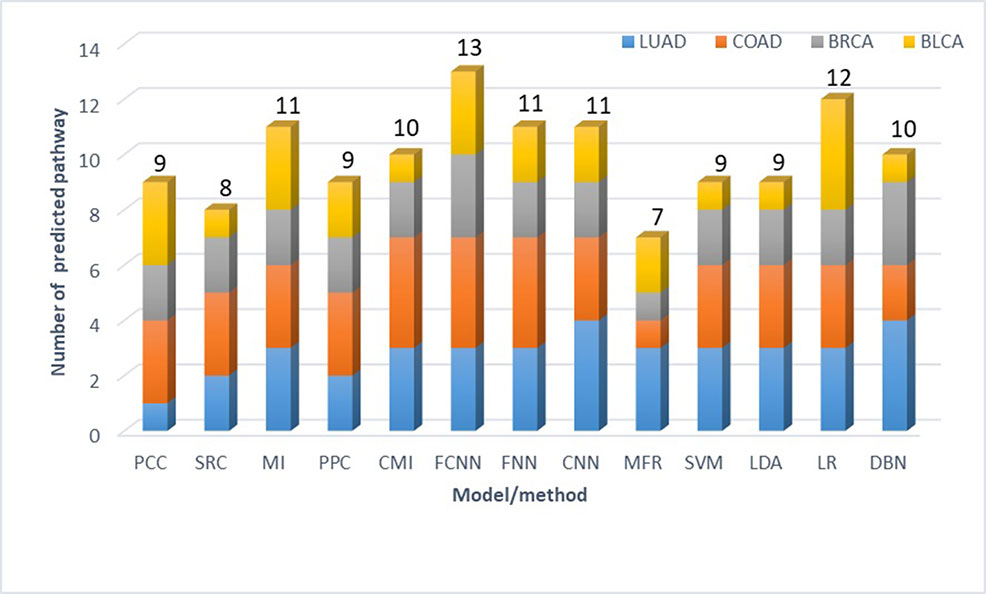
Figure 4 Number of metabolic pathways predicted to be directly influenced by increased serine metabolism in four cancer types.
Discussion
Recent advances in deep learning and bioinformatics stimulate considerable interest in measuring the relatedness of genes, and such pursuit is necessary, which not only speeds up transition from machine learning methods based on measuring correlation to deep learning methods but also can reveal some potential relationship between genes.
Our approach integrates a fully connected layer and the CNN structure for measuring conditional relatedness between genes by integrating co-expression and prior-knowledge similarities. Meanwhile, we demonstrate that this approach is available and effective by experiments on different datasets. To verify our model, we compare the FCNN model with other seven models and five co-expression analysis methods in validation, test, and further verification. The results show that most of machine learning models have higher AUC and ACC values than co-expression analysis methods, implying a combination of both co-expression and prior-knowledge similarities has more obvious advantages in terms of measuring conditional relatedness than using only co-expression similarities. The FCNN model obtains the best performance among machine learning models, which proves deep-learning-based models can more effectively detect the complex map relations between similarities and conditional relatedness than traditional algorithms, such as FNN, MFR, LR, LDA, SVM, and so on. Especially, FCNN model successfully calls a better result than CNN model, which indicates the fully connected first layer persists in our model from ignoring useful combinations of features and the remaining CNN structure with parameter sharing and connection sparsity help our model to be easily trained on the medium-sized dataset. All the above advantages make FCNN model more practical, and as a result, it achieves the best performance in the construction of cancer gene networks. However, PPC and MI obtain higher AUC values on the GeneFriends samples than the FCNN model, mainly because the gene–gene interactions collected from the GeneFriends database are predicted by PCC, making PCC have a natural advantage comparing with other models or methods. And MI has some resemblance with PCC (Yan et al., 2019), which makes it gain the second best result on the GeneFriends dataset.
In line with the performance of the FCNN model, for the next step, we will collect more data, extract more features of gene pairs, and plan to optimize the structure of the model to improve the performance. Meanwhile, we generate some of the negative datasets by random permutation following the way of the references, which may suffer from issue of neglecting tissue specificity; therefore, we will improve this process in our coming researches. Moreover, deep learning is an extremely active research community that is garnering more and more focus from academia, and we expect that deep learning models like this hybrid architecture will be continually explored for the purpose of measuring the relatedness between genes.
Conclusion
In conclusion, the FCNN model is a novel deep learning model of CNN with a fully connected first layer, combining co-expression and prior-knowledge similarities to measure conditional relatedness between genes. For benchmarking purposes, we compare the FCNN model to existing models and co-expression analysis methods; our proposed model obtains the best performance of identifying gene–gene interaction invalidation, test, and further verification. Meanwhile, we estimate the performance of all models and methods on the co-expression and prior-knowledge sub-datasets, respectively, which show that the FCNN model is optimal. In terms of constructing gene networks, the FCNN model also outperforms other compared models and methods and achieves more practical results.
Data Availability Statement
The datasets and results of this study, and code of the FCNN model can be freely obtained from https://bmbl.bmi.osumc.edu/FCNN for academic uses and biological analysis.
Author Contributions
SZ and YT collected the data and performed the experiments. YW conceived the project. YW and QM designed the study. YT, SZ, LY, and SY wrote the manuscript. All authors read and approved the final manuscript for publication.
Funding
This research was funded by the National Natural Science Foundation of China (Nos. 61572227, 61872418) and the Development Project of Jilin Province of China (Nos. 20170203002GX, 20170520063JH, 20180414012GH, 20190201293JC).
Conflict of Interest
The authors declare that the research was conducted in the absence of any commercial or financial relationships that could be construed as a potential conflict of interest.
Supplementary Material
The Supplementary Material for this article can be found online at: https://www.frontiersin.org/articles/10.3389/fgene.2019.01009/full#supplementary-material
References
Amelio, I., Markert, E. K., Rufini, A., Antonov, A. V., Sayan, B. S., Tucci, P., et al. (2014). p73 regulates serine biosynthesis in cancer. Oncogene 33 (42), 5039–5046. doi: 10.1038/onc.2013.456
Amrine, K. C., Blanco-Ulate, B., Cantu, D. (2015). Discovery of core biotic stress responsive genes in Arabidopsis by weighted gene co-expression network analysis. PLoS One 10 (3), e0118731. doi: 10.1371/journal.pone.0118731
AndrewCucchiara, (2012). Applied logistic regression. Technometrics 34 (3), 358–359. doi: 10.2307/1270048
Aorte, F., Dambre, J., Bienstman, P. (2019) Highly parallel simulation and optimization of photonic circuits in time and frequency domain based on the deep-learning framework PyTorch[J]. Sci. Rep. 9 (1). doi: 10.1038/s41598-019-42408-2
Asafu-Adjei, J. K., Sampson, A. R., Sweet, R. A., Lewis, D. A. (2013). Adjusting for matching and covariates in linear discriminant analysis. Biostatistics 14 (4), 779–791. doi: 10.1093/biostatistics/kxt017
Babak, A., Andrew, D., Weirauch, M. T., Frey, B. J. (2015). Predicting the sequence specificities of DNA- and RNA-binding proteins by deep learning. Nat. Biotechnol. 33 (8), 831. doi: 10.1038/nbt.3300
Barrett, T., Wilhite, S. E., Ledoux, P., Evangelista, C., Kim, I. F., Tomashevsky, M., et al. (2012). NCBI GEO: archive for functional genomics data sets—update. Nucleic Acids Res. 41 (D1), D991–D995. doi: 10.1093/nar/gks1193
Baruch, B., Albert-László, B. (2013). Network link prediction by global silencing of indirect correlations. Nat. Biotechnol. 31 (8), 720–725. doi: 10.1038/nbt.2601
Bovolenta, L. A., Acencio, M. L., Lemke, N. (2012). HTRIdb: an open-access database for experimentally verified human transcriptional regulation interactions. BMC Genomics 13 (1), 405. doi: 10.1186/1471-2164-13-405
Chen, L., Vitkup, D. (2006). Predicting genes for orphan metabolic activities using phylogenetic profiles. Genome Biol. 7 (2), R17–R17. doi: 10.1186/gb-2006-7-2-r17
Christina, B., Andreas, K., Jan, K., Benny, K., Nicole, C., Elnakady, Y. A., et al. (2007). GeneTrail–advanced gene set enrichment analysis. Nucleic Acids Res. 35 (Web Server issue), 186–192. doi: 10.1093/nar/gkm323
Consortium, G. O. (2004). The Gene Ontology (GO) database and informatics resource. Nucleic Acids Res. 32 (suppl_1), D258–D261. doi: 10.1093/nar/gkh036
Croft, D., O’Kelly, G., Wu, G., Haw, R., Gillespie, M., Matthews, L., et al. (2011). Reactome: a database of reactions, pathways and biological processes. Nucleic Acids Res. 39 (Database issue), D691. doi: 10.1093/nar/gkq1018
David, C., Antonio Fabregat, M., Robin, H., Marija, M., Joel, W., Guanming, W., et al. (2014). The reactome pathway knowledgebase. Nucleic Acids Res. 42 (Database issue), 472–477. doi: 10.1093/nar/gkt1102
de Bono, B., Jassal, B., Birney, E., Schmidt, E., Joshi-Tope, G., Gopinath, G. R., et al. (2005). Reactome: a knowledgebase of biological pathways. Nucleic Acids Res. 33 (suppl_1), D428–D432. doi: 10.1093/nar/gki072
De, L. U., Jensen, L. J., Fausbøll, A., Jensen, T. S., Bork, P., Brunak, S. (2005). Comparison of computational methods for the identification of cell cycle-regulated genes. Bioinformatics 21 (7), 1164–1171. doi: 10.1093/bioinformatics/bti093
Denicola, G. M., Chen, P. H., Mullarky, E., Sudderth, J. A., Hu, Z., Wu, D., et al. (2015). NRF2 regulates serine biosynthesis in non-small cell lung cancer. Nat. Genet. 47 (12), 1475. doi: 10.1038/ng.3421
Diebold, F. X., Mariano, R. S. (1995). Comparing predictive accuracy. J. Bus. Econ. Stat. 13 (1), 134–144. doi: 10.1198/073500102753410444
Duthie, S. J. (2011). Folate and cancer: how DNA damage, repair and methylation impact on colon carcinogenesis. J. Inherit. Metab. Dis. 34 (1), 101–109. doi: 10.1007/s10545-010-9128-0
Eisen, M. B., Spellman, P. T., Brown, P. O., Botstein, D. (1998). Cluster analysis and display of genome-wide expression patterns. Proc. Nat. Acad. Sci. 95 (25), 14863–14868. doi: 10.1073/pnas.95.25.14863
Aorte, F., Dambre, J., Bienstman, P. (2019). Highly parallel simulation and optimization of photonic circuits in time and frequency domain based on the deep-learning framework PyTorch. Scientific Reports 9 (1). doi: 10.1038/s41598-019-42408-2
Gao, X., Wei, Z., Hakonarson, H. (2019). tRNA-DL: a deep learning approach to improve tRNAscan-SE prediction results. Hum. Heredit. 83, 163–172. doi: 10.1159/000493215
Han, H., Cho, J. W., Lee, S., Yun, A., Kim, H., Bae, D., et al. (2017). TRRUST v2: an expanded reference database of human and mouse transcriptional regulatory interactions. Nucleic Acids Res. 46 (Database issue), D380–D386. doi: 10.1093/nar/gkx1013
Han, J., Puri, R. K. (2018). Analysis of the cancer genome atlas (TCGA) database identifies an inverse relationship between interleukin-13 receptor α1 and α2 gene expression and poor prognosis and drug resistance in subjects with glioblastoma multiforme. J. Neurooncol. 136 (3), 463–474. doi: 10.1007/s11060-017-2680-9
Jelier, R., Jenster, G., Dorssers, L. C. J., van der Eijk, C. C., van Mulligen, E. M., Mons, B., et al. (2005). Co-occurrence based meta-analysis of scientific texts: retrieving biological relationships between genes. Bioinformatics 21 (9), 2049–2058. doi: 10.1093/bioinformatics/bti268
Jie, C., Shan, W., Dali, H., Wei, D., Chao, X., Hongliang, G. (2015). MicroRNA-455 inhibits proliferation and invasion of colorectal cancer by targeting RAF proto-oncogene serine/threonine-protein kinase. Tumour Biol. 36 (2), 1313–1321. doi: 10.1007/s13277-014-2766-3
Jing, L., Ng, M. K. (2010). Prior knowledge based mining functional modules from Yeast PPI networks with gene ontology. BMC Bioinformatics 11 (11), S3. doi: 10.1186/1471-2105-11-S11-S3
Kanehisa, M. (2002). The KEGG database. Novartis Found. Symp. 247 (247), 91–103. doi: 10.1002/0470857897.ch8
Kanehisa, M., Goto, S. (2000). KEGG: kyoto encyclopedia of genes and genomes. Nucleic Acids Res. 28 (1), 27–30. doi: 10.1093/nar/28.1.27
Kim, D. C., Wang, X., Yang, C. R., Gao, J. (2010). Learning biological network using mutual information and conditional independence. Bmc Bioinformatics 11 (Suppl 3), S9–S9. doi: 10.1186/1471-2105-11-S3-S9
Kim, S. K., Jung, W. H., Koo, J. S. (2014). Differential expression of enzymes associated with serine/glycine metabolism in different breast cancer subtypes. Plos One 9 (6), e101004. doi: 10.1371/journal.pone.0101004
Kumari, S., Nie, J., Chen, H.-S., Ma, H., Stewart, R., Li, X., et al. (2012). Evaluation of gene association methods for coexpression network construction and biological knowledge discovery. PloS One 7 (11), e50411. doi: 10.1371/journal.pone.0050411
Li, J., Zhou, D., Qiu, W., Shi, Y., Yang, J.-J., Chen, S., et al. (2018). Application of weighted gene co-expression network analysis for data from paired design. Sci. Rep. 8 (1), 622. doi: 10.1038/s41598-017-18705-z
Lobo, J. M., Jiménez-Valverde, A., Real, R. (2010). AUC: a misleading measure of the performance of predictive distribution models. Global Ecol. Biogeogr. 17 (2), 145–151. doi: 10.1111/j.1466-8238.2007.00358.x
Locasale, J. W., Grassian, A. R., Tamar, M., Lyssiotis, C. A., Mattaini, K. R., Bass, A. J., et al. (2011). Phosphoglycerate dehydrogenase diverts glycolytic flux and contributes to oncogenesis. Nat. Genet. 43 (9), 869–874. doi: 10.1038/ng.890
Maddocks, O. D., Labuschagne, C. F., Adams, P. D., Vousden, K. H. (2016). Serine metabolism supports the methionine cycle and DNA/RNA methylation through de novo ATP synthesis in cancer cells. Mol. Cell 61 (2), 1–12. doi: 10.1016/j.molcel.2015.12.014
Massari, F., Ciccarese, C., Santoni, M., Iacovelli, R., Mazzucchelli, R., Piva, F., et al. (2016). Metabolic phenotype of bladder cancer. Cancer Treat. Rev. 45, 46–57. doi: 10.1016/j.ctrv.2016.03.005
Matteo, D. A., Vera, P., Shruti, S., Ciccarelli, F. D. (2012). Network of cancer genes (NCG 3.0): integration and analysis of genetic and network properties of cancer genes. Nucleic Acids Res. 40 (Database issue), D978–D983. doi: 10.1093/nar/gkr952
Mistry, M., Pavlidis, P. (2008). Gene ontology term overlap as a measure of gene functional similarity. BMC Bioinformatics 9 (1), 327. doi: 10.1186/1471-2105-9-327
Mohammadi, A., Saraee, M. H., Salehi, M. (2011). Identification of disease-causing genes using microarray data mining and Gene Ontology. BMC Med. Genomics 4 (1), 12. doi: 10.1186/1755-8794-4-12
Nagafuchi, A., Takeichi, M., Tsukita, S. (1991). The 102 kd cadherin-associated protein: Similarity to vinculin and posttranscriptional regulation of expression. Cell 55 (5), 849–857. doi: 10.1016/0092-8674(91)90392-C
Nakamura, T., Furukawa, Y., Nakagawa, H., Tsunoda, T., Ohigashi, H., Murata, K., et al. (2004). Genome-wide cDNA microarray analysis of gene expression profiles in pancreatic cancers using populations of tumor cells and normal ductal epithelial cells selected for purity by laser microdissection. Oncogene 23 (13), 2385–2400. doi: 10.1038/sj.onc.1207392
Obayashi, T., Kinoshita, K. (2009). Rank of correlation coefficient as a comparable measure for biological significance of gene coexpression. DNA Res. 16 (5), 249–260. doi: 10.1093/dnares/dsp016
Pan, X., Shen, H. B. (2017). RNA-protein binding motifs mining with a new hybrid deep learning based cross-domain knowledge integration approach. Bmc Bioinformatics 18 (1), 136. doi: 10.1186/s12859-017-1561-8
Pan, X. Y., Zhang, Y. N., Shen, H. B. (2010). Large-scale prediction of human protein–protein interactions from amino acid sequence based on latent topic features. J. Proteome Res. 9 (10), 4992–5001. doi: 10.1021/pr100618t
Pang, S., del Coz, J. J., Yu, Z., Luaces, O., Diez, J., et al. (2018). Deep Learning and Preference Learning for Object Tracking: A Combined Approach 47 (3), 859–876. doi: 10.1007/s11063-017-9720-5
Piskac-Collier, A. L., Claudia, M., Lopez, M. S., Andrea, C., Etzel, C. J., Greisinger, A. J., et al. (2011). Variants in folate pathway genes as modulators of genetic instability and lung cancer risk. Genes Chromosomes Cancer 50 (1), 1–12. doi: 10.1002/gcc.20826
Poliakov, E., Managadze, D., Rogozin, I. B. (2014). Generalized Portrait of cancer metabolic pathways inferred from a list of genes overexpressed in cancer. Genet. Res. Int. 2014 (4), 646193. doi: 10.1155/2014/646193
Richard, P., Marks, K. M., Shaul, Y. D., Pacold, M. E., Dohoon, K., Kivanç, B., et al. (2011). Functional genomics reveal that the serine synthesis pathway is essential in breast cancer. Nature 476 (7360), 346–350. doi: 10.1038/nature10350
Ritchie, M. E., Smyth, G. K., Phipson, B., Wu, D., Hu, Y., Shi, W., et al. (2015). limma powers differential expression analyses for RNA-sequencing and microarray studies. Nucleic Acids Res. 43 (7), e47–e47. doi: 10.1093/nar/gkv007
Sipko, V. D., Thomas, C., Jo O Pedro, D. M. E. (2015). GeneFriends: a human RNA-seq-based gene and transcript co-expression database. Nucleic Acids Res. 43 (Database issue), 1124–1132. doi: 10.1093/nar/gku1042
Song, L., Langfelder, P., Horvath, S. (2012). Comparison of co-expression measures: mutual information, correlation, and model based indices. BMC Bioinformatics 13 (1), 328–328. doi: 10.1186/1471-2105-13-328
Storey, John D. (2003). The positive false discovery rate: a Bayesian interpretation and the q-value. The Annals of Statistics 31 (6), 2013–2035. doi: 10.1214/aos/1074290335
Trebeschi, S., Griethuysen, J. J. M. V., Lambregts, D. M. J., Lahaye, M. J., Parmar, C., Bakers, F. C. H., et al. (2017). Deep learning for fully-automated localization and segmentation of rectal cancer on multiparametric MR. Sci. Rep. 7 (1), 5301. doi: 10.1038/s41598-017-05728-9
Wang, J. Z., Zhidian, D., Rapeeporn, P., Yu, P. S., Chin-Fu, C. (2007). A new method to measure the semantic similarity of GO terms. Bioinformatics 23 (10), 1274–1281. doi: 10.1093/bioinformatics/btm087
Wang, Y., Yang, S., Zhao, J., Du, W., Liang, Y., Wang, C., et al. (2019). Using machine learning to measure relatedness between genes: a multi-features model. Sci. Rep. 9 (1), 4192. doi: 10.1038/s41598-019-40780-7
Xenarios, I., Rice, D. W., Salwinski, L., Baron, M. K., Marcotte, E. M., Eisenberg, D. DIP: the database of interacting proteins. Nucleic Acids Res. 28 (1), 289–291. doi: 10.1093/nar/28.1.289
Xiao-Yong, P., Ya-Nan, Z., Hong-Bin, S. (2010). Large-scale prediction of human protein-protein interactions from amino acid sequence based on latent topic features. J. Proteome Res. 9 (10), 4992–5001. doi: 10.1021/pr100618t
Yan, W., Sen, Y., Jing, Z., Wei, D., Yanchun, L., Cankun, W., et al. (2019). Using machine learning to measure relatedness between genes: a Multi-Features Model. Sci. Rep. 9 (1), 4192. doi: 10.1038/s41598-019-40780-7
Yang, M., Vousden, K. H. (2016). Serine and one-carbon metabolism in cancer. Nat. Rev. Cancer 16 (10), 650. doi: 10.1038/nrc.2016.81
Yang, Y., Han, L., Yuan, Y., Li, J., Hei, N., Liang, H. (2014). Gene co-expression network analysis reveals common system-level properties of prognostic genes across cancer types. Nat. Commun. 5, 3231. doi: 10.1038/ncomms4231
Yasunobu, O., Yuichi, A., Takeshi, O., Shu, T., Satoshi, I., Takafumi, N., et al. (2015). COXPRESdb in 2015: coexpression database for animal species by DNA-microarray and RNAseq-based expression data with multiple quality assessment systems. Nucleic Acids Res. 43 (Database issue), D82. doi: 10.1093/nar/gku1163
Yoon, S., Kim, J. G., Seo, A. N., Park, S. Y., Kim, H. J., Park, J. S., et al. (2015). Clinical Implication of Serine Metabolism-Associated Enzymes in Colon Cancer. Oncology 89 (6), 351. doi: 10.1159/000439571
Yu, C. S., Chen, Y. C., Hwang, J. K. (2010). Prediction of protein subcellular localization. Proteins 64 (3), 643–651. doi: 10.1002/prot.21018
Zdobnov, E. M., Tegenfeldt, F., Kuznetsov, D., Waterhouse, R. M., Simao, F. A., Ioannidis, P., et al. (2016). OrthoDB v9. 1: cataloging evolutionary and functional annotations for animal, fungal, plant, archaeal, bacterial and viral orthologs. Nucleic Acids Res. 45 (D1), D744–D749. doi: 10.1093/nar/gkw1119
Zhang, X., Lu, X., Shi, Q., Xu, X. Q., Leung, H. C. E., Harris, L. N., et al. (2006). Recursive SVM feature selection and sample classification for mass-spectrometry and microarray data. BMC Bioinformatics 7 (1), 1–13. doi: 10.1186/1471-2105-7-197
Zhang, X. S., Wang, R. S., Wang, Y., Wang, J., Qiu, Y., Wang, L., et al. (2009). Modularity optimization in community detection of complex networks. Epl 87 (3), 38002. doi: 10.1209/0295-5075/87/38002
Zhang, W. Y., Gu, H., Liu, C., Hong, S., Xu, W., Yang, J., et al. (2019). Convolutional Neural Network Based Models for Improving Super-Resolution Imaging. IEEE Access, 7, 43042–43051. doi: 10.1109/ACCESS.2019.2908501
Keywords: conditional relatedness between genes, fully convolutional neural network, co-expression similarity, prior-knowledge similarity, gene network
Citation: Wang Y, Zhang S, Yang L, Yang S, Tian Y and Ma Q (2019) Measurement of Conditional Relatedness Between Genes Using Fully Convolutional Neural Network. Front. Genet. 10:1009. doi: 10.3389/fgene.2019.01009
Received: 18 April 2019; Accepted: 23 September 2019;
Published: 22 October 2019.
Edited by:
Dominik Heider, University of Marburg, GermanyCopyright © 2019 Wang, Zhang, Yang, Yang, Tian and Ma. This is an open-access article distributed under the terms of the Creative Commons Attribution License (CC BY). The use, distribution or reproduction in other forums is permitted, provided the original author(s) and the copyright owner(s) are credited and that the original publication in this journal is cited, in accordance with accepted academic practice. No use, distribution or reproduction is permitted which does not comply with these terms.
*Correspondence: Yuan Tian, eXVhbnRpYW5Aamx1LmVkdS5jbg==