 Karim Karimi
 A. Hossain Farid
 Mehdi Sargolzaei2,3
 Sean Myles
 Younes Miar
- 1Department of Animal Science and Aquaculture, Dalhousie University, Truro, NS, Canada
- 2Department of Pathobiology, University of Guelph, Guelph, ON, Canada
- 3Select Sires Inc., Plain City, OH, United States
- 4Department of Plant, Food, and Environmental Sciences, Dalhousie University, Truro, NS, Canada
Knowledge of linkage disequilibrium (LD) patterns is necessary to determine the minimum density of markers required for genomic studies and to infer historical changes as well as inbreeding events in the populations. In this study, we used genotyping-by-sequencing (GBS) approach to detect single nucleotide polymorphisms (SNPs) across American mink genome and further to estimate LD, effective population size (Ne), and inbreeding rates based on excess of homozygosity (FHOM) and runs of homozygosity (ROH). A GBS assay was constructed based on the sequencing of ApeKI-digested libraries from 285 American mink using Illumina HiSeq Sequencer. Data of 13,321 SNPs located on 46 scaffolds was used to perform LD analysis. The average LD (r2 ± SD) between adjacent SNPs was 0.30 ± 0.35 over all scaffolds with an average distance of 51 kb between markers. The average r2 < 0.2 was observed at inter-marker distances of >40 kb, suggesting that at least 60,000 informative SNPs would be required for genomic selection in American mink. The Ne was estimated to be 116 at five generations ago. In addition, the most rapid decline of population size was observed between 100 and 200 generations ago. Our results showed that short extensions of homozygous genotypes (500 kb to 1 Mb) were abundant across the genome and accounted for 33% of all ROH identified. The average inbreeding coefficient based on ROH longer than 1 Mb was 0.132 ± 0.042. The estimations of FHOM ranged from −0.44 to 0.34 among different samples with an average of 0.15 over all individuals. This study provided useful insights to determine the density of SNP panel providing enough statistical power and accuracy in genomic studies of American mink. Moreover, these results confirmed that GBS approach can be considered as a useful tool for genomic studies in American mink.
Introduction
Linkage disequilibrium (LD) refers to the non-random association of alleles at two separate loci within a population (Weir, 1979). The existence of LD between causative variants and genetic markers is the critical assumption of the genomic studies exploring the association between phenotypes and genotypes (Goddard et al., 2016). Knowledge of LD extension is crucial to determine the required marker density to achieve adequate accuracy in both genome-wide association studies (GWAS) and genomic selection (Meadows et al., 2008; Rabier et al., 2016). Moreover, LD patterns across the genome could be affected by evolutionary forces including migration, mutation, genetic drift, natural selection, population structure, and recombination rates (Ardlie et al., 2002). Hence, LD maps are useful tools to study the genetic diversity (McKay et al., 2007) and identify the selective sweeps in livestock populations (Gutiérrez-Gil et al., 2015). In addition, LD information has been frequently used to estimate the effective population sizes (Ne) in domestic animals e.g., cattle (Rodríguez-Ramilo et al., 2015), sheep (Prieur et al., 2017), and pig (Tapio and Uimari, 2011). The Ne is a useful measure to evaluate the inbreeding levels, historical events, and conservation priorities in animal populations (Theodorou and Couvet, 2006).
Availability of genome-wide markers makes it feasible to estimate the inbreeding levels in the absence of pedigree data (Allendorf et al., 2010). Runs of homozygosity (ROH) were defined as contiguous lengths of homozygous genotypes that transmit identical haplotypes from parents to their offspring (Gibson et al., 2006). Detecting runs of consecutive homozygous segments has been used as an accurate measure to evaluate the inbreeding rates in humans (Kirin et al., 2010), cattle (Ferenčaković et al., 2013; Mastrangelo et al., 2016), and sheep (Purfield et al., 2017). It has also confirmed that ROH could be used as a useful tool to explore the genetic mechanisms of inbreeding depression in the animal populations (Kardos et al., 2016).
American mink (Neovison vison) is known as one of the most desired sources of fur in the world. Development of genomic tools can potentially play a prominent role in improving the fur quality, reproductive performance, growth rates, and health traits in American mink breeding programs. Identifying a large number of genetic markers throughout the genome is an essential step to facilitate genomic studies in American mink. Genotyping-by-sequencing (GBS) is a simple and low-cost sequencing-based approach to detect single nucleotide polymorphisms (SNPs) across a reduced subset of genome (De Donato et al., 2013). The GBS-based genotyping has been proved to be highly effective in genomic studies of plants (Deschamps et al., 2012) and animals (Gurgul et al., 2019). Considering the absence of high-throughput SNP panel for American mink, the GBS can be accounted as a cost-effective genotyping method for genomic studies in mink.
Recent advances in next generation sequencing (NGS) technologies have provided a large number of SNPs to study the genetic basis of economically important traits in livestock species. Accordingly, SNPs have been widely used to study LD patterns in domestic animals e.g., cattle (Porto-Neto et al., 2014), sheep (Al-Mamun et al., 2015), pig (Du et al., 2007), and chicken (Pengelly et al., 2016). In addition, these markers are useful tools in assessing the inbreeding levels based on detection of long homozygous regions across the genome (Karimi et al., 2016; Peripolli et al., 2018). The LD method was used to estimate the Ne in American mink using microsatellite DNA markers (Lecis et al., 2008; Zalewski et al., 2016), however, no study has been conducted on the extent of LD and detection of ROH in American mink using high-throughput SNP data. Exploring the LD patterns can be an effective step to develop genomic selection and design breeding programs in American mink. Therefore, the main objectives of this study were (1) to estimate the LD levels across the American mink genome using high-throughput SNP makers obtained from GBS data, (2) to evaluate the recent and historical Ne based on the pattern of LD decay across the genome, and (3) to estimate the inbreeding levels in the studied population using genomic data.
Materials and Methods
Samples, DNA Extraction, and Genotyping-by-Sequencing
Animals were originated from four mink farms in Canada, and were raised at the Aleutian Diseases Research Center (ADRC) (Farid et al., 2015). There was no pedigree data available for all animals to compute the inbreeding coefficients. Genomic DNA was extracted from the spleen tissues of 285 black American mink using the high-salt procedure (Aljanabi and Martinez, 1997). The genomic DNA was digested by the restriction enzyme ApeKI (G↓CWGC) which creates a sticky 5′ overhang. At the next step, barcode adaptors unique to each sample along with a standard Y-adaptor were ligated to DNA fragments to generate DNA sequencing libraries. Three separate sets of 96-plex GBS libraries were prepared to amplify DNA fragments by PCR using primers complimentary to the ligated adaptors. Finally, each library was sequenced on a separate lane of Illumina HiSeq Sequencer at Genome Quebec sequencing center to generate single-end reads of PCR products.
SNP Discovery and Quality Control
The total number of 681,936,405 reads with the length of 100 bp was generated by sequencing platform. As the first step, barcoded reads were demultiplexed into separate files using Sabre software.1 Cutadapt software (Martin, 2011) was used to remove primers and adaptor contaminations from sequencing reads, and to discard all reads shorter than 50 bp from the data set. Subsequently, all reads were aligned against the mink genome using maximal exact matches (MEM) algorithm implemented in BWA software (Li and Durbin, 2009). HaplotypeCaller tool from the Genome Analysis Toolkit (GATK) was used to call variants in the aligned reads (McKenna et al., 2010). All variants were filtered based on the following measures suggested by GATK documentation: quality by depth <2.0, mapping quality <40.0, Fisher strand >60.0, mapping quality rank sum test <−12.5, and read position rank sum test <−8.0. Finally, all bi-allelic variants with a minor allele frequency >0.05 and those that occurred in more than 85% of individuals were kept for further analysis. After quality control, a data set including 52,714 SNPs at 260 individuals were remained for further analyses. Only scaffolds which included at least 50 SNPs with the length of >10 Mb were used in the LD analysis.
Linkage Disequilibrium and Effective Population Size
Two standard LD parameters, r2 and D′, were computed for all syntenic SNP pairs across the genome using SNP1101 software (Sargolzaei, 2014). The r2 statistic between two SNPs was calculated using the following equation (Hill and Robertson, 1968):
where PAB, Pab, PAb, and PaB are the frequencies of the haplotypes AB, ab, Ab, and aB; and PA, Pa, PB, and Pb are the frequencies of alleles A, a, B, and b in the population, respectively. D′ was computed as explained by Lewontin (1964):
where DAB is (PAB – PAPB) and Dmax is computed as the min (PAPB, PaPb) if DAB < 0 or min (PAPb, PaPB) if DAB ≥ 0, respectively.
The distances between syntenic SNP pairs were categorized in three sets including ≤100 kb, ≤1000 kb, and ≤10 Mb, and these sets were classified using bin sizes of 10 kb, 100 kb, and 1 Mb, respectively. The average r2 was calculated in each bin across all scaffolds and plotted against the median size of bins. We used SNP1101 software to estimate Ne based on the observed pattern of LD across the genome. The historical Ne was estimated at 200, 100, 50, 10, and 5 generations ago to survey the changes in population sizes.
Runs of Homozygosity and Inbreeding Rates
Runs of homozygosity were detected using SNP1101 software based on the data of 52,714 SNPs to assess inbreeding levels in the population. The minimum lengths of ROH were defined to be 500 kb, 1 Mb, 2 Mb, 4 Mb, 8 Mb, and 16 Mb in different steps. Minimum window size was set to be 20 SNPs and ROH window was sled one SNP at each time. A genotyping error rate of 0.01 was used to detect ROH segments. The following equation was then used to compute the inbreeding coefficient based on ROH (FROH) in each individual (McQuillan et al., 2008):
where the numerator is the total length of ROHs above a certain length and L is the total length of the genome covered by markers, which was 1.75 Gb in the current study. The average of FROH was computed for each length category. In addition, inbreeding coefficient based on excess of homozygosity (FHOM) was computed for all individuals using procedure implemented in SNP1101 software.
Results
Data Quality Control
The GBS analysis generated 681,936,405 reads with an average of 2,133,590 reads per animal, and a range of 0 to 5,306,590 reads among all samples. On average, 97.12% of reads were mapped to reference genome (Cai et al., 2017). In total, 25 samples did not pass the quality control steps and were discarded from data set. After quality control, 52,714 SNPs on 260 animals remained for further analyses. The average MAF (±SD) was estimated to be 0.185 ± 0.147 and the average of observed heterozygosity (±SD) was 0.284 ± 0.062 among all individuals. The GBS data set of 13,321 SNPs located on 46 scaffolds was used to survey the extension of LD across the American mink genome. These scaffolds covered 720 Mb of whole genome with an average length of 15.7 Mb per scaffold. The number of SNPs per scaffold ranged from 50 (scaffold 24) to 1,320 (scaffold 10).
Linkage Disequilibrium Patterns and Effective Population Size
Table 1 presents the average r2 and D′ between adjacent SNPs for all scaffolds. The average distance between two adjacent SNPs was 51 kb across studied scaffolds. The average value of r2 ± SD between adjacent SNPs was 0.30 ± 0.35 for all scaffolds and ranged between 0.18 and 0.54 within the scaffolds. On average, 39.09% and 16.97% of all adjacent markers had r2 > 0.2 and r2 > 0.8 across the whole genome, respectively. In addition, the average D′ ± SD between adjacent markers was estimated to be 0.79 ± 0.30 with a range of 0.60–0.90 among all scaffolds.
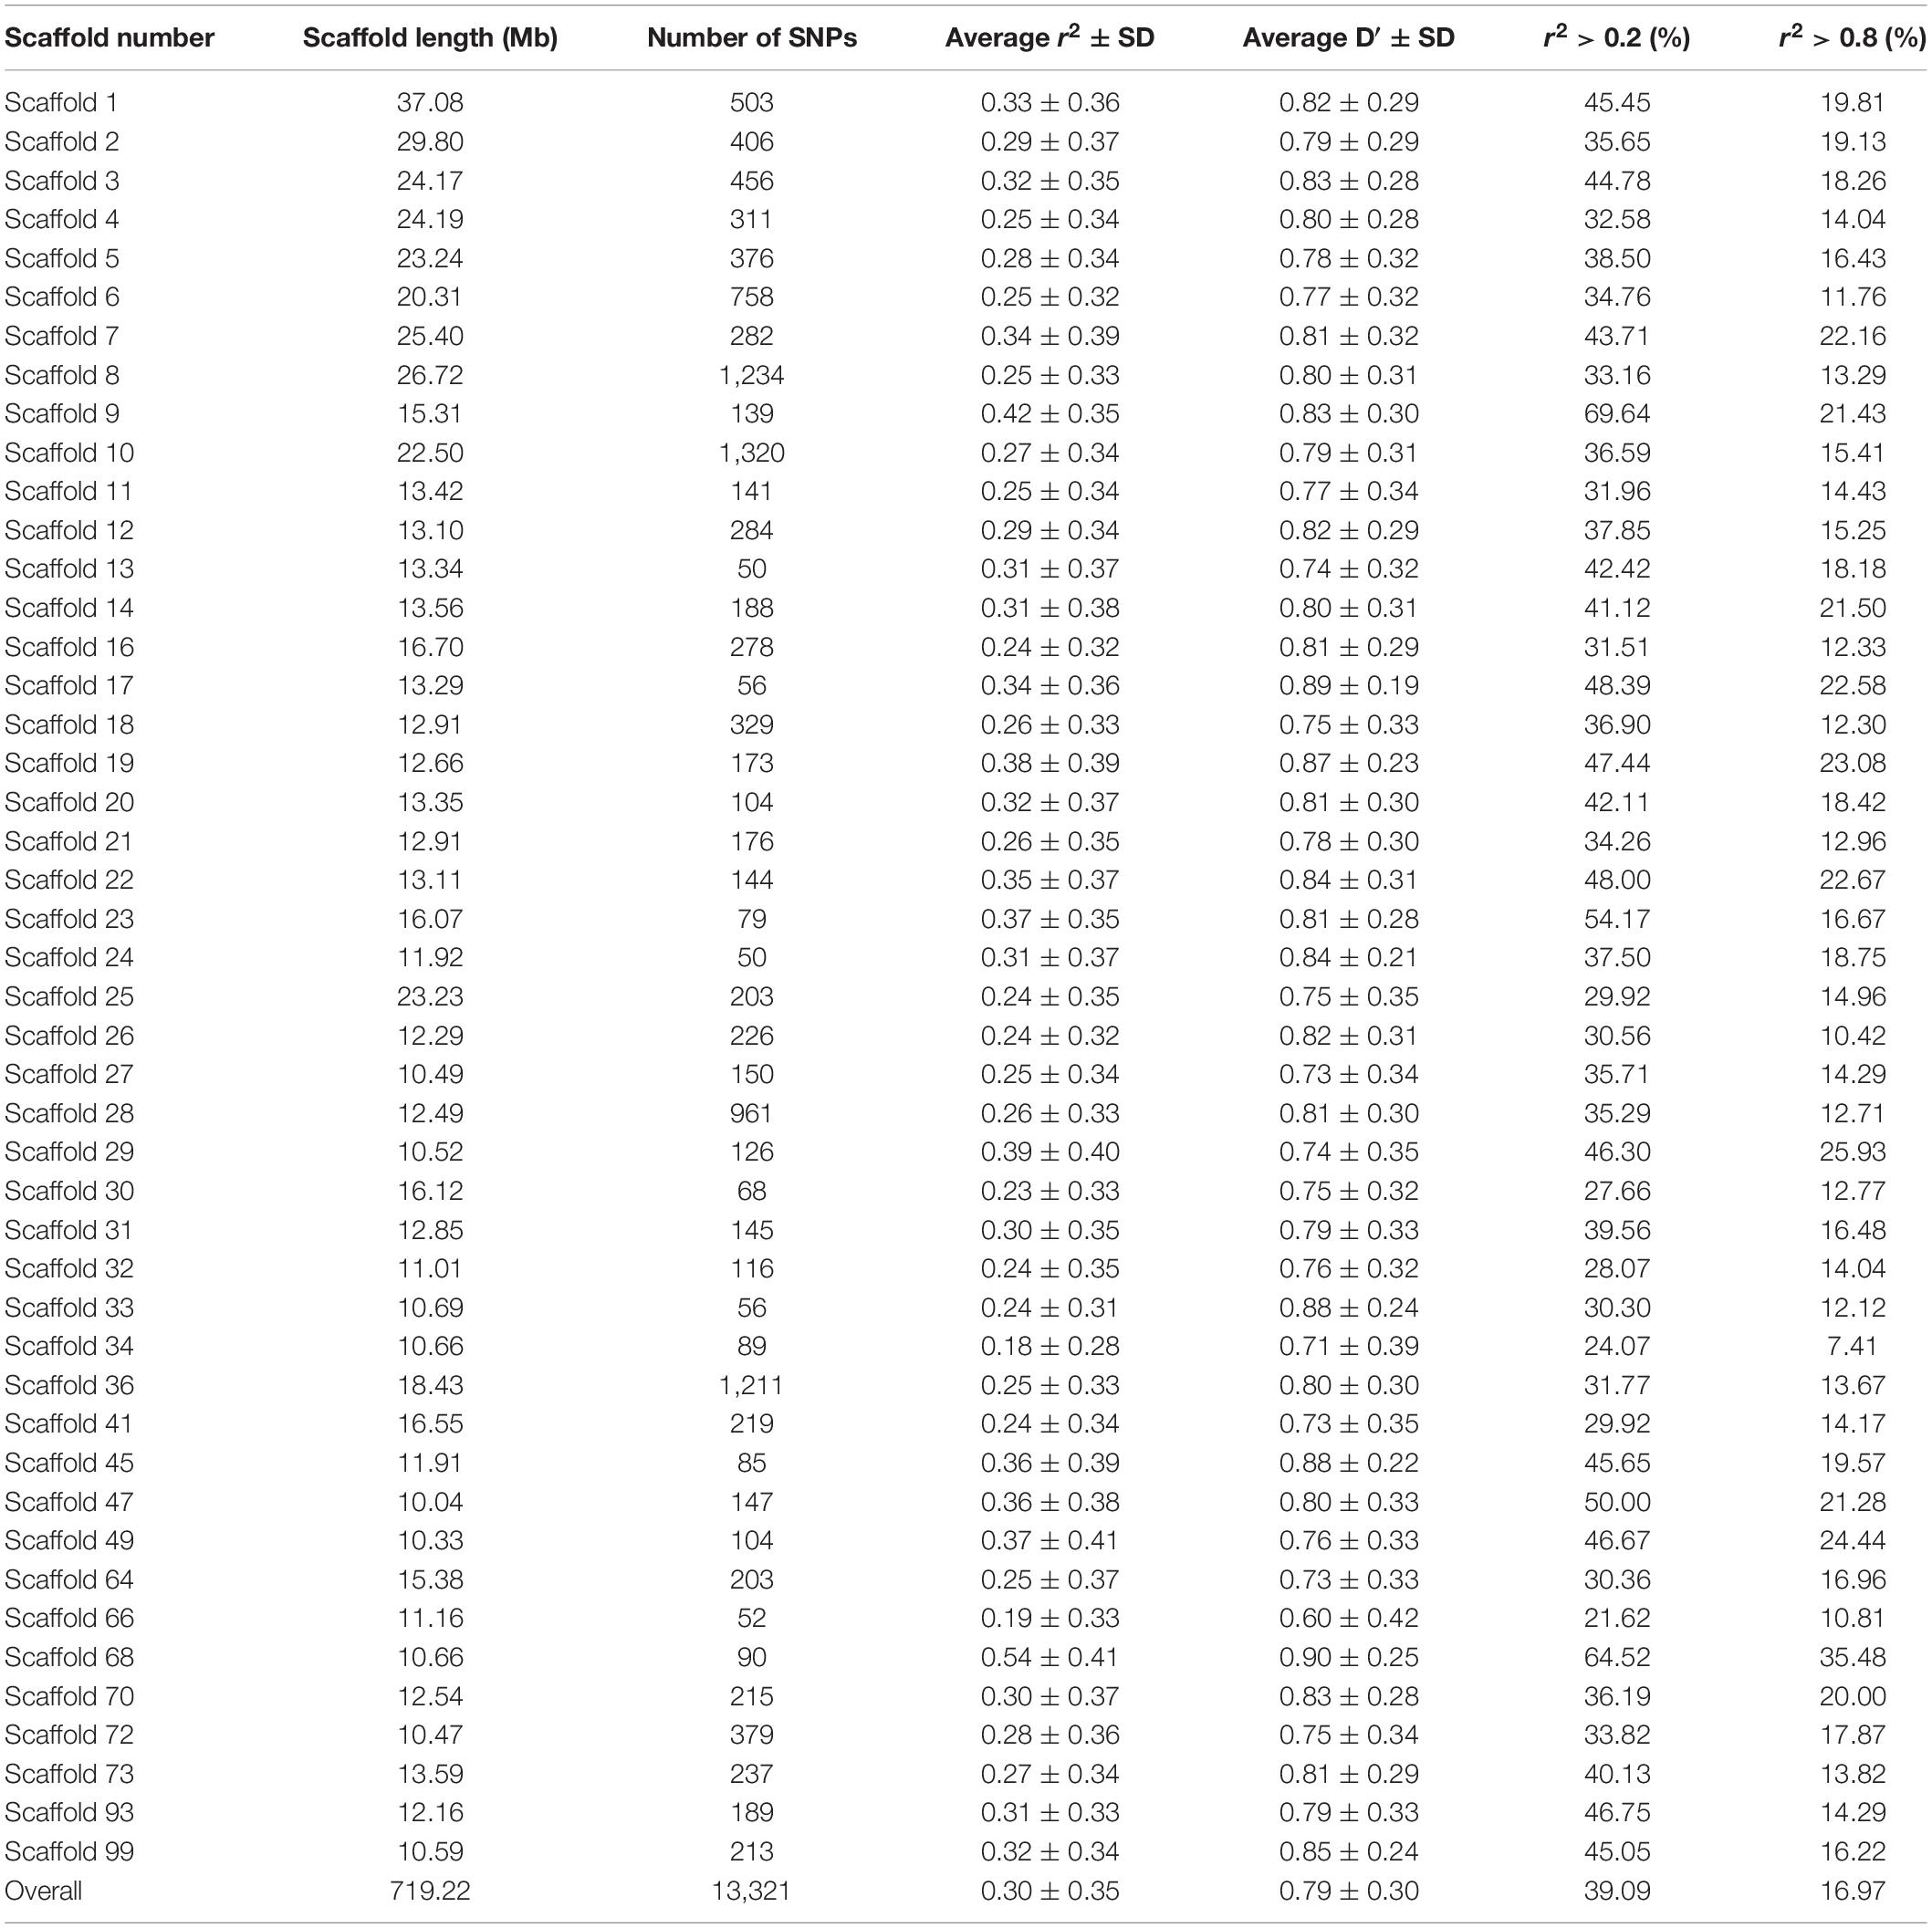
Table 1. The average r2 and D′ between adjacent SNPs on each scaffold in American mink genome and the percentage of SNP pairs with r2 > 0.2 and r2 > 0.8.
The average r2 fluctuated among various scaffolds (Figure 1). The highest LD level was observed for scaffold 24 (average r2 = 0.15) whereas the lowest LD level was found on scaffold 8 (average r2 = 0.02). Table 2 presents the average values of r2 and D′ as a function of distance between SNP pairs up to 1000 kb. As expected, the average of LD parameters declined with increase in physical distances between markers. Whereas the average r2 ± SD was 0.38 ± 0.28 in 0–10 kb inter-marker distances, it was reduced to 0.08 ± 0.12 in marker interval of 900–1000 kb. Similar trend was also observed for D′ values over different inter-marker distances (Table 2). Furthermore, the average r2 was computed by dividing all syntenic SNP pairs into marker intervals spanning up to 100 kb (using bins of 10 kb), 1000 kb (using bins of 100 kb), and 10 Mb (using bins of 1 Mb). The average r2 of consecutive bins was presented for three distance sets in Figure 2.
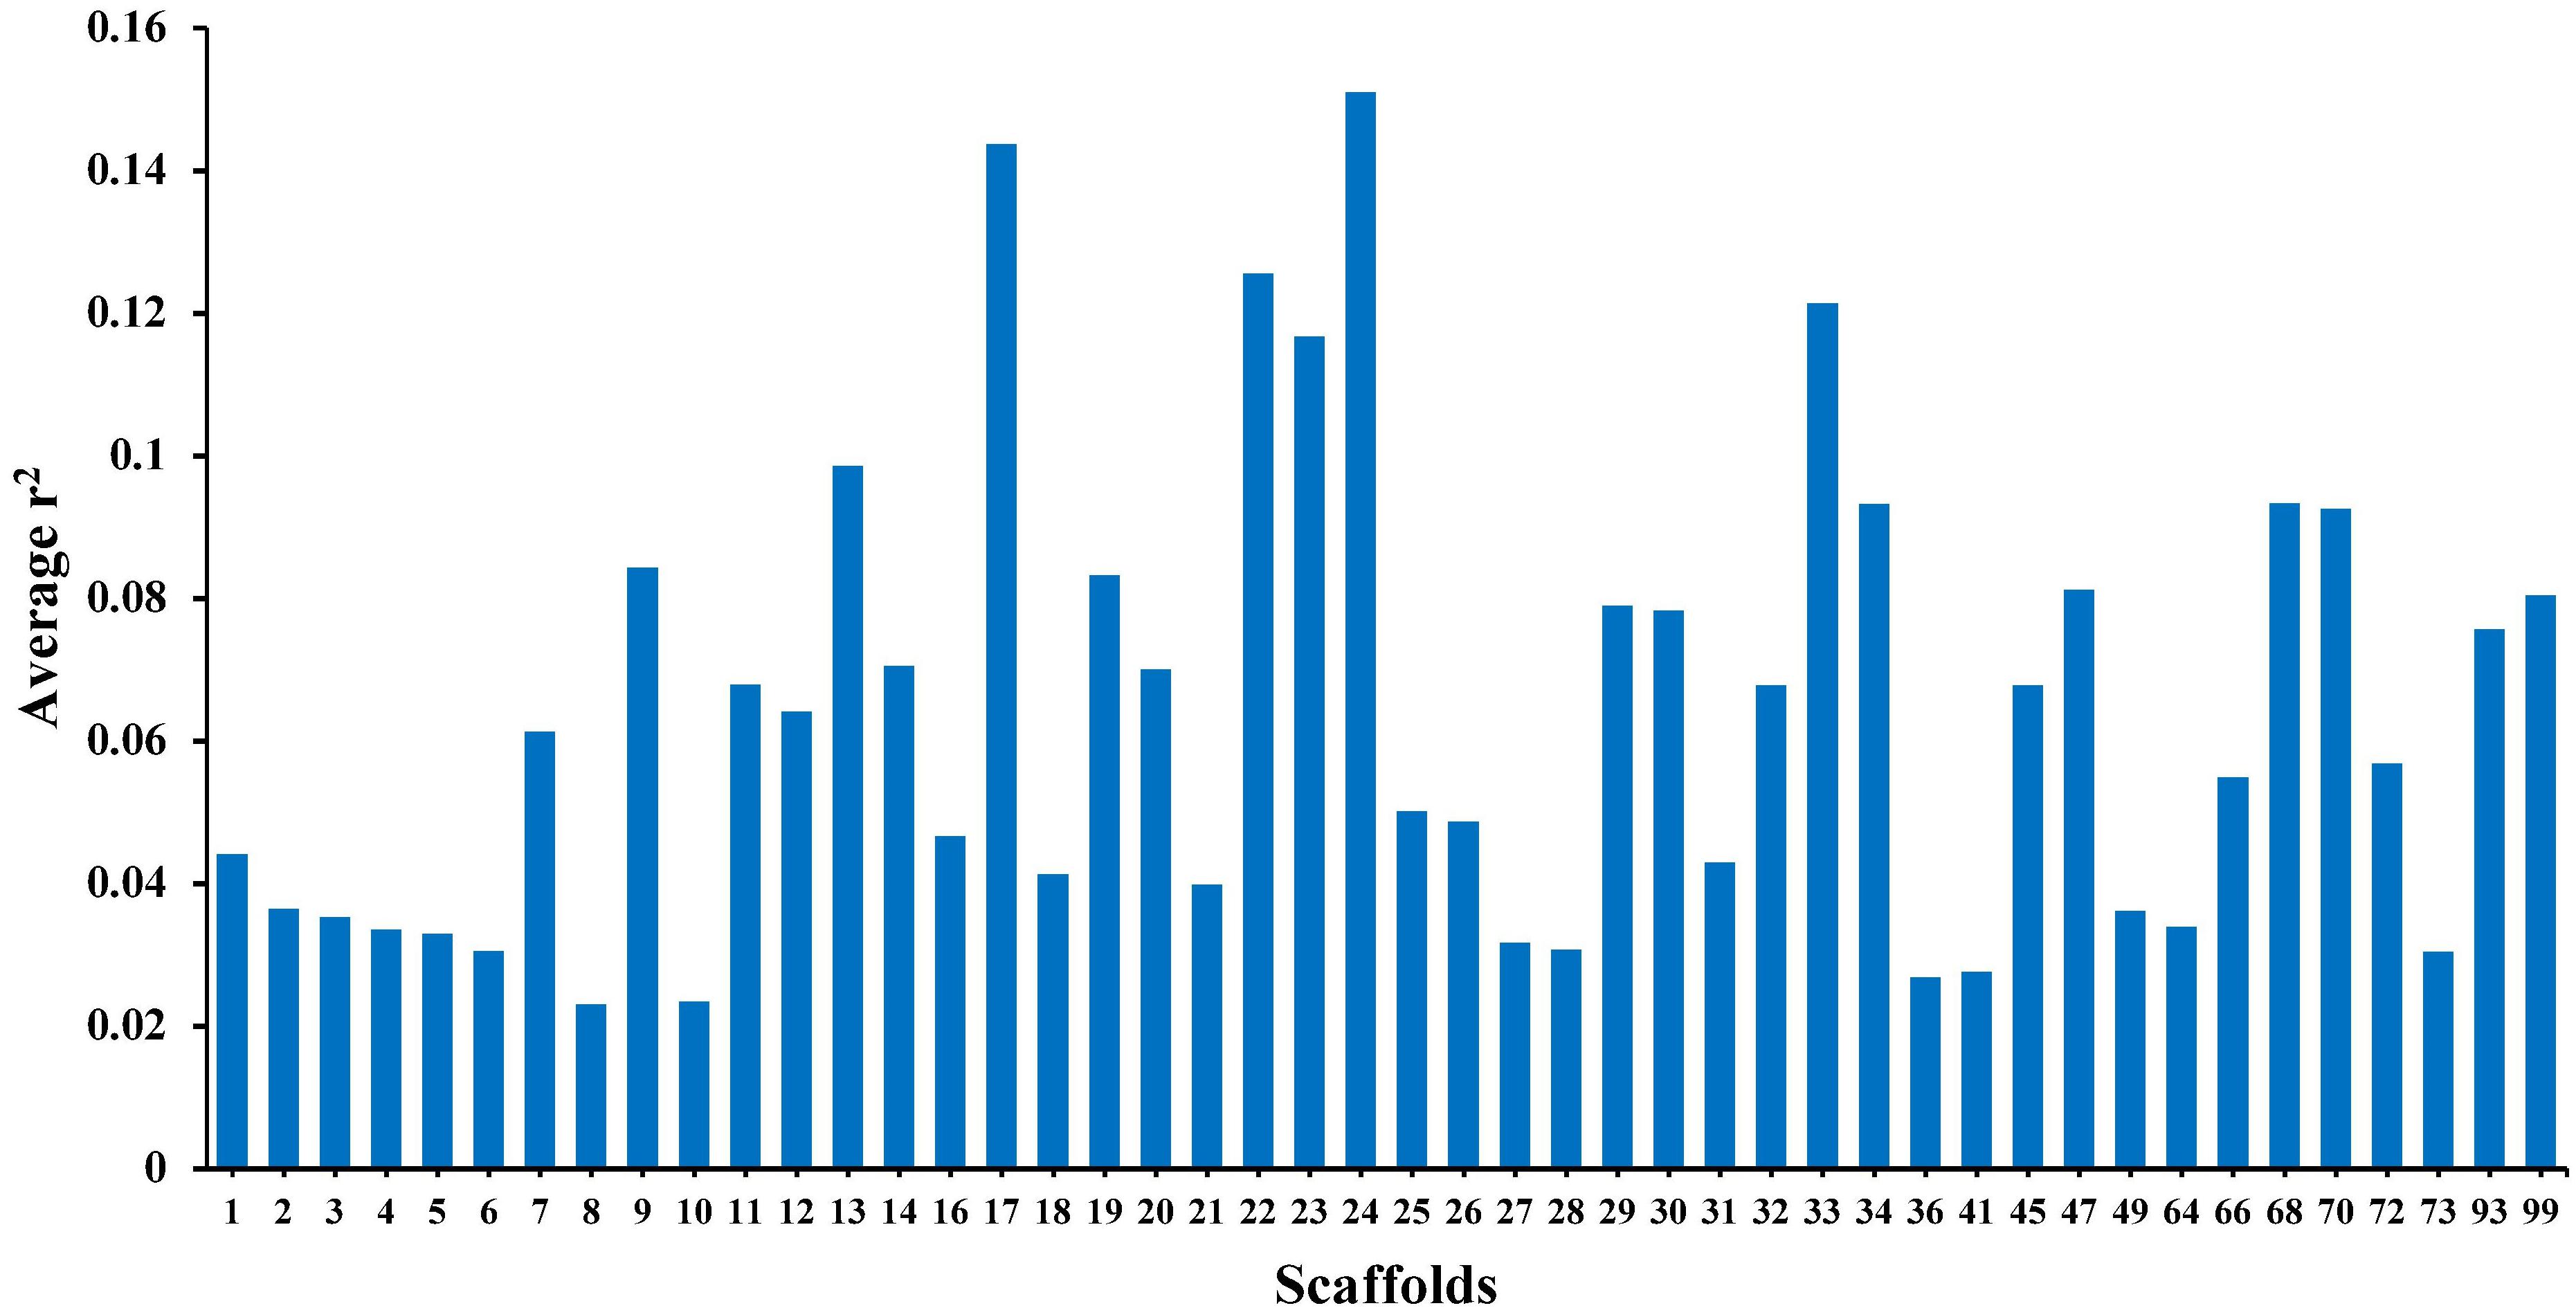
Figure 1. The average r2 per each scaffold (46 scaffolds) in American mink using GBS data.
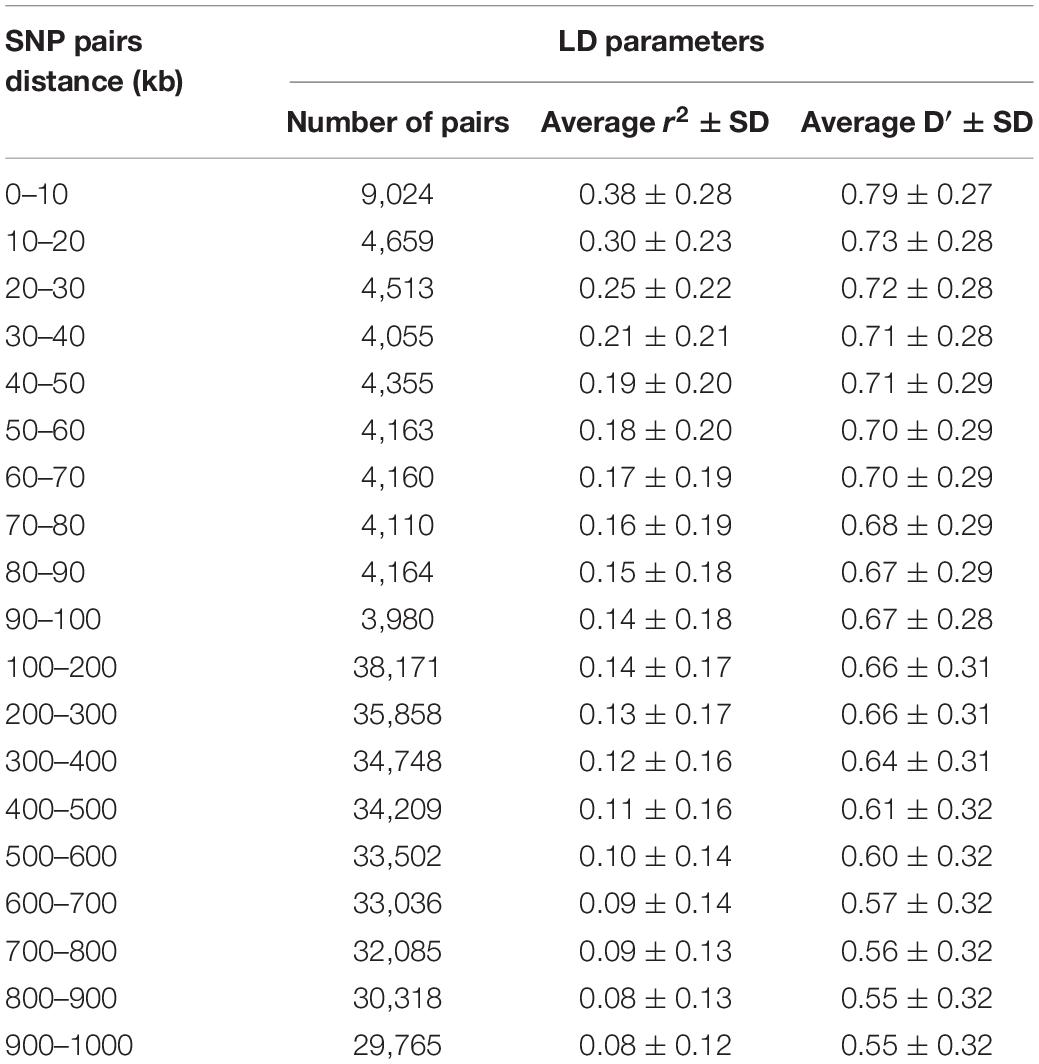
Table 2. Average r2 and D′ ± SD over physical distances up to 1000 kb, pooled over all scaffolds, in American mink.
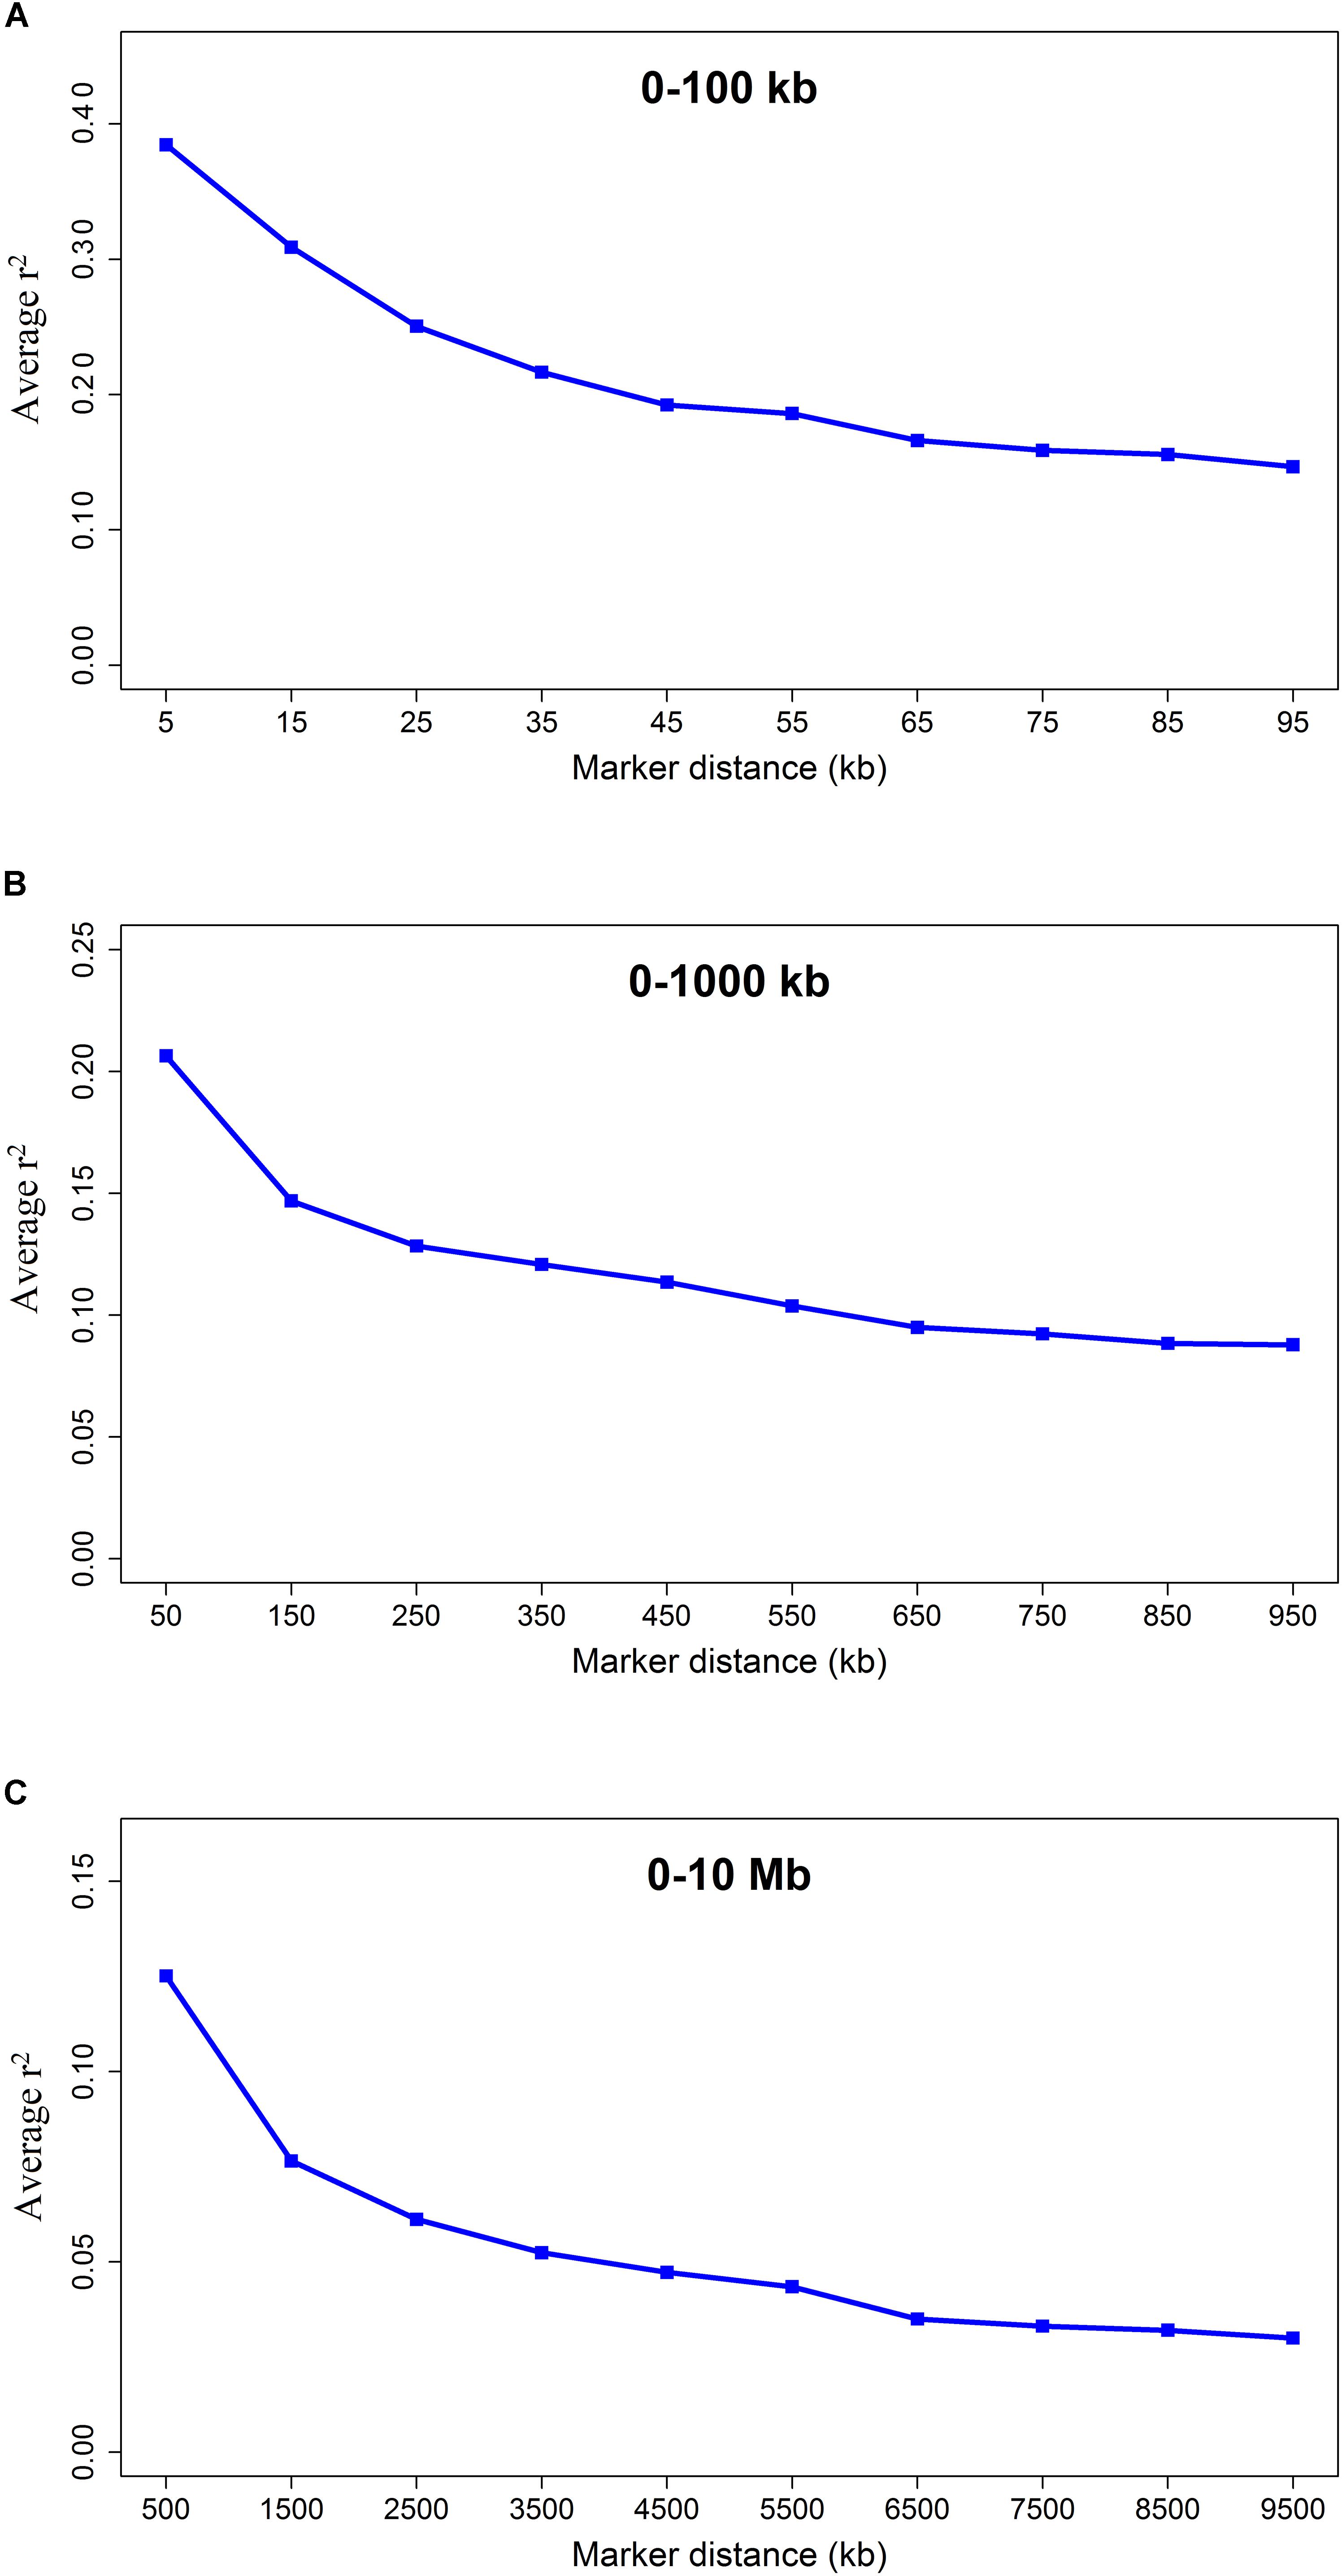
Figure 2. The LD decay represented by the average r2 for three SNP sets: SNP pairs separated by inter-marker distances of (A) 0 up to 100 kb using consecutive 10 kb bins, (B) 0 up to 1000 kb using consecutive 100 kb bins, and (C) 0 up to 10 Mb using consecutive 1 Mb bins.
The ancestral and recent Ne were inferred based on the relationship between LD patterns across various marker intervals and the size of population at different generations. Figure 3 presents the changes in historical Ne from 200 to 5 generations ago, showing that the estimate of Ne was 1,012 at 200 generations ago and was reduced to 116 at 5 generations ago. The Ne was predicted to be 104 for present generation using regression model.
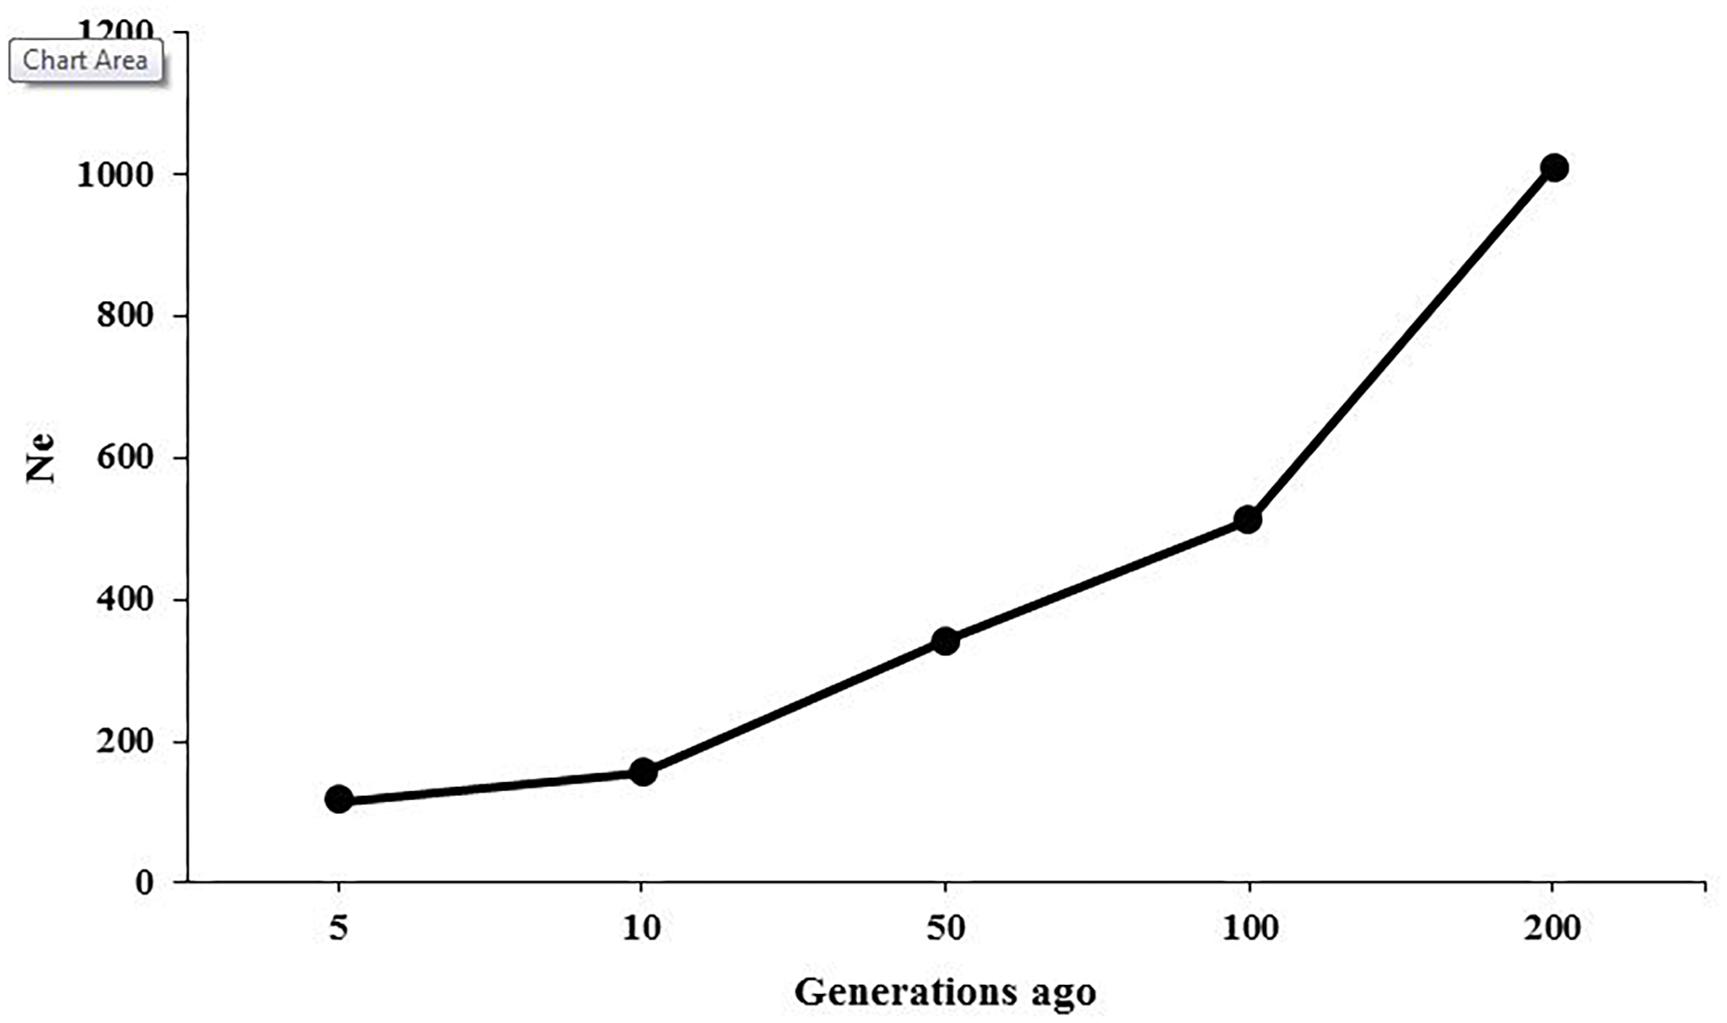
Figure 3. Effective population sizes (Ne) in American mink as a function of generations.
Runs of Homozygosity and Inbreeding Rates
Table 3 presents the average length and the number of segments identified in each ROH length category. The average number of ROH (±SD) identified per individual was 216 ± 56 with an average length of 2.15 ± 2.00 Mb for the length threshold of 500 kb. Short segments (500 kb to 1 Mb) composed the main percentage of total number of detected ROH (33%). The longest autozygous segment was found on scaffold 2 with the length of 22.3 Mb (245 SNPs). The highest number of ROH per scaffold (1500 segments) was observed for scaffold 8 and tended to decline with scaffold length. Figure 4 represents the trend of FROH as a function of criterion lengths from 500 kb to 16 Mb. While the average of FROH > 500 kb was 0.186 ± 0.056 among all samples, the values of FROH for segments >8 Mb tended to be zero. FROH values were in range of 0.02 to 0.36 among individuals. The most inbred animal exhibited 365 ROH >500 kb with an average length of 2.59 Mb per segment. The minimum number of ROH >500 kb detected per individual was 40 with an average length of 1.91 Mb.
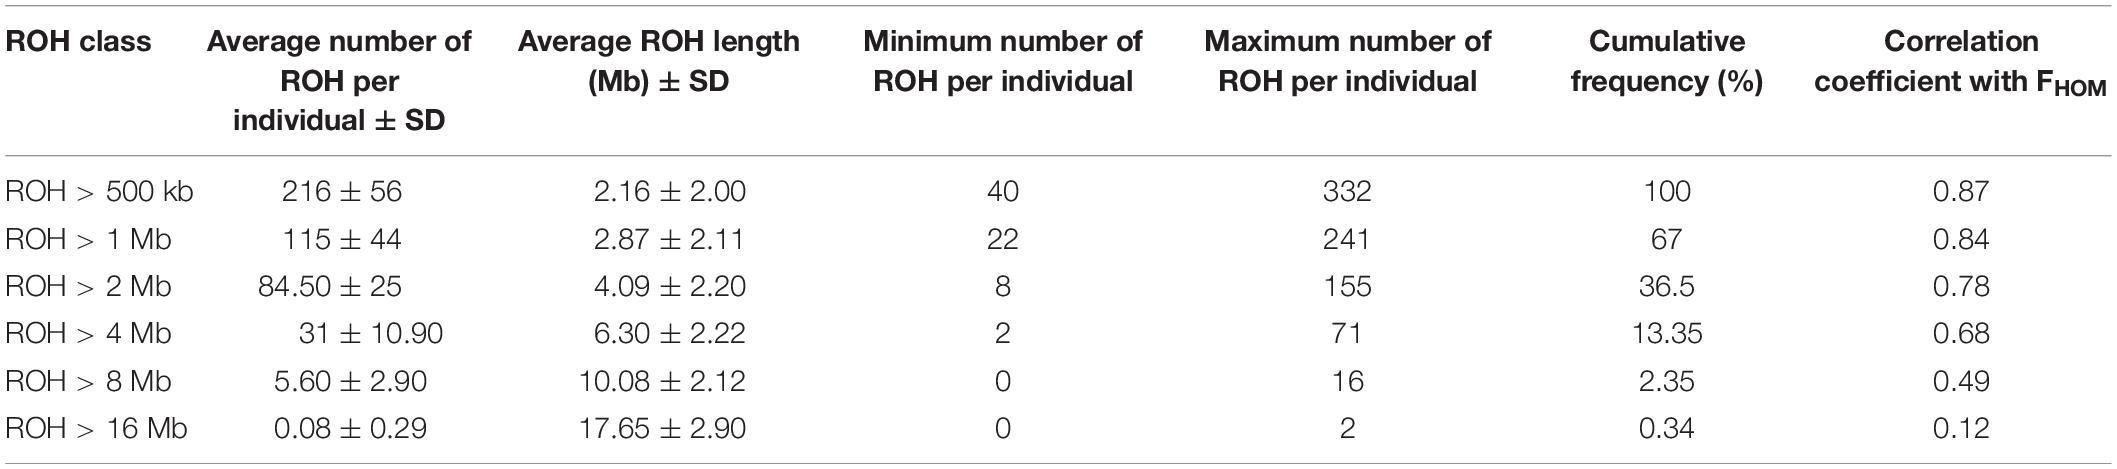
Table 3. Descriptive statistics of runs of homozygosity (ROH) in different length categories: average number of ROH per individual, average length per ROH class, minimum and maximum number of ROH detected per individual, cumulative frequency of each ROH class, and correlation coefficient between FROH and FHOM in each length category.
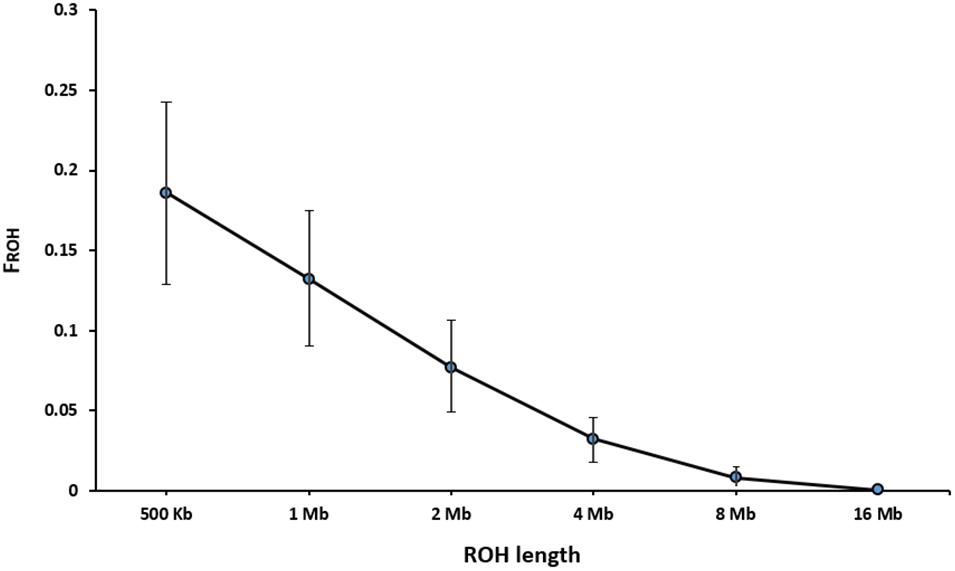
Figure 4. Trend of FROH based on the cut-off length categories for defining ROH.
Genomic inbreeding coefficient was estimated based on excess of homozygosity (FHOM) for all individuals. The estimates ranged from −0.44 to 0.34 among different samples and had an average of 0.15 over all individuals. High correlation (0.87) was observed between FROH (minimum length > 500 kb) and FHOM across the studied samples. However, the correlation coefficients were declined along with increase in the ROH lengths (Table 3).
Discussion
We used GBS analysis to detect SNPs across the genome and investigate the LD extensions in American mink. Despite the lack of chromosome-scale genome assembly and being far from the availability of standard functional and structural annotation of American mink genome, it was still possible to use the reference genome for discovering SNP markers using GBS technique. The high percentage (97.12%) of reads aligned to reference genome indicated that library preparation and optimization steps were successfully performed. In this study, GBS analysis provided 52,714 SNPs across 895 scaffolds for genomic studies in American mink. Similarly, Cai et al. (2018) obtained 34,816 SNPs in 2,451 individuals using GBS data to study the association of SNP markers with body size and pelt length in American mink. The greater number of SNP markers extracted in the current study compared to those identified by Cai et al. (2018) can be mainly due to differences in the restriction enzymes and read depths applied in the two studies. However, in both studies, the highest density of SNPs was located on scaffolds 10 and 8. The GBS analysis also generated a large number of SNPs in other livestock species including horse (30,429), cattle (13,396) and sheep (57,377), which were subsequently applied in revealing the genetic differentiation of the studied populations (Gurgul et al., 2019). Moreover, GBS data have widely been used to investigate the extension of LD in other species e.g., fox (Johnson et al., 2015), olive cultivars (D’Agostino et al., 2018), and cultivated oat (Huang et al., 2014). The results of the present study confirmed that GBS could be a valuable tool for SNP discovery in American mink.
The average LD between adjacent markers was measured using r2 and D′. The average LD (r2 ± SD) between adjacent SNPs was 0.30 ± 0.35 over all scaffolds with a high percentage (39.09%) of r2 > 0.2 between markers (Table 1). Cai et al. (2018) reported a range of 0.2 to 1 for r2 values between adjacent markers in a genome-wide association study of body size and pelt length in American mink, which are in agreement with our results. Furthermore, the extent of LD was measured by computing the average r2 for all SNP pairs up to 10 Mb using three distance sets (Figure 2). A rapidly decreasing trend was observed for r2 values at shorter distances (≤40 kb). However, the LD gradually decayed at longer inter-marker distances and no remarkable change was observed at longer than 6 Mb distances (Figure 2C). The extension of LD across the genome is a critical parameter to determine the number of markers required to achieve a reasonable accuracy in both GWAS and genomic selection. In this regard, the r2 > 0.2 between a marker and QTL was assumed as the critical threshold to obtain an accuracy of >0.80 in genomic selection studies (Hayes et al., 2003; Meuwissen, 2009). In addition, the r2 > 0.3 is suggested to achieve enough statistical power in GWAS (Ardlie et al., 2002). In the present study, the average LD (r2) declined to <0.2 at inter-marker distances of >40 kb, suggesting that at least 60,000 informative SNPs (2.4 Gb/40 kb, where 2.4 Gb is the size of genome assembly) would be required to capture useful LD information necessary for genomic selection. Furthermore, given that the average LD (r2) decayed to <0.3 at inter-marker distances of >20 kb, the minimum of 120,000 SNP markers would be required for GWAS in American mink (2.4 Gb/20 kb). The average distance of 51 kb between adjacent markers implied that 13,321 SNPs would not provide appropriate accuracy in GWAS and genomic selection for American mink. To our knowledge, this was the first study to determine the patterns of LD decay across the American mink genome. However, Gautier et al. (2007) and Khatkar et al. (2008) suggested that 75,000 to 300,000 SNPs would be required for association mapping studies within worldwide cattle breeds, which is in agreement with the density suggested in the present study for American mink. For instance, similar to our results, r2 > 0.3 extended up to distances of 10–20 kb in Nguni and Drakensberger cattle breeds of South Africa (Makina et al., 2015) and several cattle breeds of Iran (Karimi et al., 2015). In addition, short extensions of LD (average r2 > 0.3 at distances of >20 kb) were reported at some breeds of sheep (Kijas et al., 2014; Chitneedi et al., 2017; Liu et al., 2017), pig (Amaral et al., 2008; Ai et al., 2013), and domestic cats (Alhaddad et al., 2013), which are comparable to the ranges obtained in our study.
The LD-based estimations of Ne in American mink showed that the population size was approximately 1,012 at 200 generations ago and was decreased to 116 at five generations ago (Figure 3). A relatively steep decline was observed in the population size between 200 and 100 generations ago, which can be attributed to typical reduction of population size due to domestication process. It seems that the earliest breeding of American mink in captivity was initiated approximately 150 years ago in 1866 for producing fur (Bowness, 1996), which falls into the estimated time of the decrease in population size. Zalewski et al. (2016) estimated the population sizes of 17.5 to 78.8 using microsatellite DNA in American mink on the Swedish coasts. Furthermore, the Ne was estimated to be 7.2–34.8 among mink populations in Spain using microsatellite DNA markers (Lecis et al., 2008). These discrepancies may result from differences in the type and number of molecular markers, genetic backgrounds of the studied populations, and the conservation programs applied at European countries to control the population size of American mink as an invasive species.
We defined ROH as the homozygous segments with different sizes (>500 kb to > 16 Mb). The average level of autozygosity was obtained to be 0.132 ± 0.042 on the basis of ROH longer than 1 Mb (Figure 4). Although there is no evidence on inbreeding rates based on ROH in American mink, a wide range of FROH estimations were reported in other domestic animals, depending on autozygoisty level and historical background of the populations. For instance, Ferenčaković et al. (2013) observed the range of 0.087–0.156 for FROH > 1 Mb in four cattle breeds. A similar range (0.026–0.190) was reported in six Chinese goat breeds (Islam et al., 2019). A slightly higher FROH > 1 Mb (0.168 ± 0.052) was estimated for Jinhua Pigs using sequencing data (Xu et al., 2019). On the other hand, lower estimation of 0.084 ± 0.061 was observed in the study on Valle del Belice sheep on the basis of ROH > 1 Mb (Mastrangelo et al., 2017). The differences in estimations of inbreeding rates derived from ROH could also be raised by uneven marker densities applied in various studies (Ceballos et al., 2018).
Our results showed that short extensions of homozygous genotypes (500 kb to 1 Mb) were abundant across the genome and accounted for 33% of all ROH identified. However, only a small number of the long ROH segments (≥ 8 Mb) was detected in this study (Table 3). Whereas long ROH are most likely observed in the genomic regions with low recombination rates and selective sweeps, small segments tend to be found at short haplotype blocks which are highly associated with high LD regions (Gibson et al., 2006). Detection of larger number of short ROH in this study could be attributed to the fact that while high level of LD (average r2 = 0.30) was observed between adjacent markers, the extension of medium LD (r2 > 0.2) was restricted to short inter-marker distances (≤40 kb). In addition, it is likely that the total number and length of ROH obtained for long segments (≥ 8 Mb) in the current study were underestimated due to short extension of scaffolds, which restricted the detection of longer ROH.
The extension of ROH can be also useful to infer the recent and ancient inbreeding events in the populations. Longer ROH are associated with recent inbreeding in the population because recombination rates would not be enough to break up long segments over a few generations. On the other hand, short tracts of homozygosity tend to be correlated with ancient inbreeding (Pemberton et al., 2012). The abundance of short ROH (< 1 Mb) in this study was in accordance with the intense reduction of population size between generation 100 and 200 (Figure 3). However, lack of chromosome-scale information and the existence of small scaffolds restricted the detection of longer ROH in this study and made it impossible to infer recent inbreeding rates.
The inbreeding rate of the studied population based on excess of homozygosity was estimated to be in a range of −0.44 to 0.34 among all individuals with an average of 0.15 over all samples. This moderate degree of inbreeding is to some extent due to positive assortative mating, which is commonly used in the mink farms. Demontis et al. (2011) reported a range of 0.02–0.29 of inbreeding rates in black American mink using DNA microsatellite markers, which was in agreement with the range obtained in the current study. However, Belliveau et al. (1999) reported a higher degree of inbreeding rate (0.271) within samples in farm and wild American mink using DNA microsatellite markers, which was attributed to linebreeding and using related males in the studied populations. In contrast, Thirstrup et al. (2015) estimated significant negative FIS (−0.150 to 0.005) using a panel of 194 SNPs, which indicated that farms were successful in preventing inbreeding. These discrepancies might be also due to the differences in number and nature of markers, and approaches used in various studies. Furthermore, FHOM values were highly correlated (0.87) with FROH (minimum length > 500 kb) across the studied samples. In accordance with the value estimated in this study, high correlations of 0.83–0.95, 0.89–0.99, 0.91–0.98 and 0.89 were also reported in Italian local cattle breeds (Mastrangelo et al., 2016), Chinese goat breeds (Islam et al., 2019), six commercial sheep breeds (Purfield et al., 2017) and four dairy cattle breeds (Ferenčaković et al., 2013), respectively. High correlation observed between FROH and FHOM suggested that the proportion of ROH regions could be an accurate estimator to reveal the inbreeding rates in the population.
Genomic selection can be developed as an efficient breeding strategy to improve the economically important traits in the mink industry (Karimi et al., 2019). Accessibility to more accurate genome assembly, designing commercial SNP panel, and collecting reliable phenotypes would be essential steps to achieve this goal in the mink industry. The results of this study can be helpful to determine the minimum distance between markers required for designing the SNP panel. Furthermore, genomic data would be useful to control the inbreeding rates and determine the genetic structure of mink populations.
Conclusion
This study provided the first draft of LD patterns across the American mink genome using GBS data. The estimated r2 > 0.2 extended up to inter-marker distances of 40 kb suggesting that at least 60,000 SNPs would be required to achieve adequate accuracy in genomic selection programs of American mink. A decreasing trend of effective population size was observed from 200 to 5 generations ago. The LD levels and ROH patterns across the genome indicated that the most rapid decline in population size occurred between 100 and 200 generations ago. Short extensions of homozygous genotypes (500 kb to 1 Mb) were abundant across the genome and were used to infer the levels of ancient inbreeding. However, the chromosomes-scale information is necessary to infer the recent inbreeding events in American mink populations. This study provided useful insights to determine the density of SNP panel providing enough statistical power and accuracy in genomic studies of American mink. Moreover, these results confirmed that GBS approach can be considered as a useful tool for genomic studies in American mink.
Data Availability Statement
The datasets generated for this study can be found in the FigShare Repository: doi: 10.6084/m9.figshare.9757784.
Ethics Statement
The animal study was reviewed and approved by the Institutional Animal Care and Use Committee.
Author Contributions
KK and YM carried out the statistical analysis and interpreted the data. AF and SM collected the genetic materials and carried out the laboratory analyses. AF and YM conceived the study and participated in its design and coordination. KK and YM wrote the manuscript. MS provided the software and supported the statistical analysis. YM and AF reviewed the manuscript. All authors read and approved the final manuscript.
Funding
Financial support was received from the Canada Mink Breeders Association, Nova Scotia Mink Breeders Association, Agriculture and Agri-Food Canada, Natural Sciences and Engineering Research Council of Canada (NSERC), and Mitacs.
Conflict of Interest
MS was employed by Select Sires Inc.
The remaining authors declare that the research was conducted in the absence of any commercial or financial relationships that could be construed as a potential conflict of interest.
Acknowledgments
We would like to acknowledge P. P. Rupasinghe and L. F. Butler for technical assistance.
Footnotes
References
Ai, H., Huang, L., and Ren, J. (2013). Genetic diversity, linkage disequilibrium and selection signatures in Chinese and western pigs revealed by genome-wide SNP markers. PLoS One 8:e56001. doi: 10.1371/journal.pone.0056001
Alhaddad, H., Khan, R., Grahn, R. A., Gandolfi, B., Mullikin, J. C., Cole, S. A., et al. (2013). Extent of linkage disequilibrium in the domestic cat, felis silvestris catus, and its breeds. PLoS One 8:e53537. doi: 10.1371/journal.pone.0053537
Aljanabi, S. M., and Martinez, I. (1997). Universal and rapid salt-extraction of high quality genomic DNA for PCR-based techniques. Nucleic Acids Res. 25, 4692–4693. doi: 10.1093/nar/25.22.4692
Allendorf, F. W., Hohenlohe, P. A., and Luikart, G. (2010). Genomics and the future of conservation genetics. Nat. Rev. Genet. 11, 697–709. doi: 10.1038/nrg2844
Al-Mamun, H. A., Clark, A. S., Kwan, P., and Gondro, C. (2015). Genome-wide linkage disequilibrium and genetic diversity in five populations of Australian domestic sheep. Genet. Select. Evol. 47:90.
Amaral, A. J., Megens, H.-J., Crooijmans, R. P. M. A., Heuven, H. C. M., and Groenen, M. A. M. (2008). Linkage disequilibrium decay and haplotype block structure in the pig. Genetics 179, 569–579. doi: 10.1534/genetics.107.084277
Ardlie, K. G., Kruglyak, L., and Seielstad, M. (2002). Patterns of linkage disequilibrium in the human genome. Nat. Rev. Genet. 3:299. doi: 10.1038/nrg777
Belliveau, A. M., Farid, A., O’connell, M., and Wright, J. M. (1999). Assessment of genetic variability in captive and wild American mink (Mustela vison) using microsatellite markers. Can. J. Anim. Sci. 79, 7–16. doi: 10.4141/a97-115
Bowness, E. R. (1996). “An historical perspective on the North American mink industry,” in Mink Biology, Health and Disease, eds D. B. Hunter and N. Lemieux (Guelph: University of Guelph), 1–9.
Cai, Z., Petersen, B., Sahana, G., Madsen, L. B., Larsen, K., Thomsen, B., et al. (2017). The first draft reference genome of the American mink (Neovison vison). Sci. Rep. 7:14564. doi: 10.1038/s41598-017-15169-z
Cai, Z., Villumsen, T. M., Asp, T., Guldbrandtsen, B., Sahana, G., and Lund, M. S. (2018). SNP markers associated with body size and pelt length in American mink (Neovison vison). BMC Genet. 19:103. doi: 10.1186/s12863-018-0688-6
Ceballos, F. C., Hazelhurst, S., and Ramsay, M. (2018). Assessing runs of Homozygosity: a comparison of SNP array and whole genome sequence low coverage data. BMC Genom. 19:106. doi: 10.1186/s12864-018-4489-0
Chitneedi, P. K., Arranz, J. J., Suarez-Vega, A., García-Gámez, E., and Gutiérrez-Gil, B. (2017). Estimations of linkage disequilibrium, effective population size and ROH-based inbreeding coefficients in Spanish Churra sheep using imputed high-density SNP genotypes. Anim. Genet. 48, 436–446. doi: 10.1111/age.12564
D’Agostino, N., Taranto, F., Camposeo, S., Mangini, G., Fanelli, V., Gadaleta, S., et al. (2018). GBS-derived SNP catalogue unveiled wide genetic variability and geographical relationships of Italian olive cultivars. Sci. Rep. 8:15877. doi: 10.1038/s41598-018-34207-y
De Donato, M., Peters, S. O., Mitchell, S. E., Hussain, T., and Imumorin, I. G. (2013). Genotyping-by-Sequencing (GBS): a novel, efficient and cost-effective genotyping method for cattle using next-generation sequencing. PLoS One 8:e62137. doi: 10.1371/journal.pone.0062137
Demontis, D., Larsen, P. F., Bækgaard, H., Sønderup, M., Hansen, B. K., Nielsen, V. H., et al. (2011). Inbreeding affects fecundity of American mink (Neovison vison) in Danish farm mink. Anim. Genet. 42, 437–439. doi: 10.1111/j.1365-2052.2010.02155.x
Deschamps, S., Llaca, V., and May, G. D. (2012). Genotyping-by-sequencing in plants. Biology 1, 460–483. doi: 10.3390/biology1030460
Du, F.-X., Clutter, A. C., and Lohuis, M. M. (2007). Characterizing linkage disequilibrium in pig populations. Int. J. Biol. Sci. 3, 166–178. doi: 10.7150/ijbs.3.166
Farid, A. H., Hussain, I., and Arju, I. (2015). Detection of Aleutian mink disease virus DNA and antiviral antibodies in American mink (Neovison vison) 10 days postinoculation. J. Vet. Diagn. Invest. 27, 287–294. doi: 10.1177/1040638715580982
Ferenčaković, M., Hamzić, E., Gredler, B., Solberg, T. R., Klemetsdal, G., Curik, I., et al. (2013). Estimates of autozygosity derived from runs of homozygosity: empirical evidence from selected cattle populations. J. Anim. Breed. Genet. 130, 286–293. doi: 10.1111/jbg.12012
Gautier, M., Faraut, T., Moazami-Goudarzi, K., Navratil, V., Foglio, M., Grohs, C., et al. (2007). Genetic and haplotypic structure in 14 European and African cattle breeds. Genetics 177, 1059–1070. doi: 10.1534/genetics.107.075804
Gibson, J., Morton, N. E., and Collins, A. (2006). Extended tracts of homozygosity in outbred human populations. Hum. Mol. Genet. 15, 789–795. doi: 10.1093/hmg/ddi493
Goddard, M. E., Kemper, K. E., Macleod, I. M., Chamberlain, A. J., and Hayes, B. J. (2016). Genetics of complex traits: prediction of phenotype, identification of causal polymorphisms and genetic architecture. Proc. Biol. Sci. 283:20160569. doi: 10.1098/rspb.2016.0569
Gurgul, A., Miksza-Cybulska, A., Szmatoła, T., Jasielczuk, I., Piestrzyńska-Kajtoch, A., Fornal, A., et al. (2019). Genotyping-by-sequencing performance in selected livestock species. Genomics 111, 186–195. doi: 10.1016/j.ygeno.2018.02.002
Gutiérrez-Gil, B., Arranz, J. J., and Wiener, P. (2015). An interpretive review of selective sweep studies in Bos taurus cattle populations: identification of unique and shared selection signals across breeds. Front. Genet. 6:167. doi: 10.3389/fgene.2015.00167
Hayes, B. J., Visscher, P. M., Mcpartlan, H. C., and Goddard, M. E. (2003). Novel multilocus measure of linkage disequilibrium to estimate past effective population size. Genom. Res. 13, 635–643. doi: 10.1101/gr.387103
Hill, W. G., and Robertson, A. (1968). Linkage disequilibrium in finite populations. Theoretic. Appl. Genet. 38, 226–231. doi: 10.1007/bf01245622
Huang, Y.-F., Poland, J. A., Wight, C. P., Jackson, E. W., and Tinker, N. A. (2014). Using genotyping-by-sequencing (GBS) for genomic discovery in cultivated oat. PLoS One 9:e102448. doi: 10.1371/journal.pone.0102448
Islam, R., Li, Y., Liu, X., Berihulay, H., Abied, A., Gebreselassie, G., et al. (2019). Genome-wide runs of homozygosity, effective population size, and detection of positive selection signatures in six Chinese goat breeds. Genes 10:938. doi: 10.3390/genes10110938
Johnson, J. L., Wittgenstein, H., Mitchell, S. E., Hyma, K. E., Temnykh, S. V., Kharlamova, A. V., et al. (2015). Genotyping-By-sequencing (GBS) detects genetic structure and confirms behavioral QTL in tame and aggressive foxes (Vulpes vulpes). PLoS One 10:e0127013. doi: 10.1371/journal.pone.0127013
Kardos, M., Taylor, H. R., Ellegren, H., Luikart, G., and Allendorf, F. W. (2016). Genomics advances the study of inbreeding depression in the wild. Evol. Appl. 9, 1205–1218. doi: 10.1111/eva.12414
Karimi, K., Esmailizadeh Koshkoiyeh, A., Asadi Fozi, M., Porto-Neto, L. R., and Gondro, C. (2016). Prioritization for conservation of Iranian native cattle breeds based on genome-wide SNP data. Conserv. Genet. 17, 77–89. doi: 10.1007/s10592-015-0762-9
Karimi, K., Esmailizadeh Koshkoiyeh, A., and Gondro, C. (2015). Comparison of linkage disequilibrium levels in Iranian indigenous cattle using whole genome SNPs data. J. Anim. Sci. Technol. 57:47. doi: 10.1186/s40781-015-0080-2
Karimi, K., Sargolzaei, M., Plastow, G. S., Wang, Z., and Miar, Y. (2019). Opportunities for genomic selection in American mink: a simulation study. PLoS One 14:e0213873. doi: 10.1371/journal.pone.0213873
Khatkar, M. S., Nicholas, F. W., Collins, A. R., Zenger, K. R., Cavanagh, J. A., Barris, W., et al. (2008). Extent of genome-wide linkage disequilibrium in Australian Holstein-Friesian cattle based on a high-density SNP panel. BMC Genom. 9:187. doi: 10.1186/1471-2164-9-187
Kijas, J. W., Porto-Neto, L., Dominik, S., Reverter, A., Bunch, R., Mcculloch, R., et al. (2014). Linkage disequilibrium over short physical distances measured in sheep using a high-density SNP chip. Anim. Genet. 45, 754–757. doi: 10.1111/age.12197
Kirin, M., Mcquillan, R., Franklin, C. S., Campbell, H., Mckeigue, P. M., and Wilson, J. F. (2010). Genomic runs of homozygosity record population history and consanguinity. PLoS One 5:e13996. doi: 10.1371/journal.pone.0013996
Lecis, R., Ferrando, A., Ruiz-Olmo, J., Mañas, S., and Domingo-Roura, X. (2008). Population genetic structure and distribution of introduced American mink (Mustela vison) in Spain, based on microsatellite variation. Conserv. Genet. 9, 1149–1161. doi: 10.1007/s10592-007-9428-6
Lewontin, R. C. (1964). The interaction of selection and linkage. I. General considerations; heterotic models. Genetics 49:49.
Li, H., and Durbin, R. (2009). Fast and accurate short read alignment with burrows–wheeler transform. Bioinformatics 25, 1754–1760. doi: 10.1093/bioinformatics/btp324
Liu, S., He, S., Chen, L., Li, W., Di, J., and Liu, M. (2017). Estimates of linkage disequilibrium and effective population sizes in Chinese Merino (Xinjiang type) sheep by genome-wide SNPs. Genes Genom. 39, 733–745. doi: 10.1007/s13258-017-0539-2
Makina, S. O., Taylor, J. F., Van Marle-Köster, E., Muchadeyi, F. C., Makgahlela, M. L., Macneil, M. D., et al. (2015). Extent of linkage disequilibrium and effective population size in four South African Sanga cattle breeds. Front. Genet. 6:337. doi: 10.3389/fgene.2015.00337
Martin, M. (2011). Cutadapt removes adapter sequences from high-throughput sequencing reads. EMBnet J. 17:3.
Mastrangelo, S., Tolone, M., Di Gerlando, R., Fontanesi, L., Sardina, M. T., and Portolano, B. (2016). Genomic inbreeding estimation in small populations: evaluation of runs of homozygosity in three local dairy cattle breeds. Animal 10, 746–754. doi: 10.1017/S1751731115002943
Mastrangelo, S., Tolone, M., Sardina, M. T., Sottile, G., Sutera, A. M., Di Gerlando, R., et al. (2017). Genome-wide scan for runs of homozygosity identifies potential candidate genes associated with local adaptation in Valle del Belice sheep. Genet. Select. Evol. 49, 84–84. doi: 10.1186/s12711-017-0360-z
McKay, S. D., Schnabel, R. D., Murdoch, B. M., Matukumalli, L. K., Aerts, J., Coppieters, W., et al. (2007). Whole genome linkage disequilibrium maps in cattle. BMC Genet. 8:74. doi: 10.1186/1471-2156-8-74
McKenna, A., Hanna, M., Banks, E., Sivachenko, A., Cibulskis, K., Kernytsky, A., et al. (2010). The genome analysis toolkit: a mapreduce framework for analyzing next-generation DNA sequencing data. Genom. Res. 20, 1297–1303. doi: 10.1101/gr.107524.110
McQuillan, R., Leutenegger, A.-L., Abdel-Rahman, R., Franklin, C. S., Pericic, M., Barac-Lauc, L., et al. (2008). Runs of homozygosity in european populations. Am. J. Hum. Genet. 83, 359–372. doi: 10.1016/j.ajhg.2008.08.007
Meadows, J. R. S., Chan, E. K. F., and Kijas, J. W. (2008). Linkage disequilibrium compared between five populations of domestic sheep. BMC Genet. 9:61. doi: 10.1186/1471-2156-9-61
Meuwissen, T. H. E. (2009). Accuracy of breeding values of ‘unrelated’ individuals predicted by dense SNP genotyping. Genet. Select. Evol. 41:35. doi: 10.1186/1297-9686-41-35
Pemberton, T. J., Absher, D., Feldman, M. W., Myers, R. M., Rosenberg, N. A., and Li, J. Z. (2012). Genomic patterns of homozygosity in worldwide human populations. Am. J. Hum. Genet. 91, 275–292. doi: 10.1016/j.ajhg.2012.06.014
Pengelly, R. J., Gheyas, A. A., Kuo, R., Mossotto, E., Seaby, E. G., Burt, D. W., et al. (2016). Commercial chicken breeds exhibit highly divergent patterns of linkage disequilibrium. Heredity 117, 375–382. doi: 10.1038/hdy.2016.47
Peripolli, E., Stafuzza, N. B., Munari, D. P., Lima, A. L. F., Irgang, R., Machado, M. A., et al. (2018). Assessment of runs of homozygosity islands and estimates of genomic inbreeding in Gyr (Bos indicus) dairy cattle. BMC Genom. 19:34. doi: 10.1186/s12864-017-4365-3
Porto-Neto, L. R., Kijas, J. W., and Reverter, A. (2014). The extent of linkage disequilibrium in beef cattle breeds using high-density SNP genotypes. Genet. Select. Evol. 46, 22–22.
Prieur, V., Clarke, S. M., Brito, L. F., Mcewan, J. C., Lee, M. A., Brauning, R., et al. (2017). Estimation of linkage disequilibrium and effective population size in New Zealand sheep using three different methods to create genetic maps. BMC Genet. 18:68. doi: 10.1186/s12863-017-0534-2
Purfield, D. C., Mcparland, S., Wall, E., and Berry, D. P. (2017). The distribution of runs of homozygosity and selection signatures in six commercial meat sheep breeds. PLoS One 12:e0176780. doi: 10.1371/journal.pone.0176780
Rabier, C.-E., Barre, P., Asp, T., Charmet, G., and Mangin, B. (2016). On the accuracy of genomic selection. PLoS One 11:e0156086. doi: 10.1371/journal.pone.0156086
Rodríguez-Ramilo, S. T., Fernández, J., Toro, M. A., Hernández, D., and Villanueva, B. (2015). Genome-wide estimates of coancestry, inbreeding and effective population size in the Spanish Holstein population. PLoS One 10:e0124157. doi: 10.1371/journal.pone.0124157
Tapio, M., and Uimari, P. (2011). Extent of linkage disequilibrium and effective population size in finnish landrace and finnish yorkshire pig breeds. J. Anim. Sci. 89, 609–614. doi: 10.2527/jas.2010-3249
Theodorou, K., and Couvet, D. (2006). On the expected relationship between inbreeding, fitness, and extinction. Genet. Select. Evol. 38, 371–387.
Thirstrup, J. P., Ruiz-Gonzalez, A., Pujolar, J. M., Larsen, P. F., Jensen, J., Randi, E., et al. (2015). Population genetic structure in farm and feral American mink (Neovison vison) inferred from RAD sequencing-generated single nucleotide polymorphisms1. J. Anim. Sci. 93, 3773–3782. doi: 10.2527/jas.2015-8996
Xu, Z., Sun, H., Zhang, Z., Zhao, Q., Olasege, B. S., Li, Q., et al. (2019). Assessment of autozygosity derived from runs of homozygosity in jinhua pigs disclosed by sequencing data. Front. Genet. 10:274. doi: 10.3389/fgene.2019.00274
Keywords: American mink, genotyping-by-sequencing, single nucleotide polymorphism, linkage disequilibrium, effective population size, inbreeding rate
Citation: Karimi K, Farid AH, Sargolzaei M, Myles S and Miar Y (2020) Linkage Disequilibrium, Effective Population Size and Genomic Inbreeding Rates in American Mink Using Genotyping-by-Sequencing Data. Front. Genet. 11:223. doi: 10.3389/fgene.2020.00223
Received: 02 September 2019; Accepted: 26 February 2020;
Published: 13 March 2020.
Edited by:
Shikai Liu, Ocean University of China, ChinaReviewed by:
Umesh K. Reddy, West Virginia State University, United StatesMaja Ferenčaković, University of Zagreb, Croatia
Copyright © 2020 Karimi, Farid, Sargolzaei, Myles and Miar. This is an open-access article distributed under the terms of the Creative Commons Attribution License (CC BY). The use, distribution or reproduction in other forums is permitted, provided the original author(s) and the copyright owner(s) are credited and that the original publication in this journal is cited, in accordance with accepted academic practice. No use, distribution or reproduction is permitted which does not comply with these terms.
*Correspondence: Younes Miar, bWlhckBkYWwuY2E=