 Wanmeng Xiao
 Zhanshan (Sam) Ma
- 1Computational Biology and Medical Ecology Laboratory, State Key Laboratory of Genetic Resources and Evolution, Kunming Institute of Zoology, Chinese Academy of Sciences, Kunming, China
- 2Kunming College of Life Sciences, University of Chinese Academy of Sciences, Kunming, China
- 3Center for Excellence in Animal Evolution and Genetics, Chinese Academy of Sciences, Kunming, China
The human virome is a critical component of the human microbiome, and it is believed to hold the richest diversity within human microbiomes. Yet, the inter-individual scaling (changes) of the human virome has not been formally investigated to the best of our knowledge. Here we fill the gap by applying diversity-area relationship (DAR) modeling (a recent extension to the classic species-area law in biodiversity and biogeography research) for analyzing four large datasets of the human virome with three DAR profiles: DAR scaling (z)—measuring the inter-individual heterogeneity in virome diversity, MAD (maximal accrual diversity: Dmax) and LGD ratio (ratio of local diversity to global diversity)—measuring the percentage of individual to population level diversity. Our analyses suggest: (i) The diversity scaling parameter (z) is rather resilient against the diseases as indicated by the lack of significant differences between the healthy and diseased treatments. (ii) The potential maximal accrual diversity (Dmax) is less resilient and may vary between the healthy and diseased groups or between different body sites. (iii) The LGD ratio of bacterial communities is much smaller than for viral communities, and relates to the comparatively greater heterogeneity between local vs. global diversity levels found for bacterial-biomes.
Introduction
Viruses spread over almost every ecosystem and are believed to be the most abundant biological entity on the earth (Breitbart and Rohwer, 2005; Edwards and Rohwer, 2005; Cobiaìn Güemes et al., 2016; Berliner et al., 2018). Viruses also parasitize in different parts of human body, including blood, cerebrospinal fluid, nasal cavity, oral cavity, skin, vagina, lungs and gastrointestinal (GI) tract (Nakamura et al., 2009; Ly et al., 2014; Wylie et al., 2014; Hannigan et al., 2015; Santiago-Rodriguez et al., 2015; Columpsi et al., 2016; Abbas et al., 2017; Thannesberger et al., 2017; Pannaraj et al., 2018; Ghose et al., 2019). The human virome includes endogenous retroviruses, eukaryotic viruses that infect human cells, bacteriophages that infect bacteria, and viruses that infect archaea (Zhao et al., 2017; Santiago-Rodriguez and Hollister, 2019). In addition to the well-known human health effects of the human immunodeficiency virus (HIV), Ebola virus, and influenza virus, changes in the composition and diversity of virome have been found in many diseases, such as cystic fibrosis, periodontal disease, urinary tract infections, and inflammatory bowel disease (Willner et al., 2009; Ly et al., 2014; Norman et al., 2015; Santiago-Rodriguez et al., 2015; Carding et al., 2017). Bacteriophages can also affect human health by influencing the composition of the bacterial communities in the body (Barr et al., 2013; Carding et al., 2017; Galtier et al., 2017; Hannigan et al., 2018). In addition, phages were briefly used to treat bacterial infections in humans prior to the inventions of antibiotics; today phage therapy is still confined to laboratory and animal models (Debarbieux et al., 2013). In summary, the influences of viruses on human health are not limited to the their pathogenicity. There are complex interactions and even co-evolution between viruses and hosts (Parker, 2016).
But why have the studies of human virome, a vital part of human microbiomes, been behind those of bacteria and fungi? Different from prokaryotes and eukaryotes, the virome does not encode commonly conservative genes, and is highly diversified in genes (Carding et al., 2017). However, with the development of high-throughput sequencing technology, metagenomic sequencing and the application of many effective bioinformatics approaches, human virome studies have stepped into an era of rapid development (Reyes et al., 2012; Garmaeva et al., 2019). The Global Virome Project (GVP) launched recently (Carroll et al., 2018) is aimed to identify and characterize most of the currently unknown viruses in major wildlife populations, including rodents, non-human primates and bats. A number of studies have shown that human gut virome is stable in individuals over a certain period of time, but shows high heterogeneity among individuals (Minot et al., 2011, 2013; Carding et al., 2017; Clooney et al., 2019; Shkoporov et al., 2019).
Here we apply the diversity-area relationship (DAR) model, an extension of the classical species-area relationship (SAR) model, to measure the diversity changes (scaling) of human viral communities from multiple perspectives (Watson, 1835; Arrhenius, 1921; Preston, 1960, 1962; Ma, 2018, 2019). Specifically, four diversity-scaling profiles were used to characterize the spatial (inter-individual) heterogeneity, community similarity, potential diversity, and the ratio of local diversity to global accrual diversity of human virome in health and disease.
Materials and Methods
Datasets Description
We collected four human virome datasets from NCBI (Table 1). Data-1 consists of 147 bronchoalveolar lavage samples taken from lung donors and recipients in the United States, and 34 blood serum samples taken by lung transplant recipients. The bronchoalveolar lavage samples contain 80 PGD (Primary Graft Dysfunction) samples and 67 control samples, the blood serum samples contain 18 PGD samples and 16 control samples. The feces sample of Data-2 were from healthy Amerindian children in four different places in Venezuela, including 20 samples from Urban A, 10 samples from Village B, 16 samples from Village C, and 15 samples from Village D. Data-3 consisted of 10 IBD patients and five healthy subjects from Canada, including six CD (Crohn’s disease) samples, four UC (ulcerative colitis) samples, and five Control samples. Data-4 is a collection of stool samples collected from the Hadza Hunter-gatherers of Tanzania and covering five sub-seasons, including 30 matched viral and bacterial sample.
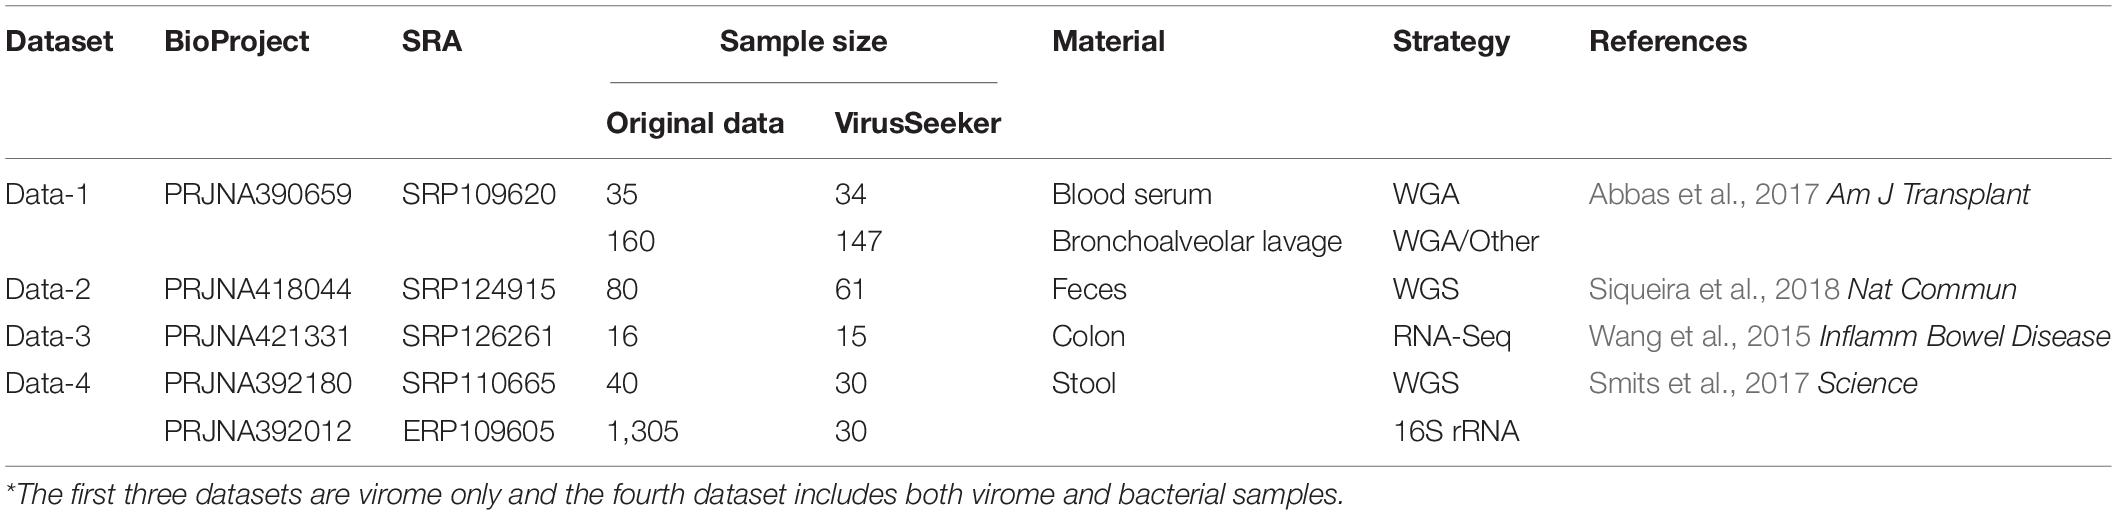
Table 1. A brief description on the virome datasets reanalyzed in this study*.
Bioinformatics Pipeline for Bacterial Sequences
All raw sequences were processed by QIIME2 v2018-06 (Bolyen et al., 2018) pipeline to get the OTU (operational taxonomic unit) tables. Sequences were denoised by the DADA2 plugin and taxonomic classification was performed using the Greengenes database and QIIME feature-classifier classify-sklearn plugin.
Bioinformatics Pipeline for Viral Sequences
Analysis of all viral sequences was based on the VirusSeeker-Virome pipeline (Zhao et al., 2017), included the following 10 steps: (1) Extract the SRA data using the fastq-dump tool of the NCBI SRA Toolkit v2.9.21; (2) Stitch read1 and read2 together using fastq-join in the ea-utils package2 (Aronesty, 2011); (3) Sequences quality control using PRINSEQ v0.20.4 (Schmieder and Edwards, 2011); (4) Run seqtk to convert fastq format to fasta format3; (5) For further sequences quality control, run Tantan v13 (Frith, 2011) and RepeatMasker v2.14 (Smit et al., 2013–2015) to screen interspersed repeats and low complexity DNA sequences; (6) Remove human sequences by aligning sequences to reference genome (GRCh37/hg19) using BWA-MEM v0.7.11 (Li and Durbin, 2010; L = 100,100; k = 15) and MegaBLAST (ncbi-blast v2.6.0+, E-value = 1e–9); (7) Input remaining reads to blastn (ncbi-blast v2.6.0+, E-value = 1e–2) alignment against the virus-only nucleotide database and blastx (ncbi-blast v2.6.0+, E-value = 1e–2) against the virus-only protein database; (8) The leftover candidate eukaryotic viral sequences were sequentially searched and mapped against the NCBI Bacteria reference genomes using BWA-MEM (-k = 15), NT database using MegaBLAST (E-value = 1e–8), blastn (E-value = 1e–8), and NCBI NR database using blastx (E-value = 1e–8); (9) Got a summary including “phage,” “ambiguous,” “unassigned,” and “assignment”; (10) Generated viral OTU tables based on assignment report.
DAR (Diversity-Area Relationship) Analysis
DAR analysis is implemented through the DAR model, involving the PL (power law) model and the PLEC (power law with exponential cutoff) model (Ma, 2018, 2019). The DAR model extended the classical ecological power law of species-area relationship (SAR), by replacing the species richness (number of species or OTUs) in the classic law with more general community diversity metrics measured in Hill Numbers (Chao et al., 2012, 2014a,b).
The relationship between diversity and area conform to the power law function:
where qD represents the diversity of measured by Hill numbers when order is q, A is area, and c and z are parameters of the power law scale model. In addition, Ma extended the general power law to an exponential cutoff power law scale model (Ma, 2018, 2019), and the PLEC model was initially applied to SAR modeling (Plotkin et al., 2000; Ulrich and Buszko, 2003; Tjørve, 2009):
where d is the third parameter of the power law equation, and exp(dA) is the exponential decay term.
After log-linear transformation of the above power law equation, which can be used to estimate DAR model parameters:
When no natural order exists among samples, or the order (permutation) information is not available, the choice of an arbitrary permutation may be problematic. To avoid this potential bias, we re-sampled all the virome and bacterial datasets, that is, we randomly selected 100 permutations after permutation of all the samples in each dataset to fit the DAR model, and finally used the average parameters of the 100 models as the final DAR model. Meanwhile, the goodness-of-fitting can be judged based on the linear correlation coefficient R and p-value. Ma (2018) also defined four diversity-scaling profiles based on the DAR model:
(i) DAR profile: The relationship between diversity scaling parameter (z) and diversity order (q) of DAR-PL model was defined as DAR profile.
(ii) PDO (pair-wise diversity overlap) profile: The relationship between parameter g and diversity order (q) of DAR-PL model was defined as PDO profile. Parameter g measures the diversity overlap of two areas,
where z is the parameters in equation (1).
(iii) MAD (maximum accrual diversity) profile: The MAD can be derived from the following equation based on the parameter of DAR-PLEC model:
where A_max =–z/d, which represents the area when the diversity is maximized. The relationship between MAD and the diversity order (q) was defined as MAD Profile:
(iv) LGD (the ratio of local diversity to global accrual diversity) profile: Li and Ma (2019) defined the ratio of sample diversity to global diversity as LGD:
where c is the parameter of Equations (1) at q-th diversity order, and Dmax corresponding to the diversity order can be obtained by equation (6). The relationship between LGD and the diversity order was defined as LGD profile. To test whether there are significant differences in DAR parameters between different subsets in the four virus datasets, we performed a permutation (randomization) test (Ma, 2018; Li and Ma, 2019; Ma and Li, 2019). Figure 1 displayed the workflow of the VirusSeeker pipeline and subsequent steps for DAR analysis using the viral OTU table.
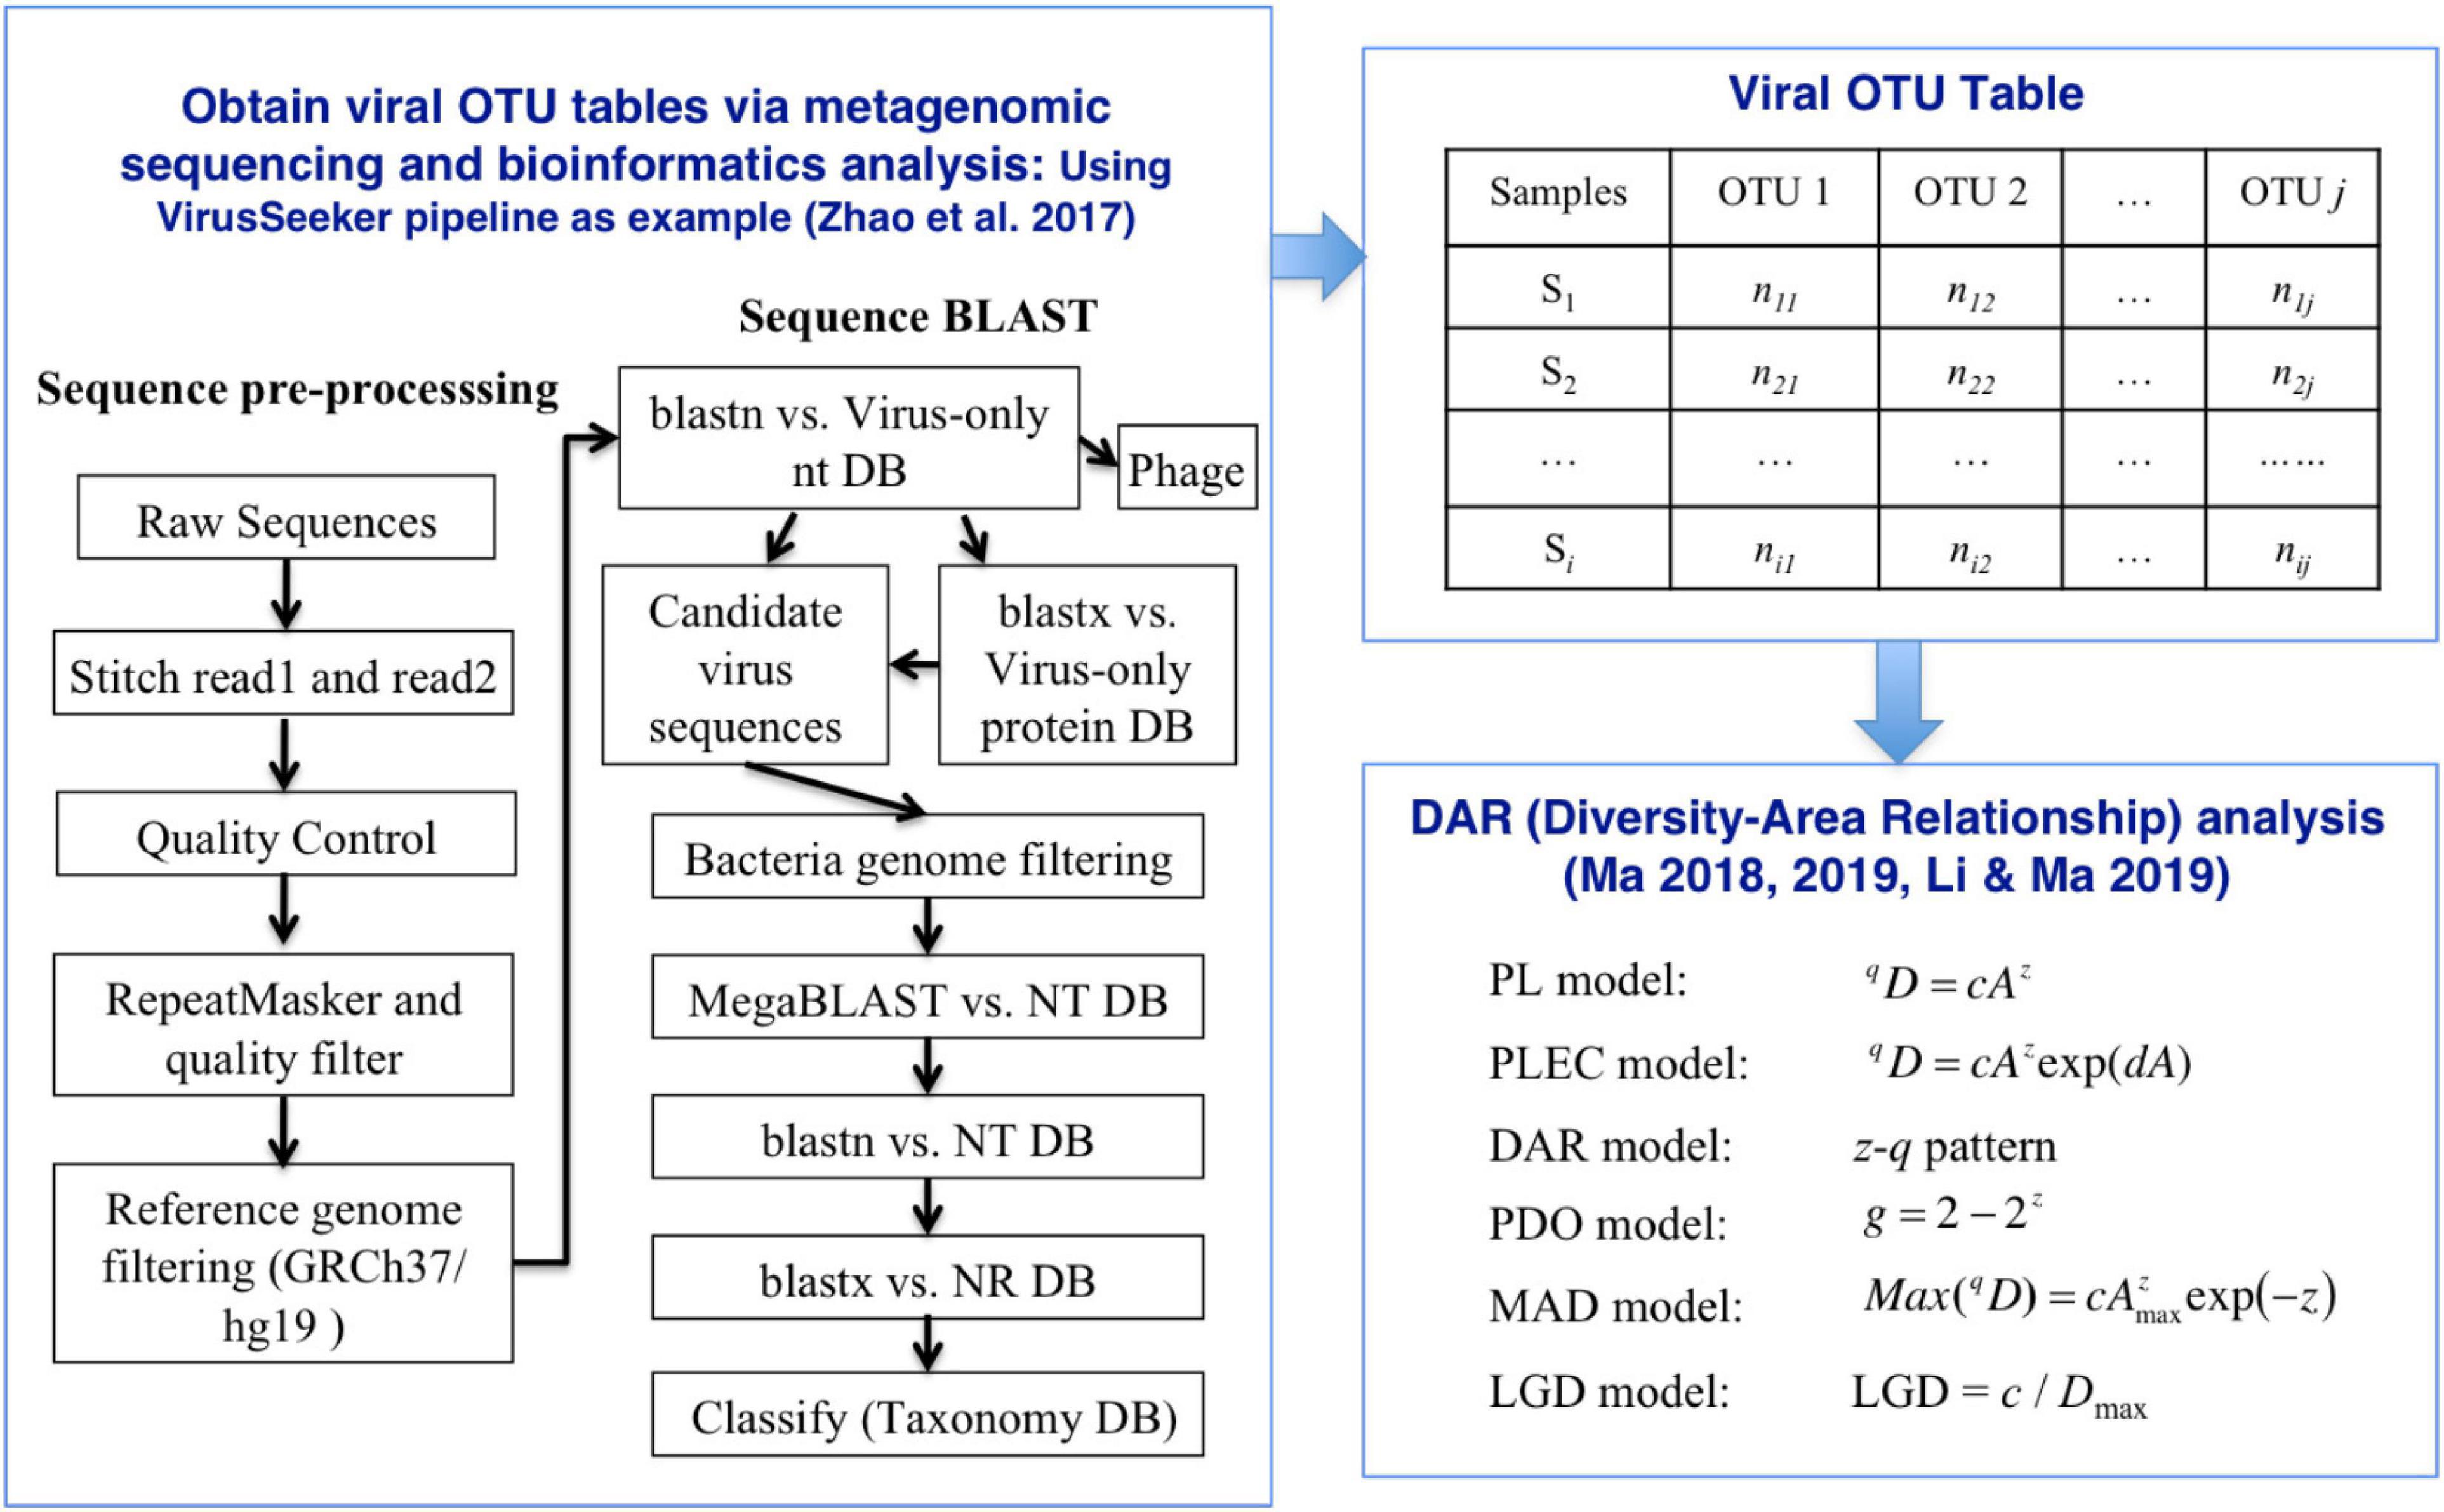
Figure 1. The process of inter-individual diversity scaling analysis of human virome with diversity-area relationship (DAR) modeling.
Results
Fitting DAR Models
After an initial bioinformatics analysis of four datasets, we fitted the DAR-PL and DAR-PLEC models to the three datasets of virome datasets and one bacteria-virome dataset. Table 2 shows the changes in the number of viral sequences during data processing, and Table 3 lists all parameters related to model fitting. Table 4 gives the results of the permutation test for three virome datasets. Although the four datasets cover different disease types, sampling sites, and microbial types, the results show that all datasets confirmed to the DAR-PL and DAR-PLEC models, with p-value < 0.05. After 100 re-sampling for the four datasets, data-1, data-2, data-4 and the CD group of data-3 fully followed the DAR-PL pattern at the species richness level (q = 0), but some groups were not fitted successfully in the higher diversity order. At higher diversity orders, some model fittings failures occurred.

Table 2. Summary of changes in the number of viral sequences*.
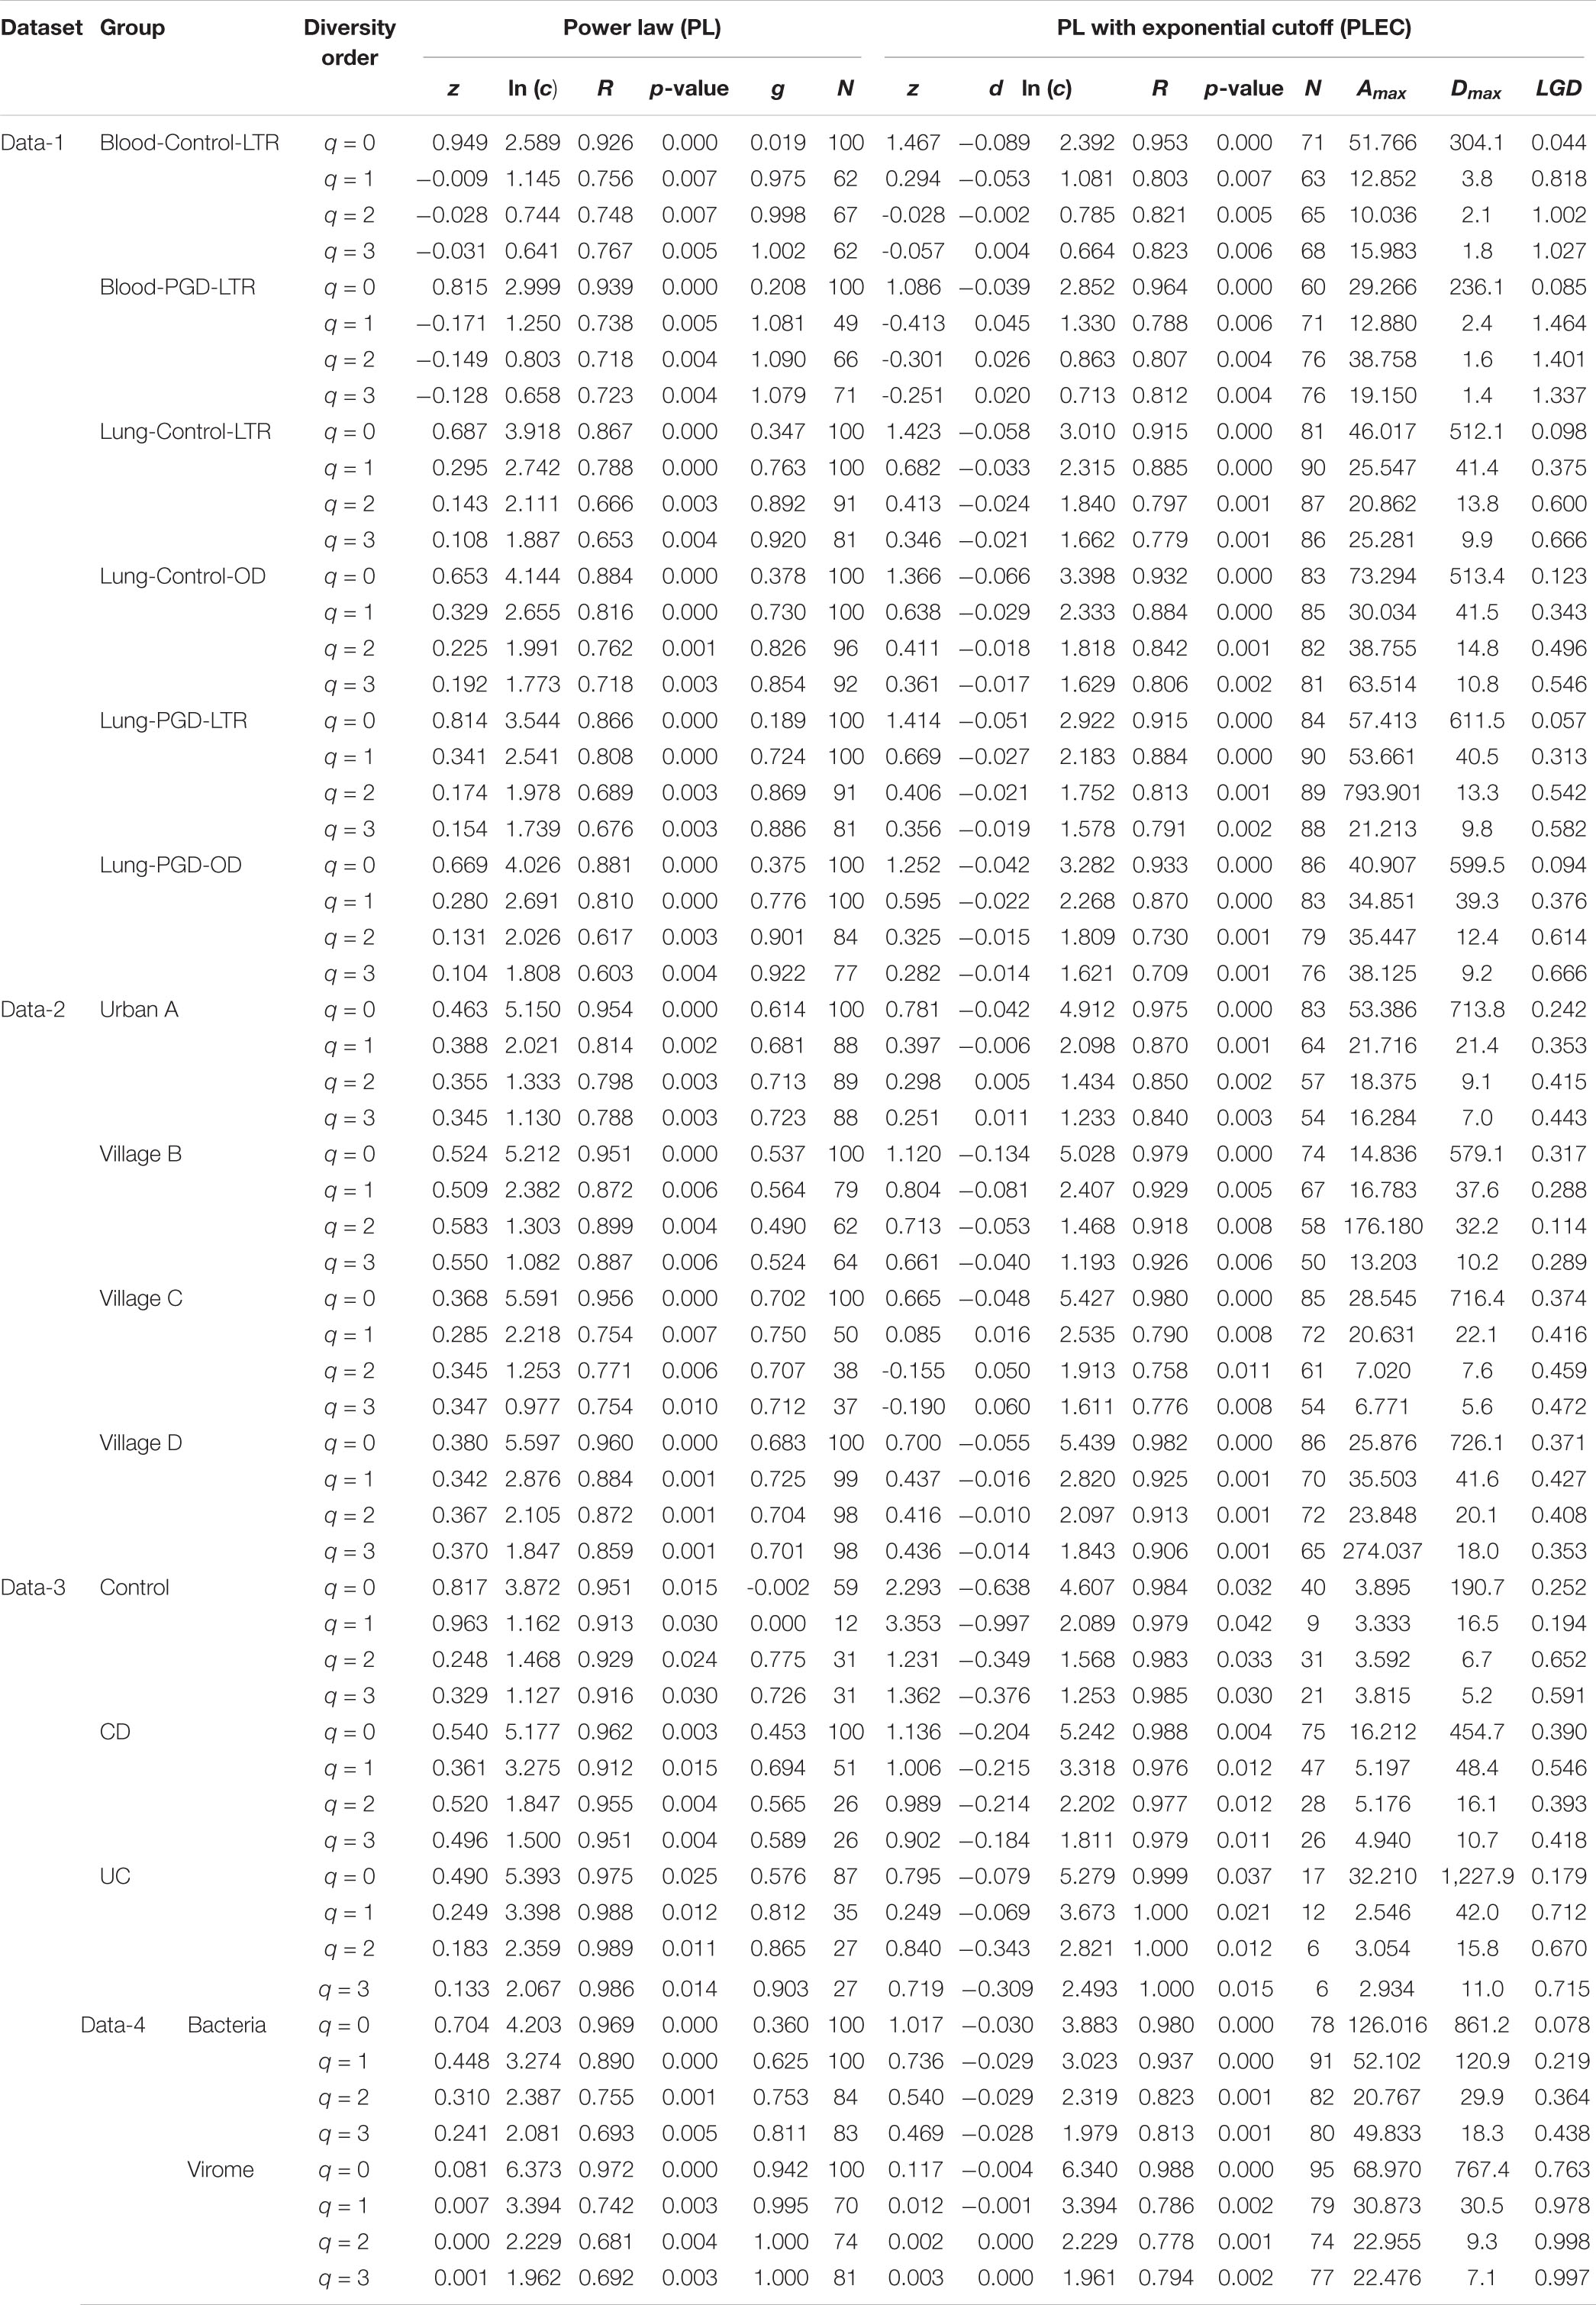
Table 3. Fitting the DAR (diversity-area relationship) models (with 100 times of random permutations of samples) for the four virome datasets.
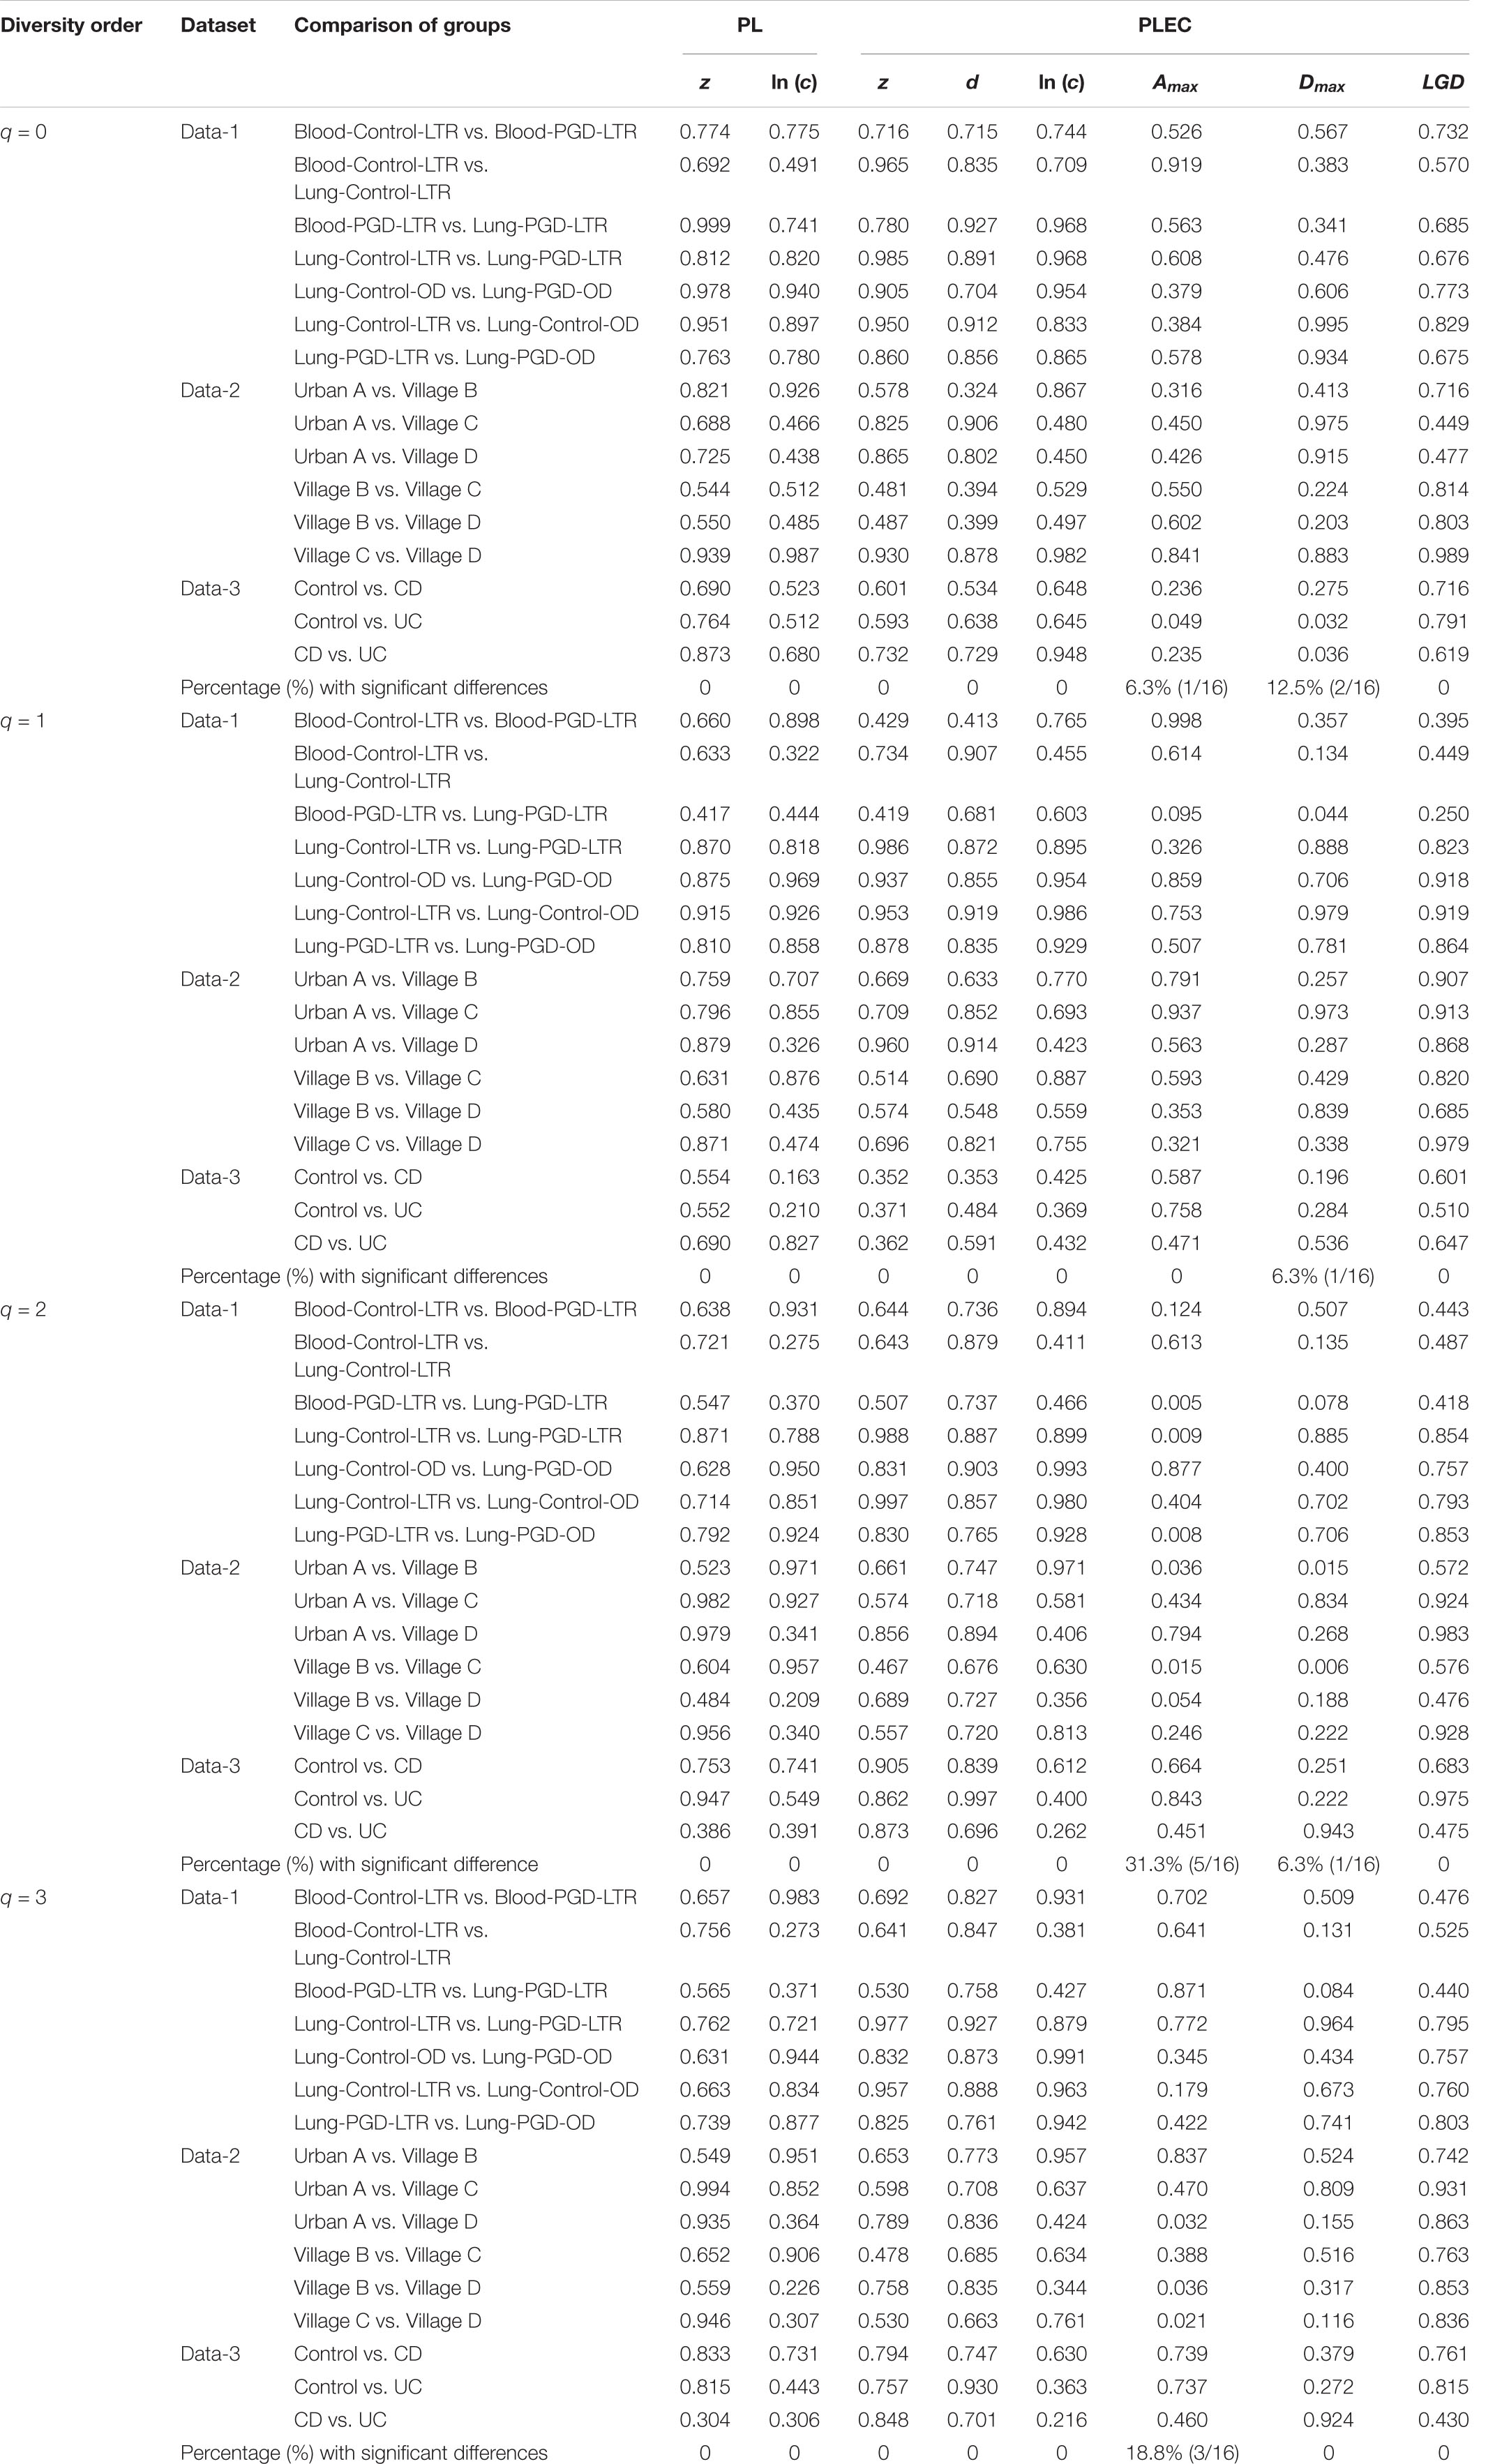
Table 4. The p-values of the permutation tests for the differences in the parameters of the DAR models between each pair-wise comparison of three virome datasets.
DAR Profiles
With the exception of a few groups, the patterns of the four DAR profiles across the four datasets are consistent in general (Table 3). Data-1 and Data-3 were the comparison between the healthy group and the disease group. Although the disease types were different, the variation patterns of the DAR parameters are similar in general. The results in Table 4 show that there was no significant difference in the diversity scaling parameter (z) and the pair-wise diversity overlap (g) among three virome datasets. However, the estimators of the maximal accrual diversity (Dmax) between the Control group and the UC group and between the CD group and the UC group presented significant difference when q = 0. In addition, the results of Data-4 show that bacterial community and virome community had different LGD ratios. And based on Table 3, we also have the following findings:
(i) The DAR profile: The parameter of diversity scaling (z) of Data-1 (the Blood-Control-LTR group: z = 0.949, −0.009, −0.028, −0.031; the Lung-Control-LTR group: z = 0.687, 0.295, 0.143, 0.108; the Lung-Control-OD group: z = 0.653, 0.329, 0.225, 0.192; the Lung-PGD-LTR group: z = 0.814, 0.341, 0.174, 0.154; the Lung-PGD-OD group: z = 0.669, 0.280, 0.131, 0.104), the Urban A group (z = 0.463, 0.388, 0.355, 0.345) of Data-2, the UC group (z = 0.490, 0.249, 0.183, 0.133) of Data-3 and the bacteria group (z = 0.704, 0.448, 0.310, 0.241) of Data-4 all decreased with the rise of the diversity order, Figure 2 shows the downward trend of parameter z in Data-1. But the parameter z of the Blood-Control-LTR group in Data-1, the Village C and Village D group in Data-2 were the largest when q = 0, and had the minimum value when q = 1, and then enlarge with the increase of diversity order (q > 0). When the diversity order q = 0, the difference in species number among individuals in each group was measured; When q > 0, the DAR profile measured the difference in the diversity of dominant species and the number of each species among individuals in each group. With the increase of the diversity order, the proportion of dominant species in the calculation process increased. These suggested that at the lower level of diversity, the higher heterogeneity within the group, indicating the greater difference between individuals within the group. It also should be noted that there was no significant difference in the parameter z among all groups, even between the healthy and diseased groups.
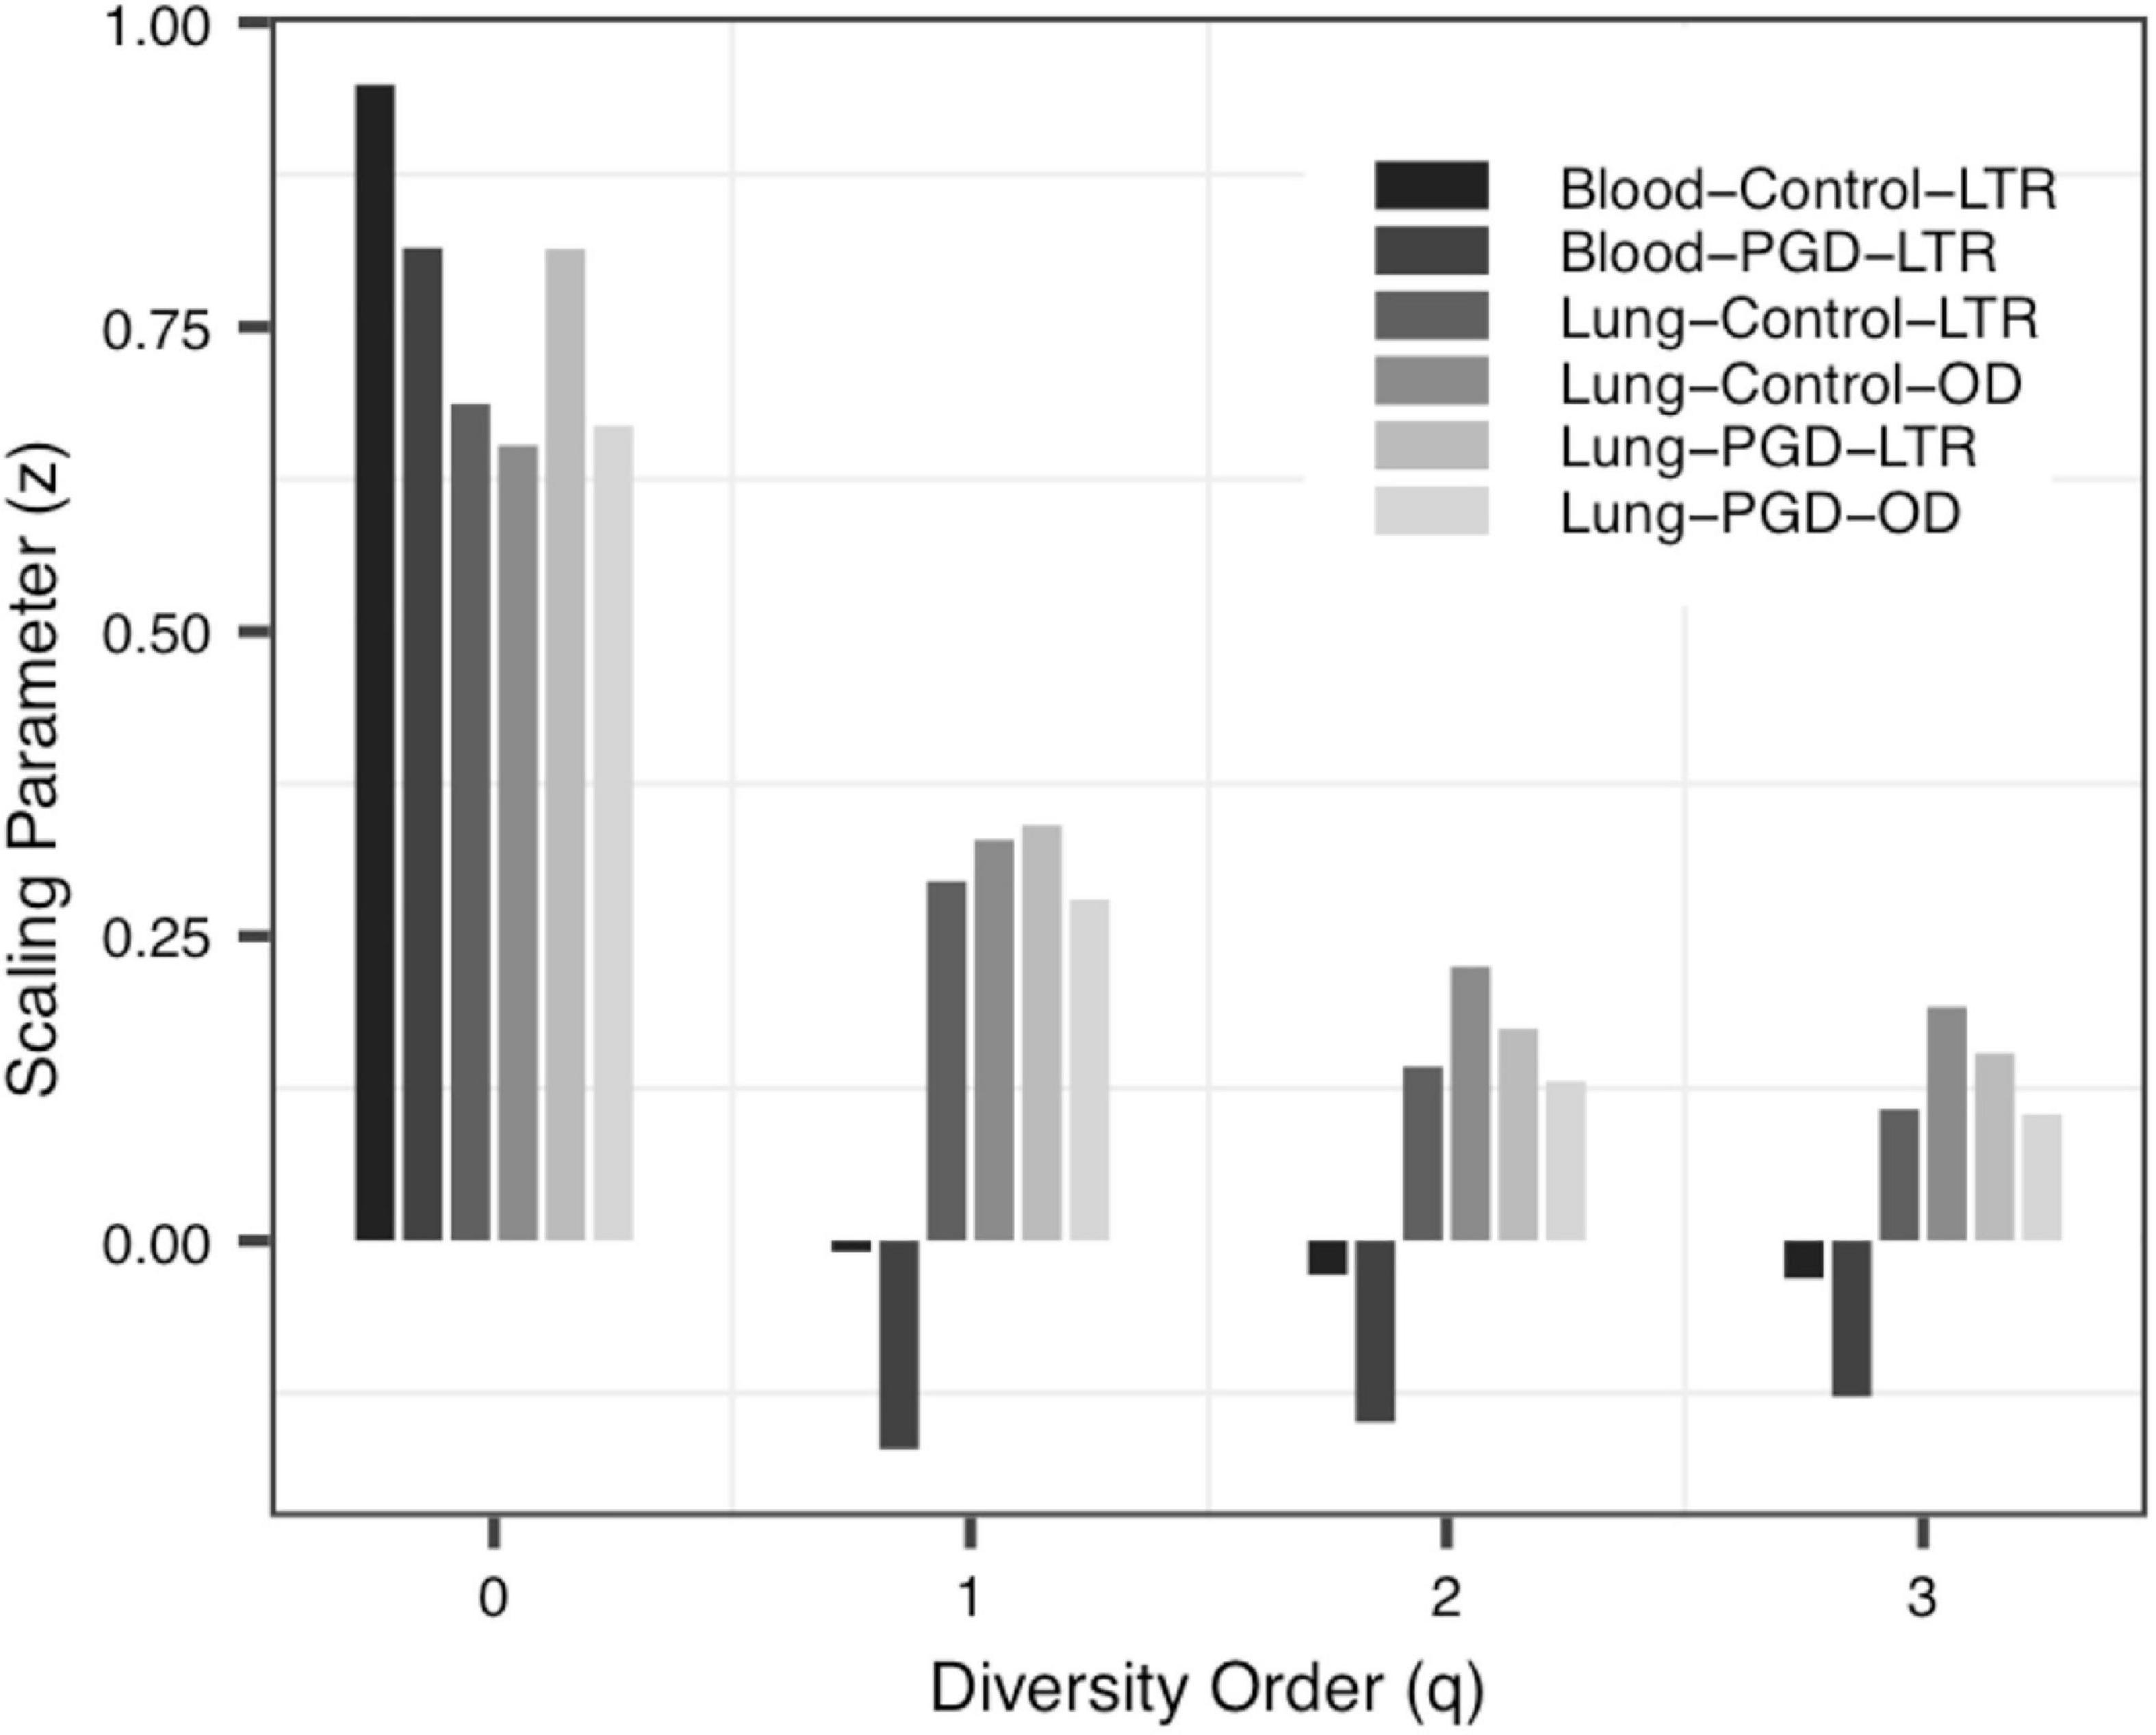
Figure 2. The DAR (diversity-area relationship) profiles of Data-1.
(ii) The PDO profile: In all datasets, the pair-wise diversity overlap (g) of more than half of the groups grew with the increase of the order of diversity. Although the g varies among individuals with different tissue types, different health conditions and different living environments, there is no significant difference. And the larger the g was, the higher the degree of overlap was. Thus, the difference between the individuals within the group at the low diversity order was greater than that at the high diversity order (q = 0 − 1), Figure 3 shows the variation of g in Data-2.
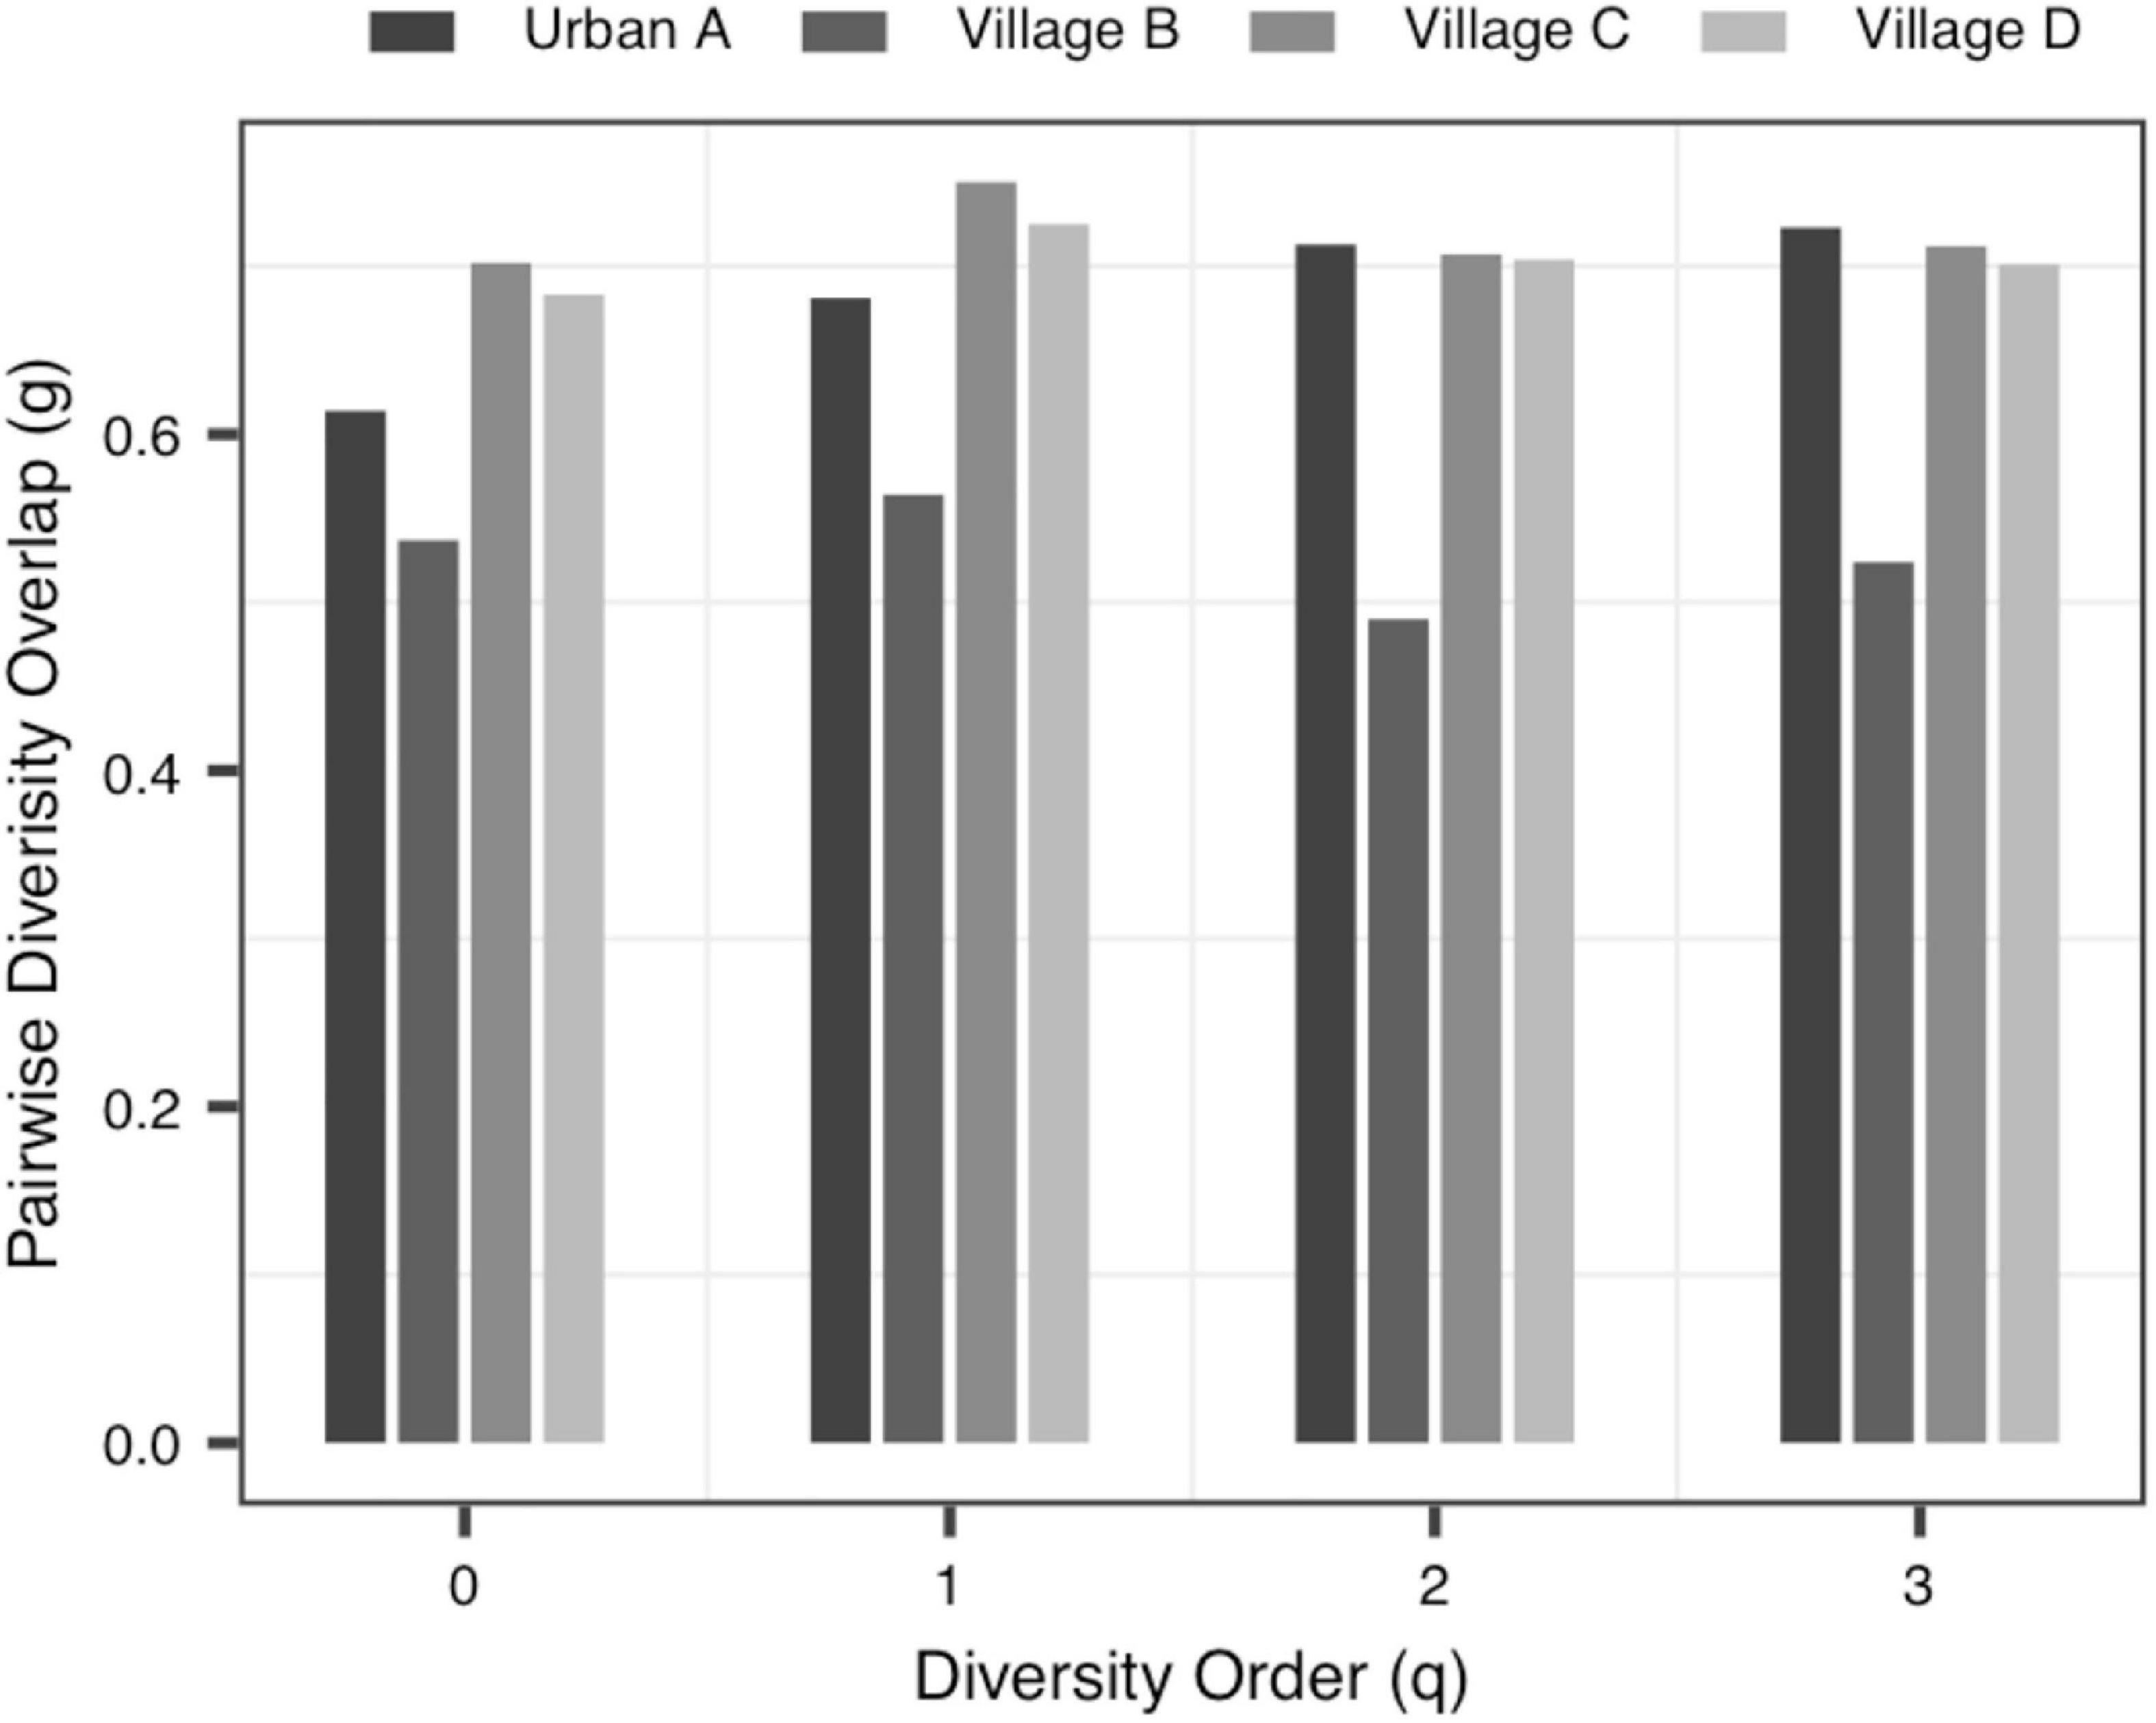
Figure 3. The PDO (pair-wise diversity overlap) profiles of Data-2.
(iii) The MAD Profile: The estimators of the MAD of four datasets reduced with the increase of the diversity order. When q = 0, that is, at the species richness level, Dmax represents the estimated maximum number of species, and the Amax represents the number of individuals required to reach the maximum number of species. In Data-1, the MADs in the alveolar samples of donors and recipients are very similar, but with some differences between the control group and the PGD group at the species richness level. Simultaneously, there was no significant difference in MAD between the bacteria group and the virome group in Data-4. As for Data-3, the MAD of the control group and the CD group were significantly smaller than the UC group at q = 0 (Figure 4).
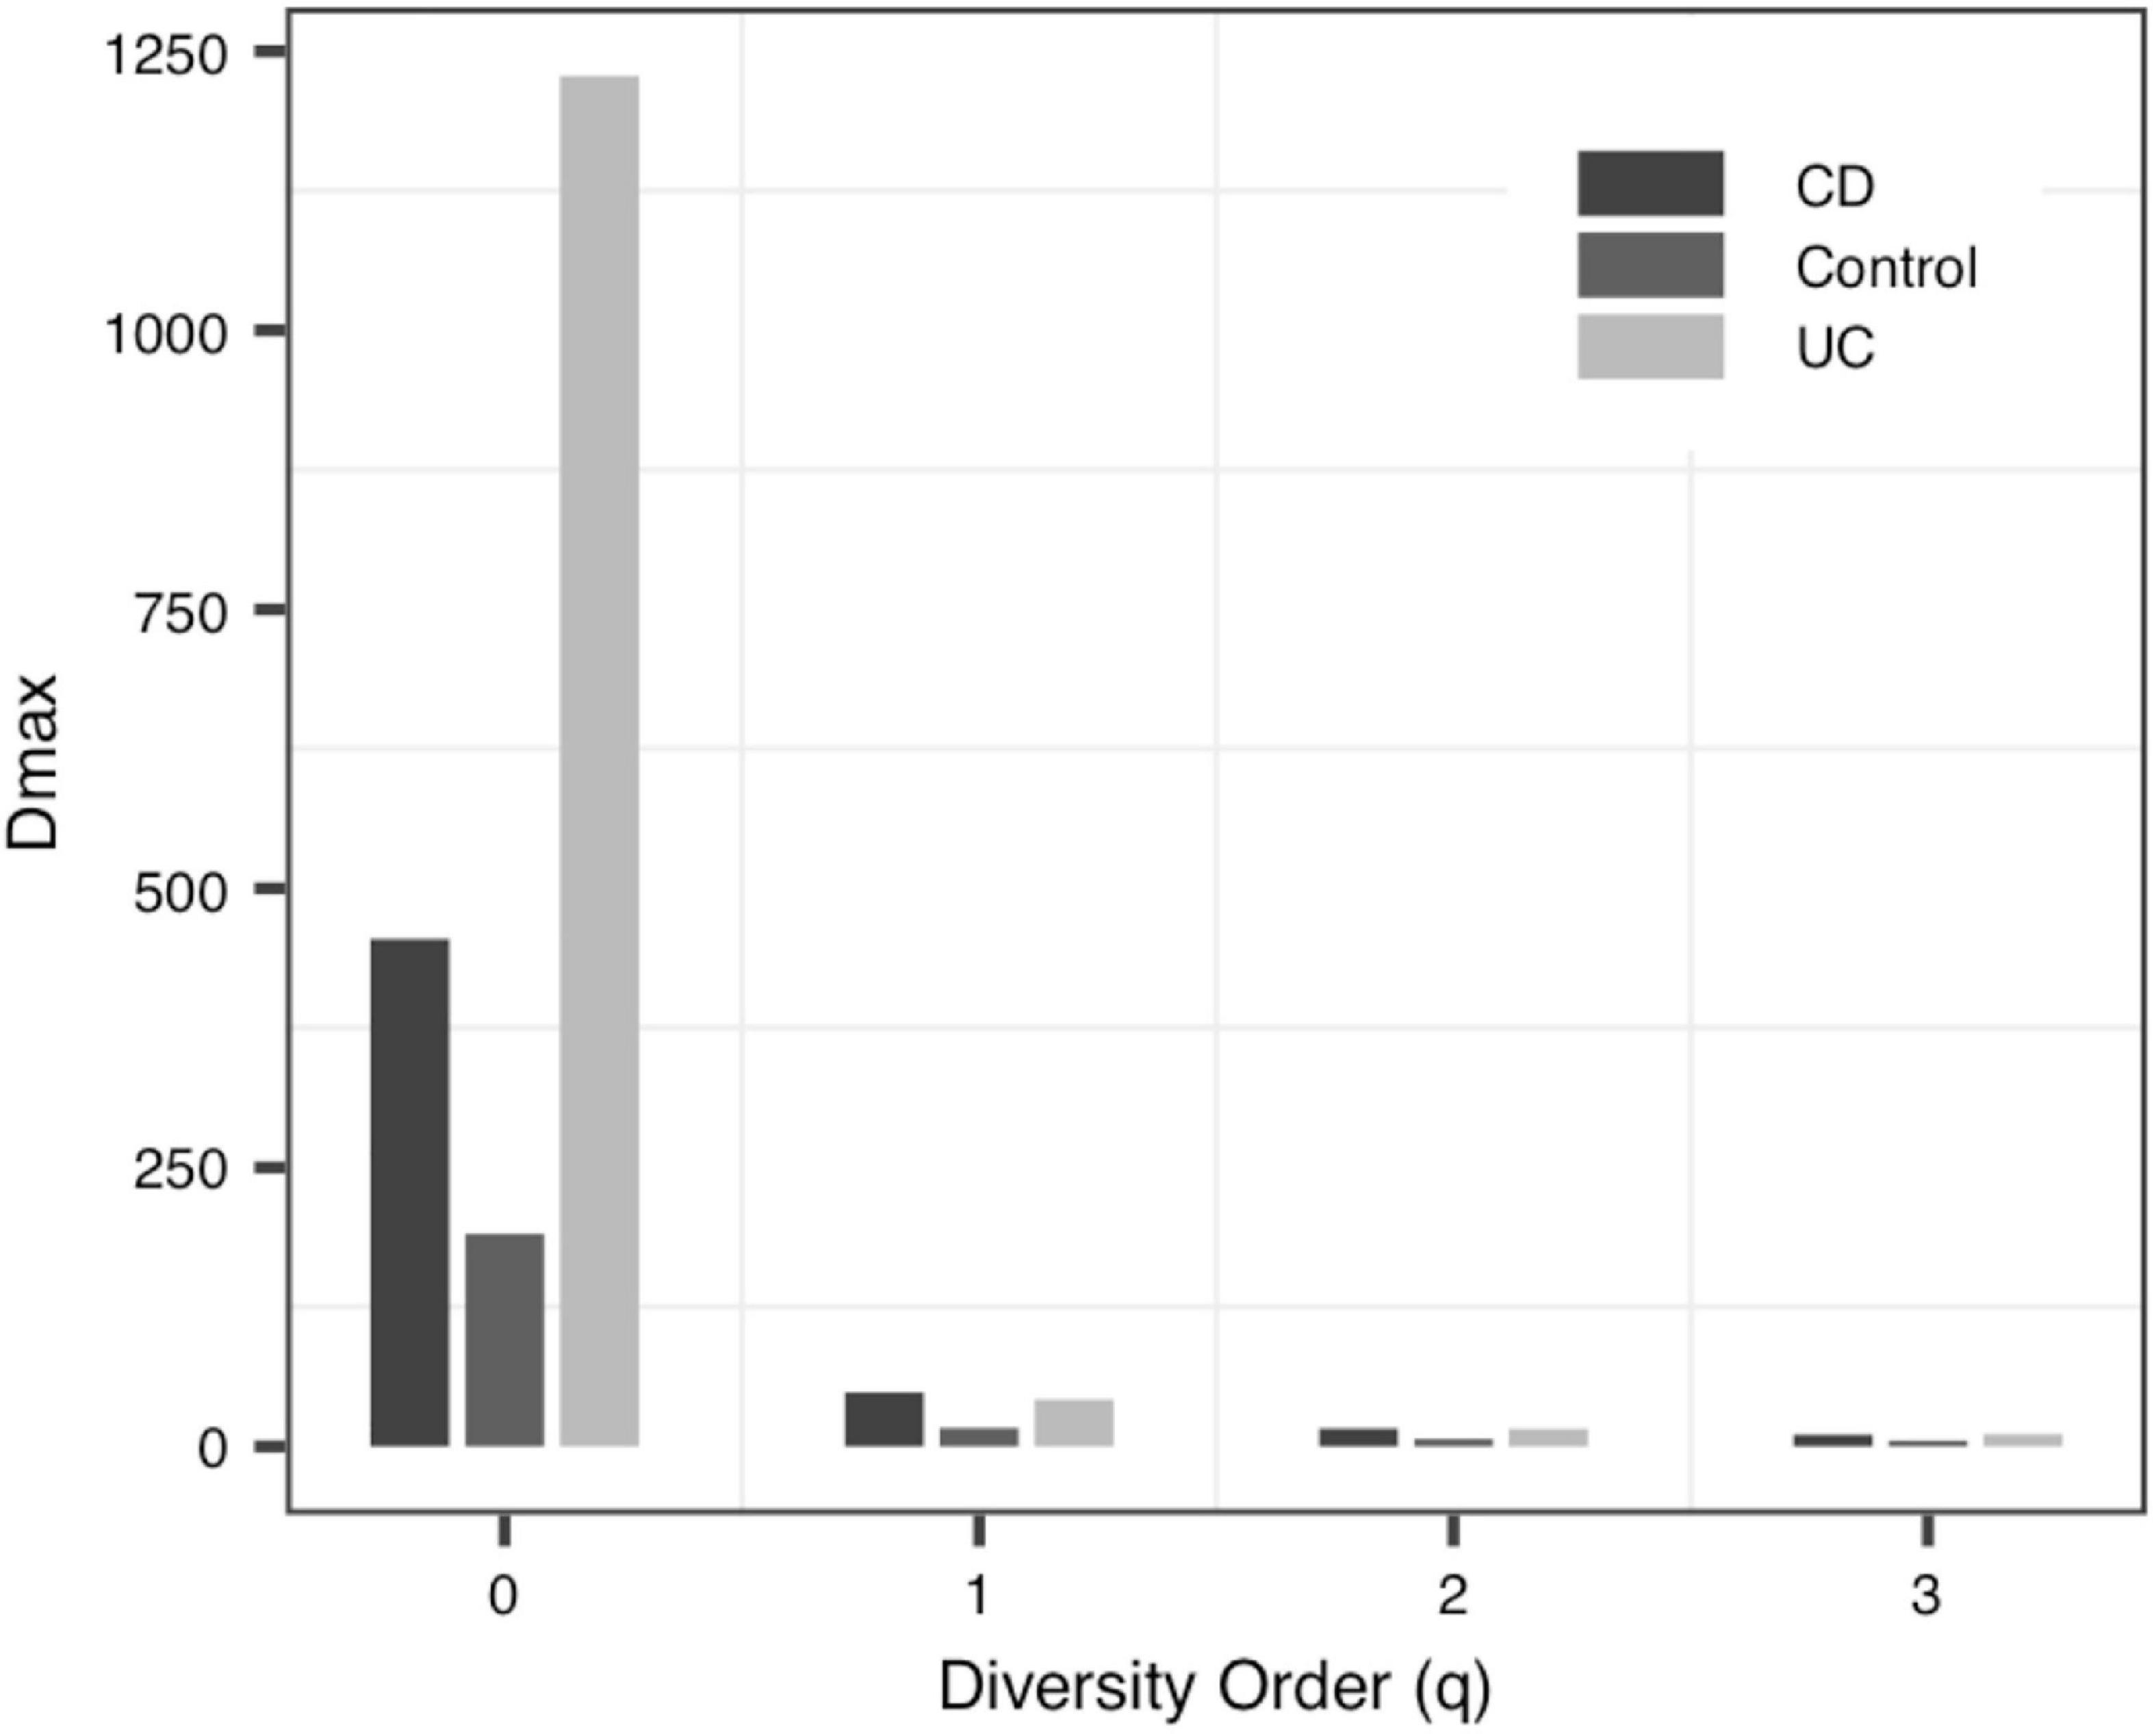
Figure 4. The MAD (maximal accrual diversity) profiles of Data-3.
(iv) The LGD profile: In addition to the Blood-PGD-LTR group in Data-1, the Village B and the Village D group in Data-2, Data-3 and the virome group in Data-4, the LGD ratios in other groups increased with the rise of the diversity order. In the first three datasets, the LGD ratios of the same sample type are relatively close, such as Village C vs. Village D (0.374 vs. 0.371, q = 0); Lung-control-LTR vs. Lung-control-OD (0.098 vs. 0.123, q = 0). According to Data-4, we can see that bacteria and virome have completely different LGD ratios (0.078 vs. 0.763, q = 0). Figure 5 displays the growth of LGD in Data-4 and the differences between the bacteria group and the virome group in LGD.
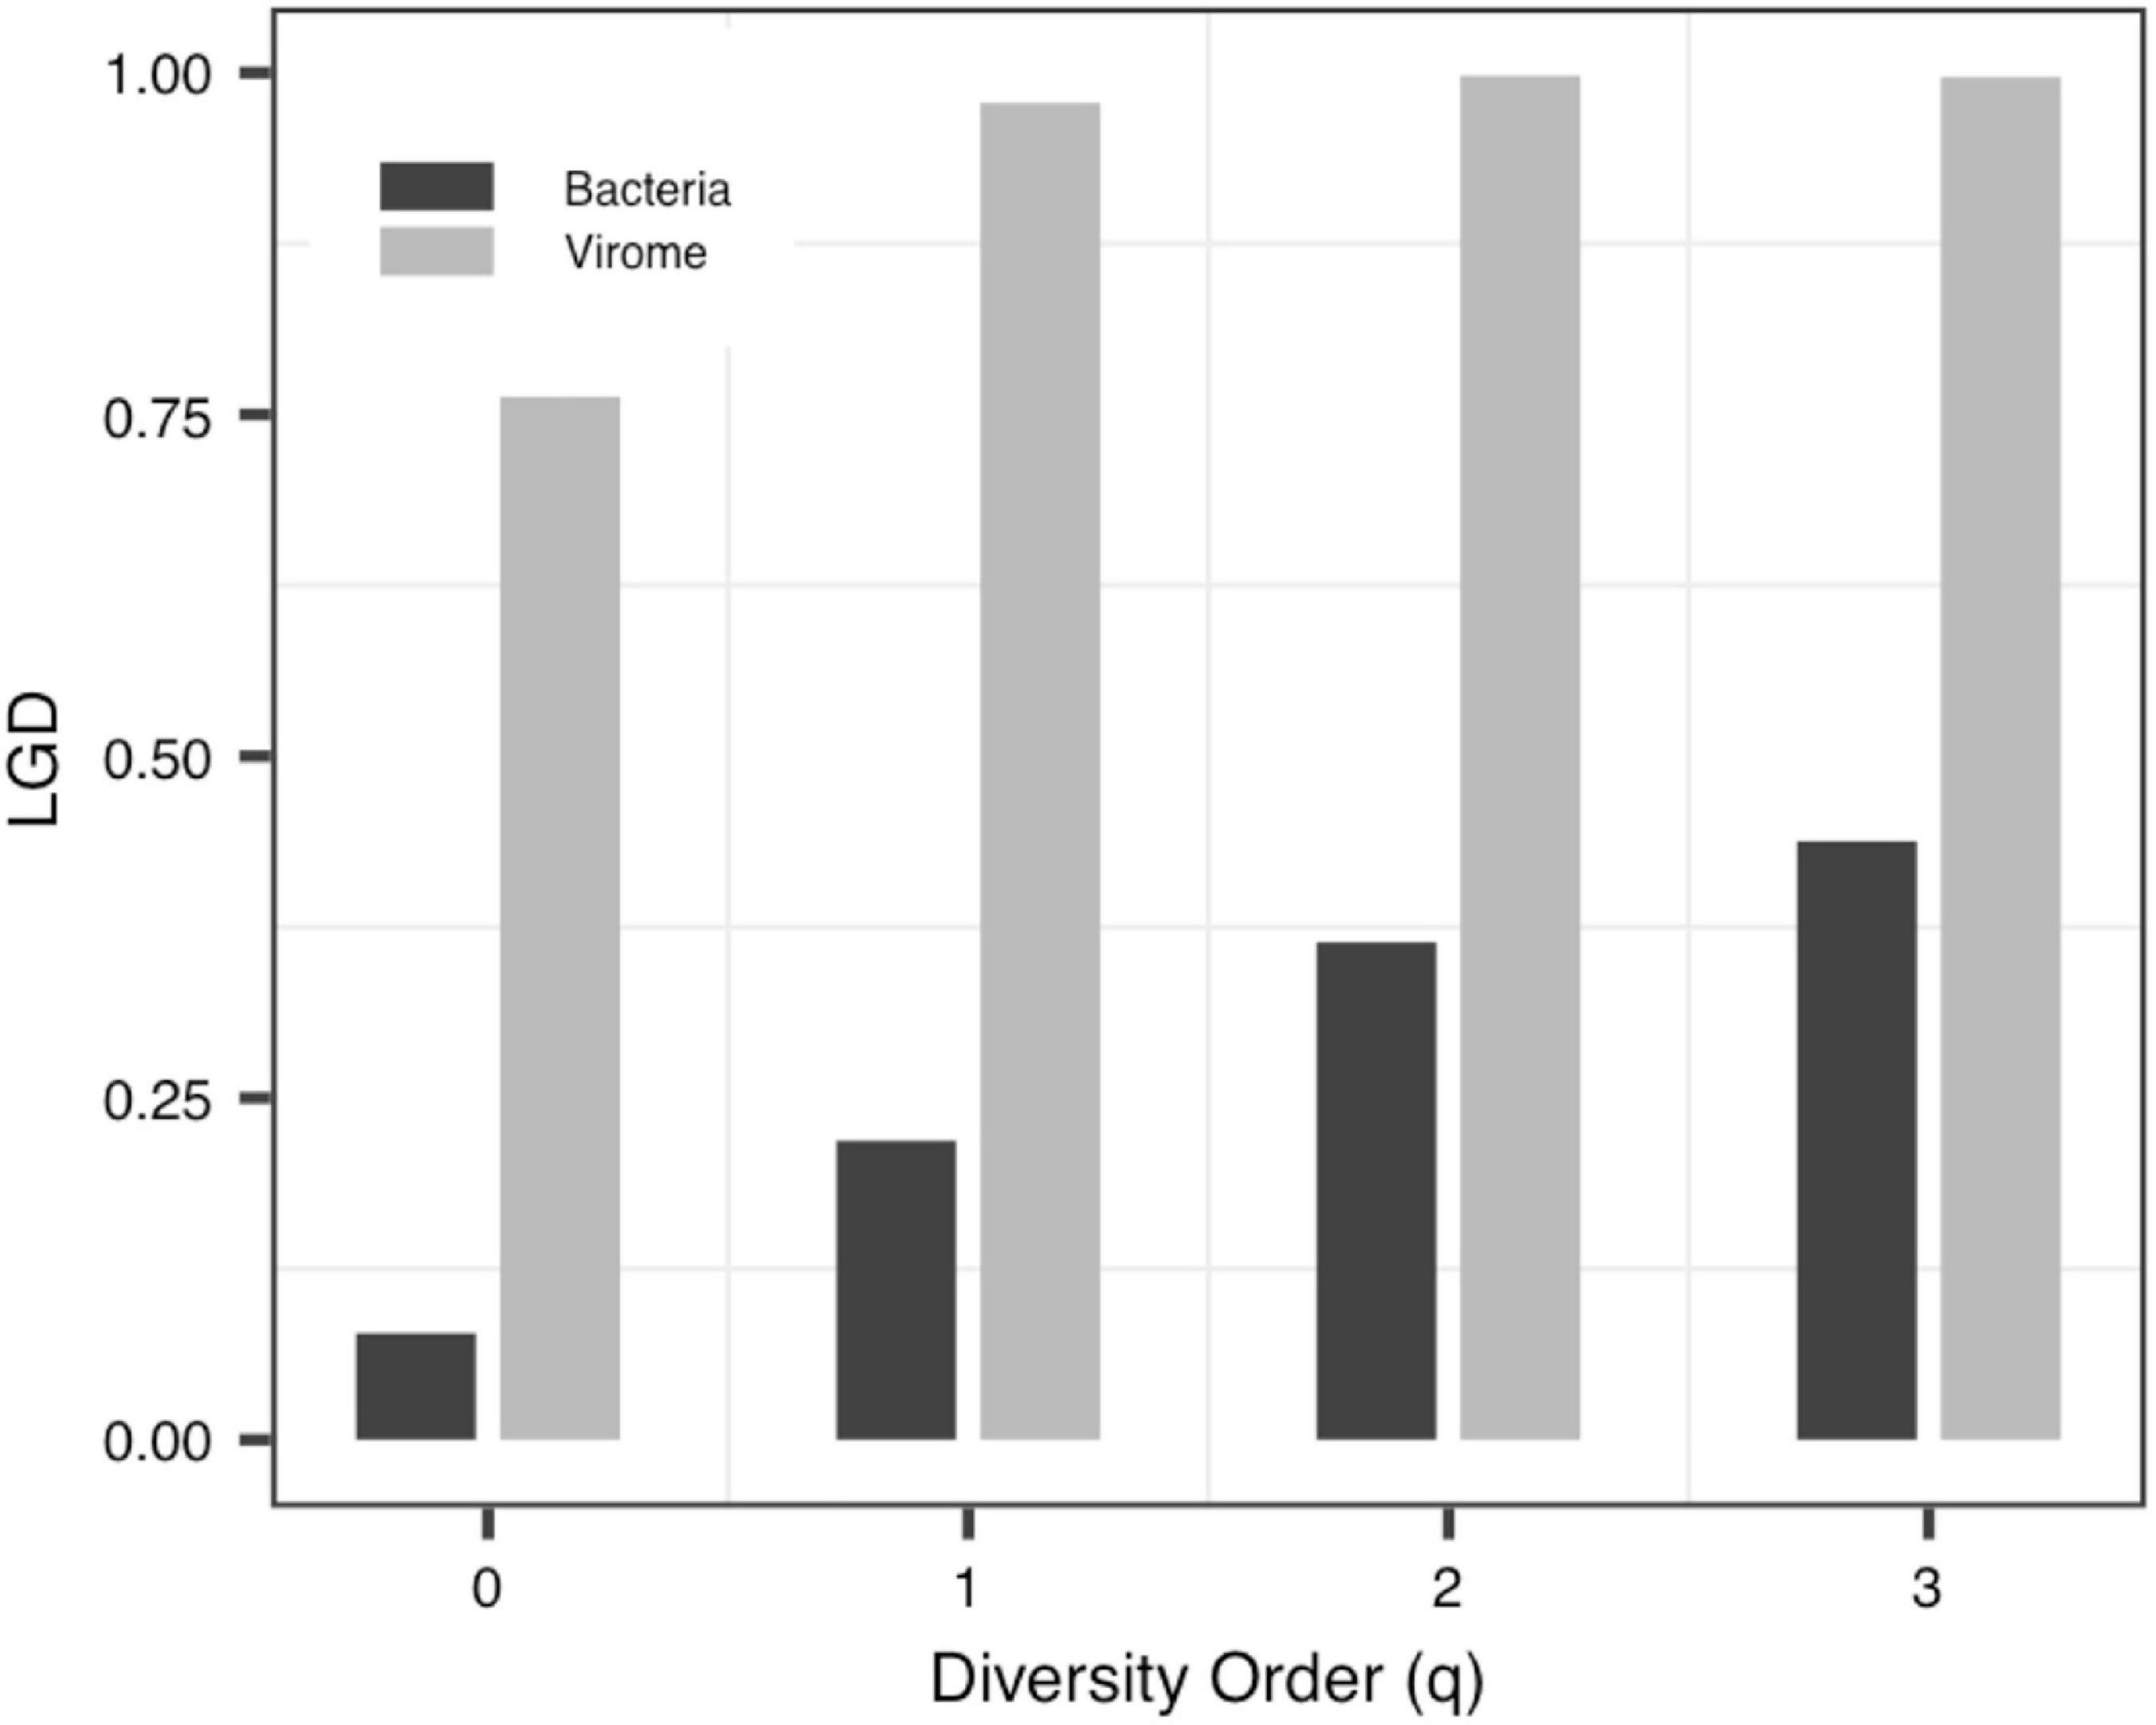
Figure 5. The LGD (ratio of local to global diversity) profiles of Data-4.
Conclusions and Discussion
To the best of our knowledge, this should be the first application of DAR analysis to the human virome, which offers a powerful tool to investigate the spatial (inter-individual) variability (heterogeneity) of virome diversity, and potential virome diversity globally (in a whole population). With the MAD Profile, Dmax estimates the maximum number of viral species in the community when diversity order q = 0. It can be seen that, in Data-1, which includes blood samples and alveolar samples of the donors and the lung transplant recipients, the maximum number of species in blood serum samples was lower than that in bronchoalveolar lavage samples, and this may indicate that the species diversities of different tissues is diverse (Ghose et al., 2019). At the same time, there was no statistically significant difference between the four profiles in the bronchoalveolar lavage samples of the donors and the recipients, perhaps because the virome of donor was transferred to the recipient along with the organ transplant (Mitchell and Glanville, 2018; Abbas et al., 2019). Data-2 compared the virome of one urban and three villages children. And we did not observe significant differences in the scaling parameter z and the pair-wise diversity overlap g among four locations, especially Village C and Village D. Thus, differences in living environment and diet do not seem to have a significant impact on the spatial heterogeneity of individual gut virome. For data-3, we can clearly see that when q = 0, the scaling parameter z of the control group is greater than that of the two disease groups CD and UC, and the pair-wise diversity overlap g of the control group is much smaller than that of the CD group and UC group. The changes of these two profiles suggest that there was a large difference among individuals in the Control group, while the CD and UC groups show a smaller heterogeneity among individuals. In addition, the Dmax of the UC group was significantly greater than that of the Control and CD group, and the virome diversity of the CD and UC group was significantly increased. These findings are also consistent with existing research showing increased virome diversity in IBD patients compared to healthy individuals (Lepage et al., 2008; Norman et al., 2015; Wang et al., 2015). In IBD patients, the diversity of viruses increased while the diversity of bacteria decreased (Norman et al., 2015; Clooney et al., 2019; Fernandes et al., 2019; Zuo et al., 2019). We also compared bacteria and virome in stool samples from hunter-gatherer Hadza people living in Tanzania. Based on the MAD profiles, it was revealed that the virome community and the bacteria community have similar maximum number of species. However, according to the LGD profiles, the ratios of local diversity to global diversity are quite different between virome and bacterial community. The differences may be due to limitations in virome analysis methods (including biochemical and bioinformatics methods), as well as to the limited virome library available (Aggarwala et al., 2017; Santiago-Rodriguez and Hollister, 2019).
Although this study is the first to compare the diversity scaling parameters between the healthy and diseased treatments, due to the very limited number of datasets, we are refrained from inferring general conclusions about possible effects of diseases on the inter-individual diversity scaling. We hope that future studies will allow us to draw more general conclusions on this important topic. As a very preliminary step, our analysis seems to suggest that the disease effects on the inter-individual diversity scaling (or the inter-individual heterogeneity of diversity) may be insignificant. Nevertheless, our study demonstrates an important quantitative tool (i.e., DAR) for analyzing the inter-individual heterogeneity of virome diversity, which is of obvious significance for investigating the ecology of human virome.
Data Availability Statement
The original contributions presented in the study are included in the article/supplementary material, further inquiries can be directed to the corresponding author/s.
Ethics Statement
Ethical review and approval was not required for the study on human participants in accordance with the local legislation and institutional requirements. Written informed consent for participation was not provided by the participants’ legal guardians/next of kin because the datasets we used are published data.
Author Contributions
ZM designed the study and revised the manuscript. WX performed the data analysis and wrote the draft. Both authors approved the submission.
Funding
This study received funding from the following sources: A National Natural Science Foundation (NSFC) Grant (No. 31970116) on Medical Ecology of Human Microbiome.
Conflict of Interest
The authors declare that the research was conducted in the absence of any commercial or financial relationships that could be construed as a potential conflict of interest.
Footnotes
- ^ http://www.ncbi.nlm.nih.gov/Traces/sra/
- ^ https://github.com/ExpressionAnalysis/ea-utils
- ^ https://github.com/lh3/seqtk.git
- ^ http://www.repeatmasker.org
References
Abbas, A. A., Diamond, J. M., Chehoud, C., Chang, B., Kotzin, J. J., Young, J. C., et al. (2017). The perioperative lung transplant virome: torque teno viruses are elevated in donor lungs and show divergent dynamics in primary graft dysfunction. Am. J. Transplant. 17, 1313–1324. doi: 10.1111/ajt.14076
Abbas, A. A., Young, J. C., Clarke, E. L., Diamond, J. M., Imai, I., Haas, A. R., et al. (2019). Bidirectional transfer of Anelloviridae lineages between graft and host during lung transplantation. Am. J. Transplant. 19, 1086–1097. doi: 10.1111/ajt.15116
Aggarwala, V., Liang, G., and Bushman, F. D. (2017). Viral communities of the human gut: metagenomic analysis of composition and dynamics. Mob. DNA 3:12.
Aronesty, E. (2011). ea-utils: Command-Line Tools for Processing Biological Sequencing Data. Available online at: https://github.com/ExpressionAnalysis/ea-utils
Barr, J. J., Auro, R., Furlan, M., Whiteson, K. L., Erb, M. L., Pogliano, J., et al. (2013). Bacteriophage adhering to mucus provide a non-host-derived immunity. Proc. Natl. Acad. Sci. U. S. A. 110, 10771–10776. doi: 10.1073/pnas.1305923110
Berliner, A. J., Mochizuki, T., and Stedman, K. M. (2018). Astrovirology: viruses at large in the universe. Astrobiology 18, 207–223. doi: 10.1089/ast.2017.1649
Bolyen, E., Rideout, J. R., Dillon, M. R., Bokulich, N. A., Abnet, C. C., Al-Ghalith, G. A., et al. (2018). QIIME 2: reproducible, interactive, scalable, and extensible microbiome data science. PeerJ. Preprints 6:e27295v2. doi: 10.7287/peerj.preprints.27295v2
Breitbart, M., and Rohwer, F. (2005). Here a virus, there a virus, everywhere the same virus? Trends Microbiol. 13, 278–284. doi: 10.1016/j.tim.2005.04.003
Carding, S. R., Davis, N., and Hoyles, L. (2017). Review article: the human intestinal virome in health and disease. Aliment. Pharmacol. Ther. 46, 800–815. doi: 10.1111/apt.14280
Carroll, D., Daszak, P., Wolfe, N. D., Gao, G. F., Morel, C. M., Morzaria, S., et al. (2018). The global virome project. Science 359, 872–874. doi: 10.1126/science.aap7463
Chao, A., Chiu, C. H., and Hsieh, T. C. (2012). Proposing a resolution to debates on diversity partitioning. Ecology 93, 2037–2051. doi: 10.1890/11-1817.1
Chao, A., Chiu, C. H., and Jost, L. (2014a). Unifying species diversity, phylogenetic diversity, functional diversity and related similarity and differentiation measures through hill numbers. Annu. Rev. Ecol. Evol. Syst. 45, 297–324. doi: 10.1146/annurev-ecolsys-120213-091540
Chao, A., Gotelli, N. J., Hsieh, T. C., Sander, E. L., Ma, K. H., Colwell, R. K., et al. (2014b). Rarefaction and extrapolation with hill num- bers: a framework for sampling and estimation in species diversity studies. Ecol. Monogr. 84, 45–67. doi: 10.1890/13-0133.1
Clooney, A. G., Sutton, T. D. S., Shkoporov, A. N., Holohan, R. K., Daly, K. M., O’Regan, O., et al. (2019). Whole-virome analysis sheds light on viral dark matter in inflammatory bowel disease. Cell Host Microbe 26, 764–778.e5.
Cobiaìn Güemes, A. G., Youle, M., Cantuì, V. A., Felts, B., Nulton, J., and Rohwer, F. (2016). Viruses as winners in the game of life. Annu. Rev. Virol. 3, 197–214. doi: 10.1146/annurev-virology-100114-054952
Columpsi, P., Sacchi, P., Zuccaro, V., Cima, S., Sarda, C., Mariani, M., et al. (2016). Beyond the gut bacterial microbiota: the gut virome. J. Med. Virol. 88, 1467–1472. doi: 10.1002/jmv.24508
Debarbieux, L., Saussereau, E., and Maura, D. (2013). La phagothérapie : cauchemar pour la bactérie et rêve pour le médecin ? [Phagotherapy: a nightmare for bacteria, a dream for physicians?]. Biol. Aujourdhui 207, 181–190. doi: 10.1051/jbio/2013017
Fernandes, M. A., Verstraete, S. G., Phan, T. G., Deng, X., Stekol, E., LaMere, B., et al. (2019). Enteric virome and bacterial microbiota in children with ulcerative colitis and crohn disease. J. Pediatr. Gastroenterol. Nutr. 68, 30–36. doi: 10.1097/mpg.0000000000002140
Frith, M. C. (2011). A new repeat-masking method enables specific detection of homologous sequences. Nucleic Acids Res. 39:e23. doi: 10.1093/nar/gkq1212
Galtier, M., De Sordi, L., Sivignon, A., de Vallée, A., Maura, D., Neut, C., et al. (2017). Bacteriophages targeting adherent invasive Escherichia coli strains as a promising new treatment for Crohn’s disease. J. Crohns Colitis 11, 840–847.
Garmaeva, S., Sinha, T., Kurilshikov, A., Fu, J., Wijmenga, C., Zhernakova, A., et al. (2019). Studying the gut virome in the metagenomic era: challenges and perspectives. BMC Biol. 17:84. doi: 10.1186/s12915-019-0704-y
Ghose, C., Ly, M., Schwanemann, L. K., Schwanemann, L. K., Shin, J. H., Atab, K., et al. (2019). The virome of cerebrospinal fluid: viruses where we once thought there were none. Front. Microbiol. 6:2061. doi: 10.3389/fmicb.2019.02061
Hannigan, G. D., Duhaime, M. B., Ruffin, M. T. I. V., Koumpouras, C. C., and Schloss, P. D. (2018). Diagnostic potential and interactive dynamics of the colorectal cancer virome. mBio 9, e2248–e2218.
Hannigan, G. D., Meisel, J. S., Tyldsley, A. S., Zheng, Q., Hodkinson, B. P., SanMiguel, A. J., et al. (2015). The human skin double-stranded DNA virome: topographical and temporal diversity, genetic enrichment, and dynamic associations with the host microbiome. mBio 6, e1578–e1515.
Lepage, P., Colombet, J., Marteau, P., Sime-Ngando, T., Doré, J., and Leclerc, M. (2008). Dysbiosis in inflammatory bowel disease: a role for bacteriophages? Gut 57, 424–425. doi: 10.1136/gut.2007.134668
Li, H., and Durbin, R. (2010). Fast and accurate long-read alignment with Burrows-Wheeler transform. Bioinformatics 26, 589–595. doi: 10.1093/bioinformatics/btp698
Li, L., and Ma, Z. S. (2019). Global microbiome diversity scaling in hot springs with DAR (Diversity-area relationship) profiles. Front. Microbiol. 10:118. doi: 10.3389/fmicb.2019.00118
Ly, M., Abeles, S. R., Boehm, T. K., Robles-Sikisaka, R., Naidu, M., Santiago-Rodriguez, T., et al. (2014). Altered oral viral ecology in association with periodontal disease. mBio 5, e1133–e1114.
Ma, Z. S. (2018). Extending species-area relationships (SAR) to diversity-area relationships (DAR). Ecol. Evol. 8, 10023–10038. doi: 10.1002/ece3.4425
Ma, Z. S. (2019). Sketching the human microbiome biogeography with DAR (Diversity-area relationship) profiles. Microb. Ecol. 77, 821–838. doi: 10.1007/s00248-018-1245-6
Ma, Z. S., and Li, W. (2019). How and why men and women differ in their microbiomes: medical ecology and network analyses of the microgenderome. Adv. Sci. (Weinh.) 6:1902054. doi: 10.1002/advs.201902054
Minot, S., Bryson, A., Chehoud, C., Wu, G. D., Lewis, J. D., and Bushman, F. D. (2013). Rapid evolution of the human gut virome. Proc. Natl. Acad. Sci. U. S. A. 110, 12450–12455. doi: 10.1073/pnas.1300833110
Minot, S., Sinha, R., Chen, J., Li, H., Keilbaugh, S. A., Wu, G. D., et al. (2011). The human gut virome: inter-individual variation and dynamic response to diet. Genome Res. 21, 1616–1625. doi: 10.1101/gr.122705.111
Mitchell, A. B., and Glanville, A. R. (2018). The human respiratory microbiome: implications and impact. Semin. Respir. Crit. Care Med. 39, 199–212. doi: 10.1055/s-0037-1617441
Nakamura, S., Yang, C.-S., Sakon, N., Ueda, M., Tougan, T., Yamashita, A., et al. (2009). Direct metagenomic detection of viral pathogens in nasal and fecal specimens using an unbiased high−throughput sequencing approach. PLoS One 4:e4219. doi: 10.1371/journal.pone.0004219
Norman, J. M., Handley, S. A., Baldridge, M. T., Droit, L., Liu, C. Y., Keller, B. C., et al. (2015). Disease-specific alterations in the enteric virome in inflammatory bowel disease. Cell 160, 447–460. doi: 10.1016/j.cell.2015.01.002
Pannaraj, P. S., Ly, M., Cerini, C., Saavedra, M., Aldrovandi, G. M., Saboory, A. A., et al. (2018). Shared and distinct features of human milk and infant stool viromes. Front. Microbiol. 9:1162. doi: 10.3389/fmicb.2018.01162
Parker, M. T. (2016). An ecological framework of the human virome provides classification of current knowledge and identifies areas of forthcoming discovery. Yale J. Biol. Med. 89, 339–351.
Plotkin, J. B., Potts, M. D., Yu, D. W., Bunyavejchewin, S., Condit, R., Foster, R., et al. (2000). Predicting species diversity in tropical forests. Proc. Natl. Acad. Sci. U.S.A. 97, 10850–10854.
Preston, F. W. (1960). Time and space and the variation of species. Ecology 41, 611–627. doi: 10.2307/1931793
Preston, F. W. (1962). The canonical distribution of commonness and rarity: Part I. Ecology 43, 185–215. doi: 10.2307/1931976
Reyes, A., Semenkovich, N. P., Whiteson, K., Rohwer, F., and Gordon, J. I. (2012). Going viral: next-generation sequencing applied to phage populations in the human gut. Nat. Rev. Microbiol 10, 607–617. doi: 10.1038/nrmicro2853
Santiago-Rodriguez, T. M., and Hollister, E. B. (2019). Human virome and disease: high-throughput sequencing for virus discovery, identification of phage-bacteria dysbiosis and development of therapeutic approaches with emphasis on the human gut. Viruses 11:656. doi: 10.3390/v11070656
Santiago-Rodriguez, T. M., Ly, M., Bonilla, N., and Pride, D. T. (2015). The human urine virome in association with urinary tract infections. Front. Microbiol. 6:14. doi: 10.3389/fmicb.2015.00014
Schmieder, R., and Edwards, R. (2011). Quality control and preprocessing of metagenomic datasets. Bioinformatics 27, 863–864. doi: 10.1093/bioinformatics/btr026
Shkoporov, A. N., Clooney, A. G., Sutton, T. D. S., Ryan, F. J., Daly, K. M., Nolan, J. A., et al. (2019). The human gut virome is highly diverse, stable, and individual specific. Cell Host Microbe 26, 527–541.e5.
Siqueira, J. D., Dominguez-Bello, M. G., Contreras, M., Lander, O., Caballero-Arias, H., Xutao, D., et al. (2018). Complex virome in feces from Amerindian children in isolated Amazonian villages. Nat. Commun. 9:4270.
Smit, A. F. A., Hubley, R., and Green, P. (2013–2015). RepeatMasker Open-4.0. Available online at: http://www.repeatmasker.org
Smits, S. A., Leach, J., Sonnenburg, E. D., Gonzalez, C. G., Lichtman, J. S., Reid, G., et al. (2017). Seasonal cycling in the gut microbiome of the Hadza hunter-gatherers of Tanzania. Science 357, 802–806.
Thannesberger, J., Hellinger, H. J., Klymiuk, I., Kastner, M. T., Rieder, F. J. J., Schneider, M., et al. (2017). Viruses comprise an extensive pool of mobile genetic elements in eukaryote cell cultures and human clinical samples. FASEB J. 31, 1987–2000. doi: 10.1096/fj.201601168r
Tjørve, E. (2009). Shapes and functions of species–area curves (II): a review of new models and parameterizations. J. Biogeogr. 36, 1435–1445. doi: 10.1111/j.1365-2699.2009.02101.x
Ulrich, W., and Buszko, J. (2003). Self-similarity and the species–area relation of Polish butterflies. Basic Appl. Ecol. 4, 263–270. doi: 10.1078/1439-1791-00139
Wang, W., Jovel, J., Halloran, B., Wine, E., Patterson, J., Ford, G., et al. (2015). Metagenomic analysis of microbiome in colon tissue from subjects with inflammatory bowel diseases reveals interplay of viruses and bacteria. Inflamm. Bowel Dis. 21, 1419–1427.
Watson, H. C. (1835). Remarks on Geographic Distribution of British Plants. London: Longman, Rees, Orme, Brown, Green and Longman.
Willner, D., Furlan, M., Haynes, M., Schmieder, R., Angly, F. E., Silva, J., et al. (2009). Metagenomic analysis of respiratory tract DNA viral communities in cystic fibrosis and non-cystic fibrosis individuals. PLoS One 4:e7370. doi: 10.1371/journal.pone.0007370
Wylie, K. M., Mihindukulasuriya, K. A., Zhou, Y., Sodergren, E., Storch, G. A., and Weinstock, G. M. (2014). Metagenomic analysis of double-stranded DNA viruses in healthy adults. BMC Biol. 12:71. doi: 10.1186/s12915-014-0071-7
Zhao, G., Wu, G., Lim, E. S., Droit, L., Krishnamurthy, S., Barouch, D. H., et al. (2017). VirusSeeker, a computational pipeline for virus discovery and virome composition analysis. Virology 503, 21–30. doi: 10.1016/j.virol.2017.01.005
Keywords: human virome ecology, diversity scaling, diversity-area relationship, potential diversity, maximal accrual diversity
Citation: Xiao W and Ma ZS (2021) Inter-Individual Diversity Scaling Analysis of the Human Virome With Classic Diversity-Area Relationship (DAR) Modeling. Front. Genet. 12:627128. doi: 10.3389/fgene.2021.627128
Received: 18 November 2020; Accepted: 30 March 2021;
Published: 20 April 2021.
Edited by:
Xiaogang Wu, University of Texas MD Anderson Cancer Center, United StatesReviewed by:
Scott H. Harrison, North Carolina Agricultural and Technical State University, United StatesPratip Rana, Engineer Research and Development Center (ERDC), United States
Copyright © 2021 Xiao and Ma. This is an open-access article distributed under the terms of the Creative Commons Attribution License (CC BY). The use, distribution or reproduction in other forums is permitted, provided the original author(s) and the copyright owner(s) are credited and that the original publication in this journal is cited, in accordance with accepted academic practice. No use, distribution or reproduction is permitted which does not comply with these terms.
*Correspondence: Zhanshan (Sam) Ma, bWFAdmFuZGFscy51aWRhaG8uZWR1