 Admas Alemu1
 Gintaras Brazauskas2
 David S. Gaikpa1
 Tina Henriksson3
 Bulat Islamov4
 Lise Nistrup Jørgensen5
 Mati Koppel6
 Reine Koppel4Žilvinas Liatukas2
 Jan T. Svensson7
 Aakash Chawade1*
- 1Department of Plant Breeding, Swedish University of Agricultural Sciences, Alnarp, Sweden
- 2Institute of Agriculture, Lithuanian Research Centre for Agriculture and Forestry (LAMMC), Kėdainiai, Lithuania
- 3Lantmännen Lantbruk, Svalöv, Sweden
- 4Estonian Crop Research Institute, Jõgeva, Estonia
- 5Department of Agroecology, Aarhus University, Slagelse, Denmark
- 6Estonian University of Life Sciences, Tartu, Estonia
- 7Nordic Genetic Resource Center, Alnarp, Sweden
Septoria tritici blotch (STB) caused by the fungal pathogen Zymoseptoria tritici and powdery mildew (PM) caused by Blumeria graminis f.sp tritici (Bgt) are among the forefront foliar diseases of wheat that lead to a significant loss of grain yield and quality. Resistance breeding aimed at developing varieties with inherent resistance to STB and PM diseases has been the most sustainable and environment-friendly approach. In this study, 175 winter wheat landraces and historical cultivars originated from the Nordic region were evaluated for adult-plant resistance (APR) to STB and PM in Denmark, Estonia, Lithuania, and Sweden. Genome-wide association study (GWAS) and genomic prediction (GP) were performed based on the adult-plant response to STB and PM in field conditions using 7,401 single-nucleotide polymorphism (SNP) markers generated by 20K SNP chip. Genotype-by-environment interaction was significant for both disease scores. GWAS detected stable and environment-specific quantitative trait locis (QTLs) on chromosomes 1A, 1B, 1D, 2B, 3B, 4A, 5A, 6A, and 6B for STB and 2A, 2D, 3A, 4B, 5A, 6B, 7A, and 7B for PM adult-plant disease resistance. GP accuracy was improved when assisted with QTL from GWAS as a fixed effect. The GWAS-assisted GP accuracy ranged within 0.53–0.75 and 0.36–0.83 for STB and PM, respectively, across the tested environments. This study highlights that landraces and historical cultivars are a valuable source of APR to STB and PM. Such germplasm could be used to identify and introgress novel resistance genes to modern breeding lines.
Introduction
Septoria tritici blotch (STB) and powdery mildew (PM) caused by fungal pathogens Zymoseptoria tritici and Blumeria graminis f.sp tritici (Bgt), respectively, are the major devastating foliar diseases that cause significant yield loss in wheat-growing regions. These fungal diseases can significantly reduce the yield and quality of the wheat crop under conducive environmental conditions (Singh et al., 2016; Figueroa et al., 2018; Jalli et al., 2020). Both STB and PM diseases are major concerns for sustainable wheat production in European countries around the Baltic Sea (Chawade et al., 2018). In this region, fungicides are widely used for the control of these diseases. However, the growth of pathogen strains with resistance/insensitivity to the existing widely used fungicides (Heick et al., 2017) coupled with the worrisome environmental impact of fungicide application critically demands resistance breeding aimed at developing varieties with inherent resistance to STB and PM diseases. Increasing temperatures due to global warming and sufficient precipitation for rainfed agriculture in northern Europe are likely to increase crop productivity (Porter and Semenov, 2005; Castellari and Kurnik, 2017). Nevertheless, the milder winters and longer growing periods may encourage the spread of diseases (Wiik and Ewaldz, 2009; Roos et al., 2011). Hence, decreasing the negative effect of climate change by reducing the spread of plant diseases is immense, and in this case, landraces are the ultimate genetic resources for disease resistance breeding (Olesen et al., 2011).
Major genes with strong effect and genes with minor-to-moderate effect inherited qualitatively and quantitatively, respectively, have been reported in wheat resistance against both STB and PM. Twenty-one qualitatively inherited major genes (Stb genes) are detected hitherto and mapped on 14 wheat chromosomes against the STB pathogen (Brown et al., 2015). These genes are generally effective but are genotype specific, and their potency is only for a particular isolate of the pathogen (Brown et al., 2015). Their act of resistance is supposed to be a gene-for-gene relationship as demonstrated in the Stb6 gene (Brading et al., 2002). Both Stb6 and Stb16q were the source of resistance in European cultivars (Ghaffary et al., 2012) but lost their effectiveness lately in certain geographical regions (Saintenac et al., 2018; Kildea et al., 2020). These pathogen-specific major genes can confer resistance to the pathogen either at the seedling stage (Stb7, Stb9-15, StbSm3, StbWW, and TmStb1), adult stage (Stb2, Stb3, Stb8, and Stb17), or at all growth stages (Stb1, Stb4-6, Stb16q, and Stb18) of the wheat plant (Raman and Milgate, 2012; Brown et al., 2015). The majority of European wheat varieties encompass qualitative and quantitative genes, although several of the major genes are no more effective in fields (Arraiano and Brown, 2006). Hence, detecting and accumulating quantitative trait loci (QTLs) with minor-to-moderate effects have been evolved as an effective way to have durably resistant wheat varieties for STB. Likewise, to STB, both qualitative and quantitative genes are detected in wheat for PM resistance. So far, more than 100 pm alleles in 60 loci (Pm1–Pm68: Pm8 is allelic to Pm17; Pm18 = Pm1c; Pm22 = Pm1e; Pm23 = Pm4c; and Pm31 = Pm21) are identified and mapped across wheat chromosomes (Li et al., 2019a; Jia et al., 2020; McIntosh et al., 2020). Several of these genes are detected in Scandinavian wheat cultivars in the past, either singly or in combinations of multiple genes (Hovmøller, 1989) in addition to genes with minor effects (Keller et al., 1999; Chen et al., 2009; Lillemo et al., 2012). Such minor-effect genes are mostly quantitatively inherited and often provide sufficient levels of disease resistance for longer time compared to race-specific resistance (Limpert et al., 1987). Only three PM resistance genes (i.e., Pm38, Pm39, and Pm46) are identified, mapped and provide quantitative PM resistance (Spielmeyer et al., 2005; Lillemo et al., 2008; Herrera-Foessel et al., 2014). The gene Pm3 comprised the highest numbers of alleles with 17, followed by Pm1 and Pm5 each contains 5, Pm4 with 4, and Pm2 with 3 alleles (Hao et al., 2015). The majority of these Pm genes were transferred from the domesticated and wild relatives of wheat and even from other species, such as rye (Secale cereale) (Marone et al., 2013). However, this phenomenon imposes the difficulty not to widely utilize these genes in wheat breeding because of linkage drag (Jia et al., 2020). For instance, the Pm8 gene that originated from the 1RS chromosome of S. cereale significantly contributed to PM resistance of wheat in the 1990s, but the linked secalin glycopeptide in 1RS triggered a decline in flour quality (Lee et al., 1995). Besides, most of these resistance genes have been conquered by the pathogen, and only a few are still effective against the Bgt isolates on the field (Zeng et al., 2014). On the other hand, the quantitative resistance genes to PM, commonly observed in adult plants on the field, comprise polygenes (QTLs) with durable and broad-spectrum characteristics, making it a more suitable approach in resistance breeding programs (Kou and Wang, 2010).
With the continuous decline of genotyping cost coupled with the increasing availability of various single-nucleotide polymorphism (SNP) fingerprinting platforms, genomic-assisted breeding has become a suitable method in various plant-breeding schemes. Linkage mapping and genome-wide association study (GWAS) are successfully applied to detect QTLs/genes in various crops. The GWAS method overcomes the two common limitations (i.e., restricted allelic diversity and limited genomic resolution) raised by the bi-parental linkage mapping approach (Brachi et al., 2011). GWAS was successfully used as a tool to mine several putative QTLs/genes associated with traits of agronomic importance in several plants, including disease resistance (Bartoli and Roux, 2017; Vagndorf et al., 2017; Juliana et al., 2018; Muqaddasi et al., 2019). Several valuable QTLs/genes have been mined through either or both GWAS and linkage mapping for STB (Schilly et al., 2011; Ghaffary et al., 2012; Miedaner et al., 2013; Dreisigacker et al., 2015; Mirdita et al., 2015; Vagndorf et al., 2017; Muqaddasi et al., 2019; Odilbekov et al., 2019a) and PM (Hartl et al., 1995; Keller et al., 1999; Hysing et al., 2007; Hua et al., 2009; Hao et al., 2015; Li et al., 2019a,b; Jia et al., 2020; Nordestgaard et al., 2020) and incorporated in wheat resistance breeding programs. Genomic prediction (GP) is the other practical approach in several crop plants to predict the genotypic estimated breeding values (GEBVs) of individual genotypes based on their overall genome-wide markers effect without the need to phenotype them (Meuwissen et al., 2001; Lorenz et al., 2011; Crossa et al., 2017). Hence, unlike GWAS and linkage mapping, QTLs with minor effects could be counted in genomic selection. Regardless of the hindering challenges in accuracy, including quality of both genotyping and phenotyping, genotype-by-environment (G × E) interaction and other non-additive effects (Voss-Fels et al., 2019), GP has proven its potential to increase the genetic gain within a significantly reduced time in several plant breeding programs (Crossa et al., 2017). GP was used previously to predict the STB and PM resistance in wheat (Mirdita et al., 2015; Juliana et al., 2017; Muqaddasi et al., 2019; Odilbekov et al., 2019a; Sarinelli et al., 2019).
Wheat landraces have been used as an invaluable source of novel genes for various traits of agronomic importance. The Nordic Genetic Resource Centre (NordGen, Alnarp, Sweden) preserved winter wheat accessions comprising landraces and historical cultivars collected from the Scandinavian countries1. This preserved germplasm has encompassed a rich genetic variation for various traits of agronomic importance (Chawade et al., 2018), including resistance to STB at the seedling stage (Odilbekov et al., 2019a), adult-plant resistance (APR) to rust and PM (Hysing et al., 2006, 2007), and drought tolerance (Kumar et al., 2020). The current study used 175 genotypes comprising both landraces and historical cultivars of the Nordic origin with the following objectives: (I) to evaluate the genetic variation in response to STB and PM resistance; (II) to estimate the genotype-by-environment (G × E) interaction for STB and PM resistance across years and locations; (III) to detect valuable QTLs for STB and PM resistance via GWAS analysis; and (IV) to estimate the GEBVs of individual genotypes for STB and PM APR using different GP models. For this purpose, genotypes were tested for their resistance response to STB and PM in field trials in Denmark, Estonia, Lithuania, and Sweden.
Materials and Methods
Plant Materials
This study used 175 winter wheat genotypes comprising both cultivars and landraces. The details of genotypes can be found in Odilbekov et al. (2019a). Briefly, the panel comprised cultivars released in the years from 1900 to 2012, representing a century of winter wheat breeding in the region. The collection also included four genotypes originally from Germany but widely grown in the Scandinavian countries. The seeds were procured from the Nordic Genetic Resources Center, Alnarp, Sweden.
Field Experiment
Field evaluation of genotypes was carried out in four different countries, including Denmark, Estonia, Lithuania, and Sweden for two growing seasons (2018–2019 and 2019–2020). Genotypes were screened under natural infections for STB and PM and scored on a 1–9 scale, which was used previously by Laidig et al. (2021). Experiments were carried out in a lattice design with two replications having a slight variation in plot and row sizes across locations. The Denmark field trial was carried out at Tystofte in 2019 with a 1-m2 plot size comprising six rows, and the distance between adjacent plots and rows within plots was 50 and 20 cm, respectively. Disease assessment for both STB and PM was done once at the flag leaf stage [Zadok’s growth stage (GS) 73–75] on June 26, 2019. The Estonia field trial was done at Jõgeva for two growing seasons (2018–2019 and 2019–2020). The plot size was 1 m2 with six rows, and the distance between adjacent plots and rows within plots was 50 and 20 cm, respectively. Both disease assessments were done twice each year (June 6 and 20 in 2019 and July 2 and 14 in 2020) on the flag leaves. The Lithuania field trial was carried out at Dotnuva for two growing seasons (2018–2019 and 2019–2020) with a plot size of 1 m2 encompassing six rows, and the distance between plots and rows within plots was 80 and 20 cm, respectively. The disease evaluation for PM was scored for 2 years on June 3, 2019 and June 23, 2020. However, the STB assessment was done only in 2020 for two rounds (June 23 and July 4). The field trial in Sweden was carried out in Svalöv in 2019 with a plot size of 1 m2 having six rows. Possible covariates such as plant height and phenology (i.e., days from planting to heading) were also recorded at all locations except Denmark.
Phenotypic Data Analysis
The phenotypic data analysis of individual experiments (location–year combination, environment hereafter) and combined environment was evaluated using the Multi-environment Trial Analysis with R (META-R) software package (Alvarado et al., 2020). The analysis of variance (ANOVA) and adjusted means [best linear unbiased estimations (BLUEs)] of the disease traits were calculated including locations, years, replications, blocks, and genotypes. For each environment, variances and adjusted means (BLUEs) without covariates were estimated using the linear model:
while with covariates, phenotypic data adjustment was made with the model:
where Yijk is the disease traits, μ is the overall mean effect, and Repi and Blockj(Repi) denote the effect of the ith replicate and the jth incomplete block within the ith replicate, respectively. Genk represents the effect of the kth genotype; εijk is the effect of the error associated with the ith replication, jth incomplete block, and kth genotype, which is assumed to be the independent and identically distributed random variables (iid) normal with mean zero and variance σ2ε. Cov is the effect of the covariate (plant height and/or days to heading). All, except the overall mean and covariate, are treated as random effects and the iid normal with mean zero and effect-specific variances. Genotypes were considered as fixed effects during the BLUEs estimation. Days to heading and plant height were incorporated into the analysis whenever they were significantly correlated with the disease scores. BLUEs and variance components for combined environment were estimated using the model:
where Envi and Envi × Genl are the ith environment and the G × E interaction effects, respectively. Environment refers to the location–year combination.
The broad-sense heritability of the combined environment analysis was calculated with the formula:
while for individual environments, repeatability among replications was calculated with the formula:
where σ2g and σ2e are the genotype and error variance components, respectively, σ2ge is the G × E interaction variance component, nRep is the number of replicates, and nEnv is the number of environments. Frequency distribution and box plots of the phenotypic data were analyzed using Minitab 18 (Minitab Ltd., Coventry, United Kingdom), while Pearson’s correlation between phenotypic traits was computed using cor function in R environment (R Core Team, 2020).
The genotype plus genotype-by-environment interaction (GGE) biplot analysis was conducted based on the BLUEs values of 175 Nordic winter wheat genotypes collected from four countries using the “GGEBiplots” package in the R environment (Yan and Kang, 2002).
Genotyping, Linkage Disequilibrium, and Genome-Wide Association Analysis
Genotypic data that was previously published (Odilbekov et al., 2019a) was used in this study. A total of 7,401 quality SNP markers were used after excluding those markers with > 20% missing values and < 5% minor allele frequency per individual genotypes.
GWAS was performed with the six different models comprising single- and multi-locus analysis methods in GAPIT v.3 software package (Lipka et al., 2012). Population structure (Q) was modeled using principal component analysis (PCA) according to Price et al. (2006), and the optimal numbers of PCA were estimated based on the Bayesian information criterion (BIC) (Schwarz, 1978). The single-locus GWAS models including general linear model (GLM) with PCA (Price et al., 2006), mixed linear model (MLM) with PCA and Kinship similarity matrix (K) (Yu et al., 2006), and Settlement of MLM Under Progressively Exclusive Relationship (SUPER) (Wang et al., 2014a) were employed to execute valuable quantitative trait nucleotides (QTNs). The multi-locus GWAS models including multiple-locus mixed linear model (MLMM) (Segura et al., 2012), fixed and random model circulating probability unification (FarmCPU) (Liu et al., 2016), and Bayesian-information and linkage-disequilibrium iteratively nested keyway (BLINK) (Huang et al., 2019) were also utilized for marker–trait association (MTA) analysis. GWAS was performed using the datasets generated from the BLUEs of STB and PM disease scores based on the following scenarios: (I) individual environments, (II) country 2 years combined, (III) GGE biplot environments grouping based results, and (IV) overall combined. The P < 0.001 [–log10(P) > 3.0] was used as a threshold to report significant MTAs as described earlier (Maccaferri et al., 2016; Liu et al., 2017; Alemu et al., 2021).
Genome-wide linkage disequilibrium (LD) analysis was performed using the entire genotypic dataset. Pairwise squared allele-frequency correlations (r2) between SNP markers was calculated in Trait Analysis by Association, Evolution, and Linkage (TASSEL) with 100 sliding window size. To estimate the extent of LD between pairs of loci, r2 values were plotted against physical distance (cM). The LD decay curve line was then fitted on the scatterplot using the smoothing spline regression line at the genome level following the procedure by Hill and Weir (1988) in R environment with the script previously used by Marroni et al. (2011).
Genomic Prediction
Genomic prediction was explored for each environment and environments combined using the ridge regression BLUP (RR-BLUP) mixed model package “rrBLUP” (Endelman, 2011; Endelman and Jannink, 2012) in R environment with the formula:
where X and Z are the designed matrices for fixed and random effects, respectively. β and μ represent the vectors of fixed and random effects, respectively, while y is a vector of phenotypic values (BLUEs), and ε is the residual error. GP was further tested using a model called the weighted ridge regression BLUP (wRR-BLUP) (Zhao et al., 2014; Spindel et al., 2016). To do this, the topmost five highly significant SNP markers that are detected repeatedly in at least two models during the GWAS analysis in each/across environments was fitted as a fixed effect in the model. Hence, the Xβ factor was applied only when significant SNPs from the GWAS analysis result were fitted as fixed effects on the model.
Cross-validation was implemented to evaluate the prediction accuracy of the model. For this purpose, the dataset was divided randomly as a training and testing set and conducted for 500 iterations. The percentage of training and testing set was 80 and 20%, respectively. Predictive ability was estimated as the correlation coefficient between the observed BLUEs of the genotypes and predicted values of the test set based on the effect estimates of genotypes in the training set. Prediction accuracy was then calculated from prediction ability divided by the square root of traits’ broad sense heritability (Legarra et al., 2008; Chen et al., 2011).
Results
Phenotypic Analysis
The phenotypic variation in STB and PM disease scores based on the individual environment and environments combined BLUEs is summarized in Table 1. Briefly, disease scores of both STB and PM showed a significant variation among genotypes for the combined as well as environment-specific analysis. The environment-combined broad sense heritability was generally higher for PM (0.69) than STB (0.39). The highest environment-specific repeatability was recorded from the Lithuania trial tested in 2020 for both STB and PM with 0.98 and 0.99 scores, respectively, while the lowest for STB was from the Denmark trial (0.39) and for PM from the Sweden trial (0.45). A normal frequency distribution was observed for both STB (Figure 1A) and PM (Figure 1B) for environment-combined BLUEs. Nonetheless, both normal and skewed types of frequency distributions were recorded on the environment-specific STB (Supplementary Figure 1) as well as PM (Supplementary Figure 2) disease scores. The genotype main effect plus genotype-by-environment interaction (GGE) biplot analysis was conducted using the scatter plot method to estimate genotype performance across tested environments. The first two principal components (PC1 and PC2) explained 67.4 and 84.1% of the total phenotypic variance for STB and PM, respectively (Supplementary Figure 3). Most of the tested genotypes had an average STB score for the tested environments and gathered together at the coordinates’ center (Supplementary Figure 3A). However, some genotypes such as Borstvete från Gotland, Ankar, and Hereford on Sweden while Äring on Denmark trial had better performance for STB resistance. Genotypes had a better departure for the PM resistance response and showed some environment preferences (Supplementary Figure 3B). Genotypes including Renodlat sammetsvete, Väinö, and Junker were more effective for PM resistance in the Lithuania trial conducted in 2020. The Estonia and Lithuania trials were positively correlated for environmental effect in both STB and PM diseases scores. The year effect was higher than the location effect on genotypes for PM scores at the Lithuania and Estonia trials (Supplementary Figure 3B).
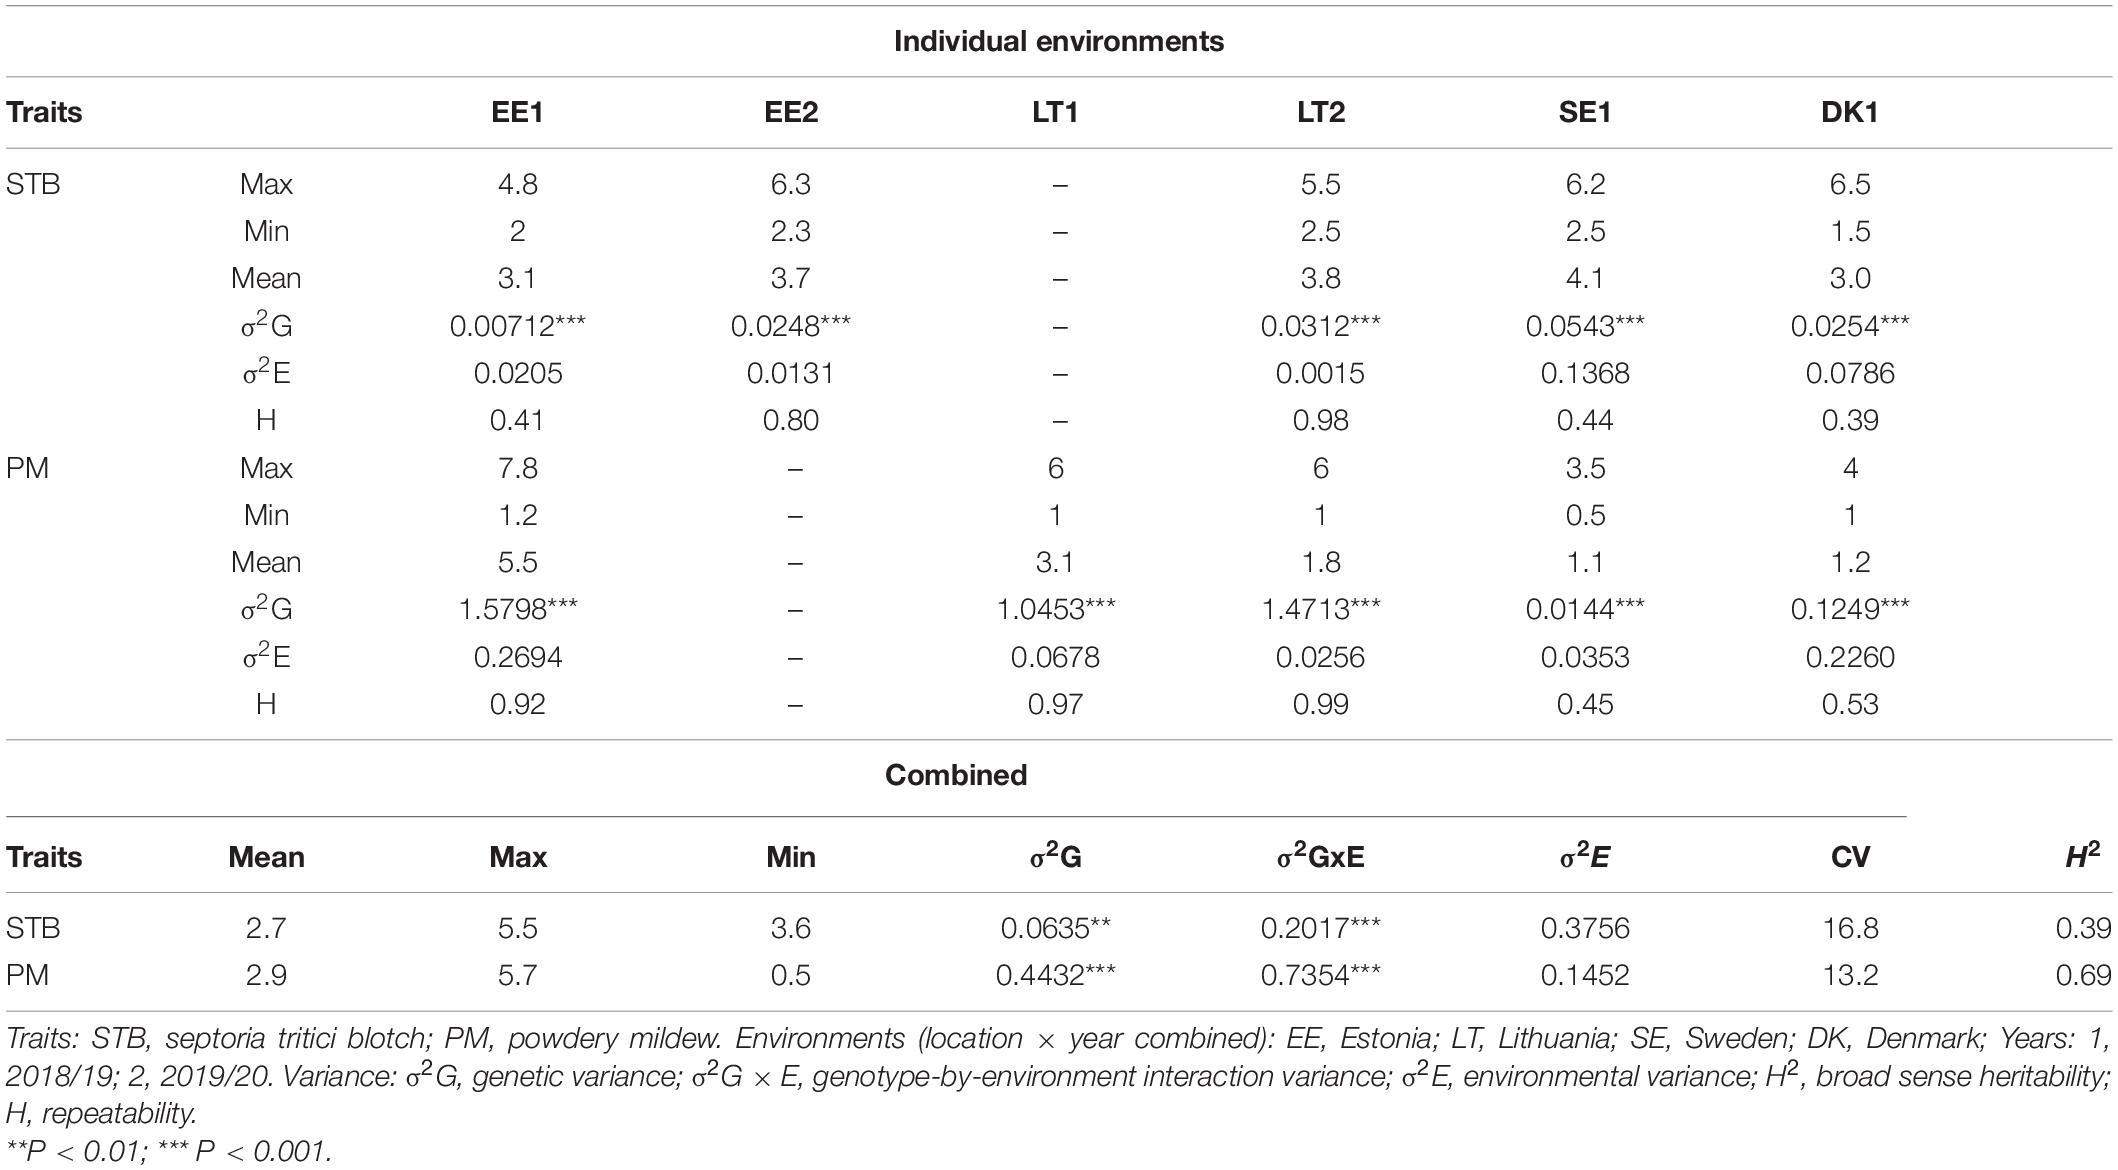
Table 1. Analysis of variance and heritability for the two disease scores across and combined environments.
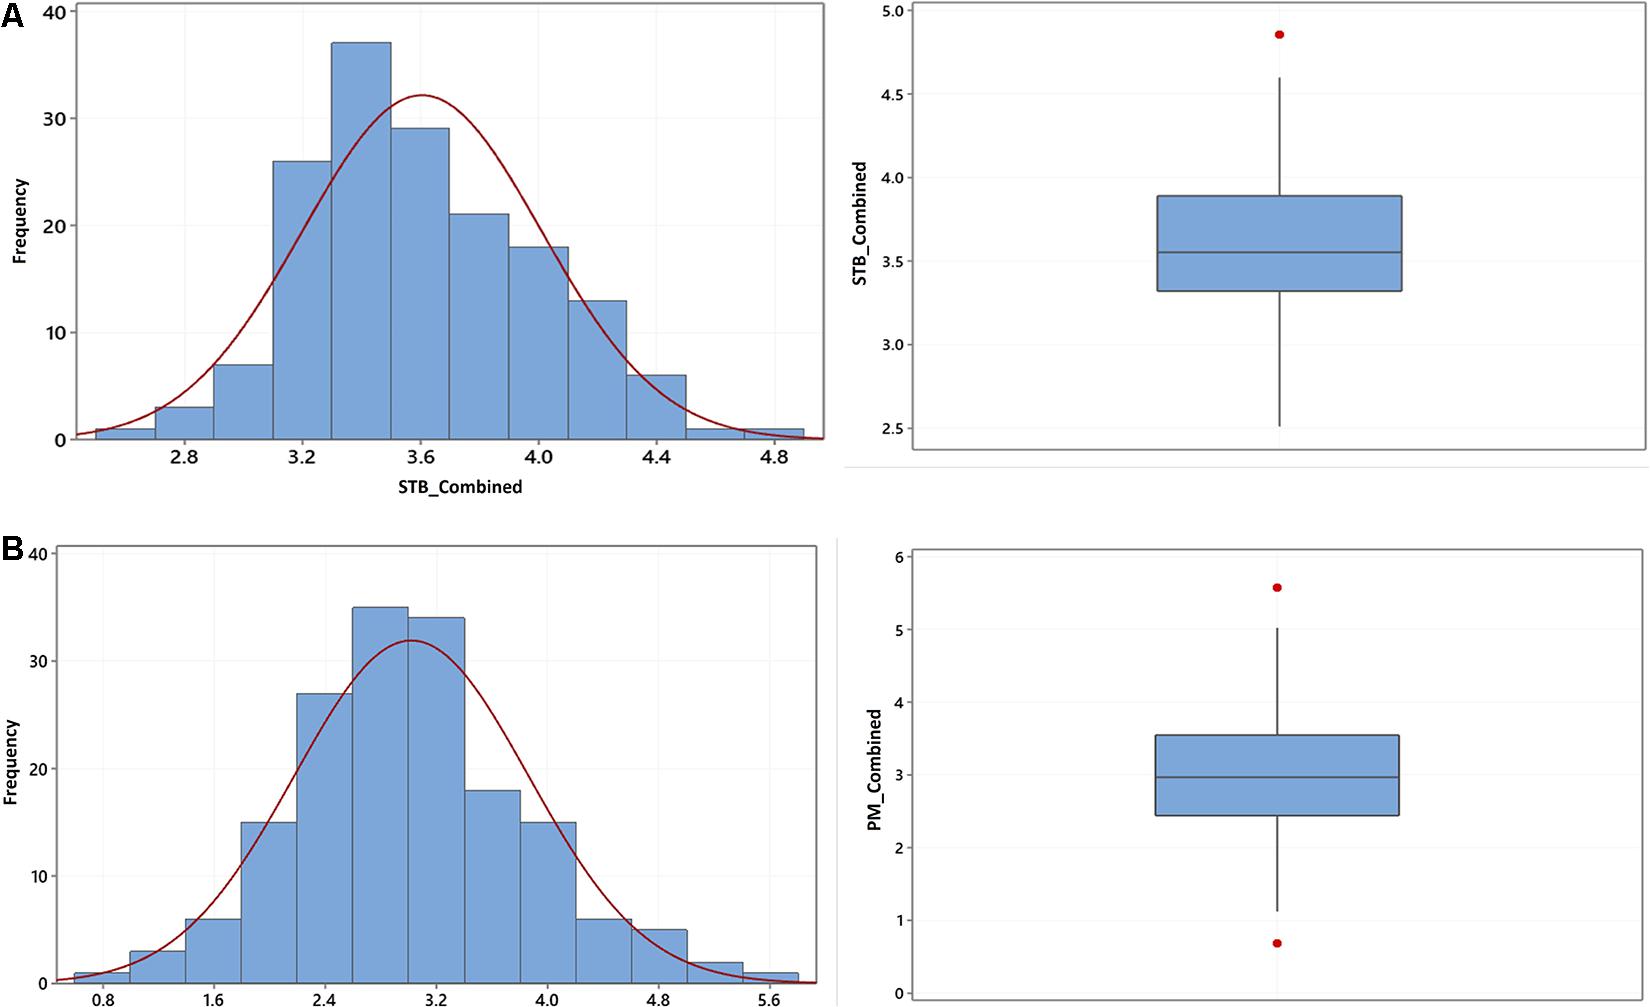
Figure 1. Frequency distribution (left) and box plot (right) of the BLUEs of (A) STB and (B) PM diseases scores combined from five environments using 175 winter wheat genotypes.
GWAS and LD Analysis
The GWAS analysis was conducted using the BLUEs from the two diseases using six different models including GLM, MLM, SUPER, MLMM, FarmCPU, and BLINK, in which the first three are single-locus while the last three multi-locus models. Population structure was modeled using PCA, and the optimal numbers of PCs were estimated based on the BIC. Ten PCs were initially included to select the best numbers of PCs with the highest BIC values, and the result indicated that three PCs were the optimal number to be included in the GWAS analysis models. The six models extensively detected stable and environment-specific QTNs for both STB and PM resistance across chromosomes. The detected QTNs with −log10(P) > 3.0 for each environment and combined analysis are reported in Supplementary Tables 1–8 for STB and in Supplementary Tables 9–18 for the PM, while Manhattan and Q–Q plots of the GWAS results are reported in Supplementary Figures 4A–F, 5A–F for STB and PM traits, respectively.
The linkage disequilibrium analysis was done with the data generated from TASSEL in 100 sliding window size. The average r2 value of the genome was 0.12, and the LD decay started at r2 of 0.48 and reached half-decay at 0.23. The LD decay curve intersected with the half-decay and the standard critical (r2 = 0.3) at 2.0 and 1.6 cM, respectively (Figure 2). This defines the ± 1.6 cM as the genome-wide critical distance to detect linkage, and QTNs within this distance could be considered as a single QTL.
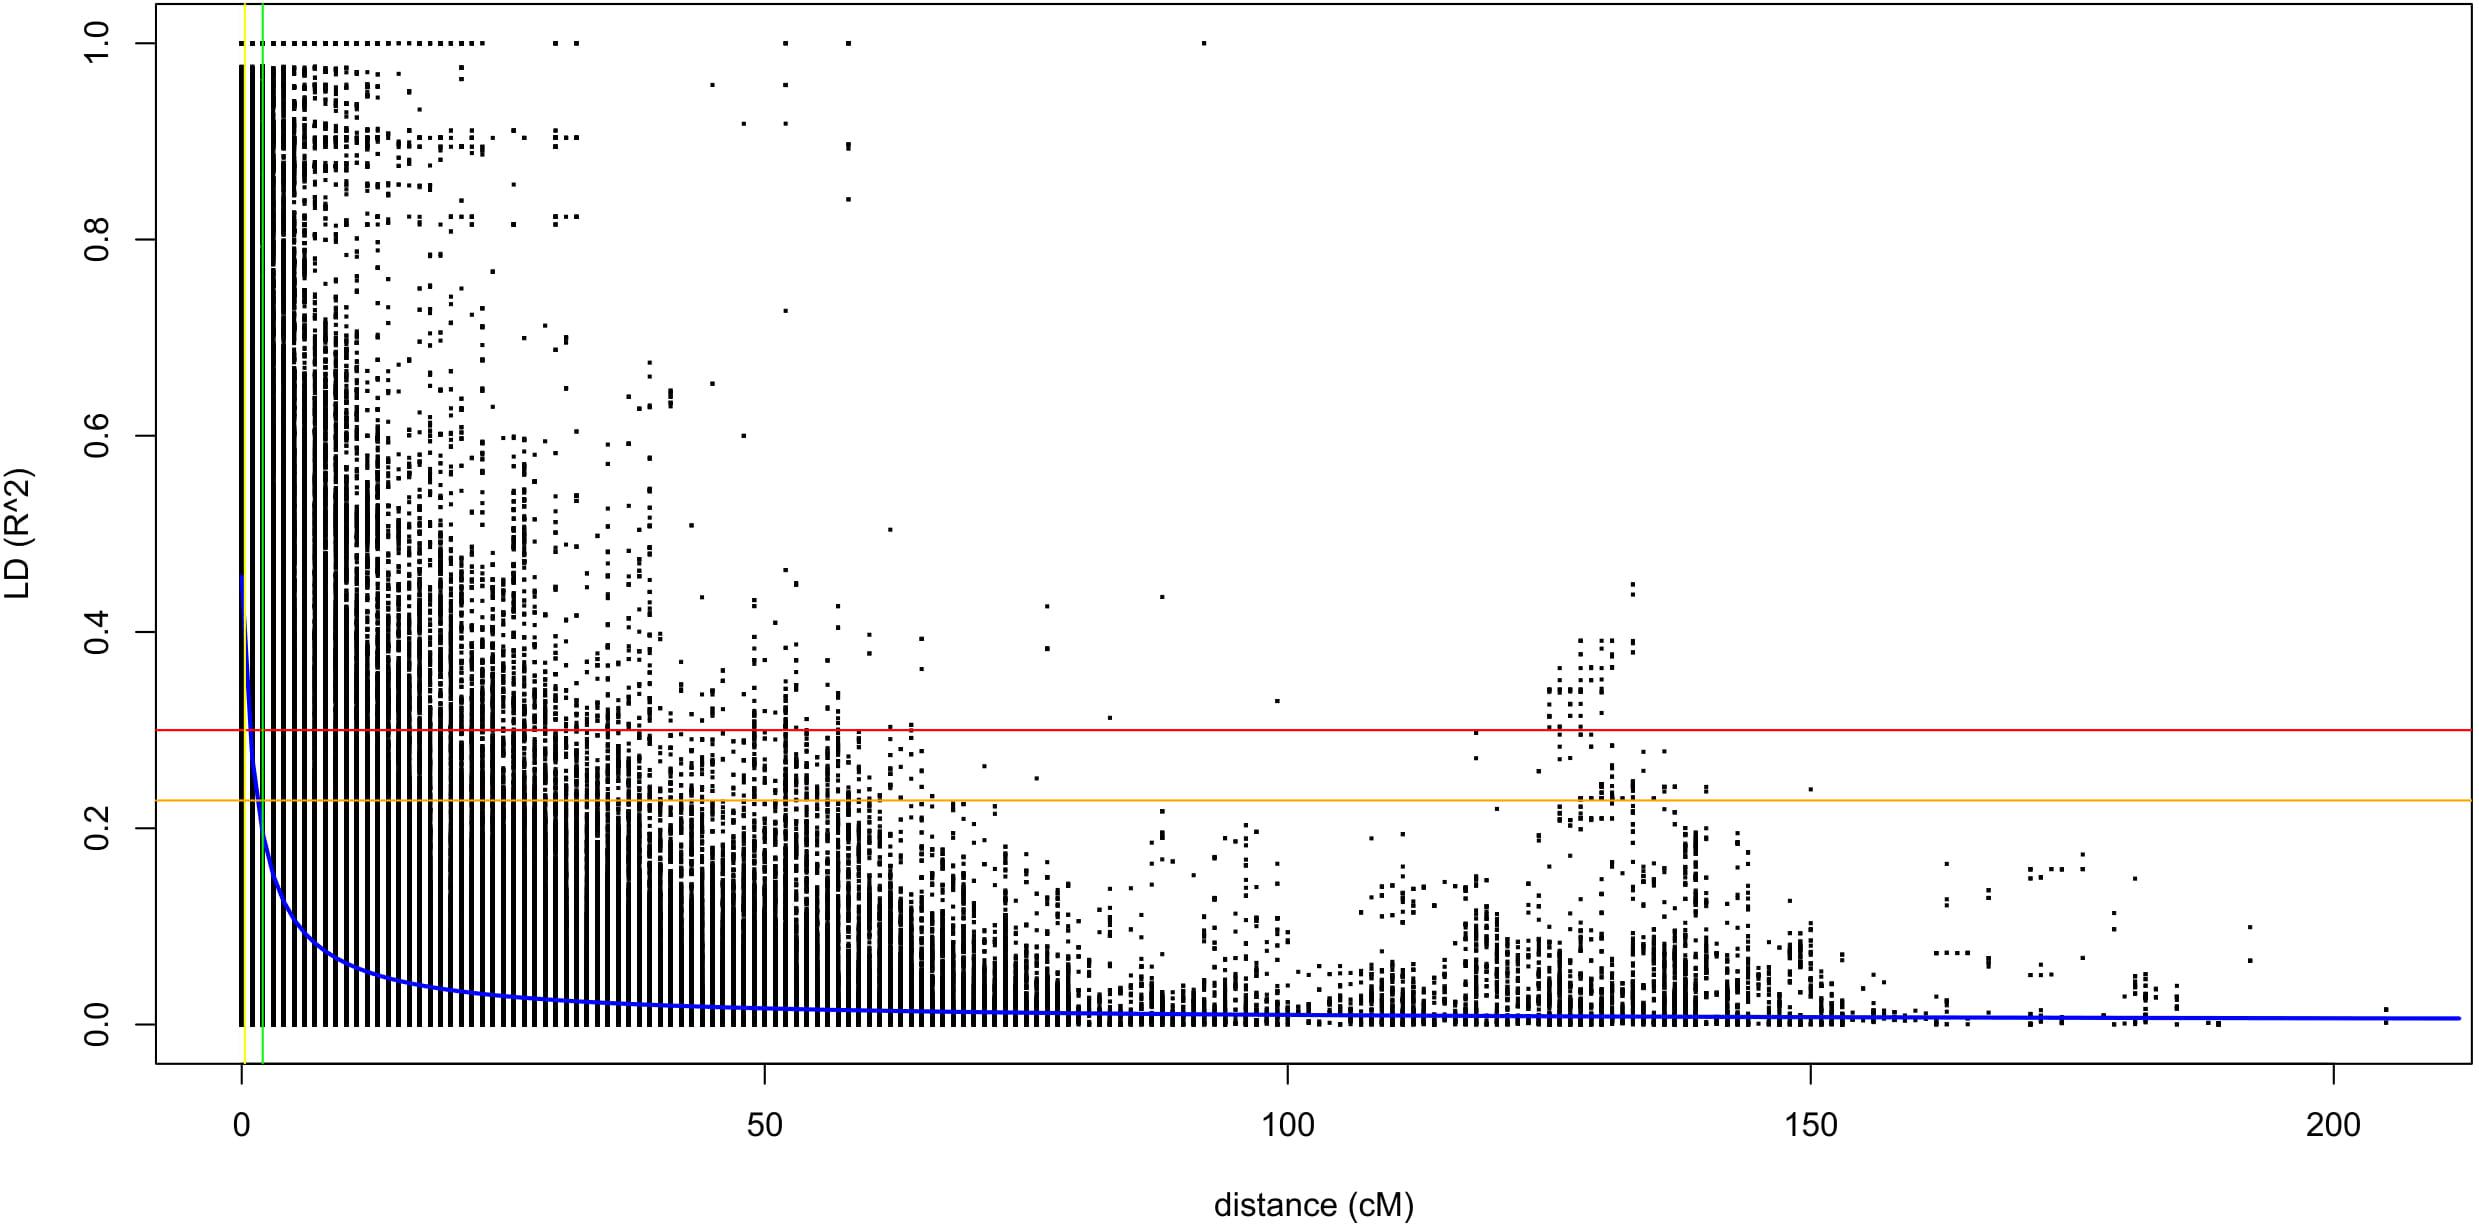
Figure 2. A scatter plot for r2 values of pairwise SNPs showing genome-wide linkage disequilibrium (LD) decay. The blue curve line is the smoothing spline regression model fitted to LD decay. The horizontal red line is the standard critical r2 value of the genome (r2 = 0.3), and the vertical yellow line is the genetic distance (1.6 cM) at the intersect between the standard critical and the LD decay curve. The vertical green line is the genetic distance (2.0 cM) at which the LD half-decay (r2 = 0.23, the vertical orange line) intersect with the LD decay curve.
GWAS for STB
This study discovered SNP markers with significant association across environments for the STB disease trait (P < 0.001). For instance, the SNP marker wsnp_Ex_c33012_41567026 on chromosome 4A was significantly associated with STB resistance in Estonia trial 2019, Estonia 2 years combined, Estonia and Lithuania combined, as well as in all environments combined (Table 2). The alleles of this marker had particularly shown a noticeable effect on the distribution of STB combined from all the five tested environments (Figures 3A,B). SNP marker RAC875_rep_c116515_181 on chromosome 3B had a significant association with significant allelic effect with STB mean values combined from all tested environments (Figure 3B). Individual genotypes carrying the favorable allele (i.e., guanine) on SNP markers wsnp_Ex_c33012_41567026 and wsnp_Ku_c38451_47086066 on chromosomes 4A and 6A decreased STB susceptibility by 4.3 and 4.4%, respectively (Figure 3B). Markers BS00021714_51 and RAC875_c68120_285 on chromosomes 1A and 5A, respectively, had a significant association with STB mean values scored from Estonia (2020), Estonia 2 years combined, and Estonia and Lithuania combined mean values. In addition to the marker RAC875_c68120_285, five markers (BS00065313_51, RAC875_c31670_389, BobWhite_c11512_157, Kukri_c63163_141, and Excalibur_c2598_2052) positioned within 1-cM interval had shown a significant association with STB scored from Estonia in 2020 (Supplementary Table 2 and Supplementary Figure 4A). The wsnp_Ku_c38451_47086066 marker on chromosome 6A had a significant MTA with the STB disease scored in Sweden and all environments combined (Table 2). Similar regions on chromosome 2B were detected with SNP markers having a significant association for BLUEs STB values scored from Sweden and Denmark trials (Supplementary Tables 4,5). Chromosomes including 1B, 2B, 3B, 5A, and 5B were the sources of environment-specific QTNs for STB.
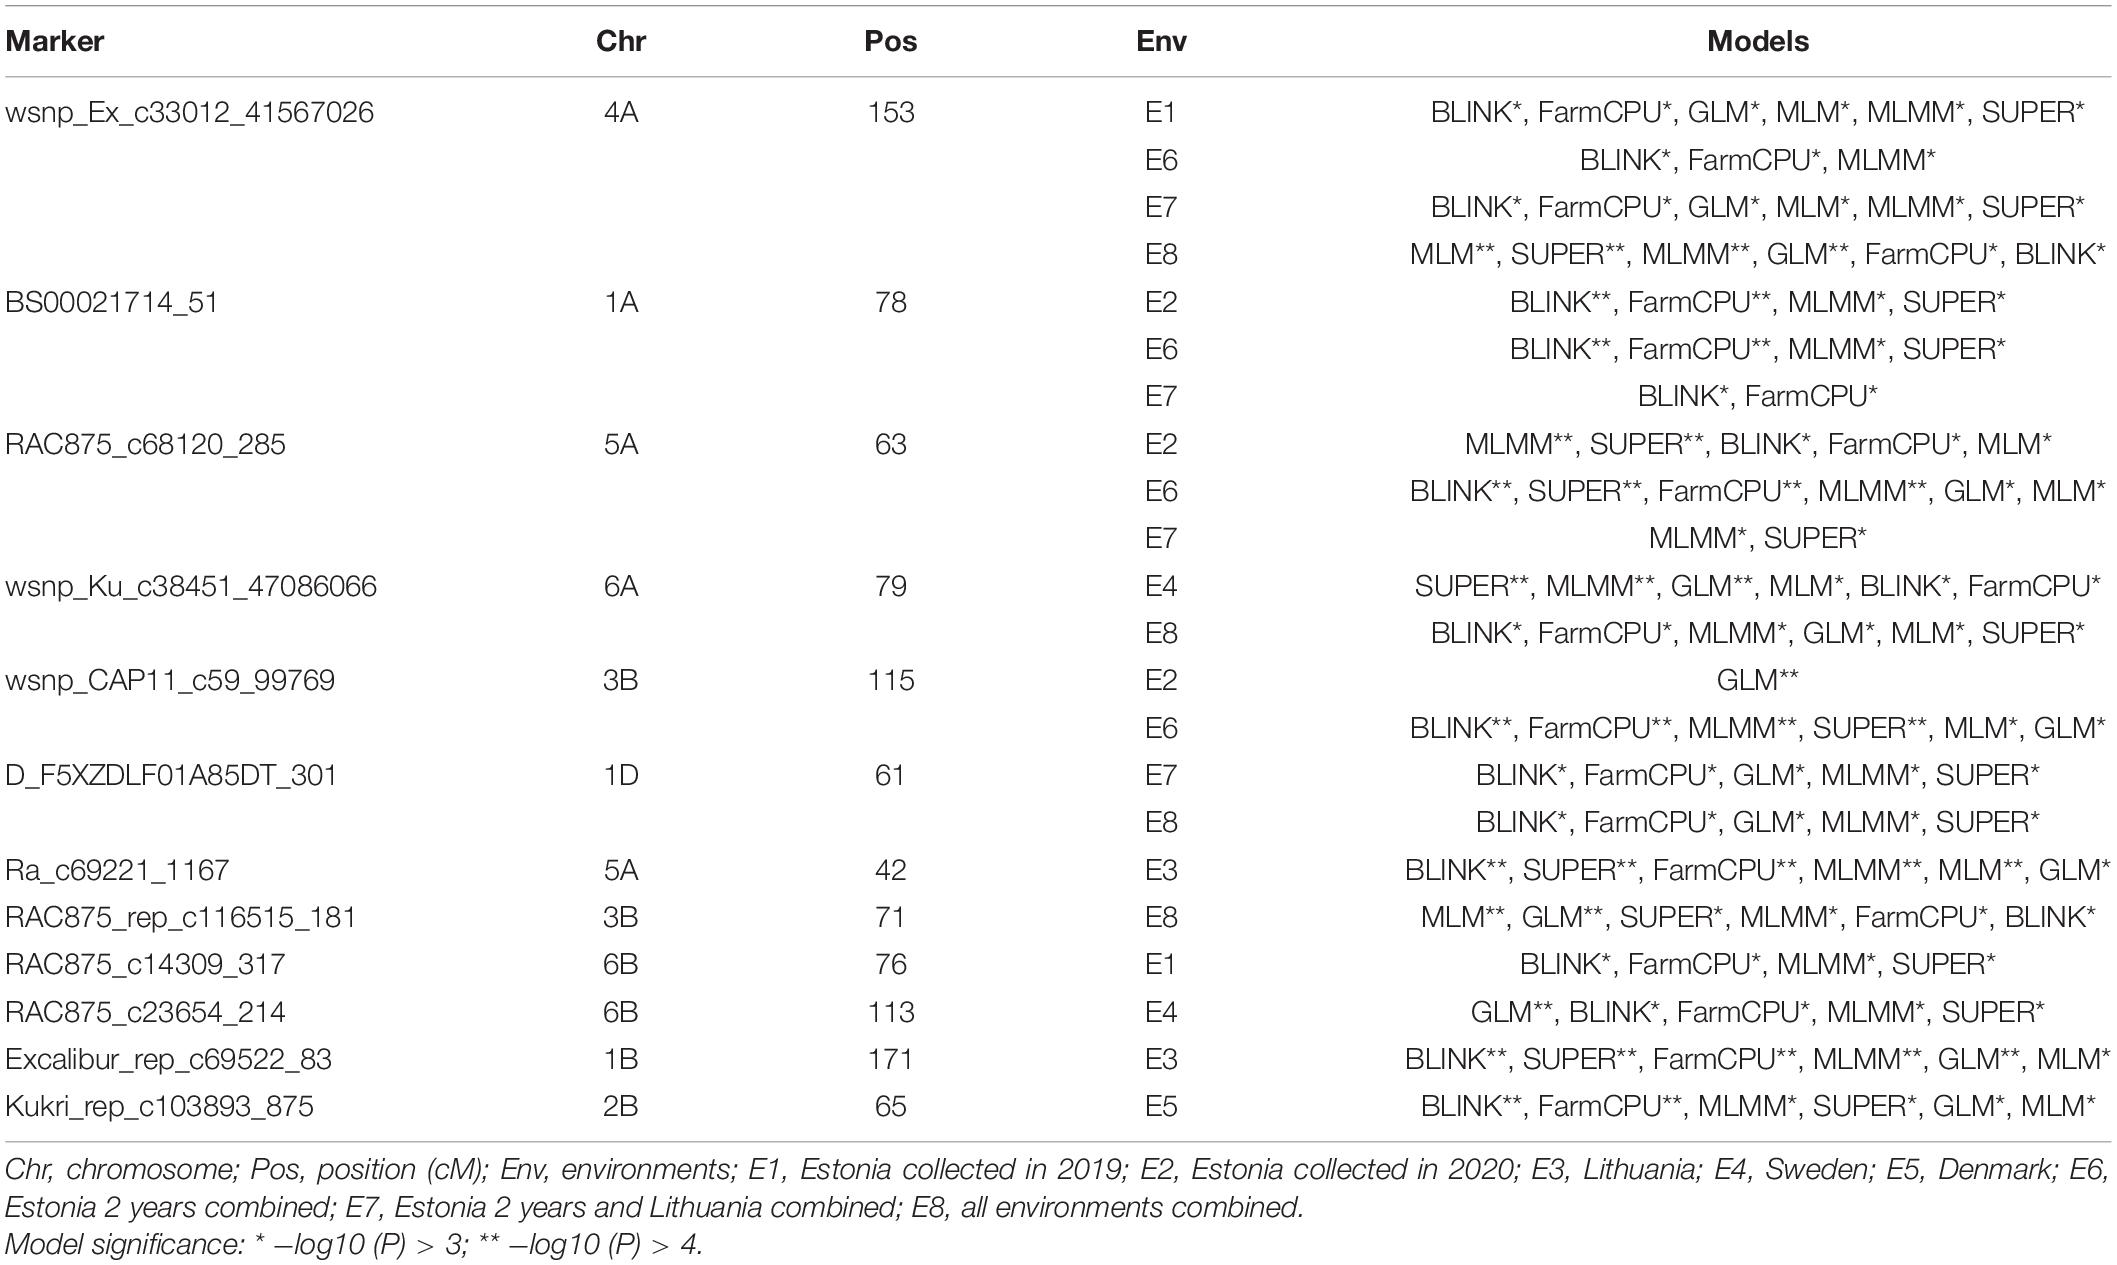
Table 2. Summary of GWAS results for significant SNP markers for Septoria tritici blotch.
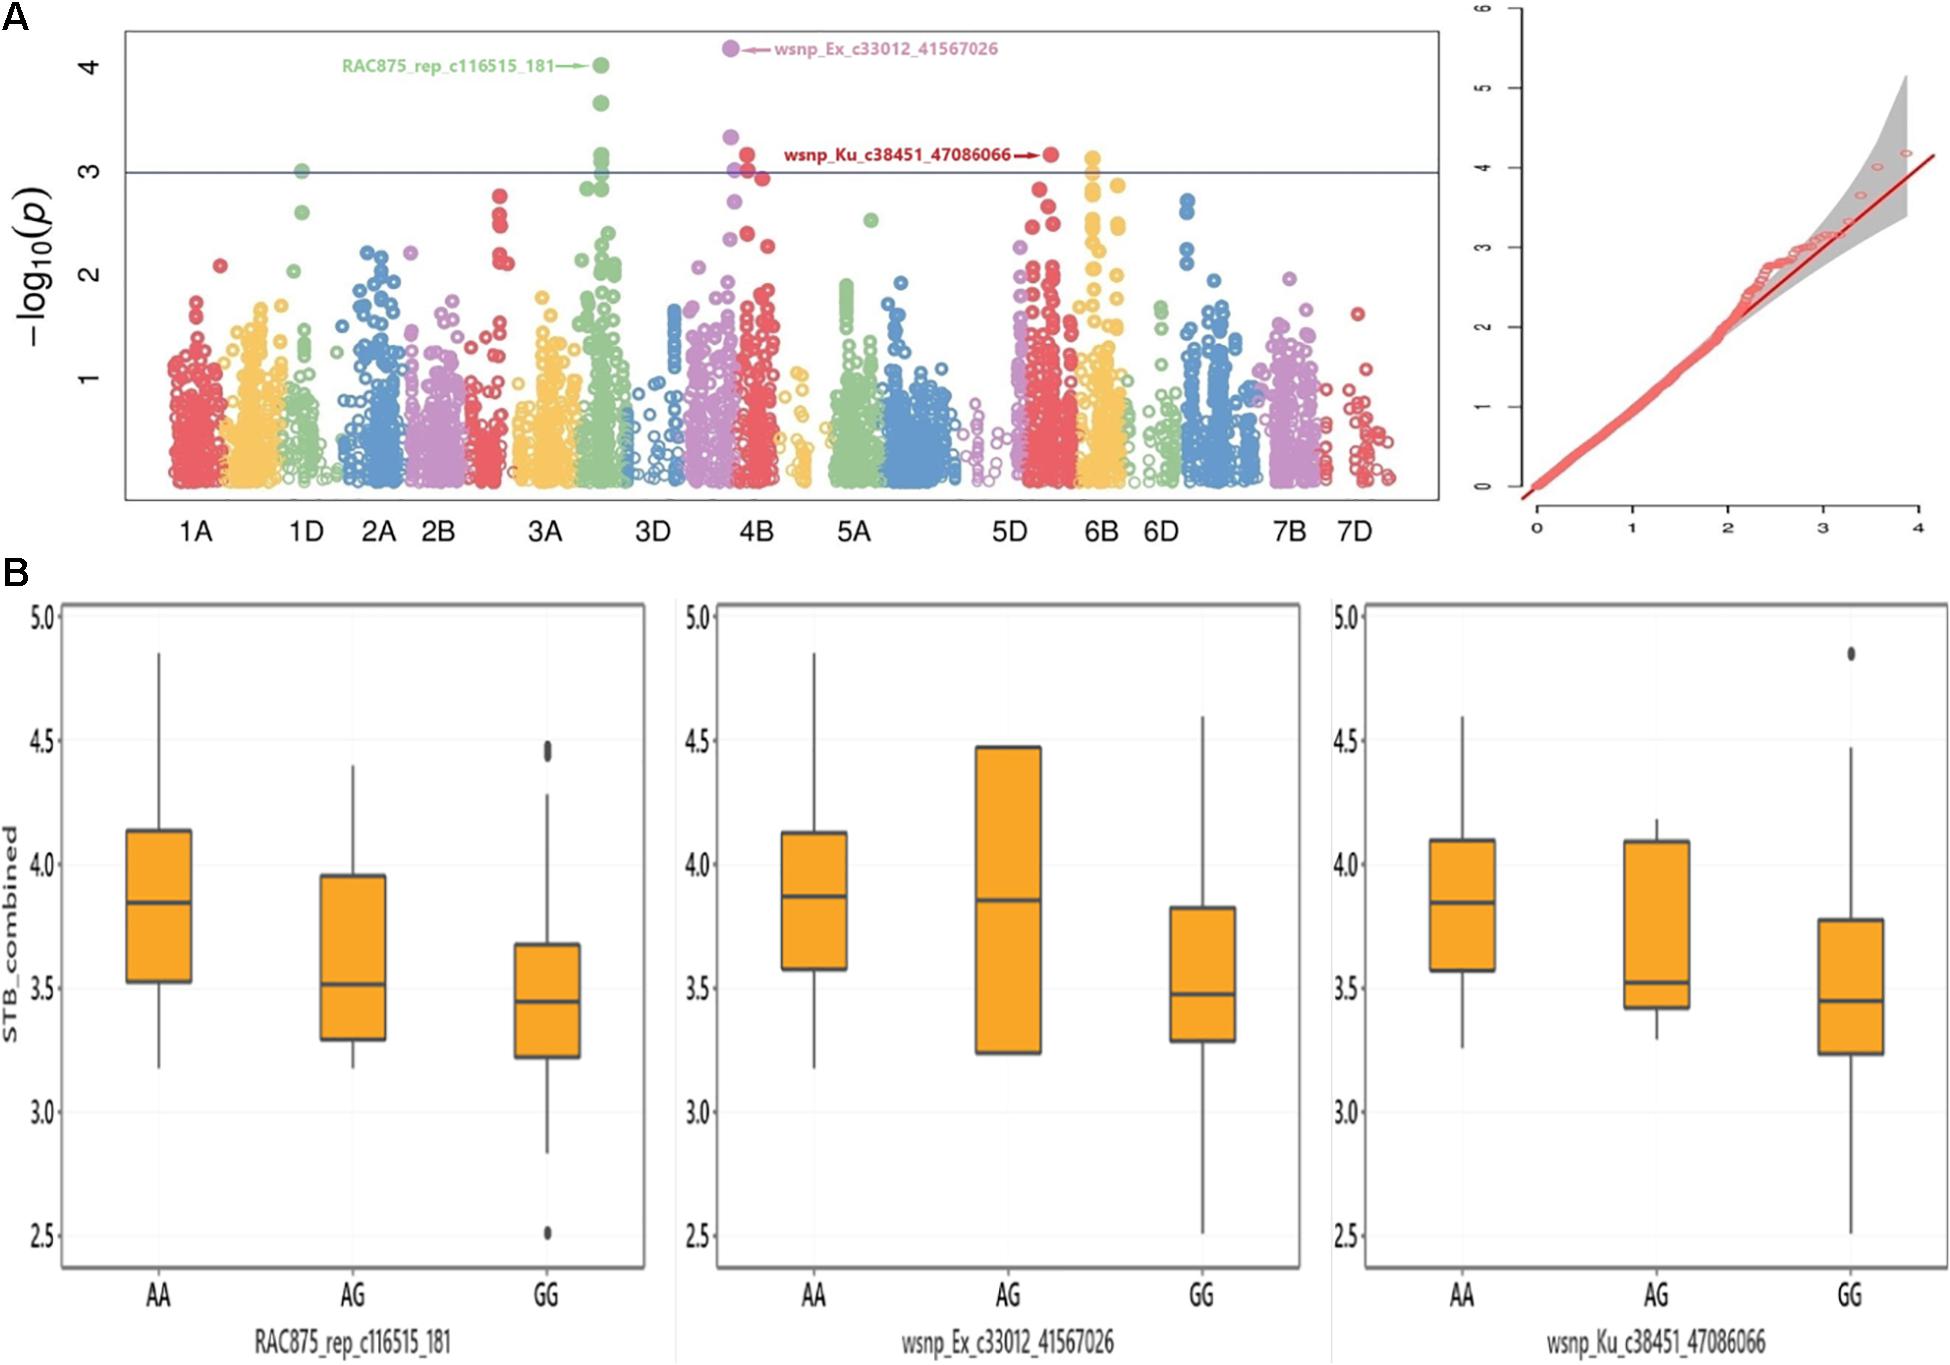
Figure 3. (A) Manhattan (left) and Q–Q (right) plots for GWAS result of adult-plant resistance response to STB and (B) box plots for STB resistance values grouped by alleles of the SNP markers RAC875_rep_c116515_181, wsnp_Ex_c33012_41567026, and wsnp_Ku_c38451_47086066.
GWAS for PM
The marker RFL_Contig2834_890 on chromosome 7A had a multi-environment significant MTAs with PM mean scores at P < 0.001 (Table 3). This SNP marker alleles had an apparent effect on the distribution of mean values combined from five trials (Figures 4A,B). The SNP markers wsnp_Ex_c790_1554988 and Kukri_c6266_260 on chromosome 5A positioned at 98 and 97 cM, respectively, had a significant association with PM from Lithuania (2020), Lithuania 2 years combined, Lithuania 2 years and Estonia 1 year combined, Sweden and Denmark combined, as well as with the all five environments combined mean values. The marker wsnp_Ex_c790_1554988 had a significant association with noticeable PM disease score effect across its alleles (Figures 4A,B). Genotypes carried the thiamine allele of the marker Ku_c43151_811 was notably susceptible for PM, while the reverse was true on the SNP marker RFL_Contig2834_890 (Figure 4B). The SNP marker BobWhite_c15773_166 on chromosome 2A had a significant MTA with Lithuania (2019), Sweden explaining 19% from the total phenotypic variance (R2), Denmark and Sweden combined (R2 = 19.7%), and overall combined PM mean values. The SNP marker wsnp_Ex_c14340_22315611 on chromosome 3A was the other stable QTN showing significant association with PM scores from Lithuania, Sweden, Denmark, and Lithuania and Estonia combined mean values. A total of 36 SNP markers on chromosome 3A (including the multi-environment QTN, wsnp_Ex_c14340_22315611) positioned within 3-cM interval (88–91 cM) exhibited a significant MTAs with PM scores from Lithuania trial conducted in 2019 (Supplementary Table 10 and Supplementary Figure 5B). Chromosomes such as 2D and 7B were the other sources of multi-environment stable QTNs, while 2A, 4B, and 6B were the highly significant multimodel environment-specific QTNs for PM (Table 3).
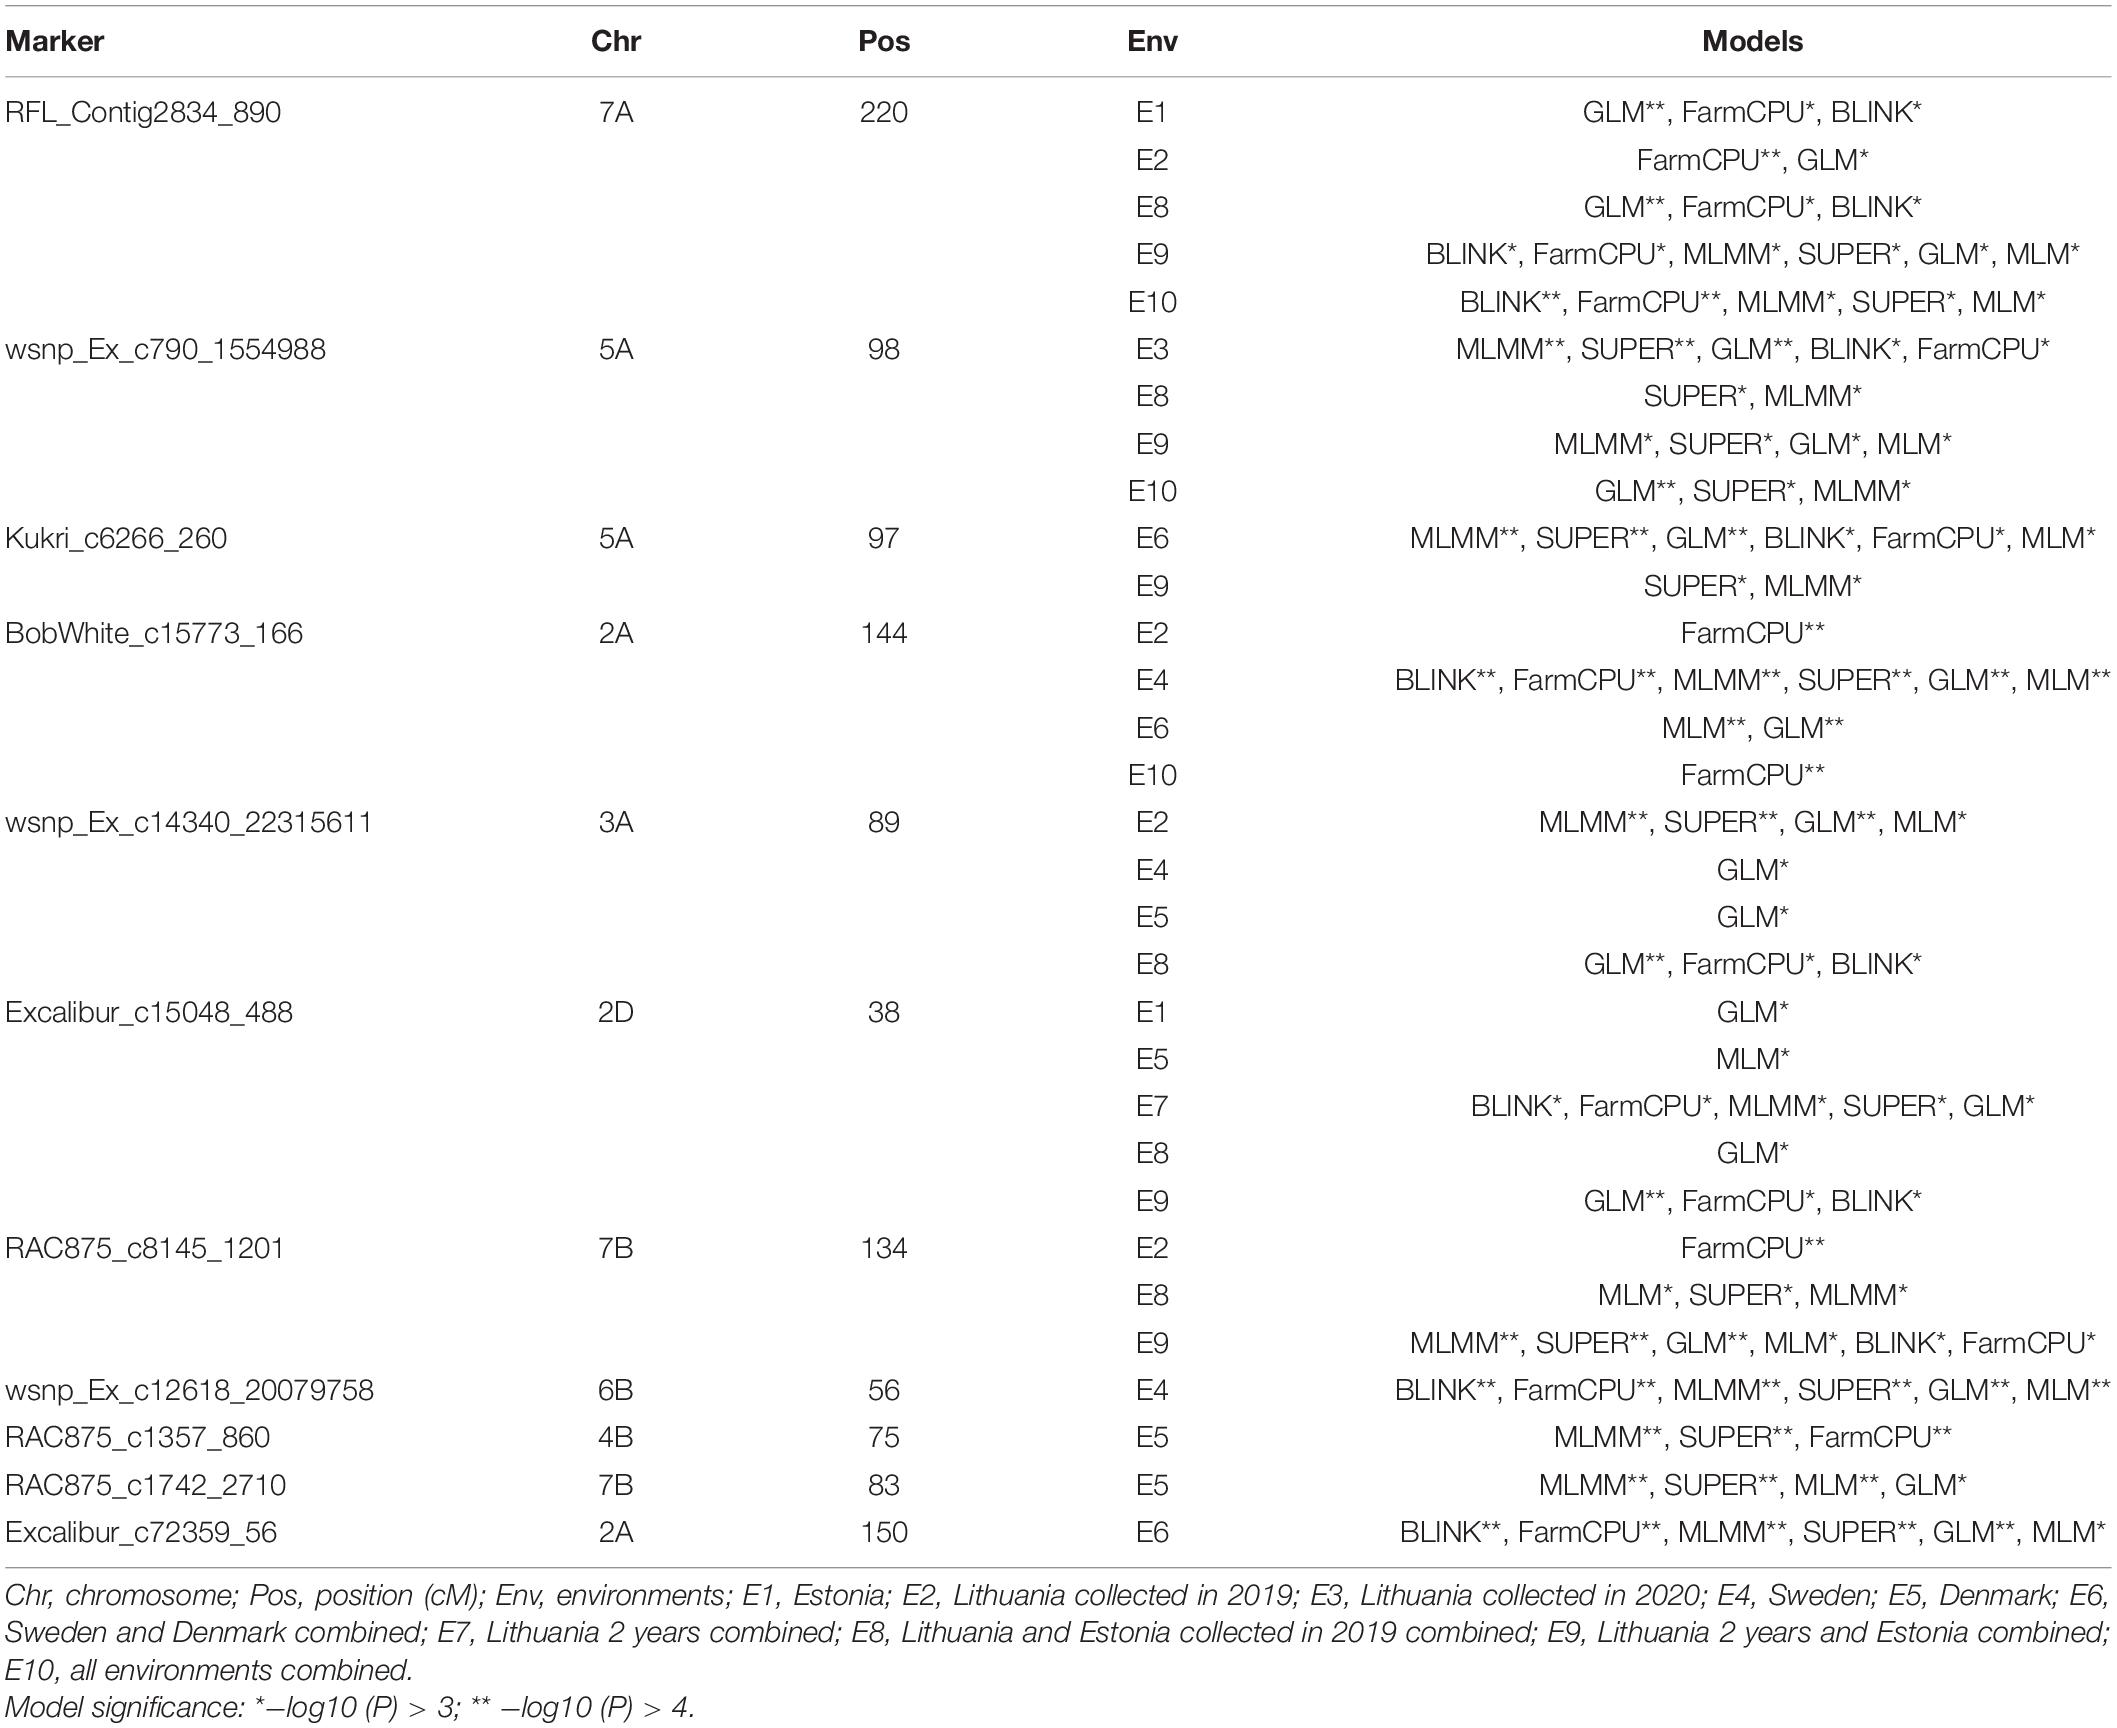
Table 3. Summary of GWAS for SNP markers with significant and stable marker trait associations for powdery mildew.
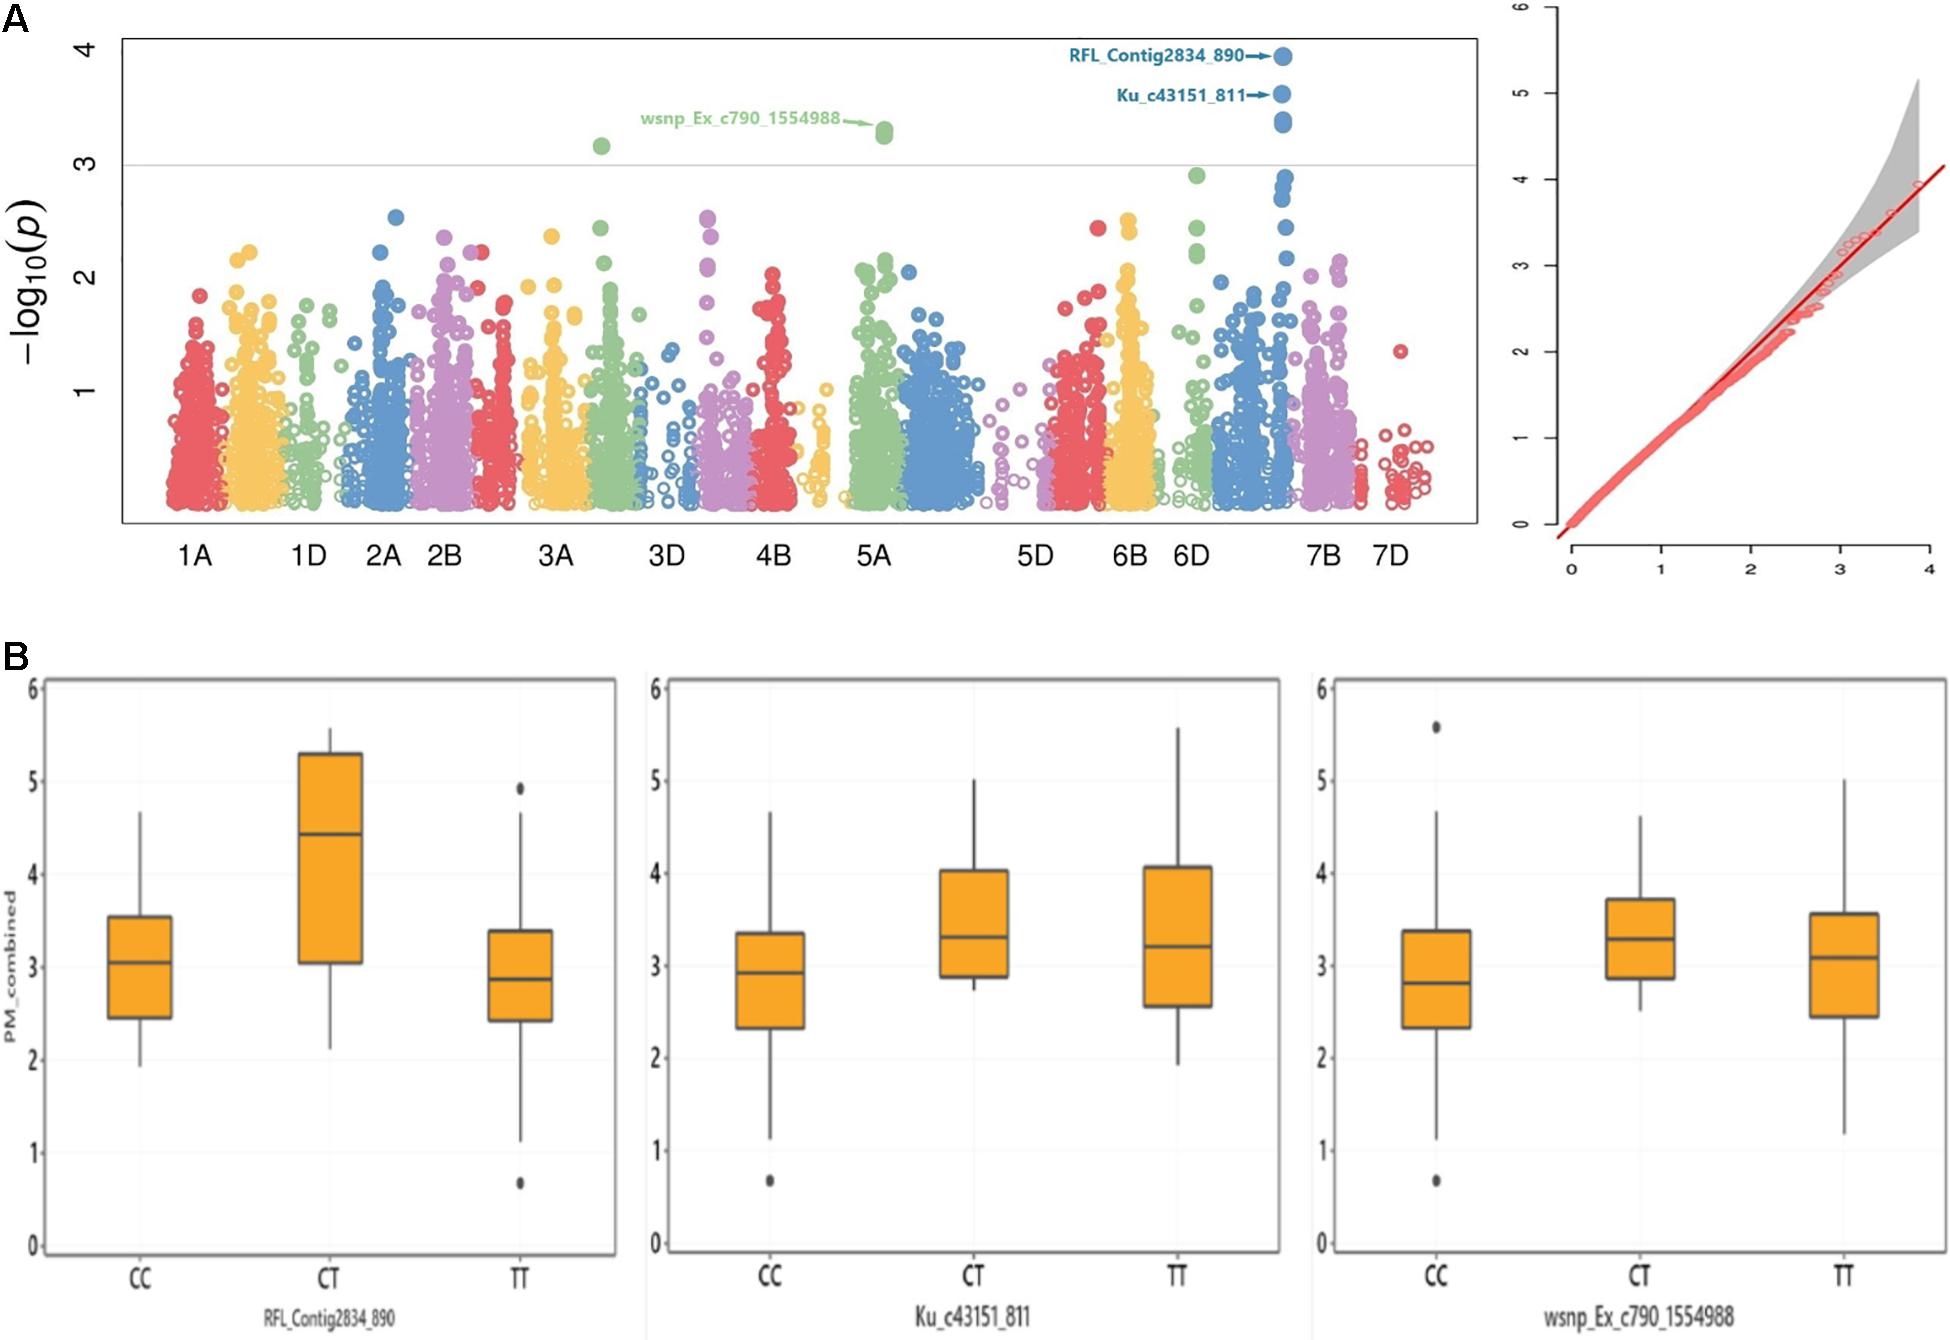
Figure 4. (A) Manhattan (left) and Q–Q (right) plots for GWAS result of adult-plant resistance response to PM and (B) box plots for STB resistance values grouped by alleles of the SNP markers RFL_Contig2834_890, Ku_c43151_811, and wsnp_Ex_c790_1554988.
Genomic Prediction
Two different models were applied to predict the genomic breeding values of individual genotypes. GP accuracy was tested through cross-validation using 500 randomly generated datasets from 80 and 20% training and prediction sets, respectively. The first approach was based on the RR-BLUP model in which all SNP markers were fitted as a random effect. With this model, the STB disease score’s GP accuracy was ranged between 0.15 and 0.43. The Estonia trial conducted in 2019 scored the lowest GP accuracy (0.15), while the five environments combined BLUEs mean values scored the highest GP accuracy (0.43) (Figure 5A). For PM disease resistance, the Estonia trial had the highest GP accuracy with 0.62, while the lowest from the Lithuania trial conducted in 2020 with only 0.18 (Figure 5B). The wRR-BLUP was the other utilized model in which the five topmost significant markers detected during the GWAS analysis were fitted as fixed effects. The SNP markers used in this model are given in Supplementary Table 19. This model significantly improves the GP prediction accuracy of the previous model for both disease traits, signifying large effects from these QTLs. For instance, the GP accuracy of STB APR trials conducted in Sweden and Denmark improved from 0.31 and 0.32 to 0.66 and 0.61, respectively (Figure 4A). Likewise, the GP accuracy for PM disease scores conducted in Sweden and Estonia increased from 0.33 and 0.46 to 0.83 and 0.60, respectively (Figure 5B).
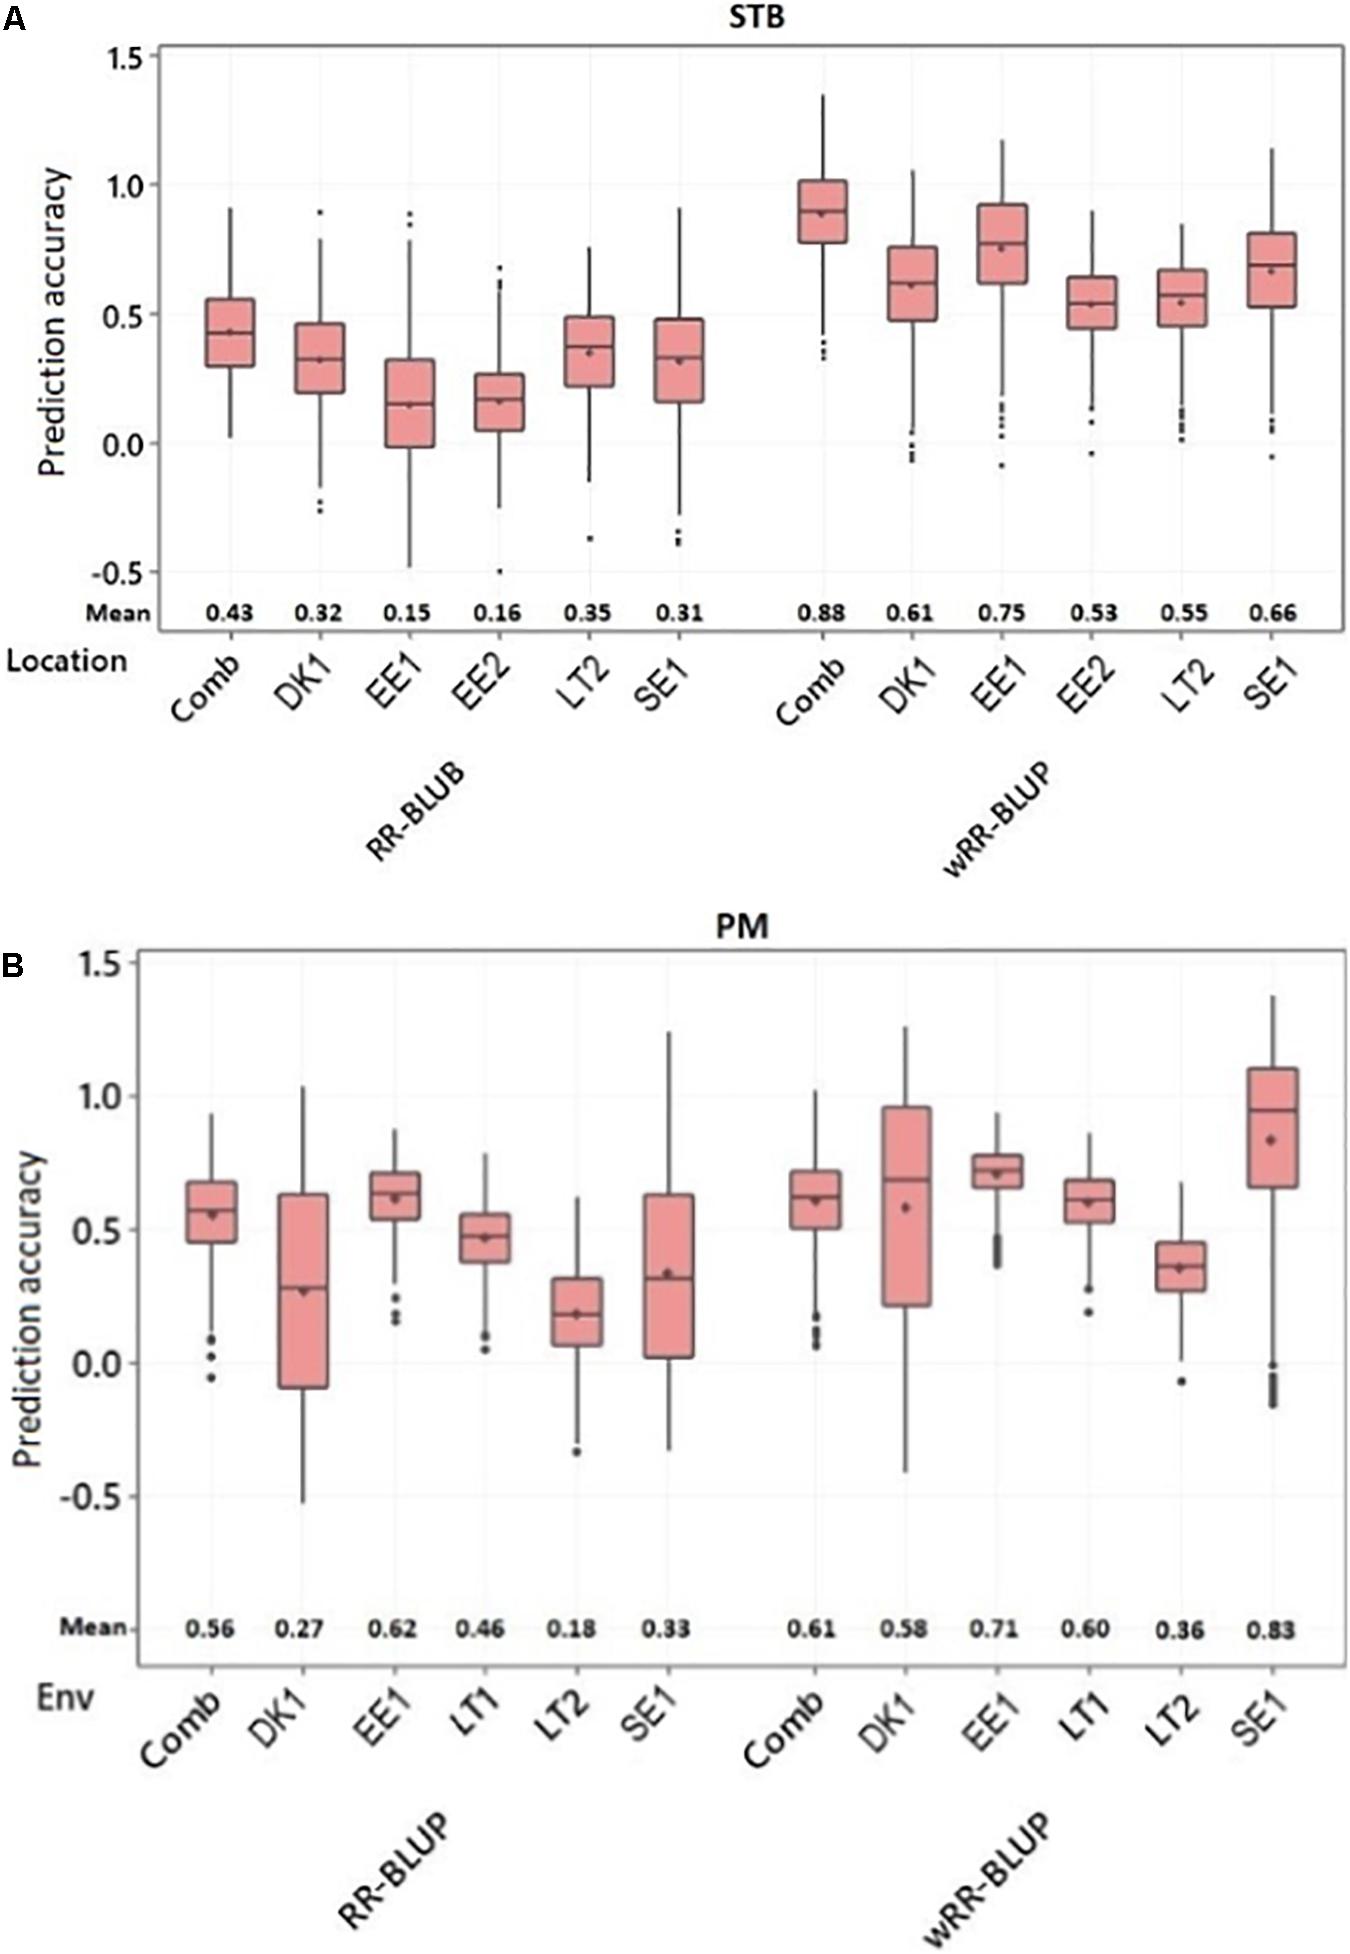
Figure 5. Box plot for the genomic prediction accuracy of the ridge regression BLUP (RR-BLUP) and weighted RR BLUP (wRR-BLUP) models for adult-plant resistance to (A) STB and (B) PM. Comb, combined; EE, Estonia; LT, Lithuania; SE, Sweden; DK, Denmark; Years: 1, 2018-2019; 2, 2019-2020.
Discussion
This study evaluated 175 genetically diverse winter wheat genotypes from the NordGen genebank to detect QTLs and estimate genomic breeding values of genotypes for adult-plant disease resistance for STB and PM. These two foliar diseases are regarded as two major biotic threats for European winter wheat production. The panel integrates landraces and cultivars originated from Sweden, Denmark, Finland, and Norway, representing the previous century winter wheat breeding practices in the region (Odilbekov et al., 2019a). Genotypes demonstrated a wide range of genetic variation for STB and PM disease resistance response in adult plants scored across five environments. The presence of medium to high range of repeatability scored across studied environments coupled with the existing higher genetic variation designates the suitability of the phenotypic data for GWAS and GP analysis.
GWAS and GP for STB
The panel was previously tested for seedling resistance to STB with artificial inoculation in Biotron greenhouse chamber, and genotypes had a significant genetic variation for STB resistance response (Odilbekov et al., 2019a). In this study, a highly significant genetic variation was observed for STB disease APR across the five studied environments tested under field conditions. In addition, highly significant G × E interaction was recorded for the environments combined analysis, indicating the unequal disease pressure across locations and years, which is a widely occurring phenomenon in previous studies (Dreisigacker et al., 2015; Muqaddasi et al., 2019). The quantitatively inherited genetic factors for STB are generally prone for G × E interactions (Schilly et al., 2011). Nonetheless, the recorded higher genetic variance coupled with the medium to high environment-specific repeatability could make the phenotypic data convenient for GWAS and GP analysis.
In addition to the renowned stb genes, several QTLs have been involved for resistance to STB in wheat with moderate-to-small effects (Brown et al., 2015). All the seedling stage QTLs identified previously by Odilbekov et al. (2019a), except those on chromosomes 1A and 3A, were also detected as stable and environment-specific QTNs in this study attesting their potential to be the source of genes for STB resistance at all plant stages. He et al. (2020) discovered an APR QTL against STB in common wheat line Murga on chromosome 3B, while Odilbekov et al. (2019b) reported a seedling-resistant QTL on chromosome arm 1BL (96–99 cM). Similarly, significant SNPs were detected in this study on 1BL from Sweden (95 cM), Denmark (155–159 cM), and Lithuania (171 cM) trials. This study detected stable as well as environment-specific QTLs for STB APR. The marker wsnp_Ex_c33012_41567026 on the long arm of chromosome 4A, positioned at 739.52 MB [according to the International Wheat Genome Sequencing Consortium (2018)], was one of the stable QTNs detected in this study. This chromosome region is the source of race-specific resistance genes, including Stb7 (McCartney et al., 2003) and Stb12 (Chartrain et al., 2005). However, due to the different marker tools applied, it was difficult to put this SNP marker’s exact position related to the genes mentioned earlier. Notwithstanding, Muqaddasi et al. (2019) reported an SNP marker wsnp_JD_c27162_22206547 (664.14 MB) for adult-plant STB resistance in European Winter Wheat, which is found close to the currently detected marker. Similarly, Riaz et al. (2020) detected QTLs on chromosome arm 4AL (BS00040648_51, 594 MB) for adult-plant STB resistance using an eight-founder MAGIC winter wheat population. The other stable marker detected in this study was BS00021714_51 (78 cM), according to Wang et al. (2014b) on the long arm of chromosome 1A, which is nearby to the SNP marker wsnp_Ex_rep_c109742_92411838 (81 cM) discovered previously by Muqaddasi et al. (2019). Riaz et al. (2020) also found a QTL on this chromosome region (70–78 cM) for STB resistance in winter wheat adult plants in the field. Chromosome 5A was the other region comprising a lot of SNP markers with stable and environment-specific highly significant QTNs for STB resistance including Kukri_c63163_141 that explained 8.0% from the total phenotypic variance. Chromosome arm 5AL is a region in which stb17 gene was discovered previously in adult plants of synthetic hexaploid wheat (Ghaffary et al., 2012), which is nearby (62 cM) to our finding (63 cM). Similarly, Muqaddasi et al. (2019) reported multi-QTNs on chromosome 5A (48.1–90.4 cM) for STB resistance to adult plants of European Winter Wheat. Dreisigacker et al. (2015) detected a QTL (29.4–36.9 cM) on chromosome arm 5AL for APR to STB in spring bread wheat. This study identified a stable QTN on chromosome 6A (wsnp_Ku_c38451_47086066, 79 cM) in which the race specific resistance gene stb15 was detected previously (Arraiano et al., 2007). This gene is commonly found in European winter wheat cultivars, but its resistance was ratified in the seedling stage. However, Miedaner et al. (2013) detected a QTL on chromosome 6AS (14.2 cM) for STB APR in 1055 elite wheat hybrids and their 87 parental lines although quite far from the QTN detected in this study. Moreover, the current study detected other stable as well as environment-specific QTLs on chromosome arm regions including 1DS, 2BS, 3BL, 3BS, and 6BL in which most of them were reported previously by others including Riaz et al. (2020), but the 1DS and 3BL QTLs could be potentially newly discovered in this study for STB APR in wheat.
For the past two decades, GP has been effectively used as a powerful tool to select favorable genetic material for traits of interest based on their dense genome-wide markers (Meuwissen et al., 2001; Mirdita et al., 2015; Crossa et al., 2017). GP could even be more feasible for traits like STB in which several QTLs with minor-to-moderate effect are involved in plant resistance (Brown et al., 2015). Besides, most known stb genes are one or few race-specific pathogen (Brown et al., 2015) and lack the broad-spectrum application. Hence, incorporating several QTLs is the most sustainable approach in developing breeding lines with resistance to the pathogen. Since the current panel comprises both landraces and historical cultivars, GWAS detected several QTLs with minor-to-moderate effect that suggested the GP method could be more appropriate to account them all and predict lines based on their overall marker effect. In this study, two GP models (i.e., RR-BLUP and wRR-BLUP) were implemented to predict accessions’ genomic breeding values. The GP accuracy of STB resistance with RR-BLUP model was low to moderate across environments with a range of 15–35%. Considering the highly diverse genetic composition, smaller numbers of genotypes, and marker density used to train the model, the recorded GP accuracy could be promising. This model assumes that all markers share a common variance, and their effects are shrunken toward zero (Lorenz et al., 2011). This can lead to underestimation of variances on QTLs with major to moderate effects. To overcome this problem, a wRR-BLUP was implemented in which QTLs with major effect could be fitted as fixed effects (Spindel et al., 2016). In this study, the GP accuracy increased significantly when the five topmost significant SNP markers for STB resistance were fitted as fixed effect. The wRR-BLUP improved the GP accuracy and ranged 53–75% across environments. This outcome is in agreement with previous studies (Arruda et al., 2016; Spindel et al., 2016; Herter et al., 2019).
However, it is important to note that the prediction accuracies of wRR-BLUP could be overestimated, since the significant markers from the GWAS fitted as fixed effects were obtained from the complete dataset (100%) but not from each of the simulated 500 training set (TS). For unbiased estimates in wRR-BLUP, separate GWAS must be conducted for each of the 500 TSs to detect significant SNPs fitted in the wRR-BLUP model as fixed effects. Unfortunately, this is highly computationally demanding (Gaikpa et al., 2021) because it will require 500 runs each for the GWAS, TS, and test sets. In a practical GP breeding program, one TS is usually involved instead of the 500 pseudo-TS simulated in our study. Besides, in practical breeding, we aim to identify QTLs in certain populations and validate these QTLs and markers designed for marker-assisted selection. The markers developed from stable QTLs can be used to screen across diverse populations, which may be connected at different levels to the original population(s) used to identify the QTLs for the markers. In this case, separate GWAS or QTL analyses are not conducted for each breeding population once markers are available. Therefore, the identification of markers in the entire dataset by GWAS for wRR-BLUP in our simulation study can provide an insight into the prospect of genomic selection using a subset of SNPs identified by GWAS for disease resistance breeding in wheat (Herter et al., 2019). An independent training and validation set might result in unbiased estimates of the prediction accuracy.
GWAS and GP for PM
The panel was tested in field conditions for PM resistance in five environments. The results indicated a highly significant variation in resistance response toward the pathogen (Table 1). A significant G × E interaction was observed for PM response, but a higher broad-sense heritability (69%) was recorded from environment-combined analysis assuring the quality of the phenotypic data and its suitability for detecting trustworthy QTLs and predicting the genomic estimated breeding values (GEBVs).
The wheat plant resistance to PM is inherited qualitatively by the major Pm genes and quantitatively by small-to-moderate effect genes (Alam et al., 2011). The major Pm genes are generally race specific and effective against particular PM isolates that makes them last for a short duration due to the unpredicted and frequent change of the pathogen population (Marone et al., 2013). Subsequently, adult-plant resistance, also called slow mildewing, controlled by several genes (polygenes/QTLs), is introduced as the source for durable PM resistance in wheat (Liang et al., 2006). The current study detected several stable and environment-specific QTLs for PM resistance in adult winter wheat. The marker RFL_Contig2834_890 (722.30 MB) on chromosome arm 7AL, where the Pm1 gene was detected previously (Hartl et al., 1995; Neu et al., 2002), had a stable significant association with PM APR. Generally, chromosome 7A is a source of several Pm genes as well as other singleton and meta-QTLs (Muranty et al., 2010; Marone et al., 2013). The SNP marker BobWhite_c15773_166 (752.09 MB) on the chromosome arm 2AL was the other source for stable QTN discovered in all environments for PM APR. The chromosome arm 2AL is the other gene-rich region for PM resistance including the Pm4a, b, and d alleles detected on the chromosome homoeologous group two, which was initially introgressed from other progenitors species of wheat (Ma et al., 1994; Schmolke et al., 2012), and other QTLs (Marone et al., 2013; Nordestgaard et al., 2020). In this study, highly significant multi-QTNs were detected on the long arm of chromosome 5A (63–98, 115 cM) across environments for PM adult-plants resistance. Chromosome 5A is the other gene-rich region for PM resistance for wheat acquired through translocation and introgression (Marone et al., 2013). This study detected a stable QTL on chromosome arm 2AL (144–150 cM). Similarly, Yang et al. (2017) detected across environments stable QTL on both chromosome arms 2AL (163.2–168.8 cM) and 5AL (225.1–237.6 cM) for PM resistance in adult plants using doubled haploid populations derived from Chinese wheat cultivars. The SNP marker wsnp_Ex_c14340_22315611 on chromosome arm 3AL (89 cM) was another stable QTN discovered in this study. Previous studies reported QTLs on this chromosome region nearby to this marker for PM APR (Keller et al., 1999), and for both seedling and adult stage PM resistance positioned on 80.8 and 83.4 cM, respectively (Simeone et al., 2020). Furthermore, this study detected stable and environment-specific QTLs for PM resistance to adult plants including on chromosome arms 2DS, 4BL, 6BL, 7AL, and 7BL. Previous studies reported QTLs on these chromosome regions (Stadlmeier et al., 2019; Simeone et al., 2020), except the QTL discovered on 2DS that could possibly be a newly detected QTL in this study.
Genomic prediction analysis was done with both the RR-BLUP and wRR-BLUP models to estimate the genomic breeding values of individual genotypes for PM APR. The two models predicted higher GP accuracy to PM than STB that could be due to the higher heritability recorded on the earlier (PM) earlier in both single as well as environment-combined analysis. The GP prediction accuracy of PM ranged between 18 and 62% across environments for the RR-BLUP model. The wRR-BLUP improved the GP prediction accuracy, and the score was in a range of 36–83% across the tested environments. In a previous study, Sarinelli et al. (2019) detected a GP accuracy for adult-plant PM resistance in a range of 36–55 and 42–60% with unweighted and weighted RR-BLUP models, respectively, using a varied set of training population sizes for 467 historical United States winter wheat genotypes. Nonetheless, similar to the STB case, the later model could overestimate the GP accuracy due to individuals’ inclusion in both the GWAS and validation sets.
Conclusion
This study analyzed 175 winter wheat genotypes from NordGen comprising historical landraces and cultivars for GWAS and GP analysis. The phenotypic data indicated a significant variation between genotypes for adult-plant disease resistance response to STB and PM. The GWAS analysis identified various valuable QTNs for both STB and PM APR that could be incorporated in future marker-assisted selection and genomic selection programs. GWAS significantly improved the GP accuracy in predicting the genomic breeding values of genotypes for both STB and PM APR. The result of this study supports the potential of GP in predicting the GEBVs of the vastly available genetically rich landraces by developing appropriate models. The genomic-assisted germplasm selection with superior alleles for disease resistance in wheat could be then integrated into active breeding programs.
Data Availability Statement
The datasets presented in this study can be found in online repositories. The names of the repository/repositories and accession number(s) can be found in the article/Supplementary Material.
Author Contributions
AC conceived and designed the study. TH performed field the trials in Sweden. JS and LJ performed the field trials in Denmark. GB and ŽL performed the field trials in Lithuania. RK, BI, and MK performed the field trials in Estonia. AA and DSG performed the data analysis and wrote the first draft of the manuscript. All authors contributed to the data interpretation and approved the final version of this manuscript.
Funding
This study was supported by funding support from the SLU Grogrund (SLU.ltv.2019.1.1.1-623) and Research Council of Lithuania (DOTSUT-218 No. 01.2.2-LMT-K-718-01-0065).
Conflict of Interest
The authors declare that the research was conducted in the absence of any commercial or financial relationships that could be construed as a potential conflict of interest.
Supplementary Material
The Supplementary Material for this article can be found online at: https://www.frontiersin.org/articles/10.3389/fgene.2021.661742/full#supplementary-material
Footnotes
References
Alam, M. A., Xue, F., Wang, C., and Ji, W. (2011). Powdery mildew resistance genes in wheat: identification and genetic analysis. J. Mol. Biol. Res. 1, 20–39. doi: 10.5539/jmbr.v1n1p20
Alemu, A., Feyissa, T., Maccaferri, M., Sciara, G., Tuberosa, R., Ammar, K., et al. (2021). Genome-wide association analysis unveils novel QTLs for seminal root system architecture traits in Ethiopian durum wheat. BMC Genomics 22:20. doi: 10.1186/s12864-020-07320-4
Alvarado, G., Rodríguez, F. M., Pacheco, A., Burgueño, J., Crossa, J., Vargas, M., et al. (2020). META-R: A software to analyze data from multi-environment plant breeding trials. Crop J. 8, 745–756. doi: 10.1016/j.cj.2020.03.010
Arraiano, L. S., and Brown, J. K. M. (2006). Identification of isolate-specific and partial resistance to septoria tritici blotch in 238 European wheat cultivars and breeding lines. Plant Pathol. 55, 726–738. doi: 10.1111/j.1365-3059.2006.01444.x
Arraiano, L. S., Chartrain, L., Bossolini, E., Slatter, H. N., Keller, B., and Brown, J. K. M. (2007). A gene in European wheat cultivars for resistance to an African isolate of Mycosphaerella graminicola. Plant Pathol. 56, 73–78. doi: 10.1111/j.1365-3059.2006.01499.x
Arruda, M. P., Lipka, A. E., Brown, P. J., Krill, A. M., Thurber, C., Brown-Guedira, G., et al. (2016). Comparing genomic selection and marker-assisted selection for Fusarium head blight resistance in wheat (Triticum aestivum L.). Mol. Breed. 36:84. doi: 10.1007/s11032-016-0508-5
Bartoli, C., and Roux, F. (2017). Genome-wide association studies in plant pathosystems: toward an ecological genomics approach. Front. Plant Sci. 8:763. doi: 10.3389/fpls.2017.00763
Brachi, B., Morris, G. P., and Borevitz, J. O. (2011). Genome-wide association studies in plants: the missing heritability is in the field. Genome Biol. 12:232. doi: 10.1186/gb-2011-12-10-232
Brading, P. A., Verstappen, E. C. P., Kema, G. H. J., and Brown, J. K. M. (2002). A gene-for-gene relationship between wheat and Mycosphaerella graminicola, the Septoria Tritici blotch pathogen. Phytopathology 92, 439–445. doi: 10.1094/PHYTO.2002.92.4.439
Brown, J. K. M., Chartrain, L., Lasserre-Zuber, P., and Saintenac, C. (2015). Genetics of resistance to Zymoseptoria tritici and applications to wheat breeding. Fungal Genet. Biol. 79, 33–41. doi: 10.1016/j.fgb.2015.04.017
Castellari, S., and Kurnik, B. (2017). Climate Change, Impacts and Vulnerability in Europe. Available online at: https://www.eea.europa.eu/publications/climate-change-adaptation-and-disaster (accessed January 21, 2021).
Chartrain, L., Berry, S. T., and Brown, J. K. M. (2005). Resistance of Wheat Line Kavkaz-K4500 L.6.A.4 to septoria tritici blotch controlled by isolate-specific resistance genes. Phytopathology 95, 664–671. doi: 10.1094/PHYTO-95-0664
Chawade, A., Armoniené, R., Berg, G., Brazauskas, G., Frostgård, G., Geleta, M., et al. (2018). A transnational and holistic breeding approach is needed for sustainable wheat production in the Baltic Sea region. Physiol. Plant 164, 442–451. doi: 10.1111/ppl.12726
Chen, C. Y., Misztal, I., Aguilar, I., Tsuruta, S., Meuwissen, T. H. E., Aggrey, S. E., et al. (2011). Genome-wide marker-assisted selection combining all pedigree phenotypic information with genotypic data in one step: an example using broiler chickens. J. Anim. Sci. 89, 23–28. doi: 10.2527/jas.2010-3071
Chen, Y., Hunger, R. M., Carver, B. F., Zhang, H., and Yan, L. (2009). Genetic characterization of powdery mildew resistance in U.S. hard winter wheat. Mol. Breeding 24, 141–152. doi: 10.1007/s11032-009-9279-6
Crossa, J., Pérez-Rodríguez, P., Cuevas, J., Montesinos-López, O., Jarquín, D., de los Campos, G., et al. (2017). Genomic selection in plant breeding: methods, models, and perspectives. Trends Plant Sci. 22, 961–975. doi: 10.1016/j.tplants.2017.08.011
Dreisigacker, S., Wang, X., Martinez Cisneros, B. A., Jing, R., and Singh, P. K. (2015). Adult-plant resistance to Septoria tritici blotch in hexaploid spring wheat. Theor. Appl. Genet. 128, 2317–2329. doi: 10.1007/s00122-015-2587-9
Endelman, J. B. (2011). Ridge regression and other kernels for genomic selection with r package rrBLUP. Plant Genome 4, 250–255. doi: 10.3835/plantgenome2011.08.0024
Endelman, J. B., and Jannink, J.-L. (2012). Shrinkage estimation of the realized relationship matrix. G3:Genes Genomes Genet. 2, 1405–1413. doi: 10.1534/g3.112.004259
Figueroa, M., Hammond-Kosack, K. E., and Solomon, P. S. (2018). A review of wheat diseases-a field perspective. Mol. Plant Pathol. 19, 1523–1536. doi: 10.1111/mpp.12618
Gaikpa, D. S., Kessel, B., Presterl, T., Galiano-Carneiro, A. L., Mayer, M., Melchinger, A. E., et al. (2021). Exploiting the genetic diversity in two European maize landraces for Gibberella ear rot resistance using genomic tools. Theor. Appl. Genet. 134, 793–805.
Ghaffary, T. S. M., Faris, J. D., Friesen, T. L., Visser, R. G. F., van der Lee, T. A. J., Robert, O., et al. (2012). New broad-spectrum resistance to septoria tritici blotch derived from synthetic hexaploid wheat. Theor. Appl. Genet. 124, 125–142. doi: 10.1007/s00122-011-1692-7
Hao, Y., Parks, R., Cowger, C., Chen, Z., Wang, Y., Bland, D., et al. (2015). Molecular characterization of a new powdery mildew resistance gene Pm54 in soft red winter wheat. Theor. Appl. Genet. 128, 465–476. doi: 10.1007/s00122-014-2445-1
Hartl, L., Weiss, H., Stephan, U., Zeller, F. J., and Jahoor, A. (1995). Molecular identification of powdery mildew resistance genes in common wheat (Triticum aestivum L.). Theor. Appl. Genet. 90, 601–606. doi: 10.1007/BF00222121
He, X., Azzimonti, G., Sánchez-Vidaña, M., del, R., Pereyra, S., Sansaloni, C., et al. (2020). Mapping for adult-plant resistance against Septoria tritici blotch in a common wheat line Murga. Phytopathology doi: 10.1094/PHYTO-05-20-0172-R [Epub ahead of print].
Heick, T. M., Justesen, A. F., and Jørgensen, L. N. (2017). Resistance of wheat pathogen Zymoseptoria tritici to DMI and QoI fungicides in the Nordic-Baltic region - a status. Eur. J. Plant Pathol. 149, 669–682. doi: 10.1007/s10658-017-1216-7
Herrera-Foessel, S. A., Singh, R. P., Lillemo, M., Huerta-Espino, J., Bhavani, S., Singh, S., et al. (2014). Lr67/Yr46 confers adult plant resistance to stem rust and powdery mildew in wheat. Theor. Appl. Genet. 127, 781–789. doi: 10.1007/s00122-013-2256-9
Herter, C. P., Ebmeyer, E., Kollers, S., Korzun, V., Würschum, T., and Miedaner, T. (2019). Accuracy of within- and among-family genomic prediction for Fusarium head blight and Septoria tritici blotch in winter wheat. Theor. Appl. Genet. 132, 1121–1135. doi: 10.1007/s00122-018-3264-6
Hill, W. G., and Weir, B. S. (1988). Variances and covariances of squared linkage disequilibria in finite populations. Theor. Population Biol. 33, 54–78.
Hovmøller, M. S. (1989). Race specific powdery mildew resistance in 31 Northwest European Wheat Cultivars. Plant Breed. 103, 228–234. doi: 10.1111/j.1439-0523.1989.tb00376.x
Hua, W., Liu, Z., Zhu, J., Xie, C., Yang, T., Zhou, Y., et al. (2009). Identification and genetic mapping of pm42, a new recessive wheat powdery mildew resistance gene derived from wild emmer (Triticum turgidum var. dicoccoides). Theor. Appl. Genet. 119, 223–230. doi: 10.1007/s00122-009-1031-4
Huang, M., Liu, X., Zhou, Y., Summers, R. M., and Zhang, Z. (2019). BLINK: a package for the next level of genome-wide association studies with both individuals and markers in the millions. Gigascience 8:giy154. doi: 10.1093/gigascience/giy154
Hysing, S.-C., Merker, A., Liljeroth, E., Koebner, R. M. D., Zeller, F. J., and Hsam, S. L. K. (2007). Powdery mildew resistance in 155 Nordic bread wheat cultivars and landraces. Hereditas 144, 102–119. doi: 10.1111/j.2007.0018-0661.01991.x
Hysing, S.-C. P., Singh, R., Huerta-Espino, J., Merker, A., Liljeroth, E., and Diaz, O. (2006). Leaf rust (Puccinia triticina) resistance in wheat (Triticum aestivum) cultivars grown in Northern Europe 1992-2002. Hereditas 143, 1–14. doi: 10.1111/j.2005.0018-0661.01917.x
International Wheat Genome Sequencing Consortium (2018). Shifting the limits in wheat research and breeding using a fully annotated reference genome. Science 361:eaar7191. doi: 10.1126/science.aar7191
Jalli, M., Kaseva, J., Andersson, B., Ficke, A., Jørgensen, L. N., Ronis, A., et al. (2020). Yield increases due to fungicide control of leaf blotch diseases in wheat and barley as a basis for IPM decision-making in the Nordic-Baltic region. Eur. J. Plant Pathol. 158, 315–333. doi: 10.1007/s10658-020-02075-w
Jia, M., Xu, H., Liu, C., Mao, R., Li, H., Liu, J., et al. (2020). Characterization of the powdery mildew resistance gene in the elite wheat cultivar jimai 23 and its application in marker-assisted selection. Front. Genet. 11:241. doi: 10.3389/fgene.2020.00241
Juliana, P., Singh, R. P., Singh, P. K., Crossa, J., Rutkoski, J. E., Poland, J. A., et al. (2017). Comparison of models and whole-genome profiling approaches for genomic-enabled prediction of septoria tritici blotch, stagonospora nodorum blotch, and tan spot resistance in wheat. Plant Genome 10, 1–16. doi: 10.3835/plantgenome2016.08.0082
Juliana, P., Singh, R. P., Singh, P. K., Poland, J. A., Bergstrom, G. C., Huerta-Espino, J., et al. (2018). Genome-wide association mapping for resistance to leaf rust, stripe rust and tan spot in wheat reveals potential candidate genes. Theor. Appl. Genet. 131, 1405–1422. doi: 10.1007/s00122-018-3086-6
Keller, M., Keller, B., Schachermayr, G., Winzeler, M., Schmid, J. E., Stamp, P., et al. (1999). Quantitative trait loci for resistance against powdery mildew in a segregating wheat×spelt population. Theor. Appl. Genet. 98, 903–912. doi: 10.1007/s001220051149
Kildea, S., Byrne, J. J., Cucak, M., and Hutton, F. (2020). First report of virulence to the septoria tritici blotch resistance gene Stb16q in the Irish Zymoseptoria tritici population. New Disease Rep. 41:13.
Kou, Y., and Wang, S. (2010). Broad-spectrum and durability: understanding of quantitative disease resistance. Curr. Opin. Plant Biol. 13, 181–185. doi: 10.1016/j.pbi.2009.12.010
Kumar, D., Kushwaha, S., Delvento, C., Liatukas, Ž, Vivekanand, V., Svensson, J. T., et al. (2020). Affordable phenotyping of winter wheat under field and controlled conditions for drought tolerance. Agronomy 10:882. doi: 10.3390/agronomy10060882
Laidig, F., Feike, T., Hadasch, S., Rentel, D., Klocke, B., Miedaner, T., et al. (2021). Breeding progress of disease resistance and impact of disease severity under natural infections in winter wheat variety trials. Theor. Appl. Genet. doi: 10.1007/s00122-020-03728-4 [Epub ahead of print].
Lee, J. H., Graybosch, R. A., and Peterson, C. J. (1995). Quality and biochemical effects of a IBL/IRS wheat-rye translocation in wheat. Theor. Appl. Genet. 90, 105–112. doi: 10.1007/BF00221002
Legarra, A., Robert-Granié, C., Manfredi, E., and Elsen, J.-M. (2008). Performance of genomic selection in mice. Genetics 180, 611–618. doi: 10.1534/genetics.108.088575
Li, G., Cowger, C., Wang, X., Carver, B. F., and Xu, X. (2019a). Characterization of Pm65, a new powdery mildew resistance gene on chromosome 2AL of a facultative wheat cultivar. Theor. Appl. Genet. 132, 2625–2632. doi: 10.1007/s00122-019-03377-2
Li, G., Xu, X., Tan, C., Carver, B. F., Bai, G., Wang, X., et al. (2019b). Identification of powdery mildew resistance loci in wheat by integrating genome-wide association study (GWAS) and linkage mapping. Crop J. 7, 294–306. doi: 10.1016/j.cj.2019.01.005
Liang, S. S., Suenaga, K., He, Z. H., Wang, Z. L., Liu, H. Y., Wang, D. S., et al. (2006). Quantitative trait loci mapping for adult-plant resistance to powdery mildew in bread wheat. Phytopathology 96, 784–789. doi: 10.1094/PHYTO-96-0784
Lillemo, M., Asalf, B., Singh, R. P., Huerta-Espino, J., Chen, X. M., He, Z. H., et al. (2008). The adult plant rust resistance loci Lr34/Yr18 and Lr46/Yr29 are important determinants of partial resistance to powdery mildew in bread wheat line Saar. TAG. Theor. Appl. Genet. Theor. Angewandte Genet. 116, 1155–1166. doi: 10.1007/s00122-008-0743-1
Lillemo, M., Bjørnstad, Å, and Skinnes, H. (2012). Molecular mapping of partial resistance to powdery mildew in winter wheat cultivar Folke. Euphytica 185, 47–59. doi: 10.1007/s10681-011-0620-x
Limpert, E., Felsenstein, F. G., and Andrivon, D. (1987). Analysis of virulence in populations of wheat powdery mildew in Europe. J. Phytopathol. 120, 1–8. doi: 10.1111/j.1439-0434.1987.tb04408.x
Lipka, A. E., Tian, F., Wang, Q., Peiffer, J., Li, M., Bradbury, P. J., et al. (2012). GAPIT: genome association and prediction integrated tool. Bioinformatics 28, 2397–2399. doi: 10.1093/bioinformatics/bts444
Liu, W., Maccaferri, M., Chen, X., Laghetti, G., Pignone, D., Pumphrey, M., et al. (2017). Genome-wide association mapping reveals a rich genetic architecture of stripe rust resistance loci in emmer wheat (Triticum turgidum ssp. dicoccum). Theor. Appl. Genet. 130, 2249–2270. doi: 10.1007/s00122-017-2957-6
Liu, X., Huang, M., Fan, B., Buckler, E. S., and Zhang, Z. (2016). Iterative usage of fixed and random effect models for powerful and efficient genome-wide association studies. PLoS Genet. 12:e1005767. doi: 10.1371/journal.pgen.1005767
Lorenz, A. J., Chao, S., Asoro, F. G., Heffner, E. L., Hayashi, T., Iwata, H., et al. (2011). Genomic selection in plant breeding: knowledge and prospects. Adv. Agron. 110, 77–123. doi: 10.1016/B978-0-12-385531-2.00002-5
Ma, Z. Q., Sorrells, M. E., and Tanksley, S. D. (1994). RFLP markers linked to powdery mildew resistance genes Pm1, Pm2, Pm3, and Pm4 in wheat. Genome 37, 871–875. doi: 10.1139/g94-123
Maccaferri, M., El-Feki, W., Nazemi, G., Salvi, S., Canè, M. A., Colalongo, C., et al. (2016). Prioritizing quantitative trait loci for root system architecture in tetraploid wheat. J. Exp. Bot. 67, 1161–1178. doi: 10.1093/jxb/erw039
Marone, D., Russo, M. A., Laidò, G., De Vita, P., Papa, R., Blanco, A., et al. (2013). Genetic basis of qualitative and quantitative resistance to powdery mildew in wheat: from consensus regions to candidate genes. BMC Genomics 14:562. doi: 10.1186/1471-2164-14-562
Marroni, F., Pinosio, S., Zaina, G., Fogolari, F., Felice, N., Cattonaro, F., et al. (2011). Nucleotide diversity and linkage disequilibrium in Populus nigra cinnamyl alcohol dehydrogenase (CAD4) gene. Tree Genet. Genomes 7, 1011–1023.
McCartney, C. A., Brûlé-Babel, A. L., Lamari, L., and Somers, D. J. (2003). Chromosomal location of a race-specific resistance gene to Mycosphaerella graminicola in the spring wheat ST6. Theor. Appl. Genet. 107, 1181–1186. doi: 10.1007/s00122-003-1359-0
McIntosh, R. A., Dubcovsky, J., Rogers, W. J., Xia, X. C., and Raupp, W. J. (2020). Catalogue of gene symbols for wheat: 2020 Supplement. Ann. Wheat Newslett. 66, 109–128.
Meuwissen, T. H., Hayes, B. J., and Goddard, M. E. (2001). Prediction of total genetic value using genome-wide dense marker maps. Genetics 157, 1819–1829.
Miedaner, T., Zhao, Y., Gowda, M., Longin, C. F. H., Korzun, V., Ebmeyer, E., et al. (2013). Genetic architecture of resistance to Septoria tritici blotch in European wheat. BMC Genomics 14:858. doi: 10.1186/1471-2164-14-858
Mirdita, V., He, S., Zhao, Y., Korzun, V., Bothe, R., Ebmeyer, E., et al. (2015). Potential and limits of whole genome prediction of resistance to Fusarium head blight and Septoria tritici blotch in a vast Central European elite winter wheat population. Theor. Appl. Genet. 128, 2471–2481. doi: 10.1007/s00122-015-2602-1
Muqaddasi, Q. H., Zhao, Y., Rodemann, B., Plieske, J., Ganal, M. W., and Röder, M. S. (2019). Genome-wide association mapping and prediction of adult stage septoria tritici blotch infection in european winter wheat via high-density marker arrays. Plant Genome 12:180029. doi: 10.3835/plantgenome2018.05.0029
Muranty, H., Pavoine, M.-T., Doussinault, G., and Barloy, D. (2010). Origin of powdery mildew resistance factors in RE714, a wheat breeding line obtained from two interspecific crosses. Plant Breed. 129, 465–471. doi: 10.1111/j.1439-0523.2009.01740.x
Neu, C., Stein, N., and Keller, B. (2002). Genetic mapping of the Lr20–Pm1 resistance locus reveals suppressed recombination on chromosome arm 7AL in hexaploid wheat. Genome 45, 737–744. doi: 10.1139/g02-040
Nordestgaard, N. V., Thach, T., Sarup, P. M., Andersen, J. R., Hovmøller, M. S., Jahoor, A., et al. (2020). Multi-parental populations suitable for identifying sources of resistance to powdery mildew in winter wheat. Front. Plant Sci. 11:570863. doi: 10.3389/fpls.2020.570863
Odilbekov, F., Armoniené, R., Koc, A., Svensson, J., and Chawade, A. (2019a). GWAS-assisted genomic prediction to predict resistance to septoria tritici blotch in nordic winter wheat at seedling stage. Front. Genet. 10:1224. doi: 10.3389/fgene.2019.01224
Odilbekov, F., He, X., Armoniené, R., Saripella, G. V., Henriksson, T., Singh, P. K., et al. (2019b). QTL mapping and transcriptome analysis to identify differentially expressed genes induced by Septoria Tritici blotch disease of wheat. Agronomy 9:510. doi: 10.3390/agronomy9090510
Olesen, J. E., Trnka, M., Kersebaum, K. C., Skjelvåg, A. O., Seguin, B., Peltonen-Sainio, P., et al. (2011). Impacts and adaptation of European crop production systems to climate change. Eur. J. Agron. 34, 96–112. doi: 10.1016/j.eja.2010.11.003
Porter, J. R., and Semenov, M. A. (2005). Crop responses to climatic variation. Philos. Trans. R. Soc. B Biol. Sci. 360, 2021–2035. doi: 10.1098/rstb.2005.1752
Price, A. L., Patterson, N. J., Plenge, R. M., Weinblatt, M. E., Shadick, N. A., and Reich, D. (2006). Principal components analysis corrects for stratification in genome-wide association studies. Nat. Genet. 38, 904–909. doi: 10.1038/ng1847
R Core Team. (2020). R: A Language and Environment for Statistical Computing. Vienna: R Foundation for Statistical Computing.
Raman, H., and Milgate, A. (2012). Molecular breeding for Septoria tritici blotch resistance in wheat. Cereal Res. Commun. 40, 451–466. doi: 10.1556/CRC.40.2012.4.1
Riaz, A., KockAppelgren, P., Hehir, J. G., Kang, J., Meade, F., Cockram, J., et al. (2020). Genetic analysis using a multi-parent wheat population identifies novel sources of Septoria Tritici blotch resistance. Genes (Basel) 11:887. doi: 10.3390/genes11080887
Roos, J., Hopkins, R., Kvarnheden, A., and Dixelius, C. (2011). The impact of global warming on plant diseases and insect vectors in Sweden. Eur. J. Plant Pathol. 129, 9–19. doi: 10.1007/s10658-010-9692-z
Saintenac, C., Lee, W. S., Cambon, F., Rudd, J. J., King, R. C., Marande, W., et al. (2018). Wheat receptor-kinase-like protein Stb6 controls gene-for-gene resistance to fungal pathogen Zymoseptoria tritici. Nat. Genet. 50, 368–374. doi: 10.1038/s41588-018-0051-x
Sarinelli, J. M., Murphy, J. P., Tyagi, P., Holland, J. B., Johnson, J. W., Mergoum, M., et al. (2019). Training population selection and use of fixed effects to optimize genomic predictions in a historical USA winter wheat panel. Theor. Appl. Genet. 132, 1247–1261. doi: 10.1007/s00122-019-03276-6
Schilly, A., Risser, P., Ebmeyer, E., Miedaner, L. H., Reif, J. C., Thomas, T., et al. (2011). Stability of adult-plant resistance to Septoria tritici blotch in 24 European winter wheat varieties across nine field environments. J. Phytopathol. 159, 411–416. doi: 10.1111/j.1439-0434.2010.01783.x
Schmolke, M., Mohler, V., Hartl, L., Zeller, F. J., and Hsam, S. L. K. (2012). A new powdery mildew resistance allele at the Pm4 wheat locus transferred from einkorn (Triticum monococcum). Mol. Breed. 29, 449–456. doi: 10.1007/s11032-011-9561-2
Schwarz, G. (1978). Estimating the dimension of a model. Ann. Stat. 6, 461–464. doi: 10.1214/aos/1176344136
Segura, V., Vilhjálmsson, B. J., Platt, A., Korte, A., Seren, Ü, Long, Q., et al. (2012). An efficient multi-locus mixed-model approach for genome-wide association studies in structured populations. Nat. Genet. 44, 825–830. doi: 10.1038/ng.2314
Simeone, R., Piarulli, L., Nigro, D., Signorile, M. A., Blanco, E., Mangini, G., et al. (2020). Mapping powdery mildew (Blumeria graminis f. sp. tritici) resistance in wild and cultivated tetraploid wheats. Int. J. Mol. Sci. 21:7910. doi: 10.3390/ijms21217910
Singh, R. P., Singh, P. K., Rutkoski, J., Hodson, D. P., He, X., Jørgensen, L. N., et al. (2016). Disease impact on wheat yield potential and prospects of genetic control. Annu. Rev. Phytopathol. 54, 303–322. doi: 10.1146/annurev-phyto-080615-095835
Spielmeyer, W., Mcintosh, R. A., Kolmer, J., and Lagudah, E. S. (2005). Powdery mildew resistance and Lr34/Yr18 genes for durable resistance to leaf and stripe rust cosegregate at a locus on the short arm of chromosome 7D of wheat. Theor. Appl. Genet. 111, 731–735. doi: 10.1007/s00122-005-2058-9
Spindel, J. E., Begum, H., Akdemir, D., Collard, B., Redoña, E., Jannink, J.-L., et al. (2016). Genome-wide prediction models that incorporate de novo GWAS are a powerful new tool for tropical rice improvement. Heredity (Edinb) 116, 395–408. doi: 10.1038/hdy.2015.113
Stadlmeier, M., Jørgensen, L. N., Corsi, B., Cockram, J., Hartl, L., and Mohler, V. (2019). Genetic dissection of resistance to the three fungal plant pathogens Blumeria graminis, Zymoseptoria tritici, and Pyrenophora tritici-repentis using a multiparental winter wheat population. G3 (Bethesda) 9, 1745–1757. doi: 10.1534/g3.119.400068
Vagndorf, N., Nielsen, N. H., Edriss, V., Andersen, J. R., Orabi, J., Jørgensen, L. N., et al. (2017). Genome-wide association study reveals novel quantitative trait loci associated with resistance towards Septoria tritici blotch in North European winter wheat. Plant Breed. 136, 474–482. doi: 10.1111/pbr.12490
Voss-Fels, K. P., Cooper, M., and Hayes, B. J. (2019). Accelerating crop genetic gains with genomic selection. Theor. Appl. Genet. 132, 669–686. doi: 10.1007/s00122-018-3270-8
Wang, Q., Tian, F., Pan, Y., Buckler, E. S., and Zhang, Z. (2014a). A SUPER powerful method for genome wide association study. PLoS One 9:e107684. doi: 10.1371/journal.pone.0107684
Wang, S., Wong, D., Forrest, K., Allen, A., Chao, S., Huang, B. E., et al. (2014b). Characterization of polyploid wheat genomic diversity using a high-density 90 000 single nucleotide polymorphism array. Plant Biotechnol. J. 12, 787–796. doi: 10.1111/pbi.12183
Wiik, L., and Ewaldz, T. (2009). Impact of temperature and precipitation on yield and plant diseases of winter wheat in southern Sweden 1983–2007. Crop Protection 28, 952–962. doi: 10.1016/j.cropro.2009.05.002
Yan, W., and Kang, M. S. (2002). GGE Biplot Analysis. Boca Raton, FL: CRC Press, doi: 10.1201/9781420040371
Yang, L., Zhang, X., Zhang, X., Wang, J., Luo, M., Yang, M., et al. (2017). Identification and evaluation of resistance to powdery mildew and yellow rust in a wheat mapping population. PLoS One 12:e0177905. doi: 10.1371/journal.pone.0177905
Yu, J., Pressoir, G., Briggs, W. H., Vroh Bi, I., Yamasaki, M., Doebley, J. F., et al. (2006). A unified mixed-model method for association mapping that accounts for multiple levels of relatedness. Nat. Genet. 38, 203–208. doi: 10.1038/ng1702
Zeng, F.-S., Yang, L.-J., Gong, S.-J., Shi, W.-Q., Zhang, X.-J., Wang, H., et al. (2014). Virulence and diversity of Blumeria graminis f. sp. tritici populations in China. J. Integr. Agric. 13, 2424–2437. doi: 10.1016/S2095-3119(13)60669-3
Keywords: wheat, Septoria tritici blotch, powdery mildew, GWAS, genomic prediction, genebank
Citation: Alemu A, Brazauskas G, Gaikpa DS, Henriksson T, Islamov B, JØrgensen LN, Koppel M, Koppel R, Liatukas Ž, Svensson JT and Chawade A (2021) Genome-Wide Association Analysis and Genomic Prediction for Adult-Plant Resistance to Septoria Tritici Blotch and Powdery Mildew in Winter Wheat. Front. Genet. 12:661742. doi: 10.3389/fgene.2021.661742
Received: 31 January 2021; Accepted: 06 April 2021;
Published: 12 May 2021.
Edited by:
Hans D. Daetwyler, La Trobe University, AustraliaReviewed by:
Pengtao Ma, Yantai University, ChinaLu Liu, Washington State University, United States
Copyright © 2021 Alemu, Brazauskas, Gaikpa, Henriksson, Islamov, Jørgensen, Koppel, Koppel, Liatukas, Svensson and Chawade. This is an open-access article distributed under the terms of the Creative Commons Attribution License (CC BY). The use, distribution or reproduction in other forums is permitted, provided the original author(s) and the copyright owner(s) are credited and that the original publication in this journal is cited, in accordance with accepted academic practice. No use, distribution or reproduction is permitted which does not comply with these terms.
*Correspondence: Aakash Chawade, YWFrYXNoLmNoYXdhZGVAc2x1LnNl