 Chaokun Yan
 Junyi He
 Junwei Luo
 Jianlin Wang
 Ge Zhang
 Huimin Luo
- 1School of Computer and Information Engineering, Henan University, Kaifeng, China
- 2College of Computer Science and Technology, Henan Polytechnic University, Jiaozuo, China
As a common type of structural variation, an insertion refers to the addition of a DNA sequence into an individual genome and is usually associated with some inherited diseases. In recent years, many methods have been proposed for detecting insertions. However, the accurate calling of insertions is also a challenging task. In this study, we propose a novel insertion detection approach based on soft-clipped reads, which is called SIns. First, based on the alignments between paired reads and the reference genome, SIns extracts breakpoints from soft-clipped reads and determines insertion locations. The insert size information about paired reads is then further clustered to determine the genotype, and SIns subsequently adopts Minia to assemble the insertion sequences. Experimental results show that SIns can achieve better performance than other methods in terms of the F-score value for simulated and true datasets.
Introduction
Although single-nucleotide polymorphisms (SNPs) represent the most frequent genomic variation, it is generally acknowledged that human genomes show more differences as a consequence of structural variations (SVs) (Gusnanto et al., 2012). SVs generally refer to genome sequence changes greater than 50 bp and can be further categorized as insertions, deletions, duplications, inversions, and translocations, among others, as well as combinations of these categories (Feuk et al., 2006; Alkan et al., 2011; Baker, 2012). Some studies have shown that phenotypic changes and some diseases are caused by SVs, e.g., autism, Parkinson’s disease, and schizophrenia (Suzuki et al., 2011). Therefore, the accurate detection of SVs is of great significance for gene expression analysis and related disease research (MacConaill and Garraway, 2010). However, until a few years ago, there were no efficient methods for the detection of SVs with high precision. The development of next-generation sequencing (NGS) technology has allowed researchers to obtain a large amount of sequence data, which has improved research on SV detection (The 1000 Genomes Project Consortium, 2010; Zhang et al., 2010; Guan and Sung, 2016; Kosugi et al., 2019).
As one type of SV, an insertion refers to the addition of a DNA sequence to the genome. This sequence might be novel or could exist in the original genome, which would be equivalent to translocation or duplication. In general, insertions can be divided into two types: (i) novel insertions refer to the insertion of a sequence that cannot be found or mapped to the reference genome, and (ii) mobile element insertions or duplications constitute insertions in which the sequence comes from the original sequence. The sequence of this second type of insertion can be obtained through a comparison with the reference genome. Based on the identification of discordant patterns in sequence data, some SV detection methods can currently be utilized to detect insertions. In general, these methods can be categorized into the following four classes: (i) paired-end mapping (PEM-based methods, such as BreakDancer (Chen et al., 2009), PEMer (Korbel et al., 2009) and GASV (Sindi et al., 2009)), which is based on the physical position and distance information of paired-end or mate-pair reads (Lee et al., 2009; Hormozdiari et al., 2010); (ii) split read (SR)-based methods, which search for split alignments of unmapped or clipped reads, and an example is CREST, which uses clipped reads to identify structural variations through multiple alignments and assembly (Wang et al., 2011); (iii) depth of coverage (DoC)-based methods such as SegSeq (Chiang et al., 2009), EWT (Yoon et al., 2009) and CNVnator (Abyzov et al., 2011)), which provide a macroscopic view of whether there is a high coverage area on the genome; and (iv) de novo assembly, which uses related reads to recover insertion sequences. The latter methods, such as ANISE and BASIL (Holtgrewe et al., 2015), SvABA (Wala et al., 2018), EPGA (Luo et al., 2015b) and EPGA2 (Luo et al., 2015a), require a coverage depth that is not less than 40X and have a high cost. However, these methods usually focus on abnormal information, such as variations in the insertion size and soft-clipped information, and thus cannot yield accurate detection results for insertions with variable sizes.
Some hybrid methods have been proposed for the detection of insertions with variable sizes in recent years. For example, Pindel, as a classical method, is mainly designed for deletions and small insertions and uses PEM and SR signatures to locate the breakpoints (Ye et al., 2009). However, for large insertions over 50 bp, Pindel does not perform well and yields many false positive results. MindTheGap uses a k-mer-based method to detect the insertion site and recovers insertion sequences through an assembly of k-mers (Rizk et al., 2014). This method enables the detection of small and large insertions, but the methods finds it difficult to locate a breakpoint when other polymorphisms occur near the insertion site, which leads to a high number of false negative results. As an insertion detection approach based on breakpoints, BreakSeek applies a Bayesian model for the PEM and SR signatures to find the accurate position of an insertion (Zhao and Zhao, 2015). The BreakSeek method can obtain accurate breakpoint results and genotypes without assembly, but the coverage depth of the dataset has some impact on the performance. In addition, although some insertion detection methods, such as PopIns (Kehr et al., 2016) and Pamir (Kavak et al., 2017), perform well, they may require a large number of data points.
In this paper, we propose an insertion detection approach called SIns, which is based on soft-clipped reads and achieves high insertion detection accuracy. SIns adopts PEM to identify and correct the breakpoints from a previous analysis of soft-clipped reads and clusters the insert size to determine the genotype. For sequence assembly, SIns directly extracts all abnormal reads and uses Minia to recover the insertion sequences. We conducted experiments using simulated data and real datasets, and the results show that SIns exhibits high accuracy in breakpoint detection and genotype determination.
The rest of this paper is organized as follows: in Section 2, we introduce the proposed method in detail. The experimental results are shown in Section 3, and we summarize and discuss the findings in Section 4.
Methods
In this study, we propose a novel insertion detection approach named SIns for the detection of insertions based on soft-clipped reads. In general, SIns performs the following three steps: (i) breakpoint detection, determining the location of insertions based on comprehensive information; (ii) genotyping, identifying the genotype of the insertion based on clustering results; and (iii) assembly of insertion sequences. The overall pipeline of SIns is shown (Figure 1).
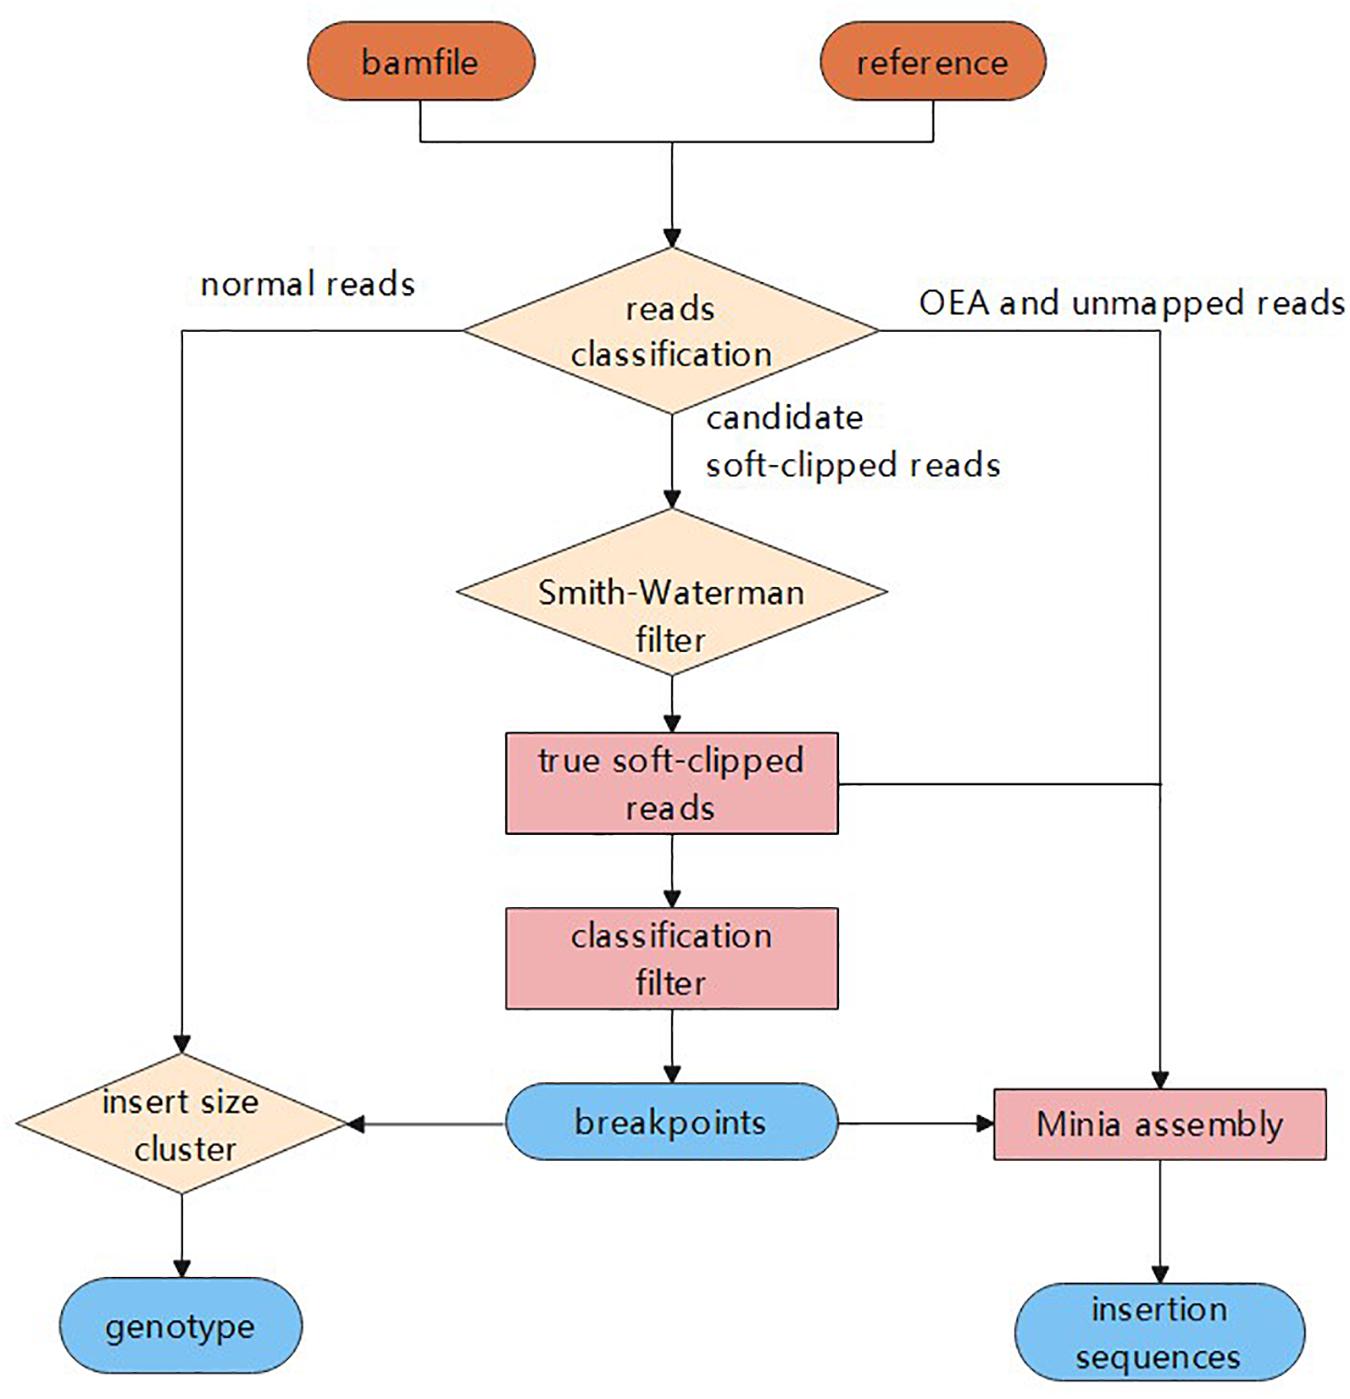
Figure 1. The process of Sins.
Breakpoint Detection
Breakpoint detection is an important step in SIns. In this study, the breakpoints can be obtained through the following steps.
Step 1 Selection of Soft-Clipped Reads
For each soft-clipped read, SIns first obtains its clipped part, Sc, and then extracts a sequence Sr from the reference genome, which corresponds to Sr. Note that the length of Sr equals that of Sc.
Based on the Smith-Waterman algorithm, a score matrix between Sc and Sr can then be constructed to reflect their detailed matching degree. Moreover, SIns can obtain the maximum score from the matrix, which refers to the length of the longest successive sequence. To identify and screen out real soft-clipped reads, a threshold parameter c is then set to select those reads whose Sc and Sr exhibit higher similarity. This parameter c can be computed using the following equation:
where m represents the mappability (m ∈ [0,1]). If c equals 1, SIns selects it for the following steps; otherwise, SIns abandons it. A larger m indicates greater similarity between Sc and Sr. The default value for the parameter m is 0.5.
Step 2 Determination of Candidate Breakpoints
In our study, the soft-clipped reads were further divided into four types, namely, LL, LR, RL, and RR, which are shown in Figure 2. Taking “LL” as an example, the first L means that the left mate read is soft-clipped, and the second “L” specifies that this read is clipped on its head, whereas “RR” indicates that the right mate read is soft-clipped on its tail.
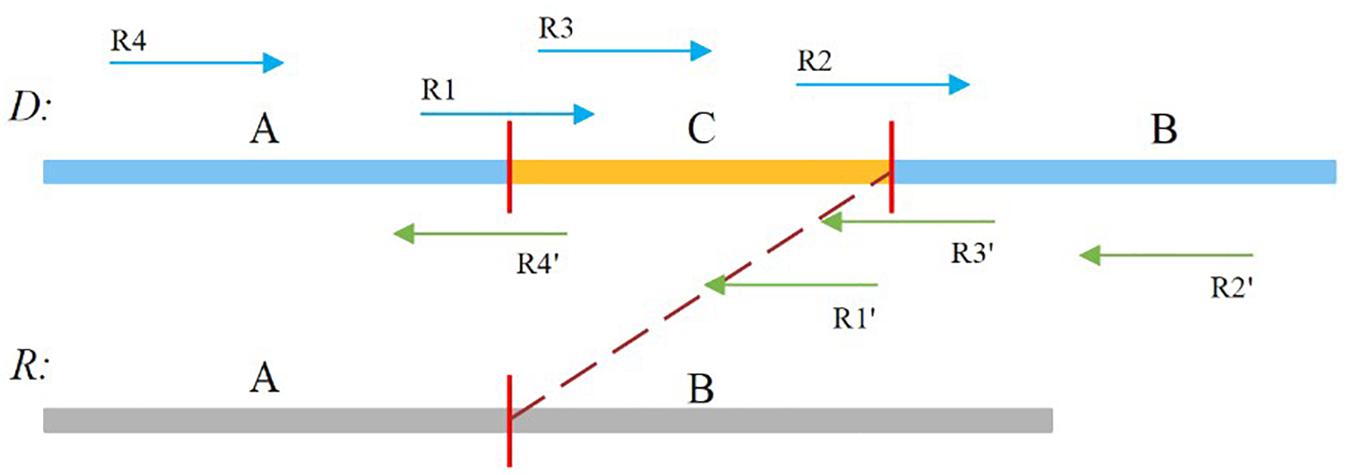
Figure 2. Sequence A and B is normal, and sequence C is insertion sequence. R1, R2, R4′,and R3′ are soft-clipped reads. R1 belongs to the LL type, R2 belongs to the LR type, R4′ belongs to the RL type, and R3′ belongs to the RR type.
A true insertion might be related to the four types of soft-clipped reads. These soft-clipped reads can provide similar breakpoint information. In general, an insertion breakpoint is regarded strongly as true if the four types of soft-clipped reads mentioned above exist. However, it is difficult to find all types of soft-clipped reads for a true insertion, particularly if the DoC is low. In this paper, SIns defines four types of breakpoints, which are represented as {LL, LR}, {LL, RL}, {RL, LR}, and {RL, RR}. For a breakpoint, SIns collects all related soft-clipped reads that are kept to PSD and determines their types, and SIns then uses the following equation to determine whether a breakpoint is true:
where LL∧LR indicates that the PSD of a breakpoint contains LL and LR, and LL∨RL indicates that it contains LL or RL. Subsequently, SIns obtains a list of breakpoints using the above-described method. However, the method yields some false positive breakpoints, which can be due to a high GC content, sequencing error or SNPs. Therefore, even though their proportion is small, these breakpoints should be checked and filtered.
Step 3 Filtering of the Breakpoints
Through the above-described steps, SIns can obtain candidate breakpoints, which might include some false breakpoints. SIns then uses a filter method based on the insertion size to further improve the precision of these breakpoints. An insertion usually causes a series of abnormal reads with an anomalous insert size distribution.
For a candidate breakpoint, SIns first finds the paired reads that span this breakpoint and OEA reads (one-end-anchored reads). Note that these reads should be aligned in the region [p − (μ++3σ), p + (μ+3σ)], where p is the position of the breakpoint, μ is the insert size of the read library, and σ is the standard deviation of μ as shown in Figure 3. If the sum of paired reads and OEA reads is larger than Cov/2, SIns treats this breakpoint as true, otherwise, the method considers the breakpoint to be false. Cov is the coverage of the read library.
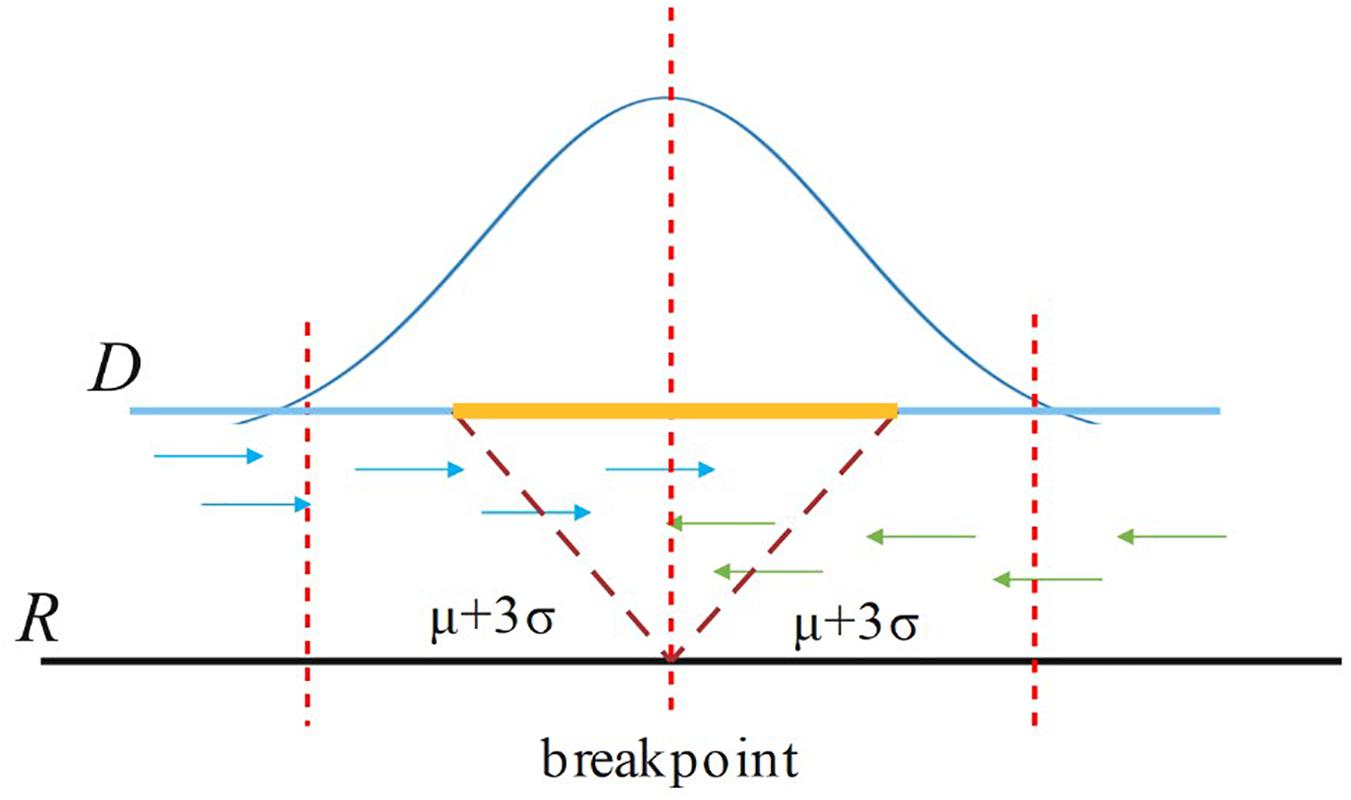
Figure 3. For a breakpoint, SIns only consider reads aligned in the region [p – (μ+3σ), p + (μ+3σ)], where p is the position of the breakpoint.
Genotyping
Genotyping is a necessary step of SIns. In a polyploid, the genotype is divided into heterozygous and homozygous genotypes. Taking diploid as an example, a heterozygous variation is only included in one chromosome and not the other one contains. In contrast, homozygosity indicates that the same variation is found in both chromosomes.
Genotyping can provide great convenience for subsequent studies, and many approaches, particularly assembly-based methods, are available for genotyping; however, all the assembly-based methods usually require considerable time and memory. Here, SIns adopts a cluster-based method, which can save as much time as possible.
If an insertion occurs, it will inevitably cause a change in the insert size for paired reads around the breakpoint, such as OEA reads, and a decrease in the normal insert size. For a heterozygous insertion, the insert size is difficult to determine because the paired reads might originate from two different chromosomes. Some paired reads contain insertions, whereas others do not. We defined P (Pl, Pr, and i) for a paired read spanning the breakpoint, where Pl is the aligning position of the left mate read, Pr is the aligning position of the right mate read and i is the insert size value around this paired read. After obtaining P for all paired reads spanning the breakpoint, SIns applies the DBSCAN for clustering. In DBSCAN, the parameter eps = 50, min_samples = 2 in default, and these parameters can be adjusted. And, SIns determines a breakpoint as heterozygote if there is one cluster in the clustering result, otherwise, the breakpoint is deemed as homozygous. Two types of insert size distributions are shown in Figure 4.
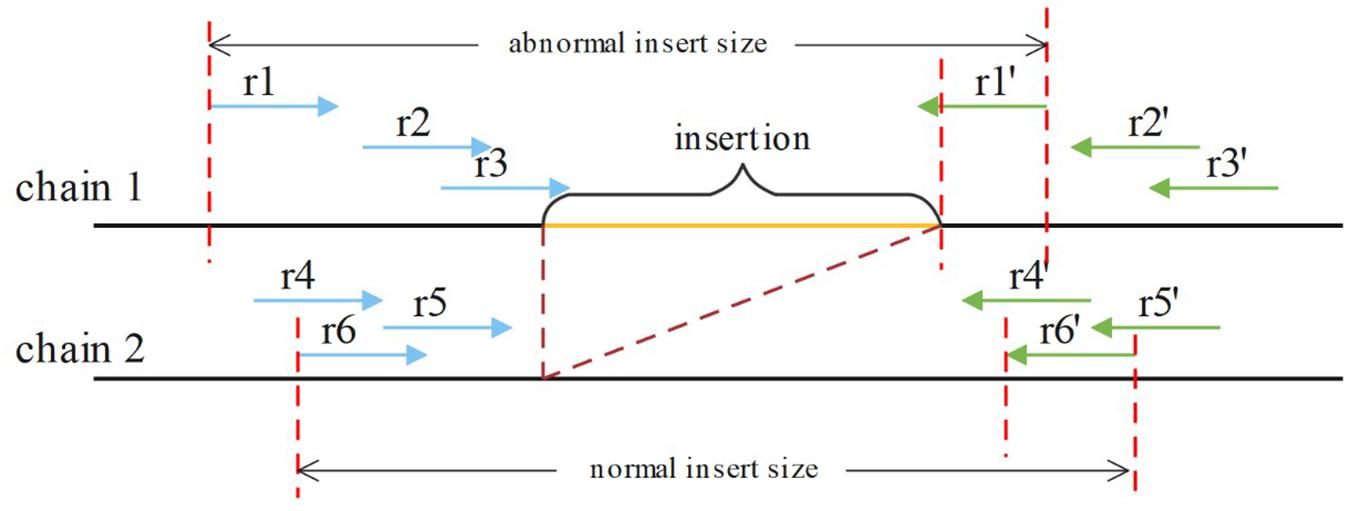
Figure 4. The paired reads (r1, r1′), (r2, r2′), and (r3, r3′) are obtained on the first chain, which contains an insertion. The other paired reads were obtained on the normal chain as shown. These insert sizes can be clustered into two clusters.
Assembly Insertion Sequences
In the assembly stage, SIns extracts OEA, soft-clipped and unmapped reads for a breakpoint to recover all possible insertion sequences. After applying the Minia (Boeva et al., 2012) algorithm to these abnormal reads, SIns generate a series of sequences with overlap, which contain insertion sequences. SIns then maps these sequences to the reference genome and obtains the insertion sequence results. For example, if the CIGAR value of a candidate sequence is 132M186I130M, the algorithm finds the length of this insertion, i.e., 186 bp, and determines that the sequence content is 133–318 bases.
Experiments and Analysis
To verify the performance of SIns, we used SURVIVOR (Jeffares et al., 2017) and ART (Huang et al., 2012) to simulate a large number of insertions on human chromosome 22 ranging in size from 50 to 1,500 bp and in coverage from 5X to 50X. The recent popular detection methods MindTheGap and BreakSeek were compared with the proposed SIns method. In addition, the real human dataset NA12878 was selected to test the performance of SIns.
Experimental Settings
Simulation Datasets and Parameter Setting
The simulation dataset was based on human chromosome 22, and the error rate of the dataset was set to 0.1%. SURVIVOR was used to simulate the structural variation. Here, we selected insertions for the simulation, and other types of structural variations were set to 0. ART was used to simulate different read sets from the simulated chromosome 22 containing insertions. We first generated some simulations of chromosome 22 containing insertions of different sizes, namely, 50–300 bp, 301–600 bp, 601–1,000 bp, and 1,001–1,500 bp, and ART was then used to simulate read sets with different coverages, i.e., 5X, 10X, 20X, 30X, 40X, and 50X. The read length was uniformly set to 150 bp, the inset size was 500 bp, and the standard deviation was 50. Using the above parameters, we can understand the detection ability of SIns under various conditions.
Evaluation Metrics
If the difference between the detected breakpoint and the simulated breakpoint does not exceed 10 bp, we consider it a positive result, which is represented by TP; otherwise, the result is represented by FP. True breakpoints that were not detected are indicated by FN. To clearly show the detection performance of various methods, we used the metrics precision (Pr), recall (Rc) and F-score as follows:
The F-score was defined as the harmonic average of precision and recall:
Simulation Dataset
Results on Homozygous Dataset
We compared SIns with MindTheGap and BreakSeek, selected chromosome 22 as the reference and simulated a chromosome containing 1,051 insertions of 50–300 bp, a chromosome containing 597 insertions of 301–600 bp, a chromosome containing 597 insertions of 601–1,000 bp and a chromosome containing 790 insertions of 1,001–1,500 bp. Based on different coverages, we simulated six read sets for each simulated chromosome. The experimental results are shown in Table 1.
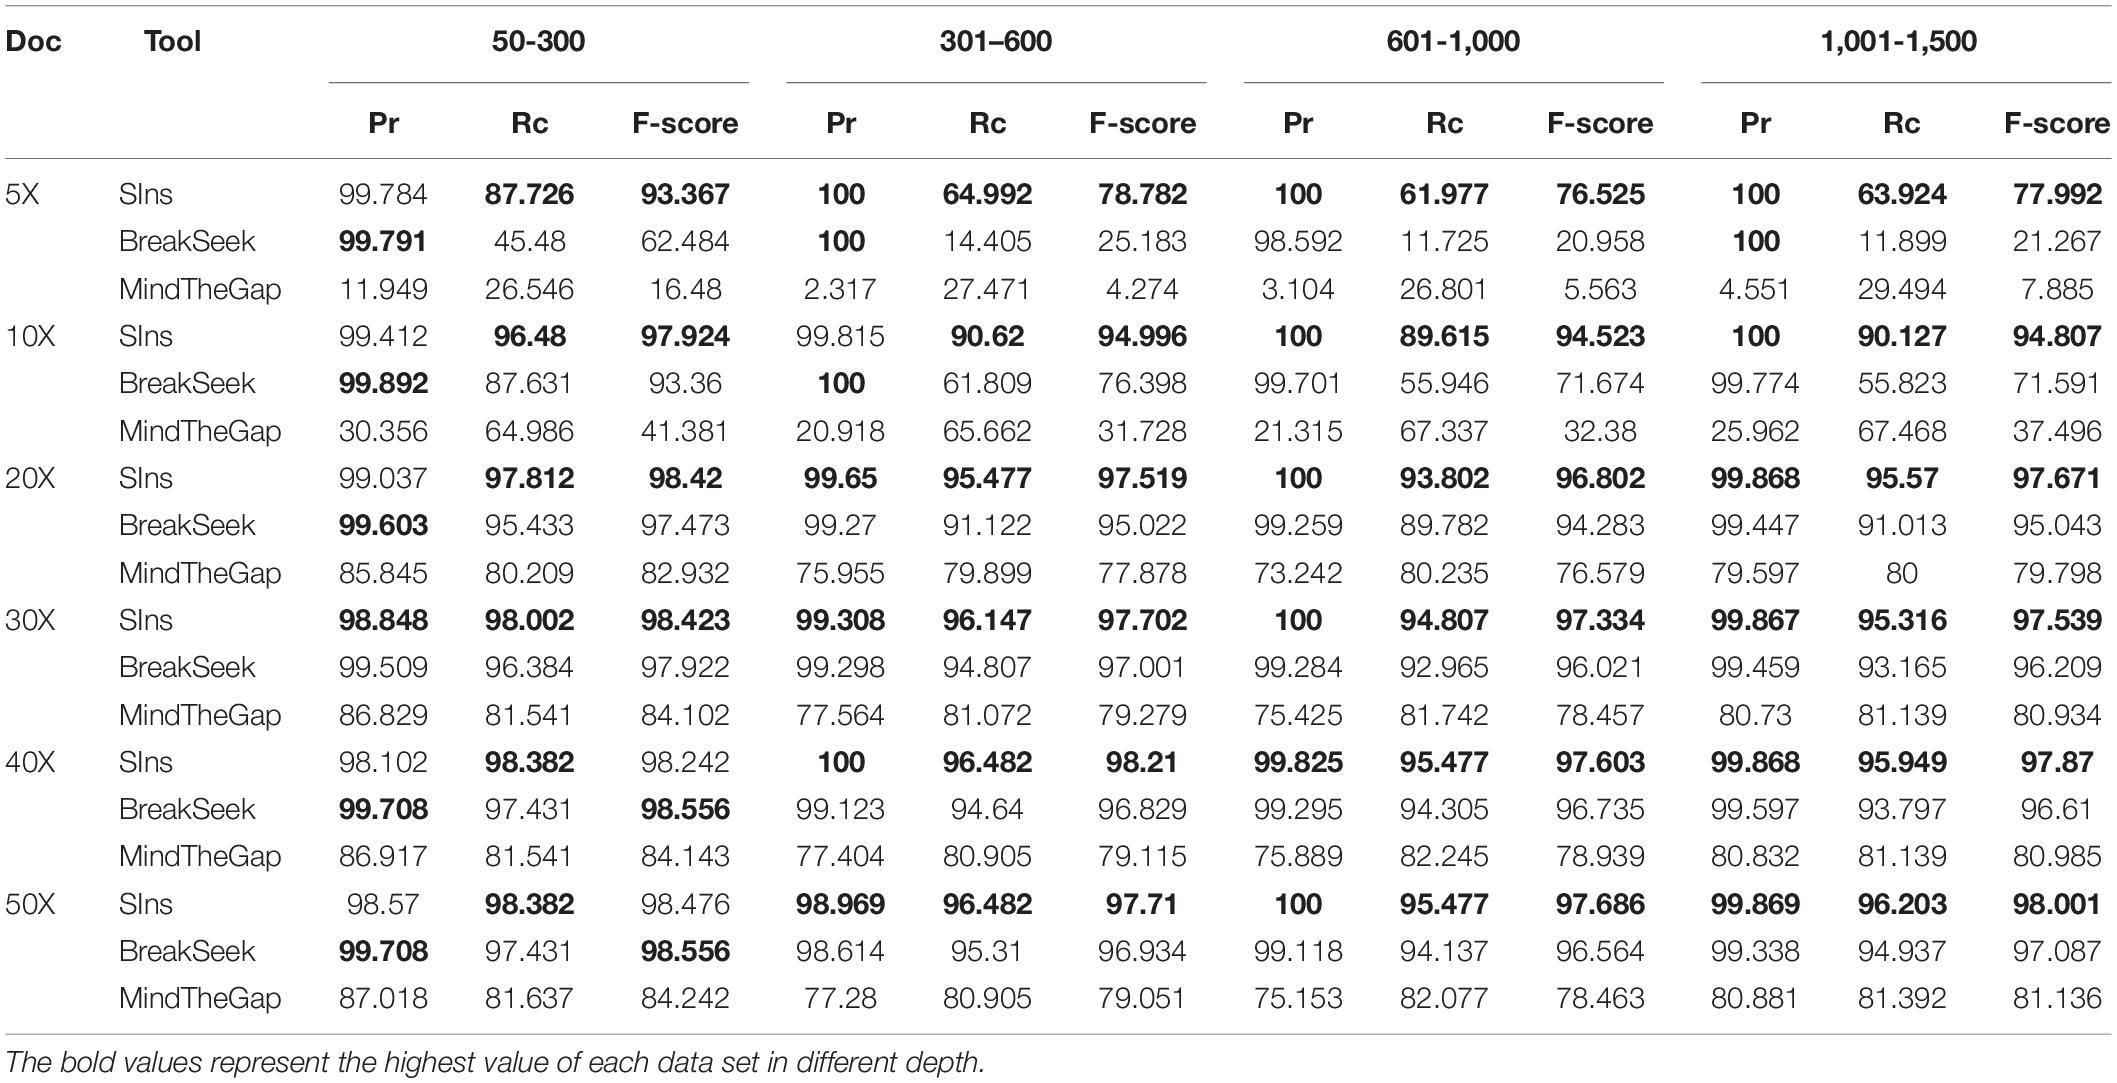
Table 1. Comparison of three tools for four ranges.
As shown in Table 1, the performances of SIns and BreakSeek in detecting insertions of 50–300 bp were better. Although the precision of BreakSeek was generally higher than that of SIns, its F-score was only better than that of SIns when the coverages of the read set were 40X and 50X. We also found that SIns has a higher recall, which means that SIns can detect more true insertions. SIns exhibited higher precision and recall regardless of the coverage and the length of insertions. In addition, none of the methods worked well with low DoCs. However, for the case with a low coverage (DoC ≤ 10X), SIns showed better performance than the other methods.
Results on Heterozygous Dataset
To verify the performance of SIns in detecting heterozygous insertions, we simulated read sets of chromosome 22. Simulations of chromosome 22 containing insertions of 50–300 bp were used to produce these read sets, and other simulations of chromosome 22 containing an insertion of 301–600 bp were also used to generate other read sets. We then combine the read sets from the normal chromosome 22 and the simulations of chromosome 22. Note that the read sets were simulated with different coverages: 10X, 20X, 40X, 60X, and 80X. The experimental results are shown in Table 2.
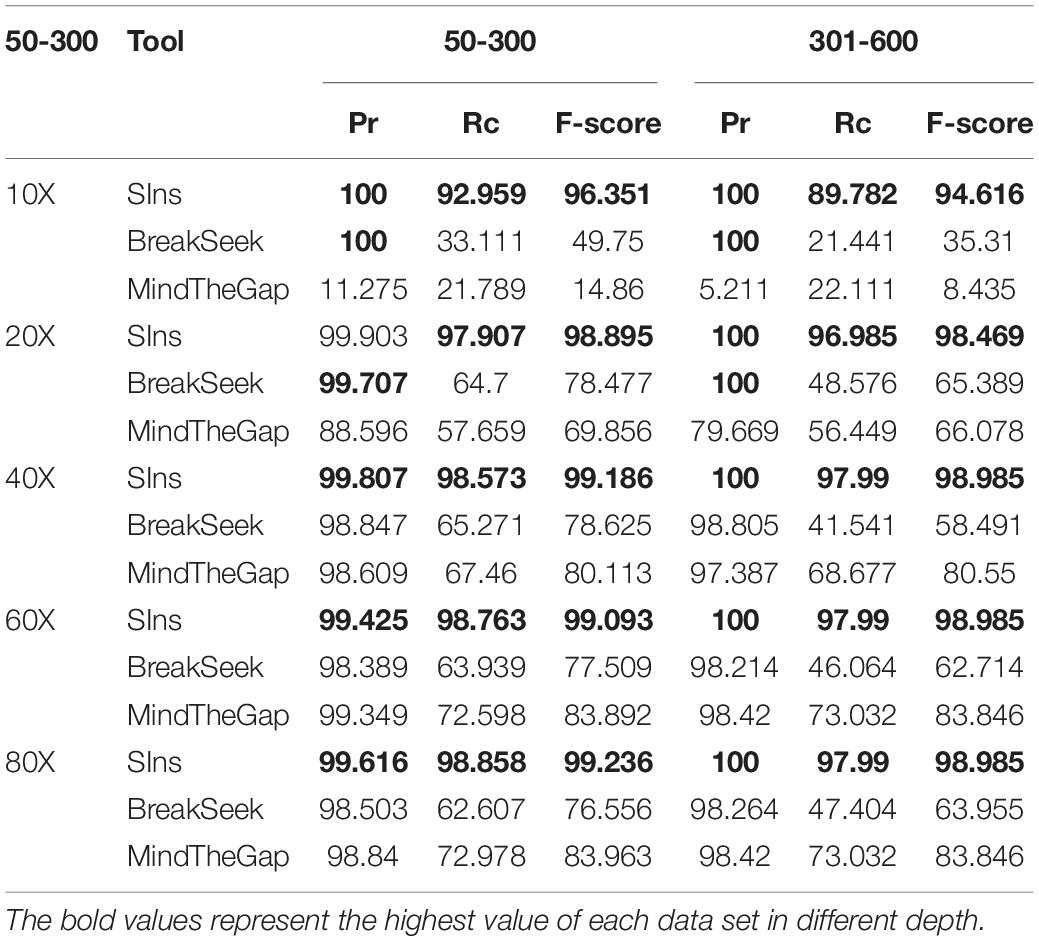
Table 2. Result of 50–300 and 301–600 bp heterozygous insertions.
As illustrated in Table 2, the detection results obtained with MindTheGap were less effective than those obtained with homozygous detection because MindTheGap has more sequences to choose from when selecting k-mers, which will yield some conflicting issues. The performance of BreakSeek on these two datasets was not as good as the results obtained with homozygotes, and a reason for this finding might be that normal reads extracted from the reference genome, which contained many contradictory PEM and SR information, were added. When BreakSeek iteratively analyses the PEM signature, there is too much contradictory information that can be used, and thus, the result cannot show the most authentic SV information. In contrast, when SIns extracts breakpoint information at the initial stage, the method relies more on SR information and thus experiences less interference from contradictory information. At the subsequent filtering stage, due to the addition of normal reads, the filtering conditions were more rigorous and precise, which explains why the precision of SIns increased, whereas the recall value decreased.
Experiments Based on Real Dataset
NA12878 is the gold standard dataset commonly used in genomics. Experiments with NA12878 (ERR194147 50X1) samples were conducted using the SIns, MindTheGap and BreakSeek methods. We extracted the reads with a probability of 0.1 because the coverage was too high. The generally recognized VCF file of this sample contains 50,016 insertion reports larger than 50 bp. The corresponding vcf file can be downloaded from NCBI. We only selected the detected results in the file records as true values. The test results are shown in Table 3.
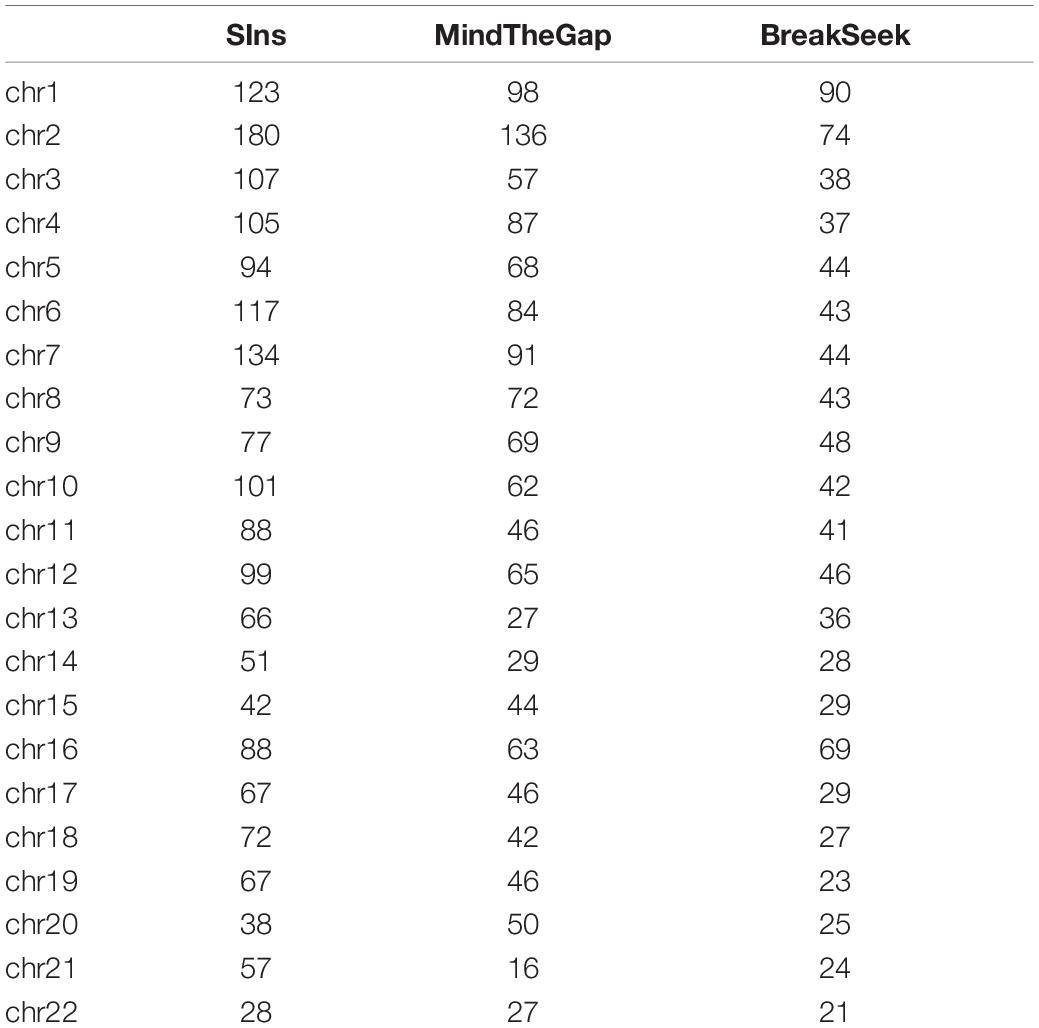
Table 3. Results obtained with NA12878.
We have filtered out the SNPs and Indels of this data set. The above results show that SIns has good performance on most chromosomes compared with MindTheGap and BreakSeek. Although the detection number of insertions on chromosome 15 and 20 are lower than that of MindTheGap, we can find the result on the rest of chromosomes are better than other two methods. And the average of F-score on all 22 chromosomes is 5.46% for SIns. MindTheGap is 2.42%, and BreakSeek is 2.85%. The average of F-score shows the same conclusion.
Running Time Comparison
Here we list the time comparison results of homozygote and heterozygous experiments.
Although clustering is useful in the SIns process, it does not require as many iterations as in BreakSeek, MindTheGap and other methods; thus, SIns exhibits a relatively obvious advantage in terms of running time. As shown in Tables 4, 5, all the methods were run in the same machine and a single thread by default. As a result, SIns exhibited better performance than the other two methods in most cases. The main time-consuming step of SIns is the third step: the reads used for assembly are extracted from the original read collection, which is the most work-intensive step. If the assembly is not considered and the method aims to just detect breakpoints and judge genotypes, SIns can complete the task within a short time.
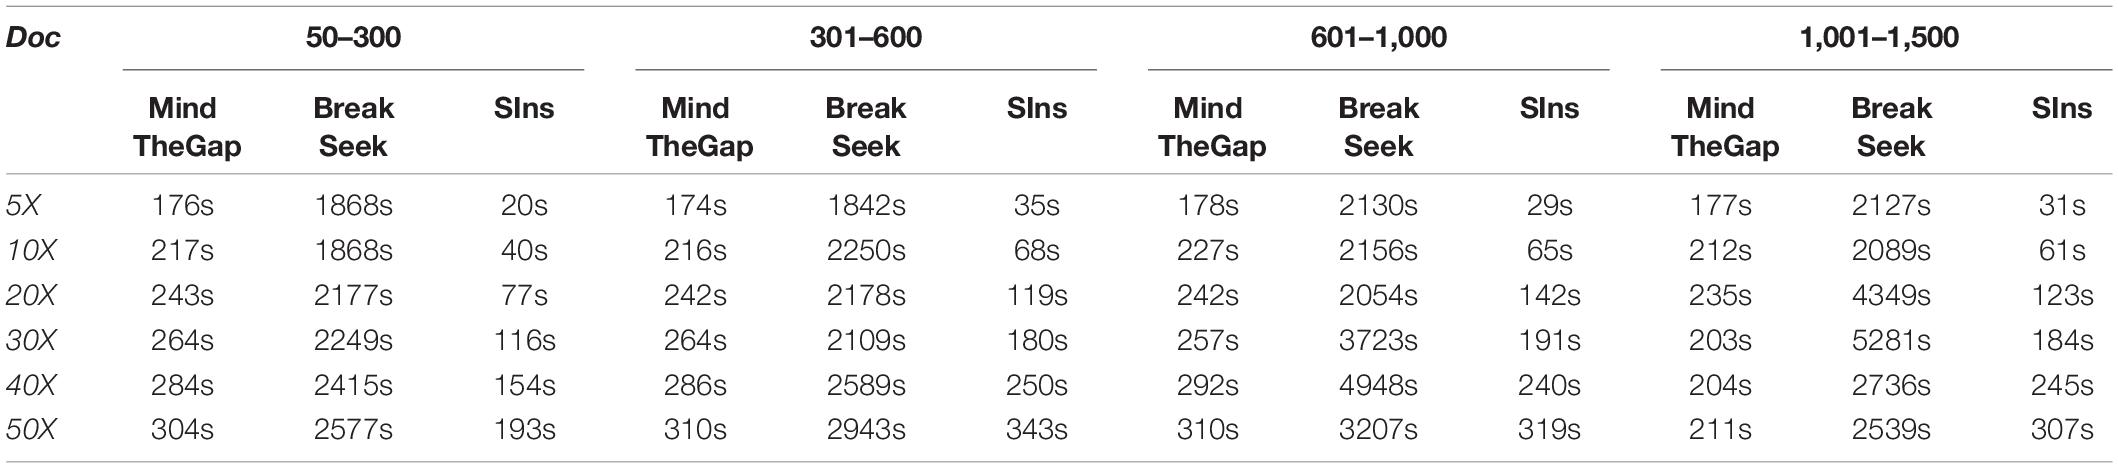
Table 4. Homozygote results obtained with four ranges.
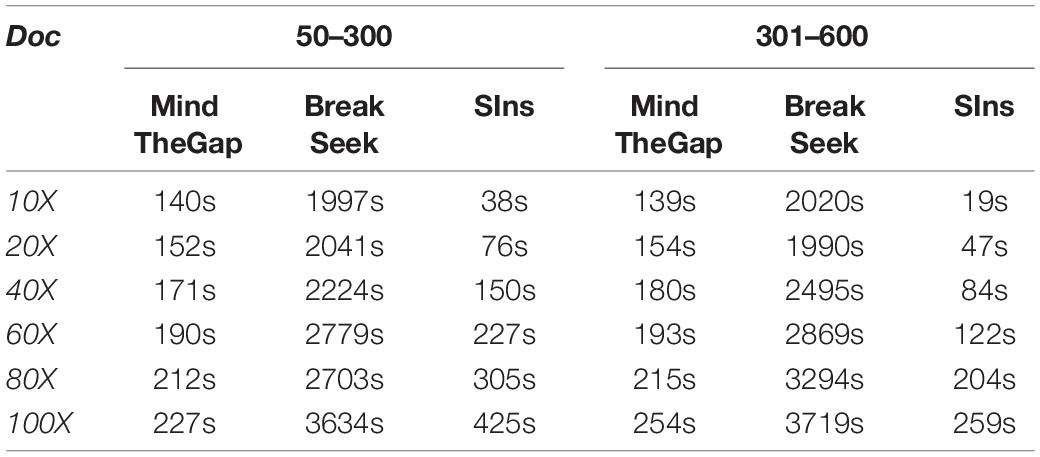
Table 5. Heterozygous results obtained with four ranges.
Discussion
In this article, we propose an insertion detection method named SIns based on the comprehensive processing of soft-clipped read information. SIns can provide more precise detection of breakpoints and can perform relatively accurate genotyping. In addition, SIns uses the Minia algorithm for assembly of the insertion sequence, and the successfully assembled sequence is then filtered and tailored according to the breakpoint information. After these steps, the complete insertion sequence is provided.
Most of the existing methods show effectiveness in detecting small insertions but show poor performance in cases of low coverage. These methods usually are difficult to detect all types of SVs of all sizes. SIns focuses on the detection of insertions of different sizes. We tested the detection performance of SIns using various simulated datasets and compared it with MindTheGap and BreakSeek. In most cases, the performance of SIns was better than those of the other two methods. Comparing with the other two methods, SIns performs well both on low and high coverage data sets and different size insertions. The experimental results using a real dataset show that SIns exhibits good detection capability.
Data Availability Statement
The datasets presented in this study can be found in online repositories. The names of the repository/repositories and accession number(s) can be found below: http://www.ebi.ac.uk/ena.
Author Contributions
CY and JL conceived and designed the approach. JH performed the experiments. JW and GZ analyzed the data. JH and JL wrote the manuscript. JL and HL supervised the whole study process and revised the manuscript. All authors have read and approved the final version of manuscript.
Funding
This work was supported by the National Natural Science Foundation of China (Nos. 61972134, 61802113, and 61802114). Science and Technology Development Plan Project of Henan Province, (Nos. 202102210173 and 212102210091). China Postdoctoral Science Foundation (No. 2020M672212). Henan Province Postdoctoral Research Project Founding.
Conflict of Interest
The authors declare that the research was conducted in the absence of any commercial or financial relationships that could be construed as a potential conflict of interest.
Acknowledgments
This paper is recommended by the 5th Computational Bioinformatics Conference.
Footnotes
References
Abyzov, A., Urban, A. E., Snyder, M., and Gerstein, M. (2011). CNVnator: an approach to discover, genotype, and characterize typical and atypical CNVs from family and population genome sequencing. Genome Res. 21, 974–984. doi: 10.1101/gr.114876.110
Alkan, C., Coe, B. P., and Eichler, E. E. (2011). Genome structural variation discovery and genotyping. Nat. Rev. Genet. 12, 363–376. doi: 10.1038/nrg2958
Baker, M. (2012). Structural variation: the genome’s hidden architecture. Nat. Methods 9, 133–137. doi: 10.1038/nmeth.1858
Boeva, V., Popova, T., Bleakley, K., Chiche, P., Cappo, J., Schleiermacher, G., et al. (2012). Control-FREEC: a tool for assessing copy number and allelic content using next-generation sequencing data. Bioinformatics 28, 423–425. doi: 10.1093/bioinformatics/btr670
Chen, K., Wallis, J. W., McLellan, M. D., Larson, D. E., Kalicki, J. M., Pohl, C. S., et al. (2009). BreakDancer: an algorithm for high-resolution mapping of genomic structural variation. Nat. Methods 6, 677–681. doi: 10.1038/nmeth.1363
Chiang, D. Y., Getz, G., Jaffe, D. B., O’kelly, M. J., Zhao, X., Carter, S. L., et al. (2009). High-resolution mapping of copy-number alterations with massively parallel sequencing. Nat. Methods 6, 99–103. doi: 10.1038/nmeth.1276
Feuk, L., Carson, A. R., and Scherer, S. W. (2006). Structural variation in the human genome. Nat. Rev. Genet. 7, 85–97.
Guan, P., and Sung, W.-K. (2016). Structural variation detection using next-generation sequencing data: a comparative technical review. Methods 102, 36–49. doi: 10.1016/j.ymeth.2016.01.020
Gusnanto, A., Wood, H. M., Pawitan, Y., Rabbitts, P., and Berri, S. (2012). Correcting for cancer genome size and tumour cell content enables better estimation of copy number alterations from next-generation sequence data. Bioinformatics 28, 40–47. doi: 10.1093/bioinformatics/btr593
Holtgrewe, M., Kuchenbecker, L., and Reinert, K. (2015). Methods for the detection and assembly of novel sequence in high-throughput sequencing data. Bioinformatics 31, 1904–1912. doi: 10.1093/bioinformatics/btv051
Hormozdiari, F., Hajirasouliha, I., Dao, P., Hach, F., Yorukoglu, D., Alkan, C., et al. (2010). Next-generation VariationHunter: combinatorial algorithms for transposon insertion discovery. Bioinformatics 26, i350–i357.
Huang, W., Li, L., Myers, J. R., and Marth, G. T. (2012). ART: a next-generation sequencing read simulator. Bioinformatics 28, 593–594. doi: 10.1093/bioinformatics/btr708
Jeffares, D. C., Jolly, C., Hoti, M., Speed, D., Shaw, L., Rallis, C., et al. (2017). Transient structural variations have strong effects on quantitative traits and reproductive isolation in fission yeast. Nat. Commun. 8:14061.
Kavak, P., Lin, Y.-Y., Numanagiæ, I., Asghari, H., Güngör, T., Alkan, C., et al. (2017). Discovery and genotyping of novel sequence insertions in many sequenced individuals. Bioinformatics 33, i161–i169.
Kehr, B., Melsted, P., and Halldórsson, B. V. (2016). PopIns: population-scale detection of novel sequence insertions. Bioinformatics 32, 961–967. doi: 10.1093/bioinformatics/btv273
Korbel, J. O., Abyzov, A., Mu, X. J., Carriero, N., Cayting, P., Zhang, Z., et al. (2009). PEMer: a computational framework with simulation-based error models for inferring genomic structural variants from massive paired-end sequencing data. Genome Biol. 10:R23.
Kosugi, S., Momozawa, Y., Liu, X., Terao, C., Kubo, M., and Kamatani, Y. (2019). Comprehensive evaluation of structural variation detection algorithms for whole genome sequencing. Genome Biol. 20:117.
Lee, S., Hormozdiari, F., Alkan, C., and Brudno, M. (2009). MoDIL: detecting small indels from clone-end sequencing with mixtures of distributions. Nat. Methods 6, 473–474. doi: 10.1038/nmeth.f.256
Luo, J., Wang, J., Li, W., Zhang, Z., Wu, F.-X., Li, M., et al. (2015a). EPGA2: memory-efficient de novo assembler. Bioinformatics 31, 3988–3990.
Luo, J., Wang, J., Zhang, Z., Wu, F.-X., Li, M., and Pan, Y. (2015b). EPGA: de novo assembly using the distributions of reads and insert size. Bioinformatics 31, 825–833. doi: 10.1093/bioinformatics/btu762
MacConaill, L. E., and Garraway, L. A. (2010). Clinical implications of the cancer genome. J Clin. Oncol. 28:5219. doi: 10.1200/jco.2009.27.4944
Rizk, G., Gouin, A., Chikhi, R., and Lemaitre, C. (2014). MindTheGap: integrated detection and assembly of short and long insertions. Bioinformatics 30, 3451–3457. doi: 10.1093/bioinformatics/btu545
Sindi, S., Helman, E., Bashir, A., and Raphael, B. J. (2009). A geometric approach for classification and comparison of structural variants. Bioinformatics 25, i222–i230.
Suzuki, S., Yasuda, T., Shiraishi, Y., Miyano, S., and Nagasaki, M. (2011). ClipCrop: a tool for detecting structural variations with single-base resolution using soft-clipping information. BMC Bioinformatics 12(Suppl 14):S7. doi: 10.1186/1471-2105-12-S14-S7
The 1000 Genomes Project Consortium (2010). A map of human genome variation from population-scale sequencing. Nature 467:1061. doi: 10.1038/nature09534
Wala, J. A., Bandopadhayay, P., Greenwald, N. F., O’Rourke, R., Sharpe, T., Stewart, C., et al. (2018). SvABA: genome-wide detection of structural variants and indels by local assembly. Genome Res. 28, 581–591. doi: 10.1101/gr.221028.117
Wang, J., Mullighan, C. G., Easton, J., Roberts, S., Heatley, S. L., Ma, J., et al. (2011). CREST maps somatic structural variation in cancer genomes with base-pair resolution. Nat. Methods 8, 652–654. doi: 10.1038/nmeth.1628
Ye, K., Schulz, M. H., Long, Q., Apweiler, R., and Ning, Z. (2009). Pindel: a pattern growth approach to detect break points of large deletions and medium sized insertions from paired-end short reads. Bioinformatics 25, 2865–2871. doi: 10.1093/bioinformatics/btp394
Yoon, S., Xuan, Z., Makarov, V., Ye, K., and Sebat, J. (2009). Sensitive and accurate detection of copy number variants using read depth of coverage. Genome Res. 19, 1586–1592. doi: 10.1101/gr.092981.109
Zhang, Q., Ding, L., Larson, D. E., Koboldt, D. C., McLellan, M. D., Chen, K., et al. (2010). CMDS: a population-based method for identifying recurrent DNA copy number aberrations in cancer from high-resolution data. Bioinformatics 26, 464–469. doi: 10.1093/bioinformatics/btp708
Keywords: structural variation, alignment, short read, the next generation sequencing technology, soft-clipped read
Citation: Yan C, He J, Luo J, Wang J, Zhang G and Luo H (2021) SIns: A Novel Insertion Detection Approach Based on Soft-Clipped Reads. Front. Genet. 12:665812. doi: 10.3389/fgene.2021.665812
Received: 09 February 2021; Accepted: 06 April 2021;
Published: 30 April 2021.
Edited by:
Wang Guohua, Harbin Institute of Technology, ChinaReviewed by:
Hailin Chen, East China Jiaotong University, ChinaMinzhu Xie, Hunan Normal University, China
Copyright © 2021 Yan, He, Luo, Wang, Zhang and Luo. This is an open-access article distributed under the terms of the Creative Commons Attribution License (CC BY). The use, distribution or reproduction in other forums is permitted, provided the original author(s) and the copyright owner(s) are credited and that the original publication in this journal is cited, in accordance with accepted academic practice. No use, distribution or reproduction is permitted which does not comply with these terms.
*Correspondence: Junwei Luo, bHVvanVud2VpQGhwdS5lZHUuY24=; Huimin Luo, bHVvaHVpbWluQGhlbnUuZWR1LmNu