 Nasim Vahabi
 George Michailidis
- Informatics Institute, University of Florida, Gainesville, FL, United States
Through the developments of Omics technologies and dissemination of large-scale datasets, such as those from The Cancer Genome Atlas, Alzheimer’s Disease Neuroimaging Initiative, and Genotype-Tissue Expression, it is becoming increasingly possible to study complex biological processes and disease mechanisms more holistically. However, to obtain a comprehensive view of these complex systems, it is crucial to integrate data across various Omics modalities, and also leverage external knowledge available in biological databases. This review aims to provide an overview of multi-Omics data integration methods with different statistical approaches, focusing on unsupervised learning tasks, including disease onset prediction, biomarker discovery, disease subtyping, module discovery, and network/pathway analysis. We also briefly review feature selection methods, multi-Omics data sets, and resources/tools that constitute critical components for carrying out the integration.
Introduction
With the development of multi-Omics initiatives (e.g., The Cancer Genome Atlas (TCGA) www.genome.gov/Funded-Programs-Projects/Cancer-Genome-Atlas, International Cancer Genome Consortium (ICGC) dcc.icgc.org/, and Genotype-Tissue Expression (GTEx) gtexportal.org/home/), several collections of Omics data (epigenome, genome, transcriptome, proteome, and metabolome) have become available to the biomedical community. Moreover, curated databases for Omics interactions (e.g., DoRiNA, a database of RNA interactions in post-transcriptional regulation, dorina.mdc-berlin.de/), and molecular pathways (e.g., Kyoto Encyclopedia of Genes and Genomes (KEGG) www.genome.jp/kegg/, Reactome reactome.org/, and functional protein association networks (STRING) string-db.org/) are also available to incorporate known biological information in the Omics analysis. Environmental/clinical features are external sources of influence that can play a key role in the development of complex diseases (Chakraborty et al., 2018). Incorporating known biological information (a detailed list of databases/resources is presented in Supplementary Table S1) is particularly important since the presence of many more features than available samples (high-dimensionality) pose a critical challenge to almost all Omics analysis methods. Note that human genomes are regulated at multiple levels, which are captured by different genomic assays, and also environmental/clinical factors. Further, these factors exhibit intricate interdependencies; for example, DNA methylation is known to affect the phenotypic outcome of genetic variation and offers highly complementary information on transcriptional silencing and gene imprinting. However, the identification of causal relationships is still very much a work in progress. Therefore, a coherent biological model of complex diseases would only be possible if the various layers of Omics regulations, environmental/clinical factors, and their relationships are considered. Interconnections and heterogeneity are other challenges in understanding the complex nature of diseases and their key biomarkers.
There have been various attempts to address these issues. The terms supervised and unsupervised are often used to describe different approaches to data integration. Supervised methods train a model using labeled training data with known outcome variables (such as disease status, exposure to a specific environmental factor, and survival time). In contrast, unsupervised data integration consists of a class of methods that make inferences and find patterns in input data sets without labeled outcome variables (such as normal/disease status, benign/tumor tissue, and early/late-stage progression). Unsupervised multi-Omics approaches typically aim to classify (e.g., disease and sample subtype) and discover biomarkers/modules (such as prioritize genes associated with a disease). There might be multiple outcome variables (such as time-to-cure, or cancer-stage) which are mostly considered one-by-one in the available methods (instead of using multivariate models). Note that multiple Omics data often contain missing values, an issue particularly common for individuals with measurements by selected Omics modalities. Imputation is a typical solution to infer the missing values, see (Song et al., 2020) for an overview of the available multi-Omics imputation methods. Most of the supervised multi-Omics methods/tools require “matched samples” (where multiple types of Omics data are measured on the same subject/patient). For the remainder of the paper, we consider that samples are matched unless otherwise is stated. Last but not least, the molecules and Omics modalities involved in a biological process are usually correlated, and it is shown that most of the major biological processes are only affected by a small set of features (Wang et al., 2014). Thus, different feature selection methods have been introduced to address this issue and decrease computational complexity (for a comprehensive review of feature selection methods refer to Supplementary Section S2).
In the sequel, we review key unsupervised multi-Omics data integration approaches and summarize the state-of-the-art of statistical models and related topics, including an overview of different Omics data and sources. Existing reviews on the topic of multi-Omics data integration are narrowly focused, such as on a specific statistical approach (e.g., network analysis or clustering) or in a specific field (e.g., machine learning methods in oncology (Nicora et al., 2020)). On the contrary, we provide a comprehensive list of key unsupervised multi-Omics data integration methods leveraging a diverse set of statistical methods and biological objectives. Note that we furnish technical details for a selective list of methods that have been more widely adopted in applications. The remainder of the paper is organized as follows: In Multi-Omics Data, we briefly review the nature of multi-Omics data. In Unsupervised Multi-Omics Data Integration Methods, we provide our categorization of unsupervised multi-Omics data integration methods followed by detailed descriptions and case studies of selected ones in each of the proposed categories. We conclude with some remarks and directions for future work. More detailed information, including technical descriptions, formulas/algorithms, and additional illustrative case studies are provided in the Appendix due to space limitations. Further, a comprehensive review of multi-Omics data definition (Supplementary Section S1) and feature selection methods (Supplementary Section S2) is provided in the Supplement.
Multi-Omics Data
The term Omics refers to the collective characterization and quantification of biomolecules that are involved in the structure, function, and dynamics of organisms and biological processes. Figure 1 provides an overview of the molecular arrangement of key Omics modalities, potential interactions between and within them, the types of features available in each Omics layer, and the different approaches to their analysis. A full introduction to different Omics data is beyond the aim of this article; for detailed information and definition of Omics modalities, and a list of multiple Omics public data sources/repositories, refer to Supplementary Section S1 (including Supplementary Table S1). For a comprehensive overview of Omics modalities, background, technologies, and resources refer to (Gligorijević et al., 2016; Sun and Hu, 2016; Manzoni et al., 2018).
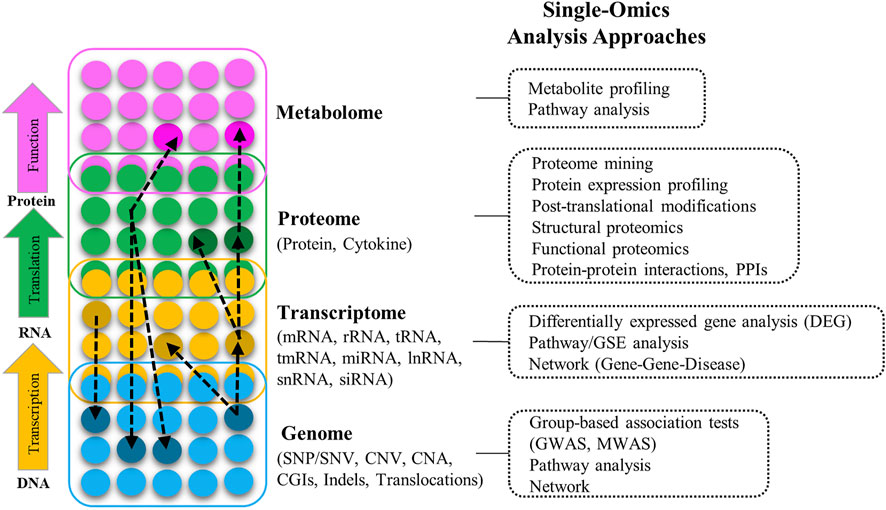
FIGURE 1. Different layers of multi-Omics data (genome, transcriptome, proteome, metabolome), the interactions between them (black dashed-arrow), types of the Omics features in each layer, and different approaches to analyze Omics data in different layers (SNP: Single nucleotide polymorphism, SNV: Single nucleotide variation, CNV: Copy number variation, CAN: Copy number alternation, CGIs: CpG islands, Indels: Insertion and deletion, GWAS: Genome-wide association study, MWAS: Methylation-wide association study, RNA: Ribonucleic acid, mRNA: Messenger RNA, rRNA: Ribosomal RNA, tRNA: Transfer RNA, tmRNA: Transfer-messenger RNA, miRNA: Micro RNA, lncRNA: Long-noncoding RNA, snRNA: Small nuclear RNA, siRNA: Small interfering RNA, GSE: Gene-set enrichment).
Unsupervised Multi-Omics Data Integration Methods
Categorizing the multi-Omics data integration methods is not a trivial task. There is a huge list of diverse methodologies with different objectives. One way to systematically categorize these methods is to consider their underlying statistical strategies, their biological objective, and the way they handle and treat multiple Omics datatypes. For instance, some methods (so-called “data-ensemble”) concatenate the multi-Omics data from different molecular layers to a single matrix as the input data (see Figure 2). Whereas the so-called “model-ensemble” approaches analyze each Omics data independently and then ensemble/fuse the results to construct an integrative analysis (see Figure 2).
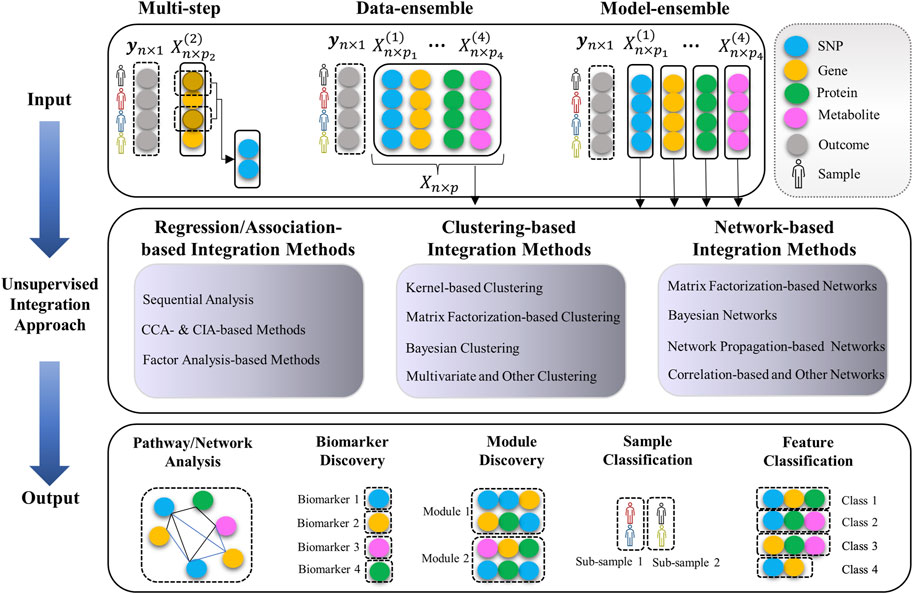
FIGURE 2. Unsupervised multi-omics data integration pipeline (input data, integration methods, and output). Data-ensemble methods concatenate the multi-Omics data from different molecular layers to a single matrix as the input data. Model-ensemble methods analyze each Omics data independently and then ensemble/fuse the results to construct an integrative analysis. A “module” is a combination of different Omics markers with similar functions or associations regarding the underlying outcome. A “class” is a group of Omics markers that have the same effect on the outcome. A “sub-sample” is a group of biological samples (e.g., human, animal, plant) with the same behavior regarding the underlying outcome.
We categorize the integration methods into the following three comprehensive categories: 1) Regression/Association-based Methods, 2) Clustering-based Methods, and 3) Network-based Methods. In each category, we group the methods based on their statistical approaches (see Table 1). Each of the methods will also be assigned to one of the following “macro” categories: (A) Multi-step and Sequential Analysis (MS-SA), (B) Data-ensemble (DatE), and (C) Model-ensemble (ModE) (see Figure 2 and Tables 2-4). “DatE” refers to methods that typically concatenate the multi-Omics data from different molecular layers to a single data matrix and consider that as the analysis input. Whereas the so-called “ModE” approaches analyze each Omics data independently and then ensemble/fuse the results to construct an integrative analysis. Table 1 shows the (high-level) list of the key methods we aim to review, with details provided in the proceeding sub-sections.
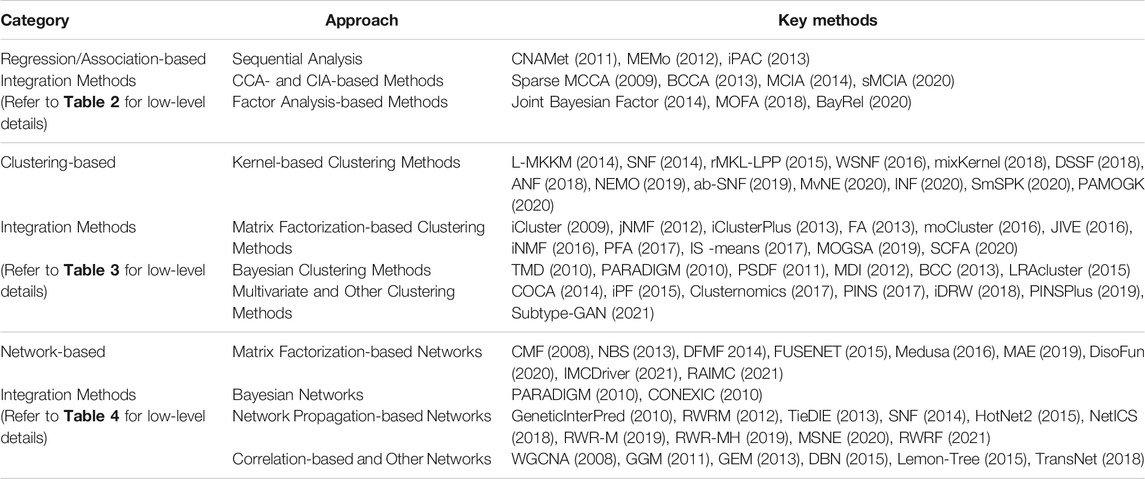
TABLE 1. High-level: Unsupervised multi-Omics data integration methods.
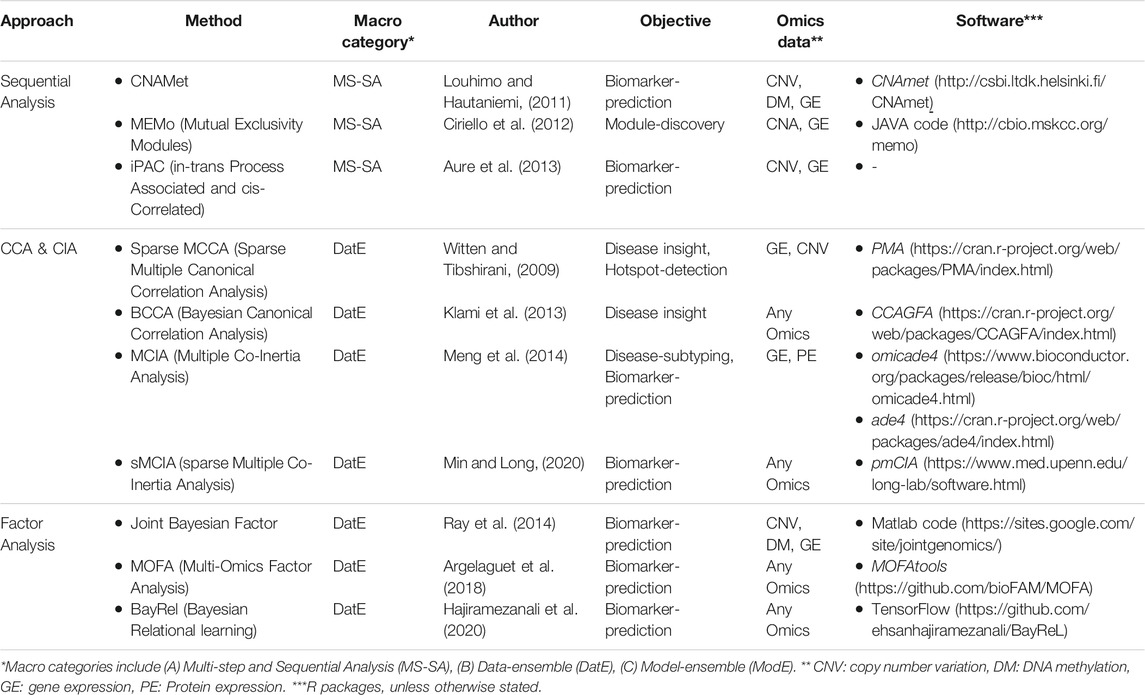
TABLE 2. Low-level: Regression/Association-based unsupervised integration methods.
Regression/Association-Based Integration Methods
One of the basic strategies for multi-Omics data integration is identifying marginal associations/correlations between different Omics layers. Sequential analysis is an example of this strategy where a sequence of statistical tests and models are applied to narrow down the list of features in one Omics layer (mostly genes) based on their relationship with features in other Omics layers (mostly CAN, genotypes, and DNA methylation). Multivariate analysis (such as CCA, CIA, and factor analysis) is another popular approach for multi-Omics data integration due to its flexibility in accepting multiple matrices as input data. The kernel-based method gives an excellent opportunity to work with lower space similarity kernels (such as patient-patient similarity, gene-gene similarity) instead of the original (raw) Omics data. We grouped multi-Omics unsupervised regression-based methods into three distinct categories based on their statistical approaches, including sequential analysis, CCA- and CIA-based, and factor analysis-based methods (see Table 2 for complementary details for each method).
Sequential Analysis
CNAmet (Louhimo and Hautaniemi, 2011) is a biomarker-discovery correlation-based method. It consists of two main steps; first, weights are calculated for each gene connecting it to DNA methylation and copy number variation (CNV). Second, each gene’s weights are combined and tested (using a corrected p-value via permutation) to calculate a global score for each gene. These scores help identify whether a gene is hypomethylated (and upregulated) or hypermethylated (and downregulated). The main hypothesis is that amplified copy number and hypomethylation result in gene upregulation. iPAC (in-trans Process Associated and cis-Correlated) (Aure et al., 2013) is an unsupervised, integrative method based on mRNA, and CNV aims to identify the cis-regulated genes. It also uses a sequence of statistical tests to narrow down the list of cancer driver genes. In summary, it takes the matrix of all the genes as the input, first filters the genes based on aberration frequency (>10%), then filters the remaining genes based on in-cis correlation (>0.6), and finally checks the in-trans functionality for the remaining ones that make the final set of gens. MEMo (Mutual Exclusivity Modules) (Ciriello et al., 2012) is a module-discovery method to find a set of genes that exhibit the same genetic alternation among patients. First, it gives a score to each gene and makes a binary-event-matrix based on these scores where its elements are either “1” indicating that the gene is significantly altered or “0” otherwise. Subsequently, it builds a network from genes involved in the same molecular pathway (using curated and nun-curated sources of biological information/interactions). The final step collects the genomic events within this network that show a significant level of mutual exclusivity via a permutation test.
Illustrative Case-studies: CNAmet is applied to a cohort of glioblastoma multiforme (GBM) patients from TCGA to find synergistically regulated genes by DNA methylation CNV. It could identify this synergistic effect on well-known oncogenes, including MDM2, EGFR, and PDGFRA. CNAmet also showed that GBM patients with hypomethylated (upregulated) EGFR had a better prognosis than patients with amplified EGFR. iPAC is applied to a cohort of breast carcinoma patients. It identified a list of significant genes, including ERBB2, MAP3K7, MDM4, FGFR1, CCND1, and FADD, which are well-known cancer-associated genes. It also included some less appreciated genes such as ATAD2, TPD52, and PPM1D, which were reported as cancer genes in previous independent studies (Choschzick et al., 2010; Lambros et al., 2010). iPAC could also identify several novel genes such as MTL5 that can affect multiple proteins/enzymes via its negative correlation with the MT (metallothionein) family of proteins and metal-binding ability.
CCA- and CIA-Based Methods
CCA-based methods (Dolédec and Chessel, 1994) can be applied for module identification, feature selection, and classification in high-dimensional multi-Omics data. Due to the high dimensionality of Omics data, standard CCA cannot be employed directly. Therefore, there have been several extensions of CCA for more than two datasets (
where
CIA-based methods (Dolédec and Chessel, 1994; Dray et al., 2003) is another approach to find the low-dimensional components in two-table data settings where
CIA can be considered as a variation of CCA (Sankaran and Holmes, 2019); the only difference is that in CIA the norm constraint (
Illustrative Case-studies: Sparse MCCA is applied on a diffuse large B-cell lymphoma dataset to assess the relationships (such as co-amplification and codeletion) between copy number changes in genome regions on separate chromosomes (Meng et al., 2014). The results showed a complex relationship between CAN in different chromosomes. MCIA is applied to gene and protein expression for NCI-60 cancer cell lines from different tissues. Results showed that different cell lines were differentiated based on their tissue of origin. That is, cell line-specific features can help improve prediction and biomarker identification. In the 2nd application (Meng et al., 2014), MCIA is applied to a cohort of ovarian cancer patients, including mRNA expression data obtained from microarray and NGS. It identified four known subtypes of ovarian cancer (proliferative, immunoreactive, mesenchymal, and differentiated) along with its first two directions (components). Moreover, gene expression analysis in each component showed the capability of MCIA to detect disease subtype-specific markers.
Factor Analysis-Based Methods
MOFA (Multi-Omics Factor Analysis) (Argelaguet et al., 2018) is an unsupervised multi-Omics integration method that aims to detect the sources of variation (both technical and biological) in datasets via latent factors. It first decomposes each Omics data (
where
Illustrative Case-studies: MOFA is applied to a cohort of patients with chronic lymphocytic leukemia (CLL) to integrate mRNA expression, DNA methylation, somatic mutation, and drug response. It identified two important (already-known) markers, including the IGHV gene (immunoglobulin heavy-chain variable) and trisomy of chromosome 12. However, MOFA could find a more comprehensive and complex sub-structure for IGHV and connect it with multiple Omics, including changes in mRNA expression (LPL, PLD1, ADAM29), DNA methylation (cg17479716, cg19358877, cg26615224), and with drugs (tamatinib, dasatinib, AZD7762) that target kinases in the B-cell receptor pathway (Argelaguet et al., 2018). These changes in mRNA expression and DNA methylation were previously connected to IGHV in different independent studies (Plesingerova et al., 2017). Interestingly, IGHV and trisomy of chromosome 12 explained only <20% of the variation in CLL patients, indicating the presence of other factors and sources of heterogeneity. Therefore, they could find the oxidative stress pathway (with HSP family of proteins as the top-weighted genes) as one of the critical drivers which was previously underappreciated in the context of CLL. The results (factors) of MOFA are then used in a Cox-PH regression model and could predict the time to the next treatment with a reasonably high prediction accuracy (C-index∼75%). In the second and the third applications, MOFA is used to analyze Ustekinumab (UST) drug-response (Verstockt et al., 2019) and mESCs (mouse embryonic stem cells) multi-omics data (Argelaguet et al., 2018) to identify predictive factors (a combination of different Omics data).
Clustering-Based Integration Methods
Multi-Omics clustering methods enable the discovery of molecular subtypes, disease subtypes, and patterns/modules. These methods mostly aim to find a subgroup of features/samples that have similar functions/patterns. We grouped unsupervised multi-Omics clustering methods into four distinct categories based on their statistical approaches, including 1) kernel-based, 2) (non-negative) matrix factorization-based-based, 3) Bayesian, and 4) multivariate and other clustering methods (see Table 3 for complementary details for each method). Descriptions of and case studies for the key methods are provided in the proceeding sub-sections. For more detailed information, model description, and case studies refer to Supplementary Appendix Section SA1.
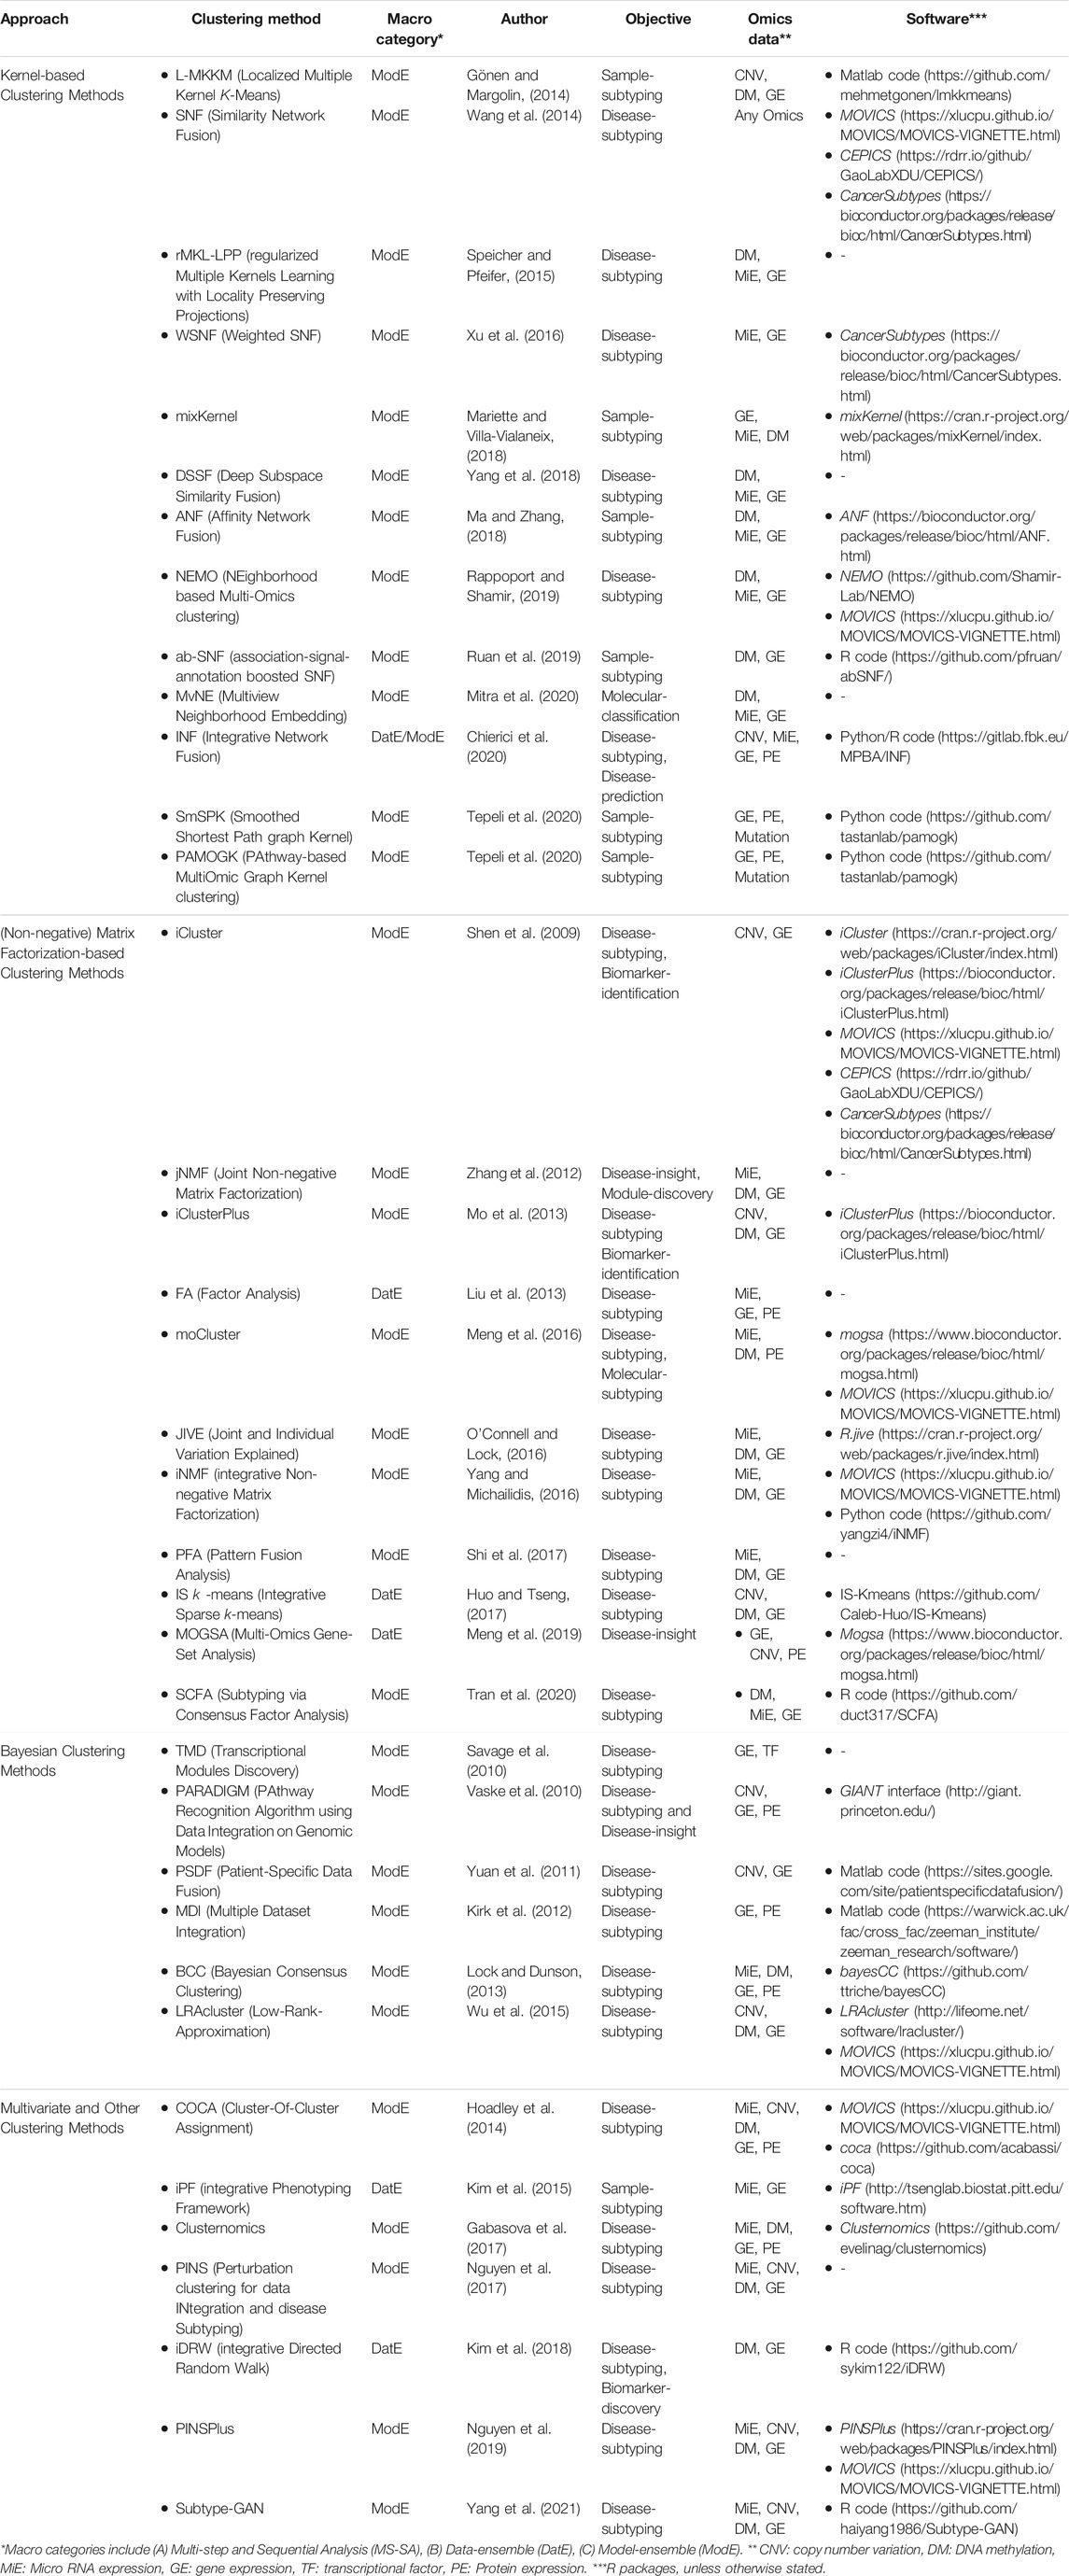
TABLE 3. Low-level: Clustering-based unsupervised integration methods.
Kernel-Based Clustering Method
The input data in the kernel-based methods is the kernel matrix (
SNF (Similarity Network Fusion) (Wang et al., 2014) is a popular method for multi-Omics data integration and subtype analysis. It first builds a sample-by-sample similarity matrix (or network, where nodes are samples and edges are similarities between samples) for each dataset separately and then fuses them to a global (weighted) sample similarity network. The second step (network-fusion) uses a nonlinear message-passing theory-based method (Pearl, 2014) to fuse the similarity matrices. SNF may lead to false fusion since it does not distinguish between different data types. Another drawback of SNF is that it uses Euclidean distance to calculate the similarity matrices between the samples that often is incapable of capturing the intrinsic similarities between data points. To address this issue, DSSF (Deep Subspace Similarity Fusion) (Yang et al., 2018) employs an auto-encoder to improve the discriminative similarity between samples. AFN (Affinity Network Fusion) (Ma and Zhang, 2018) is also an extension of SNF that enables the consideration of patients' pairwise distances. To handle the unmatched samples (different sample sizes in different Omics-types), NEMO (NEighborhood based Multi-Omics clustering) (Rappoport and Shamir, 2019) is introduced that enables the computation of global kernel matrix without performing any imputation on the missing observation. INF (Integrative Network Fusion) (Chierici et al., 2020) is another extension that utilizes SNF within a predictive framework including RF (Breiman, 2001) (Random Forest) and LSVM (Cortes and Vapnik, 1995) (Linear Support Vector Machine). See Supplementary Appendix Section SA1.1 for more details and case studies.
Illustrative Case-studies: SNF is applied to different multi-omics data integration studies. In the 1st application (2018) (Chiu et al., 2018), it is applied on a cohort of triple-negative breast cancers (TNBC) patients from TCGA (including CNV, miRNA, and mRNA expressions) to identify the different sub-groups of cancer patients. Results revealed a new TNBC classification scheme with three different clusters of patients. One of the clusters, interestingly, was enriched in the “non-basal” subtype (by PAM50), whereas PAM50 obtained the most common “basal-like” subtype. This nan-basal cluster showed more aggressive clinical characteristics and distinctive oncogenic features (including 38% basal-like2 and 50% luminal androgen receptor subtypes).
(Non-negative) Matrix Factorization-based Clustering Method
Standard factorization methods commonly use singular value decomposition (SVD), such as PCA. However, for some data types, such as genotypes, the original matrices are non-negative. SVD-based factorizations contain negative entries, making it difficult to interpret their results in some applications. In contrast, NMF (Nonnegative Matrix Factorization) (Lee and Seung, 2001) restricts the entries in matrix factors to be non-negative.
iCluster (Shen et al., 2009) simultaneously considers the association between different data types and the covariance structure within each datatype. It employs the principles of two methods, including probabilistic PCA(Tipping and Bishop, 1999) and a (spectral) relaxed version of
where
where
Illustrative Case-studies: iCluster is applied in different studies, mainly for cancer subtyping. It is recently applied to a cohort of ovarian carcinoma patients (including CNV, DNA methylation, and mRNA expression) to identify prognostic biomarkers (Zheng et al., 2019). The results revealed three distinct clusters of samples and identified UBB (ubiquitin B) and IL18BP (interleukin 18 binding protein) genes as the most prognostic biomarkers. The results suggested that lower expression of these two genes may result in higher methylation and lower CNV. Therefore, evaluating the expression of these two genes can help in early tumor diagnosis. In another study, iCluster is applied to multi-Omics data of adult soft tissue sarcomas (Lazar et al., 2017). iCluster showed that SS-subtype (synovial sarcoma) was the most distinct sarcoma with partial/complete loss of chromosome 3p (45% of cases), high expression of FGFR3 and miR-183, and methylation of the PDE4A promoter. Another cluster identified by iCluster mainly included LMS (Leiomyosarcoma) cases with high expression of MYLK, MYH11, ACTG2, miR-143, miR-145, lower inferred activity of the apoptosis pathway, and higher hormone receptor (ER/PR) levels. It inferred PI3K/AKT pathway activity. The authors also concluded that copy number changes were the most informatics Omics in characterizing these sarcomas (except SS).
Bayesian Clustering Method
In the Bayesian framework of a clustering task, class memberships are calculated using a probability model (such as a Dirichlet Process Mixture (DPM) model (MacEachern and Müller, 2000)) subject to a priori assumption about what the true relationship between the data might be, which is expressed as a probability distribution. This probability is then updated as new observations become available (which is captured by a posterior distribution). This approach enables the use of prior information informing the clusters (sub-samples, sub-disease, or sub-features). The DPM model is one of the most widely used Bayesian nonparametric methods in the multi-Omics (multitype) clustering-based data integration. For a tutorial on DPM models, refer to (Li et al., 2019).
LRAcluster (Low-Rank-Approximation) (Wu et al., 2015) is a low-rank probabilistic method (similar to iClusterPlus) for molecular classification that takes both continuous and categorical data as input. LRAcluster first models each datatype using a probabilistic model and combine them as
where
Illustrative Case-studies: LRAcluster is applied in a study of hepatocellular carcinoma (HCC) as the major subtype of liver cancer (Wang et al., 2019) to characterize the molecular alternation of the metastatic HCCs. The results identified a list of individualized molecules (including TNC, LAMA2, LAMC3, PDGFRA, CYP2E1, CYP3A4, CYP2C8, CYP1B1, CPS1, TAT, and HPD) significantly expressed between the primary tumor compare and portal vein tumor thrombosis. Therefore, an individualized differential analysis for sequencing data was proposed to automate the process of finding these individualized genes.
Multivariate and Other Clustering Method
COCA (Cluster-Of-Cluster Assignment) (Hoadley et al., 2014) integrates the single-Omics clusters using hierarchical clustering based on pairwise concordance between different Omics platforms (including mRNA, miRNA, DNA methylation, and mutation). PINS (Perturbation clustering for data INtegration and disease Subtyping) (Nguyen et al., 2017) is a disease sub-typing method. It first partitions the samples into
Illustrative Case-studies: COCA has recently been applied to a cohort of Ugandan cervical carcinoma patients (both
Network-Based Integration Methods
Some of the fundamental tasks of biological research are to prioritize the features (or groups of features) that exhibit similar profiles and tend to be functionally related/co-regulated (such as gene modules) and to identify the functional relationships between different biological features (such as gene co-expression and signaling pathways). Network-based approaches do not rely solely on statistical models, but also leverage information about functional relationships and interactions available in biological knowledge databases, when integrating multi-Omics data. A network is a graphical representation (including nodes and edges) of the relationships between discrete entities. In computational network biology, nodes usually represent different features (such as SNPs, CpGs, genes, proteins, metabolites, and or phenotypes, e.g., diseases), and edges represent the relationship between pairs of nodes. When two nodes are sharing an edge, they are called neighbors, adjacent, or directly connected. The adjacency matrix of a network is then an
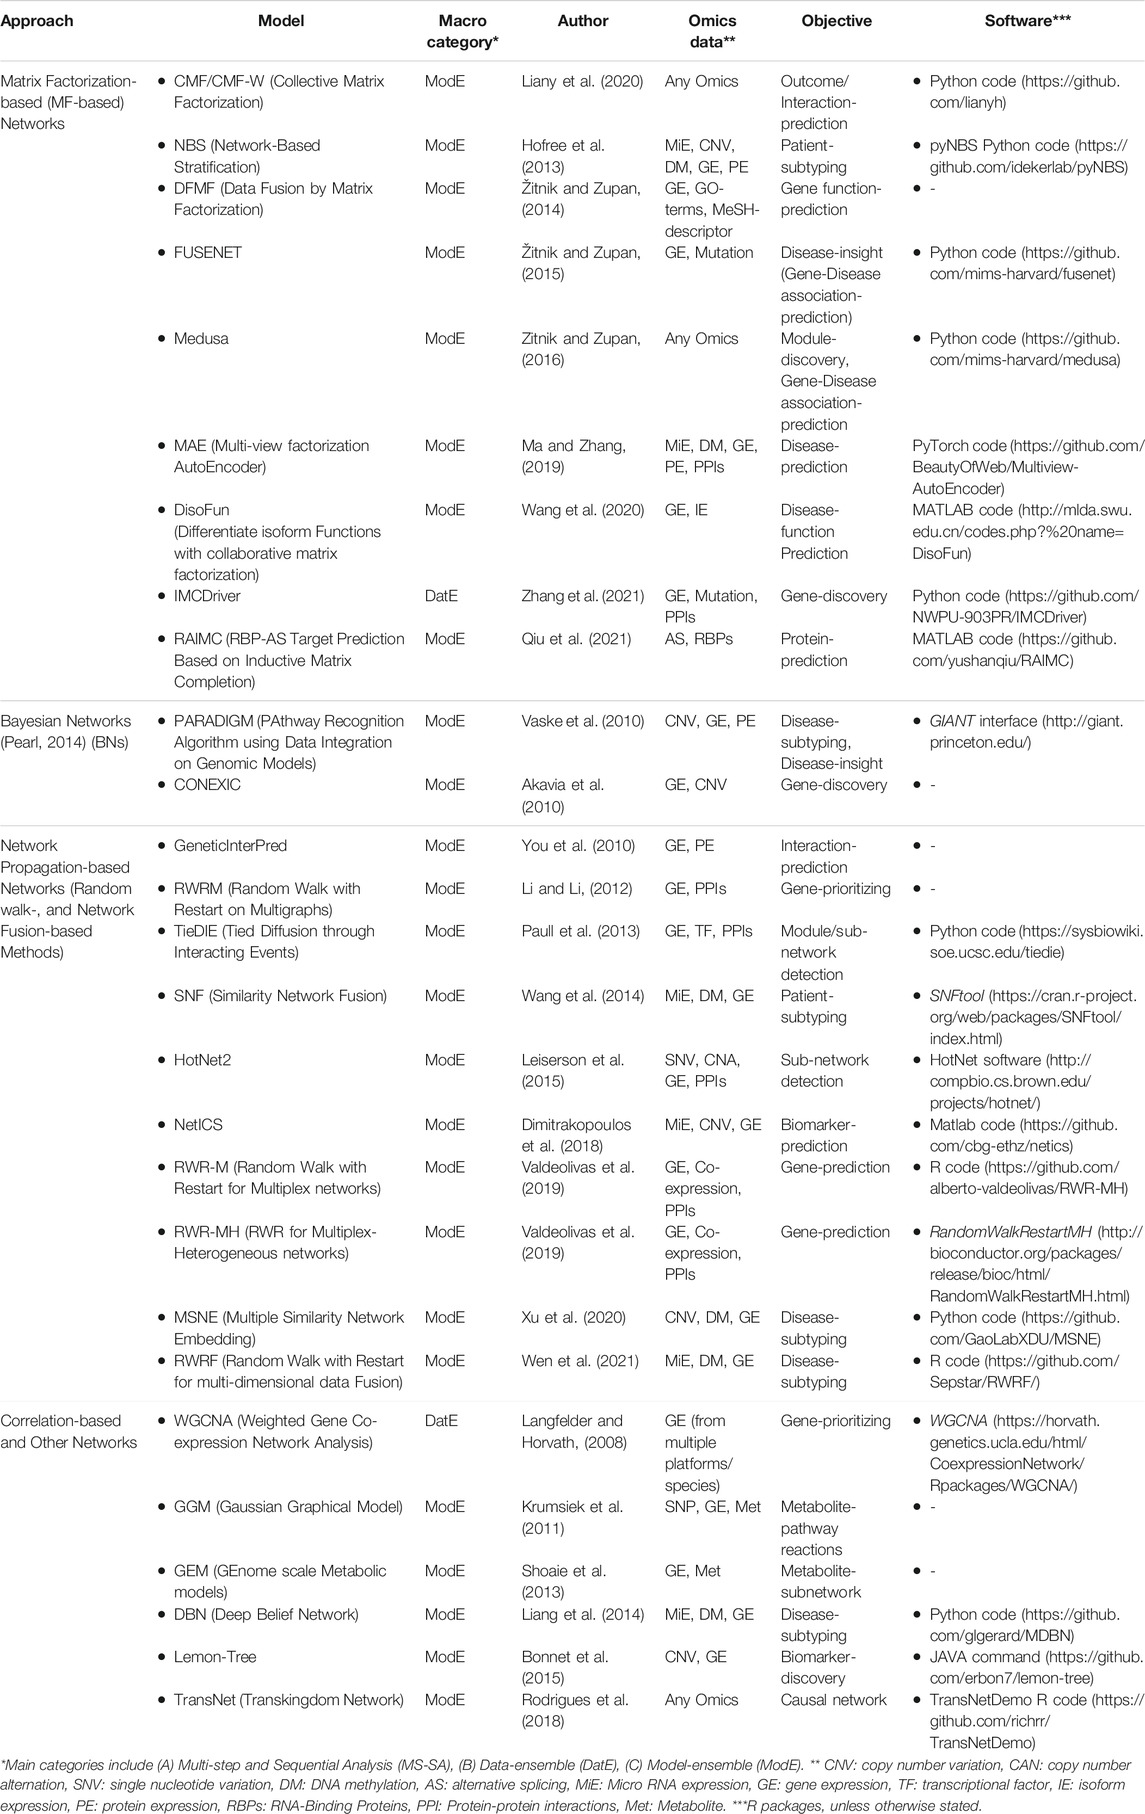
TABLE 4. Low-level: Network-based unsupervised integration methods.
Matrix Factorization-Based (MF-Based) Networks
NBS (Network-Based Stratification) (Hofree et al., 2013) is a sample-stratification method that uses both network propagation algorithm and matrix factorization to construct the final subtypes. Therefore, it can be categorized under either of these categories. NBS integrates genome-scale somatic mutations with a gene-interaction network. It first maps the mutations for each sample onto a gene-interaction network from STRING (https://string-db.org/), Pathway Commons (https://www.pathwaycommons.org/), and HumanNet (https://www.inetbio.org/humannet/download.php), and constructs the patient-by-gene matrix (
where
Illustrative Case-studies: NBS is applied for patient-subtype identification and discriminating the somatic mutation profiles in uterine, ovarian, and lung cancer studies obtained from TCGA. The survival result based on the identified subtypes showed that ovarian cancer patients with the most aggressive tumor had a mean survival of 32 months compared to others (∼80 months). The fibroblast growth factor (FGF) signaling pathway was enriched for this sub-network of patients with the worst survival in concordance with previous studies indicating the FGF signaling pathway as a driver of tumor progression resistant to anti-VEGF therapy (Cole et al., 2010). The next subtype of patients with relatively better (higher) survival was mainly enriched in DNA damage–response genes (including ATM, ATR, BRCA1, BRCA2, RAD51, and CHEK2) that have been referred to as BRCAness in previous studies (Konstantinopoulos et al., 2010).
Bayesian Networks (BNs)
Bayesian networks (BNs) are a combination of (directed acyclic) graph/network theory and probability models. Suppose
showing that each node (random variable
Illustrative Case-studies: CONEXIC is applied to gene-CNV paired data from melanoma patients (Lin et al., 2008) to identify a list of cancer driver genes. First, a list of candidates was generated using CNV data, and then the most likely drivers were collected by integrating CNV and mRNA expression. It resulted in several modulators that explain the behavior of 7869 genes. Many of the top modulators were involved in melanoma-related pathways and included known oncogenes and tumor suppressors. CONEXIC could successfully pick known cancer-related genes out of a large region with many underlying genes. For instance, CCNB2 (cell-cycle regulator) was selected from a large, amplified region. Finally, an automated literature-mining method called LitVAn (literature vector analysis) was used to find overrepresented terms in published studies. It resulted in a few well-known activated features in melanoma (such as PI3K, MAPK) and a novel process called “RAB” (Rabs regulate vesicular trafficking).
Network Propagation-Based (NP-Based) Networks
Network Propagation (NP) (Cowen et al., 2017) is a stochastic process that tracks each node’s flow and tries to amplify the signals through prior information and pass them to its neighborhoods over time. Suppose
where
where
where
Based on a benchmarking study (Picart-Armada et al., 2019) for network propagation methods, selecting a prominent network analysis method is not clear-cut. The authors concluded that network propagation methods enable the biomarker discovery, but their efficiency greatly depends on the input biological network and the nodesʼ initial score (see Supplementary Appendix Section SA2.2 for more information).
Illustrative Case-studies: SNF is applied to identify GBM subtypes vis integrating DNA methylation, mRNA, and miRNA expressions (Wang et al., 2014). The results indicated that most edges in the similarity network (patientsʼ similarities) were only detectable when two or more types of Omics information has applied. SNF could successfully distinguish the previously reported IDH subtype (Sturm et al., 2012) consisting of younger patients with an IDH1 mutation. SNF could further identify a subtype of patients who were more responsive to temozolomide, TMZ (a common GBM treatment), whereas another distinct subtype of patients with overexpressed CTSD and less responsive to TMZ [which is consistent with an in vitro study (Sun et al., 2012)]. SNF has recently been applied to TNBC (Chiu et al., 2018) and pancreatic cancers (Sinkala et al., 2020) to identify disease subtypes.
Correlation-Based and Other Networks
WGCNA (Weighted Gene Co-expression Network Analysis) (Langfelder and Horvath, 2008) is a gene-prioritizing correlation-network-based method that also enables gene module identification. Correlation networks are based on the correlation between a node and an outcome. The significance of a node (such as a gene) is then determined based on either the correlation coefficient or a regression-based p-value. WGCNA can be employed to find gene modules, sub-modules, and marker-prioritization. Lemon-Tree (Bonnet et al., 2015) is a biomarker-discovery method that first processes (normalize) the expression data (mRNA) and finds the co-expressed clusters of genes via a model-based Gibbs sampler (Joshi et al., 2008). It then employs ensemble methods (including spectral edge clustering algorithm) to identify gene modules and regulatory based on the co-expressed genes. Other Omics features (including miRNA, CNV, DNA methylation, and genotype) are added to the model as additional candidates and are combined to calculate the regulatory scores. Lemon-Tree also enables the gene ontology enrichment analysis for the modules. DBN (Deep Belief Network) (Liang et al., 2014) is a sample-classification (deep-learning, DL) method that integrates mRNA, miRNA, and DNA methylation data. DL methods are initially constructed from multi-layered (or deep) artificial neural networks (Bishop, 1995) (ANNs), inspired by actual NNs in the brain. ANN is a parallel system that accepts the input data in its first layer (input layer). It then passes the data into one or more hidden layers that ultimately connect them to an output layer. ANNs used for DL have more hidden layers where each of them helps to refine its previous layer by running a feature construction task. DBN applies a Gaussian restricted Boltzmann machines (Gaussian RBM) (Hinton, 2012) model to obtain the featuresʼ conditional distribution. An RBM consists of a visible layer (a layer of
Illustrative Case-studies: Lemon-Tree has been applied to TCGA glioblastoma expression and copy-number data (Bonnet et al., 2015). It resulted in a module network composed of 121 clusters of co-expressed genes and a list of prioritized (high-scored) genes, mostly associated with amplified/deleted regions. Several of these high-scored genes were already reported as cancer genes in glioblastoma (including EGFR, PDGFRA, FGFR3, PIK3CA, MDM4, CDKN2A/B, and PTEN) where all involved in glioblastoma driver pathways, including proliferation, apoptosis, and angiogenesis pathways. Besides the well-known genes, Lemon-Tree could also identify a few novel markers that have rarely or never studied glioblastoma. For instance, INSR was involved in several modules. It stimulates cell proliferation and is aberrantly expressed in cancer cells (Belfiore et al., 2009); therefore, amplification of INSR in glioblastoma may enhance proliferation. PAOX (polyamine oxidase) is another novel marker that might have tumor suppressor activity via amine oxidase activity and their primary involvement in cancer growth inhibition and progression (Guzeloglu-Kayisli et al., 2004). Interestingly, PAOX was biologically relevant based on its prognostic value via a survival analysis.
Conclusion
This paper reviews key methodologies to perform unsupervised multi-Omics data integration. We grouped the methods into three categories, including regression/association-based, clustering-based, and network-based methods. In each category, we then categorized the methods based on the statistical approach employed. Each of the methods has also been assigned to one of the following “macro” categories: (A) multi-step and sequential analysis (MS-SA), (B) data-ensemble (DatE), and (C) model-ensemble (ModE) (see Table 1 and Figure 2).
The majority of multi-Omics integration methods were applied to cancer data and mainly focused on genome and transcriptome integration. Therefore, the community needs to devote more efforts to make more publicly available data sources with more diverse Omics profiles (such as metabolome) and environmental/health factors. Many of the reviewed methods use custom pipelines where combinations of multiple methods are employed to answer the underlying biological question. Therefore, many of these methods are highly dependent on the input Omics data and prior information, making it difficult to compare these methods.
There are a few benchmarking studies for some of the methods we reviewed here (mostly clustering methods). For instance, comparison and benchmarking of unsupervised multi-Omics clustering algorithms (including, LRAcluster, MCCA, SNF, PINS, MCIA, moCluster, iClusterPlus) have been performed using both real data (multiple cancer from TCGA (Rappoport and Shamir, 2018) and a dataset of kidney renal clear cell carcinoma patients (Tepeli et al., 2020)), and simulated data (Pierre-Jean et al., 2020). Network propagation methods have been compared using multiple non-cancerous data (Picart-Armada et al., 2019). Graph- and kernel-based integration methods have been compared using cancer and hypertension data (Yan et al., 2017).
Future efforts should be directed toward 1) integrating more various types of data (including Omics, clinical, and environmental), 2) integrating into a universal pipeline, and 3) integrating the a priori biological knowledge into the system. For instance, in most cases, we have access to quantitative trait information, which can help to improve the feature’s weight assignment and prioritization and increase the accuracy of the prediction/classification tasks. One of the key challenges in integrating large-scale and heterogeneous Omics data is the small sample size and, therefore, most of the methods are data-hungry. One informative way around this issue is to leverage this extra a priori biological information into the method. Although it is beyond the scope of this review, many of the reviewed methods can, in principle, leverage this extra information. Unsupervised deep learning (DL) methods can be a good solution for considering the biological structure among the -Omics data, such as the hierarchical path from DNA to RNA and further to protein. Therefore, more effort should be devoted to utilizing DL for multi-Omics data integration problems with limited (small) sample sizes. Moreover, as noted in the Introduction, there might be multiple outcome variables (such as time-to-cure, or cancer-stage) which are mostly considered one-by-one in the available methods. Multivariate modeling (i.e., with multiple outcome variables) of multi-Omics profiles may provide a more realistic picture than looking at a single outcome, and therefore provides a more powerful test of significance. Lastly, most of the reviewed methods are applied on two or three different Omics modalities, however, in principle/theory, it is possible to extend these methods for more than 2 modalities, although the technical issues become more involved.
Author Contributions
NV and GM designed and wrote the manuscript. All authors read and approved the final manuscript.
Funding
This work was funded by the National Institute on Health, NIH, 1U01CA235487-01 and 1R01GM114029-01A1.
Conflict of Interest
The authors declare that the research was conducted in the absence of any commercial or financial relationships that could be construed as a potential conflict of interest.
Publisher’s Note
All claims expressed in this article are solely those of the authors and do not necessarily represent those of their affiliated organizations, or those of the publisher, the editors and the reviewers. Any product that may be evaluated in this article, or claim that may be made by its manufacturer, is not guaranteed or endorsed by the publisher.
Supplementary Material
The Supplementary Material for this article can be found online at: https://www.frontiersin.org/articles/10.3389/fgene.2022.854752/full#supplementary-material
References
Akavia, U. D., Litvin, O., Kim, J., Sanchez-Garcia, F., Kotliar, D., Causton, H. C., et al. (2010). An Integrated Approach to Uncover Drivers of Cancer. Cell 143 (6), 1005–1017. doi:10.1016/j.cell.2010.11.013
Argelaguet, R., Velten, B., Arnol, D., Dietrich, S., Zenz, T., Marioni, J. C., et al. (2018). Multi-Omics Factor Analysis-A Framework for Unsupervised Integration of Multi-Omics Data Sets. Mol. Syst. Biol. 14 (6), e8124. doi:10.15252/msb.20178124
Aure, M. R., Steinfeld, I., Baumbusch, L. O., Liestøl, K., Lipson, D., Nyberg, S., et al. (2013). Identifying In-Trans Process Associated Genes in Breast Cancer by Integrated Analysis of Copy Number and Expression Data. PLoS One 8 (1), e53014. doi:10.1371/journal.pone.0053014
Belfiore, A., Frasca, F., Pandini, G., Sciacca, L., and Vigneri, R. (2009). Insulin Receptor Isoforms and Insulin Receptor/insulin-like Growth Factor Receptor Hybrids in Physiology and Disease. Endocr. Rev. 30 (6), 586–623. doi:10.1210/er.2008-0047
Bonnet, E., Calzone, L., and Michoel, T. (2015). Integrative Multi-Omics Module Network Inference with Lemon-Tree. Plos Comput. Biol. 11 (2), e1003983. doi:10.1371/journal.pcbi.1003983
Chakraborty, S., Hosen, M., Ahmed, M., and Shekhar, H. U. (20182018). Onco-multi-OMICS Approach: a New Frontier in Cancer Research. Biomed. Research International. doi:10.1155/2018/9836256
Chierici, M., Bussola, N., Marcolini, A., Francescatto, M., Zandonà, A., Trastulla, L., et al. (2020). Integrative Network Fusion: a Multi-Omics Approach in Molecular Profiling. bioRxiv.
Chiu, A. M., Mitra, M., Boymoushakian, L., and Coller, H. A. (2018). Integrative Analysis of the Inter-tumoral Heterogeneity of Triple-Negative Breast Cancer. Sci. Rep. 8 (1), 11807–11814. doi:10.1038/s41598-018-29992-5
Choschzick, M., Lassen, P., Lebeau, A., Marx, A. H., Terracciano, L., Heilenkötter, U., et al. (2010). Amplification of 8q21 in Breast Cancer Is Independent of MYC and Associated with Poor Patient Outcome. Mod. Pathol. 23 (4), 603–610. doi:10.1038/modpathol.2010.5
Ciriello, G., Cerami, E., Sander, C., and Schultz, N. (2012). Mutual Exclusivity Analysis Identifies Oncogenic Network Modules. Genome Res. 22 (2), 398–406. doi:10.1101/gr.125567.111
Cole, C., Lau, S., Backen, A., Clamp, A., Rushton, G., Dive, C., et al. (2010). Inhibition of FGFR2 and FGFR1 Increases Cisplatin Sensitivity in Ovarian Cancer. Cancer Biol. Ther. 10 (5), 495–504. doi:10.4161/cbt.10.5.12585
Cortes, C., and Vapnik, V. (1995). Support-vector Networks. Mach Learn. 20 (3), 273–297. doi:10.1007/bf00994018
Cowen, L., Ideker, T., Raphael, B. J., and Sharan, R. (2017). Network Propagation: a Universal Amplifier of Genetic Associations. Nat. Rev. Genet. 18 (9), 551–562. doi:10.1038/nrg.2017.38
Dimitrakopoulos, C., Hindupur, S. K., Häfliger, L., Behr, J., Montazeri, H., Hall, M. N., et al. (2018). Network-based Integration of Multi-Omics Data for Prioritizing Cancer Genes. Bioinformatics 34 (14), 2441–2448. doi:10.1093/bioinformatics/bty148
Dolédec, S., and Chessel, D. (1994). Co‐inertia Analysis: an Alternative Method for Studying Species–Environment Relationships. Freshw. Biol. 31 (3), 277–294.
Dray, S., Chessel, D., and Thioulouse, J. (2003). Co-inertia Analysis and the Linking of Ecological Data Tables. Ecology 84 (11), 3078–3089. doi:10.1890/03-0178
Gabasova, E., Reid, J., and Wernisch, L. (2017). Clusternomics: Integrative Context-dependent Clustering for Heterogeneous Datasets. Plos Comput. Biol. 13 (10), e1005781. doi:10.1371/journal.pcbi.1005781
Gagliardi, A., Porter, V. L., Zong, Z., Bowlby, R., Titmuss, E., Namirembe, C., et al. (2020). Analysis of Ugandan Cervical Carcinomas Identifies Human Papillomavirus Clade-specific Epigenome and Transcriptome Landscapes. Nat. Genet. 52 (8), 800–810. doi:10.1038/s41588-020-0673-7
Gligorijević, V., Malod-Dognin, N., and Pržulj, N. (2016). Integrative Methods for Analyzing Big Data in Precision Medicine. Proteomics 16 (5), 741–758. doi:10.1002/pmic.201500396
Gönen, M., and Margolin, A. A. (2014). “Localized Data Fusion for Kernel K-Means Clustering with Application to Cancer Biology,” in Paper presented at the Advances in neural information processing systems.
Guzeloglu-Kayisli, O., Amankulor, N. M., Voorhees, J., Luleci, G., Lifton, R. P., and Gunel, M. (2004). KRIT1/cerebral Cavernous Malformation 1 Protein Localizes to Vascular Endothelium, Astrocytes, and Pyramidal Cells of the Adult Human Cerebral Cortex. Neurosurgery 54 (4), 943–949. doi:10.1227/01.neu.0000114512.59624.a5
Hajiramezanali, E., Hasanzadeh, A., Duffield, N., Narayanan, K., and Qian, X. (2020). BayReL: Bayesian Relational Learning for Multi-Omics Data Integration. Adv. Neural Inf. Process. Syst. 33.
Hinton, G. E. (2012). “A Practical Guide to Training Restricted Boltzmann Machines,” in Neural Networks: Tricks of the Trade (Springer), 599–619. doi:10.1007/978-3-642-35289-8_32
Hoadley, K. A., Yau, C., Wolf, D. M., Cherniack, A. D., Tamborero, D., Ng, S., et al. (2014). Multiplatform Analysis of 12 Cancer Types Reveals Molecular Classification within and across Tissues of Origin. Cell 158 (4), 929–944. doi:10.1016/j.cell.2014.06.049
Hofree, M., Shen, J. P., Carter, H., Gross, A., and Ideker, T. (2013). Network-based Stratification of Tumor Mutations. Nat. Methods 10 (11), 1108–1115. doi:10.1038/nmeth.2651
Huo, Z., and Tseng, G. (2017). Integrative Sparse K-Means with Overlapping Group Lasso in Genomic Applications for Disease Subtype Discovery. Ann. Appl. Stat. 11 (2), 1011–1039. doi:10.1214/17-AOAS1033
Joshi, A., Van de Peer, Y., and Michoel, T. (2008). Analysis of a Gibbs Sampler Method for Model-Based Clustering of Gene Expression Data. Bioinformatics 24 (2), 176–183. doi:10.1093/bioinformatics/btm562
Kim, S., Herazo-Maya, J. D., Kang, D. D., Juan-Guardela, B. M., Tedrow, J., Martinez, F. J., et al. (2015). Integrative Phenotyping Framework (iPF): Integrative Clustering of Multiple Omics Data Identifies Novel Lung Disease Subphenotypes. BMC genomics 16 (1), 924. doi:10.1186/s12864-015-2170-4
Kim, S. Y., Kim, T. R., Jeong, H. H., and Sohn, K. A. (2018). Integrative Pathway-Based Survival Prediction Utilizing the Interaction between Gene Expression and DNA Methylation in Breast Cancer. BMC Med. Genomics 11 (3), 68. doi:10.1186/s12920-018-0389-z
Kirk, P., Griffin, J. E., Savage, R. S., Ghahramani, Z., and Wild, D. L. (2012). Bayesian Correlated Clustering to Integrate Multiple Datasets. Bioinformatics 28 (24), 3290–3297. doi:10.1093/bioinformatics/bts595
Klami, A., Virtanen, S., and Kaski, S. (2013). Bayesian Canonical Correlation Analysis. J. Machine Learn. Res. 14 (Apr), 965–1003.
Konstantinopoulos, P. A., Spentzos, D., Karlan, B. Y., Taniguchi, T., Fountzilas, E., Francoeur, N., et al. (2010). Gene Expression Profile ofBRCAness that Correlates with Responsiveness to Chemotherapy and with Outcome in Patients with Epithelial Ovarian Cancer. Jco 28 (22), 3555–3561. doi:10.1200/jco.2009.27.5719
Korb, K. B., and Nicholson, A. E. (2010). Bayesian Artificial Intelligence. Boca Raton, FL: CRC Press.
Krumsiek, J., Suhre, K., Illig, T., Adamski, J., and Theis, F. J. (2011). Gaussian Graphical Modeling Reconstructs Pathway Reactions from High-Throughput Metabolomics Data. BMC Syst. Biol. 5 (1), 21. doi:10.1186/1752-0509-5-21
Lambros, M. B., Natrajan, R., Geyer, F. C., Lopez-Garcia, M. A., Dedes, K. J., Savage, K., et al. (2010). PPM1D Gene Amplification and Overexpression in Breast Cancer: a qRT-PCR and Chromogenic In Situ Hybridization Study. Mod. Pathol. 23 (10), 1334–1345. doi:10.1038/modpathol.2010.121
Langfelder, P., and Horvath, S. (2008). WGCNA: an R Package for Weighted Correlation Network Analysis. BMC bioinformatics 9 (1), 559. doi:10.1186/1471-2105-9-559
Lazar, A. J., McLellan, M. D., Bailey, M. H., Miller, C. A., Appelbaum, E. L., Cordes, M. G., et al. (2017). Comprehensive and Integrated Genomic Characterization of Adult Soft Tissue Sarcomas. Cell 171 (4), 950–965. doi:10.1016/j.cell.2017.10.014
Lee, D. D., and Seung, H. S. (2001). “Algorithms for Non-negative Matrix Factorization,” in Paper presented at the Advances in neural information processing systems.
Lee, D. D., and Seung, H. S. (1999). Learning the Parts of Objects by Non-negative Matrix Factorization. Nature 401 (6755), 788–791. doi:10.1038/44565
Leiserson, M. D. M., Vandin, F., Wu, H.-T., Dobson, J. R., Eldridge, J. V., Thomas, J. L., et al. (2015). Pan-cancer Network Analysis Identifies Combinations of Rare Somatic Mutations across Pathways and Protein Complexes. Nat. Genet. 47 (2), 106–114. doi:10.1038/ng.3168
Li, Y., and Li, J. (2012). Disease Gene Identification by Random Walk on Multigraphs Merging Heterogeneous Genomic and Phenotype Data. Paper presented at the BMC genomics 7 (Suppl. 7), S27. doi:10.1186/1471-2164-13-s7-s27
Li, Y., Schofield, E., and Gönen, M. (2019). A Tutorial on Dirichlet Process Mixture Modeling. J. Math. Psychol. 91, 128–144. doi:10.1016/j.jmp.2019.04.004
Liang, M., Li, Z., Chen, T., and Zeng, J. (2014). Integrative Data Analysis of Multi-Platform Cancer Data with a Multimodal Deep Learning Approach. Ieee/acm Trans. Comput. Biol. Bioinform 12 (4), 928–937. doi:10.1109/TCBB.2014.2377729
Liany, H., Jeyasekharan, A., and Rajan, V. (2020). Predicting Synthetic Lethal Interactions Using Heterogeneous Data Sources. Bioinformatics 36 (7), 2209–2216. doi:10.1093/bioinformatics/btz893
Lin, E., and Lane, H.-Y. (2017). Machine Learning and Systems Genomics Approaches for Multi-Omics Data. Biomark Res. 5 (1), 2. doi:10.1186/s40364-017-0082-y
Lin, W. M., Baker, A. C., Beroukhim, R., Winckler, W., Feng, W., Marmion, J. M., et al. (2008). Modeling Genomic Diversity and Tumor Dependency in Malignant Melanoma. Cancer Res. 68 (3), 664–673. doi:10.1158/0008-5472.can-07-2615
Liu, Y., Devescovi, V., Chen, S., and Nardini, C. (2013). Multilevel Omic Data Integration in Cancer Cell Lines: Advanced Annotation and Emergent Properties. BMC Syst. Biol. 7 (1), 14. doi:10.1186/1752-0509-7-14
Lock, E. F., and Dunson, D. B. (2013). Bayesian Consensus Clustering. Bioinformatics 29 (20), 2610–2616. doi:10.1093/bioinformatics/btt425
Louhimo, R., and Hautaniemi, S. (2011). CNAmet: an R Package for Integrating Copy Number, Methylation and Expression Data. Bioinformatics 27 (6), 887–888. doi:10.1093/bioinformatics/btr019
Ma, T., and Zhang, A. (2019). Integrate Multi-Omics Data with Biological Interaction Networks Using Multi-View Factorization AutoEncoder (MAE). BMC genomics 20 (11), 944–1011. doi:10.1186/s12864-019-6285-x
Ma, T., and Zhang, A. (2018). Affinity Network Fusion and Semi-supervised Learning for Cancer Patient Clustering. Methods 145, 16–24. doi:10.1016/j.ymeth.2018.05.020
MacEachern, S., and Müller, P. (2000). “Efficient MCMC Schemes for Robust Model Extensions Using Encompassing Dirichlet Process Mixture Models,” in Robust Bayesian Analysis (Springer), 295–315. doi:10.1007/978-1-4612-1306-2_16
Manzoni, C., Kia, D. A., Vandrovcova, J., Hardy, J., Wood, N. W., Lewis, P. A., et al. (2018). Genome, Transcriptome and Proteome: the Rise of Omics Data and Their Integration in Biomedical Sciences. Brief. Bioinformatics 19 (2), 286–302. doi:10.1093/bib/bbw114
Mariette, J., and Villa-Vialaneix, N. (2018). Unsupervised Multiple Kernel Learning for Heterogeneous Data Integration. Bioinformatics 34 (6), 1009–1015. doi:10.1093/bioinformatics/btx682
Meng, C., Basunia, A., Peters, B., Gholami, A. M., Kuster, B., and Culhane, A. C. (2019). MOGSA: Integrative Single Sample Gene-Set Analysis of Multiple Omics Data. Mol. Cel Proteomics 18 (8 Suppl. 1), S153–S168. doi:10.1074/mcp.TIR118.001251
Meng, C., Helm, D., Frejno, M., and Kuster, B. (2016). moCluster: Identifying Joint Patterns across Multiple Omics Data Sets. J. Proteome Res. 15 (3), 755–765. doi:10.1021/acs.jproteome.5b00824
Meng, C., Kuster, B., Culhane, A. C., and Gholami, A. M. (2014). A Multivariate Approach to the Integration of Multi-Omics Datasets. BMC bioinformatics 15 (1), 162. doi:10.1186/1471-2105-15-162
Min, E. J., and Long, Q. (2020). Sparse Multiple Co-inertia Analysis with Application to Integrative Analysis of Multi -Omics Data. BMC bioinformatics 21, 1–12. doi:10.1186/s12859-020-3455-4
Mitra, S., Hasanuzzaman, M., and Saha, S. (2020). A Unified Multi-View Clustering Algorithm Using Multi-Objective Optimization Coupled with Generative Model. ACM Trans. Knowl. Discov. Data 14 (1), 1–31. doi:10.1145/3365673
Mo, Q., Wang, S., Seshan, V. E., Olshen, A. B., Schultz, N., Sander, C., et al. (2013). Pattern Discovery and Cancer Gene Identification in Integrated Cancer Genomic Data. Proc. Natl. Acad. Sci. U.S.A. 110 (11), 4245–4250. doi:10.1073/pnas.1208949110
Nguyen, H., Shrestha, S., Draghici, S., and Nguyen, T. (2019). PINSPlus: a Tool for Tumor Subtype Discovery in Integrated Genomic Data. Bioinformatics 35 (16), 2843–2846. doi:10.1093/bioinformatics/bty1049
Nguyen, T., Tagett, R., Diaz, D., and Draghici, S. (2017). A Novel Approach for Data Integration and Disease Subtyping. Genome Res. 27 (12), 2025–2039. doi:10.1101/gr.215129.116
Nicora, G., Vitali, F., Dagliati, A., Geifman, N., and Bellazzi, R. (2020). Integrated Multi-Omics Analyses in Oncology: a Review of Machine Learning Methods and Tools. Front. Oncol. 10, 1030. doi:10.3389/fonc.2020.01030
O’Connell, M. J., and Lock, E. F. (2016). R. JIVE for Exploration of Multi-Source Molecular Data. Bioinformatics 32 (18), 2877–2879.
Ou-Yang, L., Lu, F., Zhang, Z. C., and Wu, M. (2022). Matrix Factorization for Biomedical Link Prediction and scRNA-Seq Data Imputation: an Empirical Survey. Brief Bioinform 23 (1), bbab479. doi:10.1093/bib/bbab479
Paull, E. O., Carlin, D. E., Niepel, M., Sorger, P. K., Haussler, D., and Stuart, J. M. (2013). Discovering Causal Pathways Linking Genomic Events to Transcriptional States Using Tied Diffusion through Interacting Events (TieDIE). Bioinformatics 29 (21), 2757–2764. doi:10.1093/bioinformatics/btt471
Pearl, J. (2014). Probabilistic Reasoning in Intelligent Systems: Networks of Plausible Inference. Elsevier.
Picart-Armada, S., Barrett, S. J., Willé, D. R., Perera-Lluna, A., Gutteridge, A., and Dessailly, B. H. (2019). Benchmarking Network Propagation Methods for Disease Gene Identification. Plos Comput. Biol. 15 (9), e1007276. doi:10.1371/journal.pcbi.1007276
Pierre-Jean, M., Deleuze, J.-F., Le Floch, E., and Mauger, F. (2020). Clustering and Variable Selection Evaluation of 13 Unsupervised Methods for Multi-Omics Data Integration. Brief. Bioinformatics 21 (6), 2011–2030. doi:10.1093/bib/bbz138
Plesingerova, H., Librova, Z., Plevova, K., Libra, A., Tichy, B., Skuhrova Francova, H., et al. (2017). COBLL1,LPLandZAP70expression Defines Prognostic Subgroups of Chronic Lymphocytic Leukemia Patients with High Accuracy and Correlates withIGHVmutational Status. Leuk. Lymphoma 58 (1), 70–79. doi:10.1080/10428194.2016.1180690
Qiu, Y., Ching, W. K., and Zou, Q. (2021). Prediction of RNA-Binding Protein and Alternative Splicing Event Associations during Epithelial-Mesenchymal Transition Based on Inductive Matrix Completion. Brief Bioinform 22 (5), bbaa440. doi:10.1093/bib/bbaa440
Rappoport, N., and Shamir, R. (2018). Multi-omic and Multi-View Clustering Algorithms: Review and Cancer Benchmark. Nucleic Acids Res. 46 (20), 10546–10562. doi:10.1093/nar/gky889
Rappoport, N., and Shamir, R. (2019). NEMO: Cancer Subtyping by Integration of Partial Multi-Omic Data. Bioinformatics 35 (18), 3348–3356. doi:10.1093/bioinformatics/btz058
Ray, P., Zheng, L., Lucas, J., and Carin, L. (2014). Bayesian Joint Analysis of Heterogeneous Genomics Data. Bioinformatics 30 (10), 1370–1376. doi:10.1093/bioinformatics/btu064
Rodrigues, R. R., Shulzhenko, N., and Morgun, A. (2018). “Transkingdom Networks: A Systems Biology Approach to Identify Causal Members of Host-Microbiota Interactions,” in Microbiome Analysis (Springer), 227–242. doi:10.1007/978-1-4939-8728-3_15
Ruan, P., Wang, Y., Shen, R., and Wang, S. (2019). Using Association Signal Annotations to Boost Similarity Network Fusion. Bioinformatics 35 (19), 3718–3726. doi:10.1093/bioinformatics/btz124
Sankaran, K., and Holmes, S. P. (2019). Multitable Methods for Microbiome Data Integration. Front. Genet. 10, 627. doi:10.3389/fgene.2019.00627
Savage, R. S., Ghahramani, Z., Griffin, J. E., De la Cruz, B. J., and Wild, D. L. (2010). Discovering Transcriptional Modules by Bayesian Data Integration. Bioinformatics 26 (12), i158–i167. doi:10.1093/bioinformatics/btq210
Scutari, M. (2009). Learning Bayesian Networks with the Bnlearn R Package. arXiv preprint arXiv:0908.3817.
Shen, R., Olshen, A. B., and Ladanyi, M. (2009). Integrative Clustering of Multiple Genomic Data Types Using a Joint Latent Variable Model with Application to Breast and Lung Cancer Subtype Analysis. Bioinformatics 25 (22), 2906–2912. doi:10.1093/bioinformatics/btp543
Shi, Q., Zhang, C., Peng, M., Yu, X., Zeng, T., Liu, J., et al. (2017). Pattern Fusion Analysis by Adaptive Alignment of Multiple Heterogeneous Omics Data. Bioinformatics 33 (17), 2706–2714. doi:10.1093/bioinformatics/btx176
Shoaie, S., Karlsson, F., Mardinoglu, A., Nookaew, I., Bordel, S., and Nielsen, J. (2013). Understanding the Interactions between Bacteria in the Human Gut through Metabolic Modeling. Sci. Rep. 3, 2532. doi:10.1038/srep02532
Sinkala, M., Mulder, N., and Martin, D. (2020). Machine Learning and Network Analyses Reveal Disease Subtypes of Pancreatic Cancer and Their Molecular Characteristics. Sci. Rep. 10 (1), 1212–1214. doi:10.1038/s41598-020-58290-2
Song, M., Greenbaum, J., Luttrell, J., Zhou, W., Wu, C., Shen, H., et al. (2020). A Review of Integrative Imputation for Multi-Omics Datasets. Front. Genet. 11, 570255. doi:10.3389/fgene.2020.570255
Speicher, N. K., and Pfeifer, N. (2015). Integrating Different Data Types by Regularized Unsupervised Multiple Kernel Learning with Application to Cancer Subtype Discovery. Bioinformatics 31 (12), i268–i275. doi:10.1093/bioinformatics/btv244
Sturm, D., Witt, H., Hovestadt, V., Khuong-Quang, D.-A., Jones, D. T. W., Konermann, C., et al. (2012). Hotspot Mutations in H3F3A and IDH1 Define Distinct Epigenetic and Biological Subgroups of Glioblastoma. Cancer cell 22 (4), 425–437. doi:10.1016/j.ccr.2012.08.024
Subramanian, I., Verma, S., Kumar, S., Jere, A., and Anamika, K. (2020). Multi-omics Data Integration, Interpretation, and its Application. Bioinform Biol. Insights 14, 1177932219899051. doi:10.1177/1177932219899051
Sun, S., Wong, T. S., Zhang, X. Q., Pu, J. K. S., Lee, N. P., Day, P. J. R., et al. (2012). Protein Alterations Associated with Temozolomide Resistance in Subclones of Human Glioblastoma Cell Lines. J. Neurooncol. 107 (1), 89–100. doi:10.1007/s11060-011-0729-8
Sun, Y. V., and Hu, Y.-J. (2016). Integrative Analysis of Multi-Omics Data for Discovery and Functional Studies of Complex Human Diseases. Adv. Genet. 93, 147–190. doi:10.1016/bs.adgen.2015.11.004
Tepeli, Y. I., Ünal, A. B., Akdemir, F. M., and Tastan, O. (2020). Pamogk: A Pathway Graph Kernel Based Multi-Omics Approach for Patient Clustering. Bioinformatics 36 (21), 5237–5246. doi:10.1093/bioinformatics/btaa655
Tipping, M. E., and Bishop, C. M. (1999). Probabilistic Principal Component Analysis. J. R. Stat. Soc B 61 (3), 611–622. doi:10.1111/1467-9868.00196
Tong, H., Faloutsos, C., and Pan, J.-Y. (2008). Random Walk with Restart: Fast Solutions and Applications. Knowl Inf. Syst. 14 (3), 327–346. doi:10.1007/s10115-007-0094-2
Tran, D., Nguyen, H., Le, U., Bebis, G., Luu, H. N., and Nguyen, T. (2020). A Novel Method for Cancer Subtyping and Risk Prediction Using Consensus Factor Analysis. Front. Oncol. 10, 1052. doi:10.3389/fonc.2020.01052
Valdeolivas, A., Tichit, L., Navarro, C., Perrin, S., Odelin, G., Levy, N., et al. (2019). Random Walk with Restart on Multiplex and Heterogeneous Biological Networks. Bioinformatics 35 (3), 497–505. doi:10.1093/bioinformatics/bty637
Vaske, C. J., Benz, S. C., Sanborn, J. Z., Earl, D., Szeto, C., Zhu, J., et al. (2010). Inference of Patient-specific Pathway Activities from Multi-Dimensional Cancer Genomics Data Using PARADIGM. Bioinformatics 26 (12), i237–i245. doi:10.1093/bioinformatics/btq182
Verstockt, B., Sudahakar, P., Creyns, B., Verstockt, S., Cremer, J., Wollants, W.-J., et al. (2019). DOP70 an Integrated Multi-Omics Biomarker Predicting Endoscopic Response in Ustekinumab Treated Patients with Crohn's Disease. J. Crohn's Colitis 13 (Suppl. ment_1), S072–S073. doi:10.1093/ecco-jcc/jjy222.104
Wang, B., Mezlini, A. M., Demir, F., Fiume, M., Tu, Z., Brudno, M., et al. (2014). Similarity Network Fusion for Aggregating Data Types on a Genomic Scale. Nat. Methods 11 (3), 333–337. doi:10.1038/nmeth.2810
Wang, D., Zhu, Y., Tang, J., Lian, Q., Luo, G., Wen, W., et al. (2019). Integrative Molecular Analysis of Metastatic Hepatocellular Carcinoma. BMC Med. Genomics 12 (1), 1–12. doi:10.1186/s12920-019-0586-4
Wang, K., Wang, J., Domeniconi, C., Zhang, X., and Yu, G. (2020). Differentiating Isoform Functions with Collaborative Matrix Factorization. Bioinformatics 36 (6), 1864–1871. doi:10.1093/bioinformatics/btz847
Wen, Y., Song, X., Yan, B., Yang, X., Wu, L., Leng, D., et al. (2021). Multi-dimensional Data Integration Algorithm Based on Random Walk with Restart. BMC bioinformatics 22 (1), 1–22. doi:10.1186/s12859-021-04029-3
Witten, D. M., and Tibshirani, R. J. (2009). Extensions of Sparse Canonical Correlation Analysis with Applications to Genomic Data. Stat. Appl. Genet. Mol. Biol. 8 (1), Article28. doi:10.2202/1544-6115.1470
Wu, D., Wang, D., Zhang, M. Q., and Gu, J. (2015). Fast Dimension Reduction and Integrative Clustering of Multi-Omics Data Using Low-Rank Approximation: Application to Cancer Molecular Classification. BMC genomics 16 (1), 1022. doi:10.1186/s12864-015-2223-8
Xu, H., Gao, L., Huang, M., and Duan, R. (2020). A Network Embedding Based Method for Partial Multi-Omics Integration in Cancer Subtyping. Methods.
Xu, T., Le, T. D., Liu, L., Wang, R., Sun, B., and Li, J. (2016). Identifying Cancer Subtypes from Mirna-Tf-Mrna Regulatory Networks and Expression Data. PloS one 11 (4), e0152792. doi:10.1371/journal.pone.0152792
Yan, K. K., Zhao, H., and Pang, H. (2017). A Comparison of Graph- and Kernel-Based -omics Data Integration Algorithms for Classifying Complex Traits. BMC bioinformatics 18 (1), 539. doi:10.1186/s12859-017-1982-4
Yang, B., Liu, S., Pang, S., Pang, C., and Shang, X. (2018). “Deep Subspace Similarity Fusion for the Prediction of Cancer Subtypes,” in Paper presented at the 2018 IEEE International Conference on Bioinformatics and Biomedicine (BIBM) (IEEE).
Yang, H., Chen, R., Li, D., and Wang, Z. (2021). Subtype-GAN: a Deep Learning Approach for Integrative Cancer Subtyping of Multi-Omics Data. Bioinformatics 18, btab109. doi:10.1093/bioinformatics/btab109
Yang, Z., and Michailidis, G. (2016). A Non-negative Matrix Factorization Method for Detecting Modules in Heterogeneous Omics Multi-Modal Data. Bioinformatics 32 (1), 1–8. doi:10.1093/bioinformatics/btv544
You, Z.-H., Yin, Z., Han, K., Huang, D.-S., and Zhou, X. (2010). A Semi-supervised Learning Approach to Predict Synthetic Genetic Interactions by Combining Functional and Topological Properties of Functional Gene Network. Bmc Bioinformatics 11 (1), 343. doi:10.1186/1471-2105-11-343
Yuan, Y., Qi, P., Xiang, W., Yanhui, L., Yu, L., and Qing, M. (2020). Multi-Omics Analysis Reveals Novel Subtypes and Driver Genes in Glioblastoma. Front. Genet. 11, 1449. doi:10.3389/fgene.2020.565341
Yuan, Y., Savage, R. S., and Markowetz, F. (2011). Patient-specific Data Fusion Defines Prognostic Cancer Subtypes. Plos Comput. Biol. 7 (10), e1002227. doi:10.1371/journal.pcbi.1002227
Zha, H., He, X., Ding, C., Gu, M., and Simon, H. (2001). Spectral Relaxation for K-Means Clustering. Adv. Neural Inf. Process. Syst. 14, 1057–1064.
Zhang, S., Liu, C.-C., Li, W., Shen, H., Laird, P. W., and Zhou, X. J. (2012). Discovery of Multi-Dimensional Modules by Integrative Analysis of Cancer Genomic Data. Nucleic Acids Res. 40 (19), 9379–9391. doi:10.1093/nar/gks725
Zhang, T., Zhang, S.-W., and Li, Y. (2021). Identifying Driver Genes for Individual Patients through Inductive Matrix Completion. Bioinformatics 37 (23), 4477–4484. doi:10.1093/bioinformatics/btab477
Zheng, M., Hu, Y., Gou, R., Wang, J., Nie, X., Li, X., et al. (2019). Integrated Multi-Omics Analysis of Genomics, Epigenomics, and Transcriptomics in Ovarian Carcinoma. Aging 11 (12), 4198–4215. doi:10.18632/aging.102047
Žitnik, M., and Zupan, B. (2014). Data Fusion by Matrix Factorization. IEEE Trans. pattern Anal. machine intelligence 37 (1), 41–53.
Žitnik, M., and Zupan, B. (2015). Gene Network Inference by Fusing Data from Diverse Distributions. Bioinformatics 31 (12), i230–9. doi:10.1093/bioinformatics/btv258
Keywords: multi-omics, unsupervised integration, data-ensemble, model-ensemble, sequential analysis, clustering method, network analysis
Citation: Vahabi N and Michailidis G (2022) Unsupervised Multi-Omics Data Integration Methods: A Comprehensive Review. Front. Genet. 13:854752. doi: 10.3389/fgene.2022.854752
Received: 14 January 2022; Accepted: 28 February 2022;
Published: 22 March 2022.
Edited by:
Gong Zhang, Jinan University, ChinaReviewed by:
Wanting Liu, Jinan University, ChinaMin Wu, Institute for Infocomm Research (A∗STAR), Singapore
Copyright © 2022 Vahabi and Michailidis. This is an open-access article distributed under the terms of the Creative Commons Attribution License (CC BY). The use, distribution or reproduction in other forums is permitted, provided the original author(s) and the copyright owner(s) are credited and that the original publication in this journal is cited, in accordance with accepted academic practice. No use, distribution or reproduction is permitted which does not comply with these terms.
*Correspondence: George Michailidis, Z21pY2hhaWxAdWZsLmVkdQ==