 Gh. Rasool Bhat
 Itty Sethi
 Bilal Rah
 Rakesh Kumar
 Dil Afroze
- 1Advanced Centre for Human Genetics, Sher-I- Kashmir Institute of Medical Sciences, Soura, India
- 2Institute of Human Genetics, University of Jammu, Jammu, India
- 3School of Biotechnology, Shri Mata Vaishno Devi University, Katra, India
Bioinformatics is an amalgamation of biology, mathematics and computer science. It is a science which gathers the information from biology in terms of molecules and applies the informatic techniques to the gathered information for understanding and organizing the data in a useful manner. With the help of bioinformatics, the experimental data generated is stored in several databases available online like nucleotide database, protein databases, GENBANK and others. The data stored in these databases is used as reference for experimental evaluation and validation. Till now several online tools have been developed to analyze the genomic, transcriptomic, proteomics, epigenomics and metabolomics data. Some of them include Human Splicing Finder (HSF), Exonic Splicing Enhancer Mutation taster, and others. A number of SNPs are observed in the non-coding, intronic regions and play a role in the regulation of genes, which may or may not directly impose an effect on the protein expression. Many mutations are thought to influence the splicing mechanism by affecting the existing splice sites or creating a new sites. To predict the effect of mutation (SNP) on splicing mechanism/signal, HSF was developed. Thus, the tool is helpful in predicting the effect of mutations on splicing signals and can provide data even for better understanding of the intronic mutations that can be further validated experimentally. Additionally, rapid advancement in proteomics have steered researchers to organize the study of protein structure, function, relationships, and dynamics in space and time. Thus the effective integration of all of these technological interventions will eventually lead to steering up of next-generation systems biology, which will provide valuable biological insights in the field of research, diagnostic, therapeutic and development of personalized medicine.
Introduction
The emergence of “innovative biology” is accompanied by the birth/innovation of other sciences, such as computational biology and bioinformatics, which have a combined interface of molecular biology. Due to the large datasets generated, its management and storage become critically important. Therefore, different databases came into existence, which organise a large amount of biological information stored and processed to permit the scientific community access (Ritchie et al., 2015). The increasing amount of data has been abetted by an increase in the number of biological databases (Pevsner, 2015). Usually public databases accumulate big amounts of information, and they are categorised into primary and secondary databases. The primary databases are composed of the findings of experimental data that are reported without any critical analysis related to previous publications (Luscombe et al., 2001; Prosdocimi, 2010). However, in the secondary databases, there is a collection and explication of data, called process of content curation. Besides various functional databases such as the Kyoto Encyclopedia of Genes and Genomes (KEGG) and Reactome that allow analysis and explanation of metabolic maps. Various primary databases like DNA Database of Japan (DDBJ), GenBank at the National Center for Biotechnology Information (NCBI), and European Molecular Biology Laboratory (EMBL) remained as the main databases of nucleotide sequences and proteins. International Nucleotide Sequence Database Collaboration (INSDC) being the parent organisation of these databases and sharing among each other the deposited information daily (Prosdocimi et al., 2002; Amaral et al., 2007; Pevsner, 2015).
Last 2 decades have witnessed great advancements in molecular biology, data analysis procedures were established at a fast pace to enable the interpretation of the large amount of information produced mainly by DNA sequencing technologies that produced the exponential amelioration of genomics, transcriptomics and proteomics information. Biological data of genomics/proteomics although considered to be the recent domains, have emerged interdependently and created a historical impact on the available information coupled with innovations in computational resources, resulted in huge biological data and data analysis that can enhance and intensify the developments in medical science (Verli, 2014). In the current modern times ‘-omics’ suffix include the genomics, transcriptomics, proteomics, phylogenomics, metabolomics and metagenomics, associated with large-scale biological data and the allied bioinformatics analysis. The emergence of newest high-throughput sequencing innovations, starting with improvements in Sanger sequencing, innovations in NGS technologies and next-generation proteomics, resulted in emergence of novel findings in the clinical settings (Zhou et al., 2010).
Genome-Wide Approach—From Genome to Proteome
DNA sequencing plays a crucial role in the progression of molecular biology, not only changing the genetic landscape of genome designs but also opening up new opportunities in therapeutic arena and personalised medicine
Genomics
Generally, Genomics is the domain that aims to uncover and explore structure, function, and innovative realm of genomes applying bioinformatics tools to explore sequenced genomes. (Altmann et al., 2012).
Paul Berg’s (Jackson et al., 1972), Frederick Sanger’s (Sanger and Coulson, 1975), and Walter Gilbert’s (Maxam and Gilbert, 1977) pioneering work on DNA sequencing enabled several developments, including the advances that opened up completely new potentials for DNA analysis, Sanger’s ‘chain-termination’ sequencing technology, more commonly known as Sanger sequencing (Sanger et al., 1977). Further technological advancements steered in the rise of DNA sequencing, led to the development of the first automated DNA sequencer (ABI PRISM AB370A) to be released in 1986, allowing drafting of the human genome to be completed during the next decade (Venter et al., 2001). These new methods are meant to supplement and eventually replace Sanger sequencing Figure 1. This technology is commonly known as next-generation sequencing (NGS) or massively parallel sequencing (MPS), which encompasses a wide range of methodologies. It is feasible to create huge amounts of data & each instrument runs in a faster and more cost-effective manner using this technology. The Next Generation Sequencing market is currently developing and expanding, with the world-wide market expected to reach 21.62 billion US dollars by 2025, up around 20% from 2017 (BCC Research, 2019). As a result, multiple brands are currently competing in this business, including BGI Genomics, Illumina, Ion Torrent (Thermo Fisher Scientific), PacBio and Oxford Nanopore Technologies etc. All of them provide distinct approaches to the same query: the generation of sequencing data. Second-generation sequencing relies on large parallel and clonal amplification of molecules (PCR, polymerase chain reaction) (Shendure and Ji, 2008), whereas third-generation sequencing depends on sequencing of single-molecules without a preceding clonal amplification (Schadt et al., 2010; van Dijk et al., 2018; Ameur et al., 2019). Although the process of NGS include various steps:
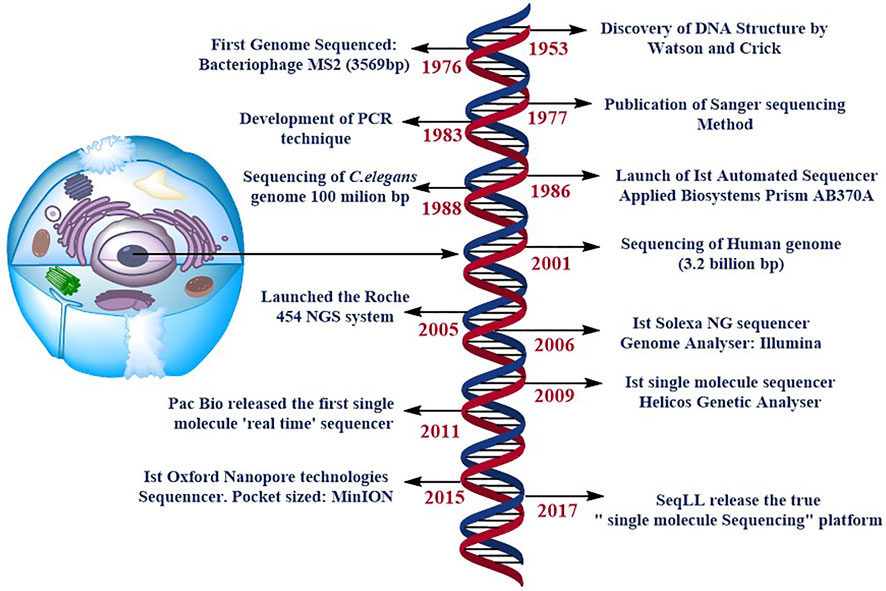
FIGURE 1. specifies the timeline of DNA sequencing. Some of the most significant and ground-breaking developments in DNA sequencing. NG stands for next generation, and PCR is for polymerase chain reaction. SMS stands for single molecule sequencing, and SeqLL stands for sequence the lower limit.
1) NGS library Preparation: A library comprises DNA/RNA fragments that denotes the full genome/transcriptome or a region of interest in next-generation sequencing. Each NGS platform has its own unique features, in general, the production of an NGS library begins with fragmentation of the DNA/RNA, followed by the connection of sequence adaptors to fragments to permit enrichment of those fragments. The sensitivity and specificity of a good library should be high. This implies that all relevant fragments should be properly represented in the library and that there should be no random errors (non-specific products). It is easier said than done, though, because genomic areas are not all equally susceptible to sequencing, making the creation of a sensitive and specialised library difficult and cumbersome (Aird et al., 2011).
2) NGS Platforms
Platforms for Second-Generation Sequencing
The category of cyclic-array sequencing technologies (Amaral et al., 2007) includes second-generation systems. The production and library amplification (made from RNA/DNA samples), clonal growth, sequencing, and investigation are all part of the core workflow for second-generation platforms. Ion Torrent and Illumina are the two most well-known sequencing firms for second-generation sequencing systems (Kircher et al., 2011; Quail et al., 2012).
3) Platforms for Third-Generation Sequencing:
The ability to avoid limitations of PCR-based methods, such as nucleotide misincorporation by a polymerase, formation of chimaera and drop-outs of alleles resulting in an false homozygosity call, was made possible by 3rd-generation NGS technology (Thompson and Steinmann, 2010). The Helicos Genetic Analysis System was the first commercial third-generation sequencer (Pushkarev et al., 2009). The Pacific Biosystems (PacBio RS II sequencer) established the notion of single-molecule real-time (SMRT) sequencing in 2011 (McCarthy, 2010). Furthermore, this method allows for the sequencing of lengthy reads (up to 30 kb on average). Individual DNA polymerases are coupled to zero-mode waveguide (ZMW) wells, which are nanoholes where a single DNA polymerase enzyme molecule can be put directly (McCarthy, 2010). PacBio has released the Sequel II System, which claims to cut project costs and timelines by up to 175 kb with highly accurate individual long reads (HiFi reads) compared to previous versions (Pereira et al., 2020).
Merker and co-workers demonstrated initially to use a PacBio System for sequencing of long-read genomes to find a pathogenic variant in Mendelian disease patients, indicating that this method has a lot of potential for identifying structural variation (Merker et al., 2018). The Chromium instrument, which uses gel beads in emulsion (GEMs) technology, was released by 10X Genomics in 2016 (Pereira et al., 2020). The benefit of GEMs technology is that it cuts down on time, beginning material, and prices (Zheng et al., 2016; Zheng et al., 2017; Pereira et al., 2020). With low false positives and high throughput, the chromium system can also perform single-cell genomic and transcriptional profiling, immunological profiling, and chromatin accessibility studies at single-cell resolution. As a result, intriguing new applications are emerging, particularly in the areas of epigenetics research, de novo genome assembly, and long sequencing reads (Delaneau et al., 2019; Laurentino et al., 2019; Wang et al., 2019).
4) Innovative Bioinformatics approach: Sequencing platforms are improving, and it is now possible to sequence the human genome in as little as a week or two. Thus, the huge data generated necessitates bioinformatics and computational expertise to organise, analyse, and infer NGS data. As a result, NGS bioinformatics is undergoing significant development, which can only be aided by improving computational capabilities (hardware) as well as algorithms and applications (software) to streamline all required steps: from processing of raw data to detailed data analysis and variant interpretation in a clinical setting.
Analysis of the NGS data: NGS bioinformatics is usually classified into three categories: primary, secondary, and tertiary analysis (Pereira et al., 2020).
The primary data analysis includes the identification and evaluation of raw data (signal analysis), the target of the generation of legible sequencing reads (base calling), and the estimation of base quality (Ledergerber and Dessimoz, 2011). This main analysis often produces a FASTQ file (Illumina) or an unmapped binary alignment map (uBAM) file (Ion Torrent).
Secondary analysis, which involves read alignment against the reference human genome (usually hg19 or hg38) and variant calling, is the next step in the NGS data analysis workflow.
Read alignment, which includes aligning sequenced fragments (processed data) against a reference genome, or de-novo assembly, which involves constructing a genome from basic without the use of external data, are two options for mapping sequencing reads. The availability or absence of a reference genome could be enough to decide between one technique and another. Nonetheless, reference sequence mapping is the preferred method for most NGS applications, particularly in clinical genetics (Flicek and Birney, 2009). However, de-novo assembly, on the other hand, is primarily limited to more focused tasks, such as correcting flaws in the reference genome and improving the detection of SV and other complicated rearrangements and newer findings (Ameur et al., 2018).
In the context of human clinical genetics, the third main phase of the NGS analysis pipeline addresses the essential issue of “making sense” or data interpretation, which requires finding the basic link between variant data and the observed phenotype in a patient. The tertiary analysis starts with variant annotation, which adds a fresh layer of data to predict the functional impact of all variants found during the variant calling procedure. Variant filtering, prioritisation, and data visualisation approaches are utilised after variant annotation. These procedures can be carried out utilising a number of software suites, which must be updated on a regular basis to reflect the most recent scientific findings, necessitating ongoing maintenance and development on the part of the developers. The generalised workflow of NGS is shown in Figure 2.
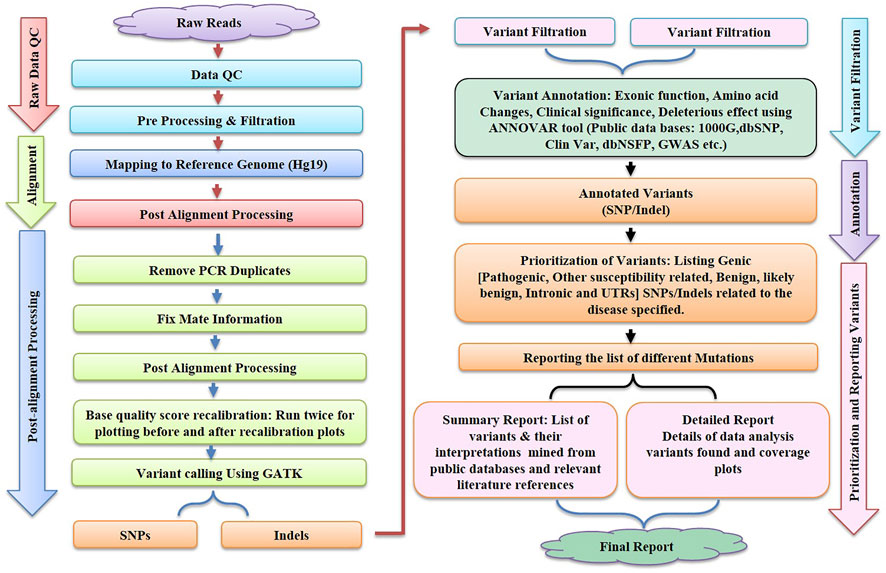
FIGURE 2. illustrates the various steps like Raw Data Quality Control, Alignment, Post Alignment Processing, Variant Filtration, Annotation and Reporting of variants involved in bioinformatics workflow for next-generation sequencing (NGS).
Variant annotation is a crucial first step in the assessment of sequencing variants. As previously indicated (Scherer et al., 2007), variant calling generates a VCF file. Each line in such a file contains high-level information about a variant, such as genomic position, reference, and alternate bases, but no information biological implications. Variant annotation provides biological context for all discovered variants. Data annotation is performed automatically due to the large amount of NGS data. For variant annotation, several programmes are currently available, each of which uses distinct approaches and databases such as Sorting Intolerant from Tolerant (SIFT), (Ng and Henikoff, 2003), PolyPhen-2, (Adzhubei et al., 2010), Combined Annotation Dependent Depletion (CADD) (Kircher et al., 2014) and Condel (González-Pérez and López-Bigas, 2011), compute the impact scores for each variant based on various specifications, such as sequence homology, conservation of amino acid residues, evolutionary conservation, structure of protein, or statistical prediction based on known mutations, are integrated into such annotation tools. Furthermore, annotation can be used to search disease variant databases like ClinVar and HGMD for information on their clinical associations. Annotate Variation (ANNOVAR) (Yang and Wang, 2015) variant effect predictor (VEP) (McLaren et al., 2010), Single Nucleotide polymorphism effect (snpEff) (Cingolani et al., 2012), and SeattleSeq (Ng et al., 2009) are the most extensively used annotation tools among the many available. SNPs, INDELs, and Copy Number Variation (CNVs) can all be found using ANNOVAR, a command-line tool. It compares variants and explicates the functional consequence of variants on genes and other genomic components (Wang et al., 2010a). The overall number of variants obtained after analysis of a VCF file from WES may range between 30,000 and 50,000. Filtering algorithms are required to find the variant(s) responsible for a particular disorder. Some more examples in Table 1. As a result, it is strongly advised to eliminate false-positive calls and variant call errors when beginning the third level of NGS analysis, depending on quality parameters or prior knowledge of artefacts. The population frequency filter is one of the most widely used NGS filters. One of the filter based on allele frequency is minor allele frequency (MAF), which can sort variations into different categories: uncommon variants (MAF 0.5, usually picked for Mendelian illnesses), low frequency variants (minor allele frequency between 0.5 and 5%), and common variants (MAF >5%) (Consortium et al., 2010). It not only aids in better identifying disease alleles, but also in understanding population migrations, relationships, origins, admixtures, and population size changes, which may be useful in understanding various disease patterns (Stoneking and Krause, 2011). The most extensively utilised databases are the 1,000 genome project (Siva, 2008), Exome Aggregation Consortium (ExAC) (Lek et al., 2016), and the Genome Aggregation Database (gnomAD; http://gnomad.broadinstitute.org/). This filter, however, has limits and may result in incorrect exclusion.
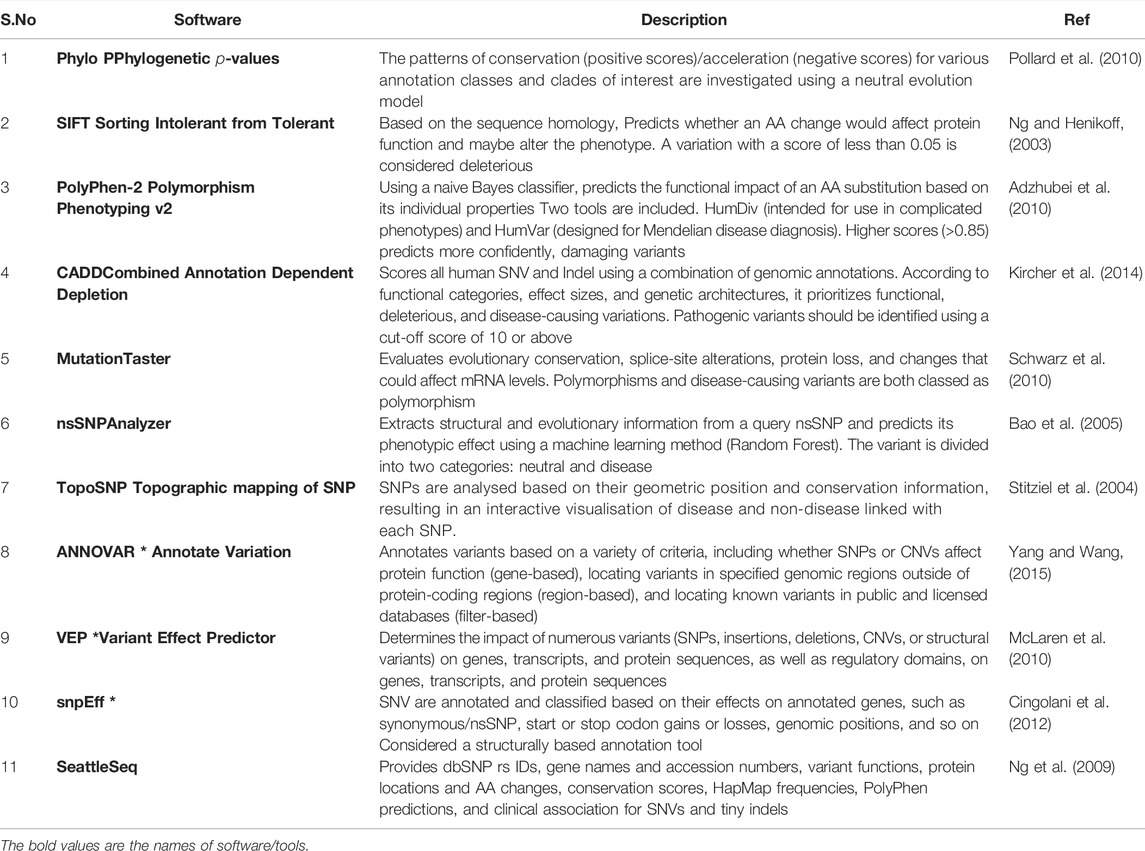
TABLE 1. Demonstrates a list of commonly used tools for performing an NGS functional filter, along with examples.
Even though, functional annotation offers a significant information for filtering, the most critical question to answer, especially in the context of gene discovery, is whether a given variant or mutant gene the disease-causing gene? What is its frequency in different population sets studied globally? To solve this difficult issue, a new generation of tools is being created that, rather than just omitting information, rate variants and allow them to be prioritised. (MacArthur et al., 2012; Lelieveld et al., 2016; Harper, 2017). Various ways have been suggested e.g. PHIVE investigates the similarities between human illness phenotypes and those derived from animal model organism knockout experiments (Robinson et al., 2014). While other methods try to handle the problem in a novel way, by computing a lethal score (also known as burden score) for each gene using data from population variation databases (Eilbeck et al., 2017).
Phevor, which uses data from other relevant ontologies, such as gene ontology (GO), to advocate novel gene–disease connections, can also be employed for the identification of novel genes (Singleton et al., 2014). The fundamental purpose of these tools is to provide a small number of variants that can be validated using molecular techniques (Pereira et al., 2019a; Pereira et al., 2019b). VarSeq/VSClinical (Golden Helix), Ingenuity Variant Analysis (Qiagen), Alamut® software (interactive biosoftware), and VarElect have all recently been developed commercial softwares for the elucidation and prioritisation of variants in a clinical context, to be used by clinicians, geneticists, and researchers (Stelzer et al., 2016). Apart from the tools that aid in variant analysis and elucidation, clinicians now have access to medical genetics firms like Invitae (https://www.invitae.com/en/) and CENTOGENE (https://www.centogene.com/) that provide a precise medical diagnosis.
5) Third generation sequencing technologies has the capability of sequencing single molecules with average read lengths of >10,000bp -100,000bp or even more. The advent of this technology has eliminated the requirement of amplification of DNA (PCR) and it provides real time results (Pereira et al., 2020). The third-generation sequencing services are provided by Pacific Biosciences (PacBio) that utilizes the single molecule real time (SMRT) platform and fluorescent nucleotide detection methodology. Oxford Nanopore Technologies (Minion) which utilizes the nanopore methodology where an ionic current passes through the flow cell and nucleotides bases are determined by the changes they produce in the current respectively when pass through the nanopores. (Xiao and Zhou, 2020).
The bioinformatic tools required to analyze the data obtained from the third-generation sequencing technologies needs to be more specific and error prone. Some tools are depicted in Table 2.
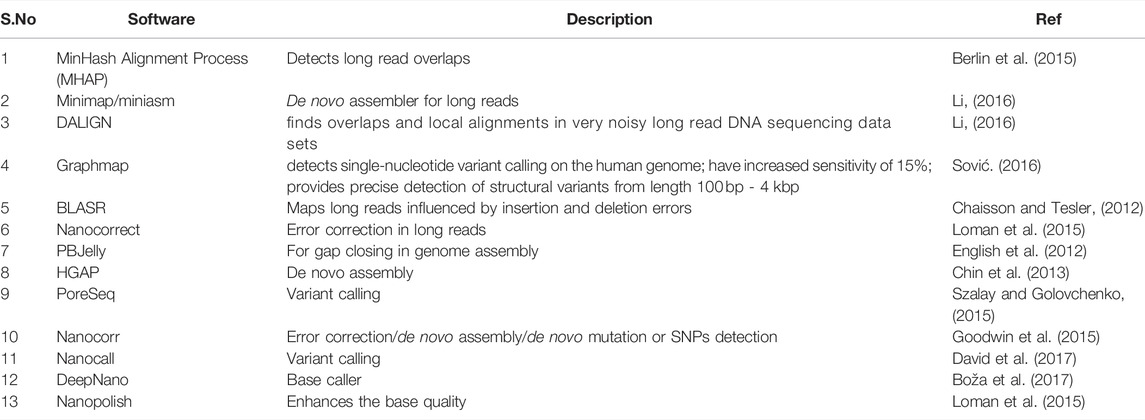
TABLE 2. Demonstrates various software used in third generation sequencing.
Limitations: Although Third generation sequencing technology is fast and provide real time result however still NGS are preferred as the error rate is less in NGS as compared to third generation sequencing which is ∼15%. Due to this high error rate, the technology can miss the detection of SNPs/point mutations and not best suited for mutational analyses. The methodology requires improvement. Moreover, there is need to develop more bioinformatic tools and algorithms for the downstream data analyses that is again a challenge for researchers for the time being (Ozsolak, 2012).
Transcriptomics
cDNA sequencing or RNA-seq when compared to other methods allows for more accurate mapping of reads and quantification at the transcript level. Differential expression analysis and identification of isoforms due to mRNA splicing, NGS of Small non-coding RNA as well as the discovery and characterisation of novel transcripts, are examples of high throughput applications (Marioni et al., 2008; Wang, 2009; Montgomery et al., 2010).
Small non-coding RNA NGS: A significant increase has been seen in the research community related to biomarkers which aids in the prediction, early detection and prevention of the disease. The biomarkers research helps the scientific and clinical community significantly in improving the clinical outcomes (Lopez et al., 2015). Non-coding RNAs (ncRNAs) have become the biomarker hotspot of the research interest in the field of disease identification and treatment. MicroRNAs (miRNAs) are the type of ncRNAs which are mostly explored for their potential biomarker role (Lopez et al., 2015). Till date ncRNA studies have been performed mainly by qRT-PCR, in situ hybridization, or microarray techniques. NGS has opened a new way to analyze/detect the RNA molecules present in the biological samples. NGS tenders several methodological advantages over other technologies like increased throughput, decreased RNA input, good consistency and quality of data, higher detection depth, analysis of all RNA populations, and discovery of novel molecules (Liu et al., 2021). A typical RNA-sequencing experiment consists of the following steps:
Thus all the above possibilities have allowed us to learn more about the genome’s organisation, the molecular constituents of cells and tissues, and the complexities of regulatory systems (Zhou et al., 2010; Sims et al., 2014). Many investigations, both fundamental and applied, have focused on mRNA splicing. Between the transcriptional and translational level, splicing occurs in every eukaryotic cell. Pre-mRNA transcripts may be variably spliced depending on location of tissue and/or stage of development, allowing multiple transcripts to be generated and hence distinct proteins to be made from the same gene (Burge et al., 1999; Nilsen, 2003). The divergence of splice site sequences from the prototypes has been linked to the generation of alternative transcripts. Furthermore, in most introns of higher eukaryotes, these extremely degraded motifs may be observed. Pseudo-exons are intronic sequences of standard exon size that outnumber real exons and are flanked by sequences that fit the exon’s 5′ and 3′ splicing signal requirements, but are never recognized as proper exons by the spliceosome. To distinguish true exons and splice sites from pseudo exons, splicing machinery must rely on auxiliary sequence features such as intronic and exonic cis-elements (Jacob and Gallinaro, 1989).
Exonic Splicing Enhancers (ESEs) are the most researched and well explored among them. They’re nucleotide sequences of short length that are primarily targeted by Serine/Argine-rich (SR) proteins, which then help to define exons (Blencowe, 2000). Exonic Splicing Silencers (ESSs), on the other hand, assist the spliceosome in neglecting pseudo exons and decoy splice sites. They serve as binding sites for exon exclusion-promoting proteins (mostly hnRNP proteins) (Zhu et al., 2001). Several bioinformatics approaches have been created and are now accessible to examine or predict splice signals (Zhang et al., 2005). One of the most essential bioinformatics tools is HSF (Human Splice Finder). For administration of data, designing of algorithm and online interface, HSF was built with the 4D package (4D S.A.). The HSF database was created with all human genes containing introns and exons. It was created using an Ensembl dataset that included about 22 000 genes and 46 000 transcripts from Homo sapiens. Because matrices and methods were specifically built for the human genome, the HSF database exclusively contains human genes (Flicek et al., 2008). HSF also has data taken from the Ensembl Variation Database (EVD), which can be used to investigate the impact of SNPs on splicing. A Perl script was written utilizing the Ensembl Perl API to allow HSF to access the EVD directly and get SNPs in human genes. Because matrices and methods were specifically built for the human genome, the HSF database exclusively contains human genes (Flicek et al., 2008).
On the other hand, Exonic splicing enhancers (ESEs) can be disrupted by nonsense, missense, and even translationally silent mutations, causing the splicing machinery to skip the mutant exon with significant consequences on gene structure. The frequency of mutations, whose major consequence is unusual splicing has been significantly underestimated because the effects of mutations are most often predicted purely based on information of genomic sequence (Cartegni et al., 2002). ESEs are found in both alternative and constitutive exons, where they serve as binding sites for Ser/Arg-rich proteins (SR proteins), a family of conserved splicing factors involved in a variety of splicing stages (Graveley, 2000). Through their RNA-binding domain, SR proteins promote exon definition by attracting spliceosomal components via protein–protein interactions facilitated by their RS domain and/or antagonizing the function of surrounding splicing silencers. Multiple categories of ESE consensus motifs have been described, and different SR proteins have varying substrate specificities (Graveley, 2000; Cartegni et al., 2002; Fairbrother et al., 2002). Using weight matrices for four different human SR proteins, ESE finder searches query sequences for potential ESEs. The matrices are based on frequency values produced from the alignment of winning sequences obtained through functional SELEX studies, corrected for the background nucleotide frequency of the initial SELEX library, which was created using chemical synthesis (Liu et al., 1998; Liu et al., 2000). The query sequences can be entered directly into the input box or submitted as a text file. Multiple sequences can be processed at the same time if they are preceded by a FASTA-format description line (starting with ‘>’). Despite the fact that ESEfinder is a tool for RNA analysis, it only accepts normal DNA nomenclature (A, C, G, and T, not U). Any character other than the letters A, C, G, and T, as well as spaces and paragraph breaks, will be ignored by the programme. Although both upper and lower case are acceptable, the output lines will be written in upper case. The user can choose from one to four matrices to be used at the same time. The result for each matrix is a series of 1 ntd incremented scores. Only the ‘hits’ or ‘high score motifs’ are displayed in the initial output window, Figure 3 which include the position of the first nucleotide, the motif match sequence, and the calculated score. When a score exceeds the threshold value set in the input page, it is deemed a high score.
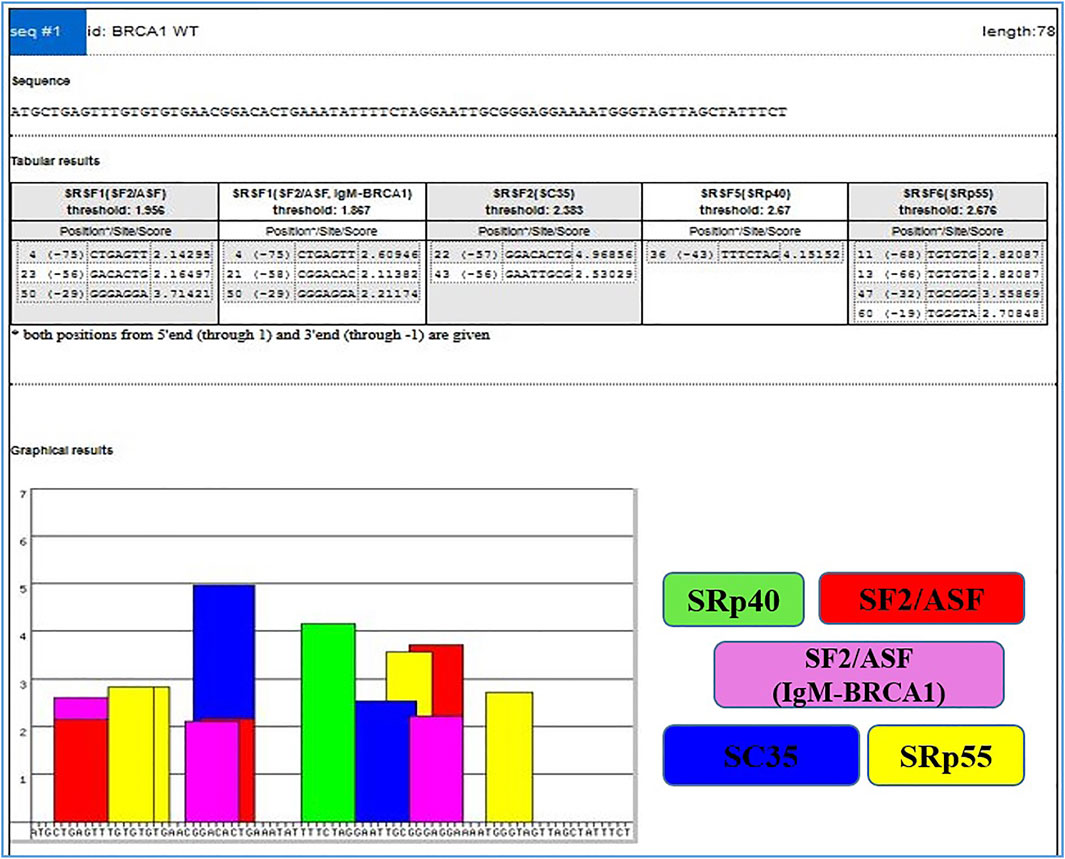
FIGURE 3. Output window with complete list of scores. High scores are represented as color-coded bars. The height of each bar indicates the score value (motif score), and its width and placement on the x-axis represent the length of the motif (6–8 nt) and its position along the sequence.
By choosing the ‘custom’ button and entering the required value into the box, any score can be used as the cutoff threshold. As a result, ESEfinder may be used to identify potential ESEs, and the prime application is the accurate interpretation of the impact of disease-associated variants. It has been previously demonstrated that ESEs predicted by this matrix-based method cluster in places where natural enhancers have been empirically localized and are more common in exons than in introns (Cartegni et al., 2003).
CircRNAs: In contrast to messenger RNAs, circular RNAs (circRNAs) are physiologically active nucleic acid molecules that occur in closed loop RNA forms and do not have polyadenylated tails. CircRNAs are classified as non-coding RNA (ncRNA), yet some circRNAs have the ability to code for proteins. CircRNAs were originally discovered and identified in plant viroids in the 1970s, and then in the cytoplasm of eukaryotic cells in the 1980s. Due to the prevalence of linear RNAs, early development in this field was likely modest, and circRNAs were thought to be a consequence of RNA splicing. Recent advancements in next-generation sequencing and related bioinformatics technologies, on the other hand, have speed up research in humans, mice, nematodes, plants, and archaea have all been found to have these compounds (Chen et al., 2021). Various tools employed for the analysis of circRNAs are summarized in Table 3, below.
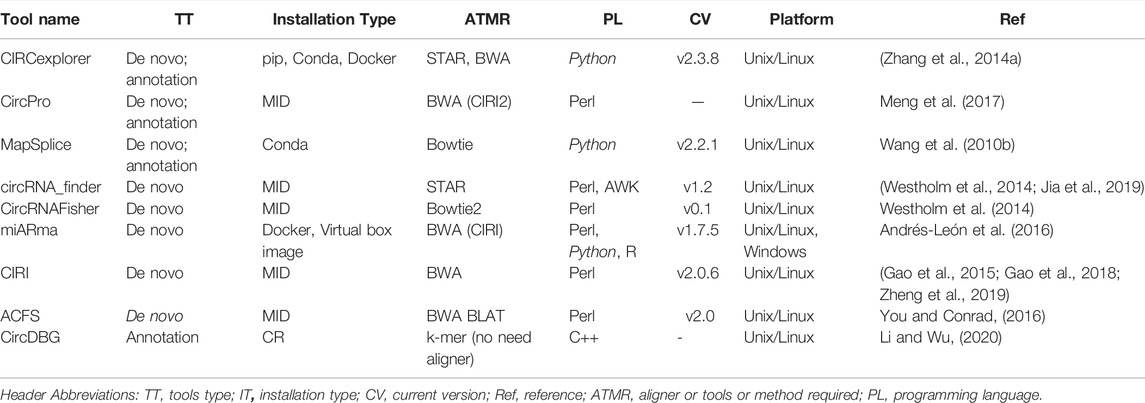
TABLE 3. Showing the various bioinformatic software tools used in circRNAs analysis.
Proteomics
Understanding the molecular processes that mediate cellular physiology requires the identification, quantification, and characterization of a cell’s whole protein content (Schmidt et al., 2014; Jensen et al., 2006). A rapid advancement in proteomics has steered the researchers to organize the study of protein structure, function, relationships, and dynamics in space and time. The groundbreaking revelation that DNA contains all of the genetic instruction required to build an organism gave rise to molecular biology’s central dogma, which characterized a one-way flow of information from DNA to RNA to Proteins. This belief has been debunked by recent discoveries. Epigenetic markings, alternative splicing, non-coding RNAs (including microRNAs), protein–protein interaction (PPI) networks, and post-translational modifications (PTMs) are only a few examples of how genotype and phenotype are not solely determined by information on the genome (Nagaraj et al., 2011; Beck et al., 2011; Baker, 2012). Proteomics is the global study of proteins, which are the key functional entities in the cell. This analysis is arguably the most important level of information required to understand how cells work. When compared to data collection at the genomic and transcriptomic levels, the proteomic data acquisition has proven difficult. Global protein analysis is a difficult analytical task, in part because amino acids, the building blocks of proteins, have such a wide range of physicochemical properties. Furthermore, in comparison to the genome, the proteome is enriched by alternative splicing and a wide range of protein modifications and degradation, and the complexity is heightened by the interconnectivity of proteins into complexes and signaling networks that are highly divergent in time and space Figure 4 (Cox and Mann, 2011). A decade ago, sequencing and identifying a single protein was a big problem; however, today’s high-throughput technology allows for the identification and quantification of essentially all expressed proteins in a single experiment. Similarly, 10 years ago, MS-based phosphoproteomics could only identify a few hundred phosphosites, whereas currently more than 30,000 phosphosites can be quantitatively monitored. This current method is referred to as “next-generation proteomics” to reflect its ability to characterize practically the whole proteome as a result of advancement in technology. Proteomics technologies, particularly MS-based Protein identification has advanced tremendously in recent years as a result of cumulative technological breakthroughs in instrumentation, sample preparation and computational analysis (Ficarro et al., 2002; Lemeer and Heck, 2009; Lundby et al., 2012).
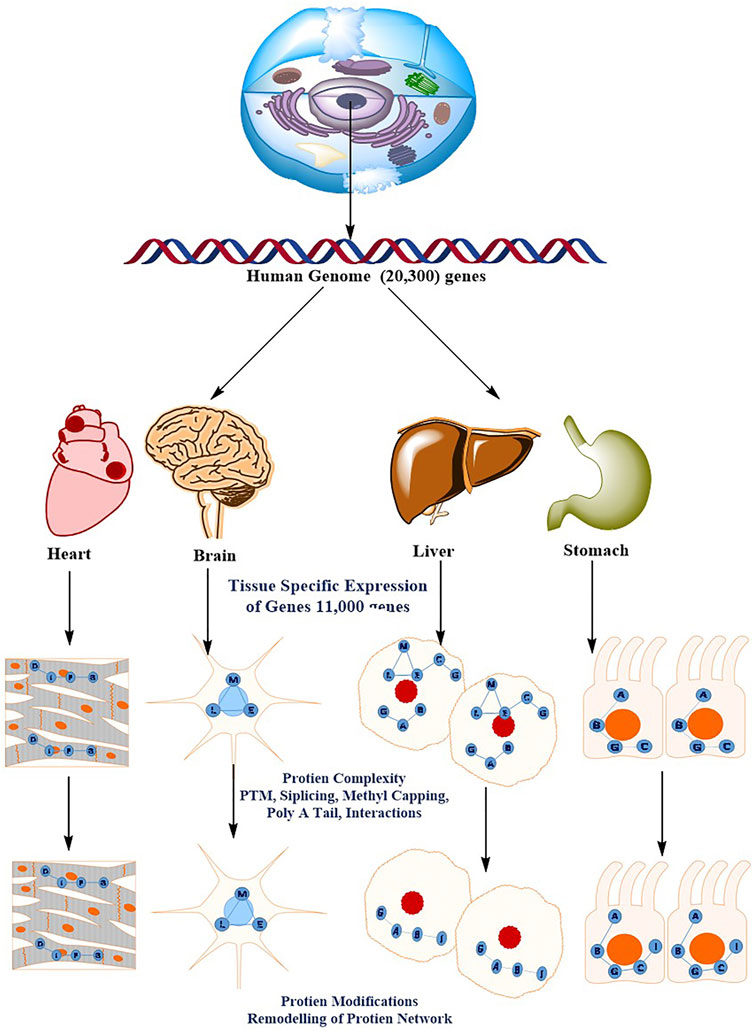
FIGURE 4. The diverse and dynamic methods of proteome regulation give the human genome a higher level of complexity. There are roughly 20,300 genes in the human genome. The molecular basis of the cellular phenotype (that is, the tissue cell types) is determined by the specific expression of a subset of the genome (11,000 genes). The sophisticated methods of protein regulation, such as splicing variations PTMs, post-translational modifications; PPIs, protein–protein interactions, and subcellular localization, acquire a considerably higher order of complexity. This results in tissue- and organelle-specific protein networks that respond to perturbations differently throughout time (for example, ageing or drug treatment).
Proteomics using mass spectrometry (MS) generates a large quantity of information about the expression, post-translational modifications (PTMs), and interactions among thousands of proteins. The obtained data must be supplied to the scientific community in a format that is both suitable and curated, as well as retrievable and interpretable. Proteomics data will be made freely available to the public, ensuring that quality standards are maintained in the area. The long-term storage of unprocessed raw data is a first level of distribution for proteomics data. Understanding the proteome’s complex and dynamic interactions necessitates the creation of physical interaction charts.
Proteins frequently interact with one another in stable or transient multi-protein complexes of varying composition, with the human interactome containing an estimated 130,000 binary interactions, the majority of which have yet to be mapped. Proteins can also interact with other molecules like RNA, DNA and metabolites. These complexes play crucial roles in regulatory processes, signalling cascades, cellular functions, and their inability to interact can result in their function being lost (Altelaar et al., 2012; Ma and Johnson, 2012). Tranche is one of the few public repositories that can manage this type of data at the moment, and it is based on an encrypted peer-to-peer system that stores data in numerous servers across the world. Raw data, on the other hand, is in a closed format, which makes it difficult to share. As a result, attempts are being undertaken to standardise formats that preserve all necessary information (Smith et al., 2011). The European Bioinformatics Institute’s PRIDE database exhibits this determination, as it enables the for the storage of both conventional MS data formats (XML) and associated peptide and protein identifications. Furthermore, including additional data (such as species, fragmentation procedures, and proteases) allows for a global meta-analysis of proteomic data sets (Perez-Riverol et al., 2019).
Moreover, Protein sequence alignment compares two or more than two sequences and aids in the identification of homologous regions, visualizing the relationship among sequences with respect to evolution and structure. It plays a crucial role in bioinformatics and helps in the query and construction of databases, prediction of protein’s primary, secondary and tertiary structure and biological function and many more. Many platforms are developed to analyse the sequence alignment. Some of them are PROSITE, Pfam, BLAST, FASTA, Clustal omega, T-Coffee, MUSCA, ALIGN, DIALIGN, ProbCons, HMMER3 phmmer and many more (Pruess and Apweiler, 2003; Sievers et al., 2011; Singh et al., 2016a).
Protein structure prediction can be done using the ProtParam tool from ExPasy (Expert Protein analysis system) (Gasteiger et al., 2005). It helps in the primary structure prediction of protein and aids in the computation of physicochemical properties of a given protein. The parameters that can be computed include molecular weight, amino acid and atomic composition, isoelectric point, estimated half-life, grand average of hydropathicity (GRAVY) and more. To predict the secondary structure, many tools have been developed till now including Chow-Fasman algorithim—a statistical approach which is based on calculation of statistical propensities of each residuum to form an α-helix or β-strand, GOR, Jpred, etc. Similarly, for tertiary protein structure prediction, PHYRE2 (Protein Homology/analogY Recognition Engine) (Kelley et al., 2015) and I-TASSER are available (Yang et al., 2015).
Apart from above mentioned software suits, there are other tools which are helpful in addressing protein analysis. Some of them are mentioned in Table 4.
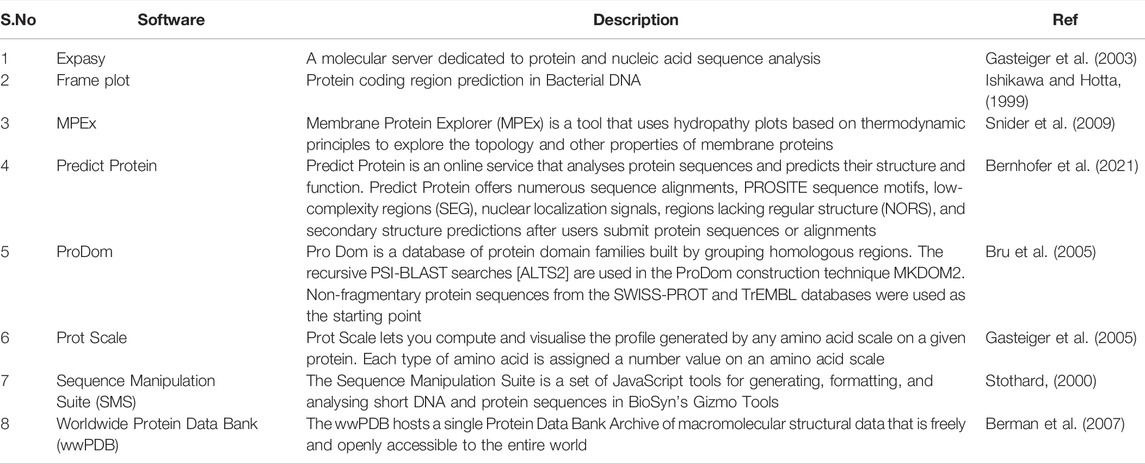
TABLE 4. Demonstrates the Protein sequence analysis tool.
To study the post-translational modifications, tools like GlycoMod (Cooper et al., 2001), NetPhos (Trost and Kusalik, 2011), NetPicoRNA (Smits et al., 2013), FindMod (Gasteiger et al., 2003), ScanProsite (De Castro et al., 2006) and others are available online. For protein interaction analyses STRING can be used (Szklarczyk et al., 2021). To visualize the 3-D structure of proteins, tools like Pymol and Jmol can be used. Pymol is also used to visualize the protein-ligand docking, binding site prediction, protein interactions and others (DeLano, 2002; Herráez, 2006).
The identification of protein biomarkers with prognostic or diagnostic significance is one of the most difficult applications of proteomics right now Figure 5.
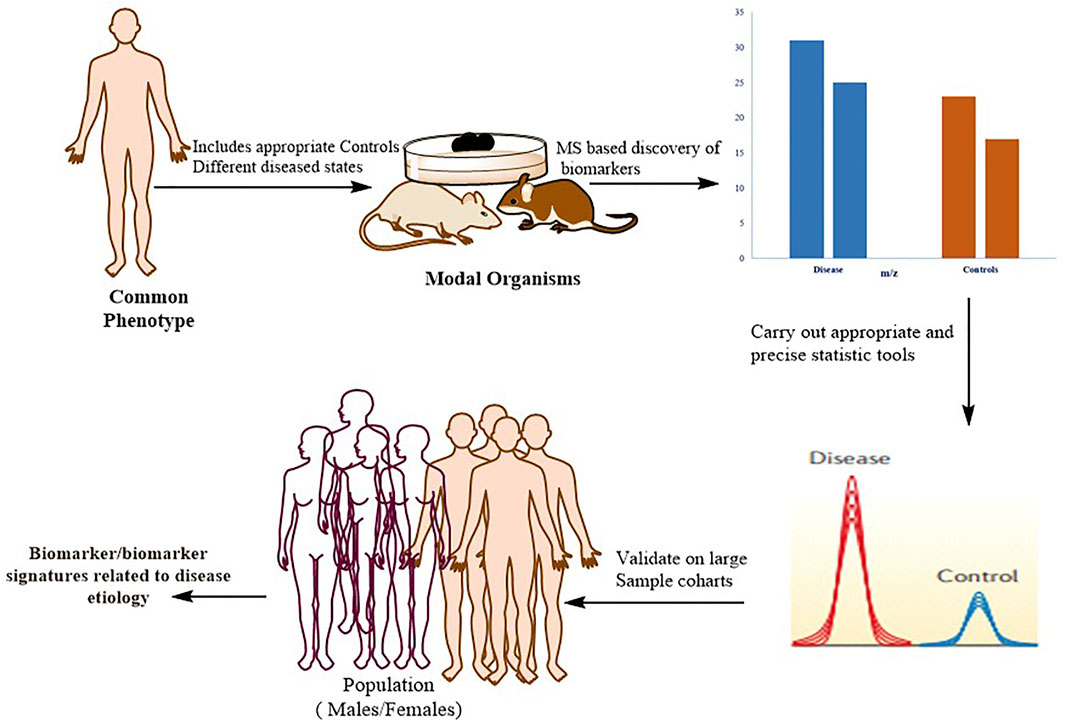
FIGURE 5. Typical workflow for identifying, validating, and stratifying protein-based biomarker signatures. Proteomics based on mass spectrometry (MS) is utilized for in-depth quantitative characterization of a disease model’s proteome and its appropriate control mechanisms. Following the application of strict statistics, a list of candidate proteins that can be used as a phenotypic signature is defined. These markers are verified in large patient cohorts using more specific methodologies, such as MS-based (for example, selective reaction monitoring (SRM)) or antibody-based approaches. To confirm that the biomarker has a direct mechanistic involvement in the disease, the biological connections between the signature proteins and the disease phenotype should be biochemically confirmed.
As previously mentioned, recent technical advancements have resulted in the development of comprehensive pipelines that incorporate the discovery and validation phases, allowing plasma biomarkers to be identified for many diseases (Addona et al., 2011; Whiteaker et al., 2011). Despite the introduction of some successful biomarkers for clinical application, many (if not most) claimed biomarkers have weak reliability or lack rigorous confirmation, leading to scepticism among clinicians. The lack of proper controls in the discovery phase, the use of appropriate statistical tools for biomarker definition, and the need for independent validation steps in large patient cohorts to certify the legitimacy of the biomarker unambiguously are the primary flaws in many biomarker studies; such flaws lead to claimed biomarkers that are rarely directly related to disease biology (Poste, 2011).
Metabolomics: Beacon for the 21st Century
After genomics, transcriptomics and proteomics, metabolomics is the innovative & newest of the “omics” sciences, combining high-throughput analytical techniques with bioinformatics. It is concerned with the quantitative and qualitative evaluation of metabolites, which are key metabolic intermediates and end products (Zhang et al., 2014b). The purpose of this scientific method is not only to figure out what pathological processes or disturbances are at the root of a specific disease entity, but also to anticipate how those conditions will respond to treatment interventions. Metabolomic analysis help discriminate between normal and abnormal pathways, which aids in disease diagnosis and prognosis prediction (Zhang et al., 2015). The potential of the metabolome to reflect environmental effects and to provide a snapshot of the individual’s pathophysiological status at a certain point in time is a noteworthy benefit of the metabolome over the genome (Shah et al., 2015; Zhang et al., 2015). The prime concern of the researchers/clinicians is the better understanding of the disrupted biochemical and pathological processes, as well as to inform the creation of more effective therapeutic medicines for the treatment of those illness states in humans. Metabolomic tools have the benefits of being quick, inexpensive, and sensitive. Metabolomics can be studied using a variety of techniques, including mass spectrometry (MS), nuclear magnetic resonance (NMR) spectroscopy, and Fourier-transform infrared (FTIR) spectroscopy. Metabolomic fingerprinting, metabolic profiling, metabolic footprinting, target analysis, and flux analysis are examples of such methods that all play important roles in understanding toxicological mechanisms and disease processes in live organisms (Tripathi et al., 2013; Zhang et al., 2013; Zhang et al., 2014b). Metabolomics is also critical in discovering new drugs, biomarkers for early disease diagnosis, such as rheumatoid or osteoarthritis (Carlson et al., 2018; Takahashi et al., 2019; Dudka et al., 2021), osteoporosis, cardiovascular disease, and Alzheimer’s disease (AD), cancer prognosis, diagnosis, and treatment (Pushkarev et al., 2009; McCarthy, 2010; Thompson and Steinmann, 2010; Kircher et al., 2011; Quail et al., 2012; Zheng et al., 2016; Zheng et al., 2017; Merker et al., 2018; Pereira et al., 2020), inborn errors of metabolism (IEM) and a variety of other applications (Carlson et al., 2018).
Pharmacogenomics/Pharmacogenetics: in-Silico Approach
Pharmacogenomics is described as the study of genes and how medications alter an individual’s reaction. Pharmacogenomics is an emerging new discipline of science that combines pharmacology (the branch of science that studies drugs) with genomics (the branch of science that studies genes) to generate effective doses and safe pharmaceuticals tailored to an individual patient’s genetic makeup. One of the most important programs in which researchers are building and learning about genetic relationships and their impact on the body’s reaction to drugs is the Human Genome Project. Differences in genetic makeup influence pharmaceutical effectiveness, making it possible to anticipate medication effectiveness for an individual and investigate the presence of adverse drug reactions in the future (Caldwell et al., 2007).
Because of the wide range of individual responses to drug therapy, predicting the degree of effectiveness of a medication for a certain patient is difficult. Along with these clinical aspects, pharmacological factors such as variations in metabolism, drug distribution, and drug directed proteins play a significant role (Wattanachai et al., 2017). Table 5 describes various softwares employed in addressing Pharmacogenomics.
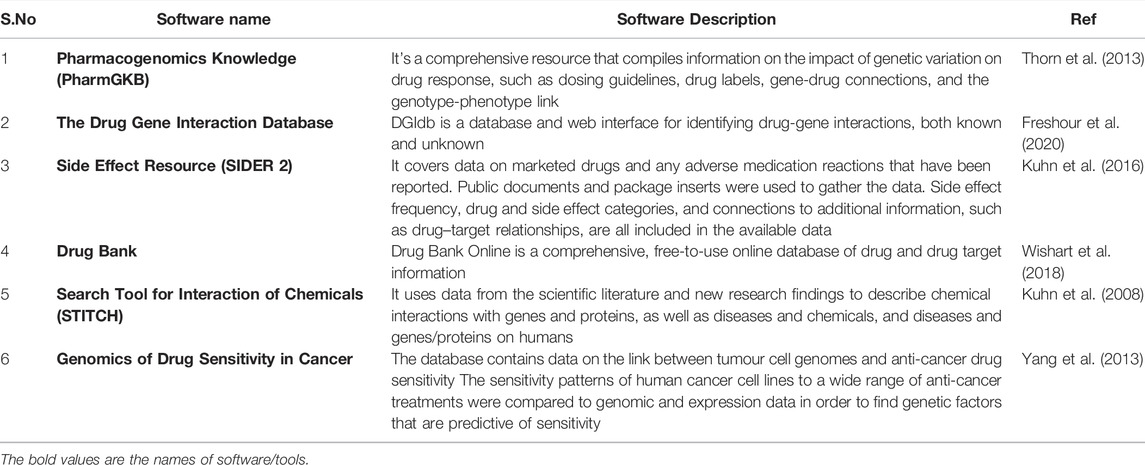
TABLE 5. Demonstrates various in silico approaches used in Pharmacogenomics.
Epigenomics—complex diseases: An enigma
Understanding the causes and mechanisms of complex non-Mendelian diseases remains a major issue and point of concern, despite substantial effort. Despite the fact that various molecular genetic linkage and association studies have been carried out in order to explain the heritable tendency to complicated disorders, the results are sometimes inconclusive and even contentious. Similarly, determining the environmental factors that cause a disorder is difficult (Singh Nanda et al., 2016). The emphasis is switched to epigenetic misregulation as a primary etiopathogenic element, which presents a novel interpretation of the paradigm of “genes plus environment”.
Various non-Mendelian irregularities of complex diseases, such as the presence of clinically indistinguishable sporadic and familial cases, sexual dimorphism, relatively late age of onset and peaks of susceptibility to some diseases, discordance of monozygotic twins, and major fluctuations on the course of disease severity, are consistent with epigenetic mechanisms. It is also been claimed that stochastic epigenetic processes in the cell may account for a significant percentage of phenotypic diversity formerly attributed to environmental factors. It is proposed that using epigenetic strategies in conjunction with traditional genetic strategies can greatly speed up the finding of etiopathogenic processes in complicated disorders (Lacal and Ventura, 2018). Epigenetic microarray technologies and in silico approaches will considerably enhance epigenetic investigations in complicated disorders as shown in Table 6.
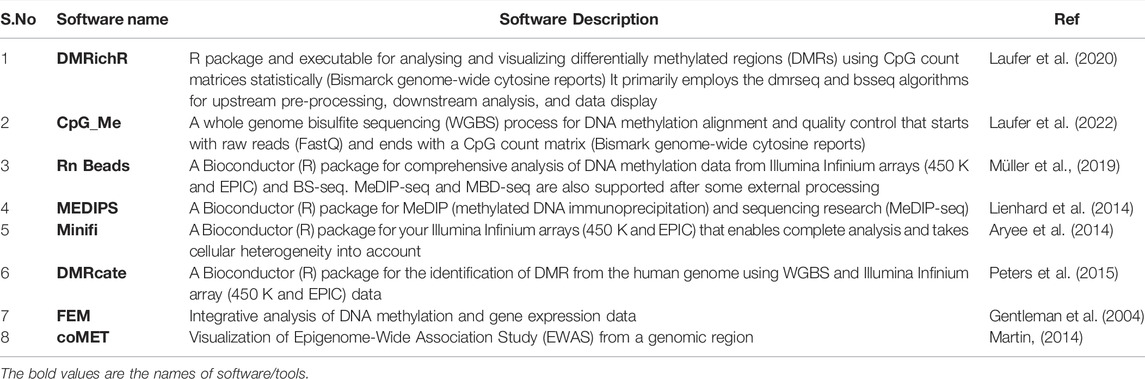
TABLE 6. Showing various in silico approaches in Epigenomics.
Pathway/Enrichment Analysis framework: omics Data
Comprehensive DNA, RNA, and protein quantification in biological materials is prevalent. The generated data is rapidly accumulating, and its analysis aids researchers in discovering new biological functions, genotype–phenotype correlations, and disease causes (Lander, 2011; Stephens et al., 2015). Many researchers, however, find that analysing and interpreting these data is a huge issue. Long lists of genes often emerge from analyses, requiring an impractically enormous amount of manual literature research to analyze.
Scientists can use pathway enrichment analysis to acquire mechanistic insight into gene lists generated by genome-scale (omics) investigations. This approach finds biological pathways that are more enriched in a gene list than is expected by chance (Nguyen et al., 2019). Innovative pathway enrichment analysis methodologies and provide a step-by-step guidance for interpreting gene lists generated by RNA-seq and genome-sequencing research. The approaches can be employed in various sets: defining a gene list using omics data, determining statistically enriched pathways, and visualizing and interpreting the results. This technique can be used in expressed genes and cancer genes that have been altered; however, the idea can be extended to a wide range of omics data (Paczkowska et al., 2020). Although there are various enrichment tools. Few of them are summarized in Table 7.
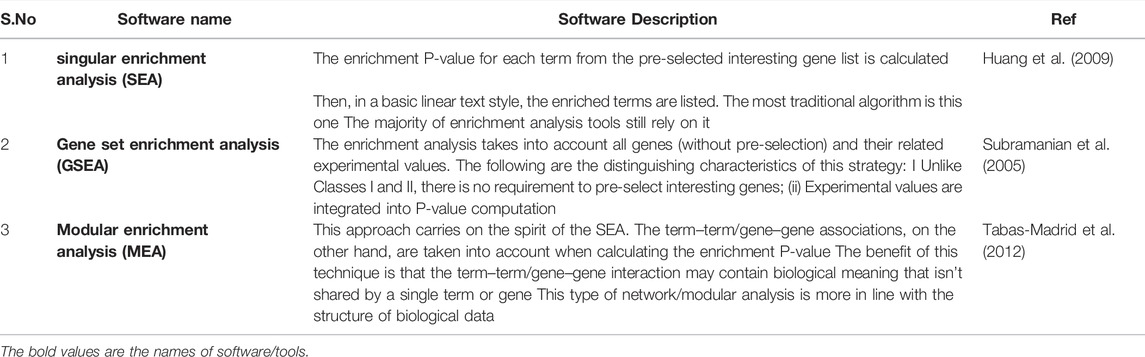
TABLE 7. Showing various enrichment tools.
Single-Cell Genomics “Cancer Research/Pan-Cancer Biomarkers”
Single-cell sequencing refers to the sequencing of a single-cell genome or transcriptome in order to gather genomic, transcriptomic, or other multi-omics information that can be used to show cell population distinctions and cell evolutionary linkages as in plethora of cancers. Traditional sequencing methods can only obtain an average of many cells, making it impossible to study a small number of cells and resulting in the loss of cellular heterogeneity data (Wen and Tang, 2018).
Single-cell methods have the advantages of detecting variability among individual cells [1, differentiating a small number of cells, and outlining cell maps when compared to classical sequencing technology (Pennisi, 2012).
Multimodal analysis with integration (Multimodal analysis), or the ability to assess various data types simultaneously from the same cell, is a new and exciting future for single-cell genomics. Weighted closest neighbor (WNN) analysis, an unsupervised technique for learning the information content of each modality in each cell and defining cellular state based on a weighted combination of both modalities, is introduced in Seurat v4. Infact, Multimodal analysis, or the simultaneous measurement of many modalities, is an intriguing new Frontier in single-cell genomics that needs novel computational methods to describe biological states based on numerous data sources. Recent research have demonstrated WNN to create a multimodal reference of human PBMC using a CITE-seq dataset with matched transcriptome and 228 surface protein measurements. WNN can be used to analyse multimodal data from several technologies, such as CITE-seq, ASAP-seq, 10X Genomics ATAC + RNA, and SHARE-seq (Ensslin, 2008) (Tables 8, 9).
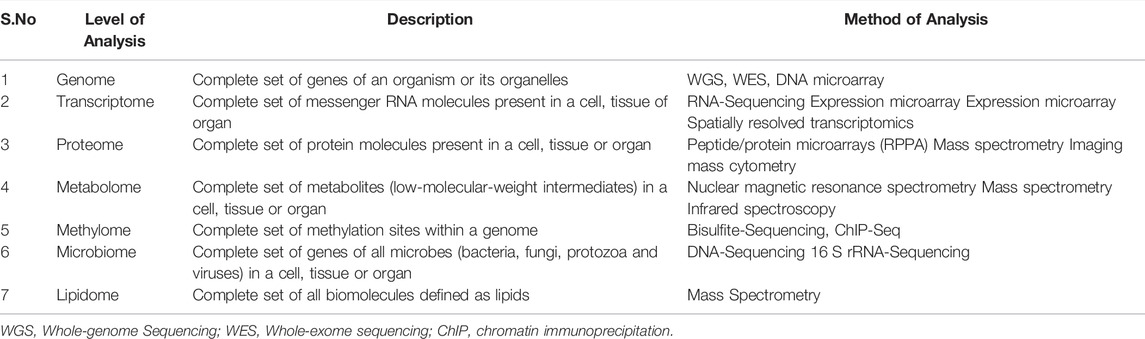
TABLE 8. Different omics levels of gene-function relationship.
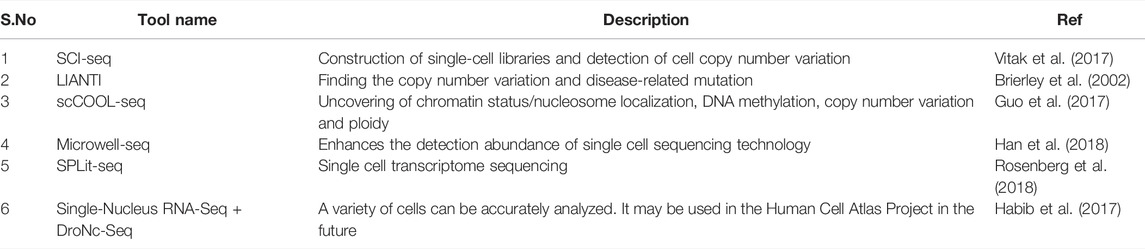
TABLE 9. Demonstrates various single cell sequencing technologies.
Deep Learning in Genomics
Although genomics generates large amounts of data, most bioinformatics algorithms use machine learning and, more recently, deep learning to discover patterns, make predictions, and model disease progression or treatment. Deep learning (DL) advances have sparked a surge of interest in biomedical informatics, spawning new bioinformatics and computational biology research areas. In deep learning models, it is anticipated to deliver higher accuracies in specific genomics tasks than current state-of-the-art methods. Given the growing trend of using deep learning architectures in genomics research. Deep learning will accelerate improvements in genomics. Deep learning is a sort of AI technique that is used to process vast and complicated genomic datasets in particular fields, such as clinical genomics (Koumakis, 2020). Various deep learning architectures have been designed till date, among them includes Artificial Neural Networks (ANN), Convolutional Neural Network (CNN) & Recurrent Neural Networks (RNN).
Artificial Neural Networks (ANN): The neurons and networks that make up human brains served as inspiration for Artificial Neural Networks (ANN). The ANN is made up of a set of fully linked nodes (neurons) that simulate the stimulus transmission of brain synapses across the neural network, whether they fire or not. These DL architectures can be used for feature selection, classification, dimensionality reduction, or as a submodule of a more complex design like convolutional neural networks (Zurada, 1992).
The Convolutional Neural Network (CNN) is a deep neural network architecture that is most typically used to analyse visual images. It was intended as a completely automated image analysis network for classifying handcrafted characters. CNNs are fully connected networks based on the multilayer perceptrons approach, in which each node/neuron in one layer is (fully) connected to all nodes in the following layer (LeCun et al., 1998).
Recurrent neural networks (RNN): The functioning of recurrent neural networks (RNN) is similar to that of normal feedforward neural networks (FNN), in which nodes form a directed graph along a temporal sequence. RNNs can now demonstrate temporal dynamic behavior while also integrating internal memory. Recurrent networks can remember information from previously studied states thanks to their short-term memory, making them ideal for sequential signal processing and prediction models. The ability of RNNs to relate information from a previous activity to the current task is one of their strengths (Williams and Zipser, 1989a). Table 10 enlists various tools of deep learning (AI) in genomics.
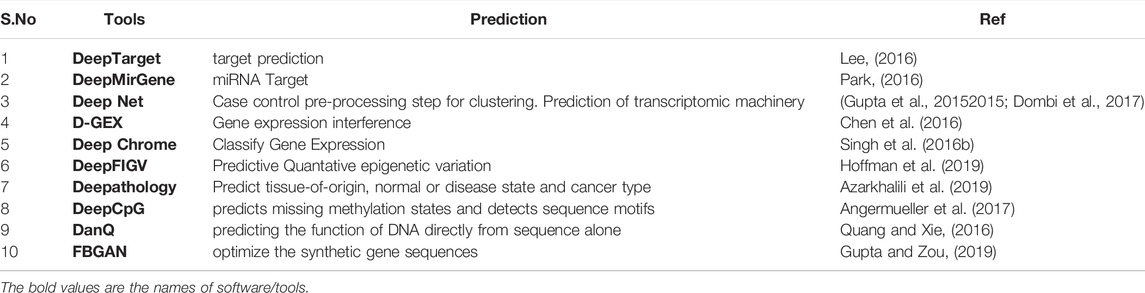
TABLE 10. Shows list of deep learning techniques in genomics.
Conclusion and Future Perspectives
The introduction of massively parallel sequencing has changed genetics and genomics research forever because of its widespread adoption and numerous applications, massively parallel sequencing is projected to play a vital role in the medical industry in the next years. It is worth noting that NGS as a research tool faces major challenges in terms of manufacturing, data management and downstream analysis.
➢ Thus, in the past decade, rapid advancements in high-throughput intervention, backed by lower costs, have opened up new pathways for interrogating a biological system at several regulatory levels, while also providing us with an unprecedented picture. Integrating more genomic/proteome/transcriptome/metabolome/epigenome data with relevant information obtained at other levels, such as genomes, transcriptomes, epigenomics and metabolomics is still a difficulty.
➢ Nonetheless, new sequencing technologies addressing genomic, proteome, transcriptome, metabolome, and epigenome data clearly have tremendous research potential; their capabilities in the hands of researchers will surely speed our understanding of genomic, medical science and allied domains.
➢ Advances in data creation and analysis skills, as well as the interpretation of outcomes, have pointed to a bright future. However, rapid advancement in all fields of science has resulted in the introduction of novel analytical methodologies. While we continue to learn more about how the body functions, we should shift our focus from molecular to systemic and analytic techniques, which has the potential to revolutionize our understanding of how complex biological systems are regulated.
➢ Data integration, on the other hand, is not the end. Although, the bioinformatics challenges posed by NGS are significant, a variety of software tools and algorithms have been created to aid data management, short-read alignment, and sequence variant identification. The high throughput of NGS necessitates the use of automated pipelines, which aid in the transition from novel sequencing technology
➢ Thus the scenario emphasizes the necessity for scientists who are experts in a variety of fields, as well as the effectiveness of multidisciplinary research groups, in which the complementarity of varied abilities will allow for significant scientific advancements & contributions. Addressing system-wide biological concerns necessitates the use of integrated biology techniques. Routine integration, on the other hand, will necessitate the maturation and alignment of various post-genome technologies, as well as cross-communication across various scientific communities. The effective integration of all of these technologies will eventually lead to next-generation systems biology, which will provide valuable biological insights and adoption to high-throughput research and publication.
Author Contributions
DA and GRB conceived the concept. GRB, IS, and DA wrote the manuscript. BR and RK technically refined the MS. All the authors finally approved the MS.
Conflict of Interest
The authors declare that the research was conducted in the absence of any commercial or financial relationships that could be construed as a potential conflict of interest.
Publisher’s Note
All claims expressed in this article are solely those of the authors and do not necessarily represent those of their affiliated organizations, or those of the publisher, the editors and the reviewers. Any product that may be evaluated in this article, or claim that may be made by its manufacturer, is not guaranteed or endorsed by the publisher.
References
Addona, T. A., Shi, X., Keshishian, H., Mani, D. R., Burgess, M., Gillette, M. A., et al. (2011). A Pipeline that Integrates the Discovery and Verification of Plasma Protein Biomarkers Reveals Candidate Markers for Cardiovascular Disease. Nat. Biotechnol. 29 (7), 635–643. doi:10.1038/nbt.1899
Adzhubei, I. A., Schmidt, S., Peshkin, L., Ramensky, V. E., Gerasimova, A., Bork, P., et al. (2010). A Method and Server for Predicting Damaging Missense Mutations. Nat. Methods 7 (4), 248–249. doi:10.1038/nmeth0410-248
Aird, D., Ross, M. G., Chen, W. S., Danielsson, M., Fennell, T., Russ, C., et al. (2011). Analyzing and Minimizing PCR Amplification Bias in Illumina Sequencing Libraries. Genome Biol. 12 (2), R18–R14. doi:10.1186/gb-2011-12-2-r18
Altelaar, A. F. M., Navarro, D., Boekhorst, J., van Breukelen, B., Snel, B., Mohammed, S., et al. (2012). Database Independent Proteomics Analysis of the Ostrich and Human Proteome. Proc. Natl. Acad. Sci. U.S.A. 109 (2), 407–412. doi:10.1073/pnas.1108399108
Altmann, A., Weber, P., Bader, D., Preuß, M., Binder, E. B., and Müller-Myhsok, B. (2012). A Beginners Guide to SNP Calling from High-Throughput DNA-Sequencing Data. Hum. Genet. 131 (10), 1541–1554. doi:10.1007/s00439-012-1213-z
Amaral, A., Reis, M., and Silva, F. (2007). O programa BLAST: guia prático de utilização. Lisboa, Portugal: EMBRAPA. Documentos, 224.
Ameur, A., Che, H., Martin, M., Bunikis, I., Dahlberg, J., Höijer, I., et al. (2018). De Novo assembly of Two Swedish Genomes Reveals Missing Segments from the Human GRCh38 Reference and Improves Variant Calling of Population-Scale Sequencing Data. Genes 9 (10), 486. doi:10.3390/genes9100486
Ameur, A., Kloosterman, W. P., and Hestand, M. S. (2019). Single-molecule Sequencing: towards Clinical Applications. Trends Biotechnology 37 (1), 72–85. doi:10.1016/j.tibtech.2018.07.013
Andrés-León, E., Núñez-Torres, R., and Rojas, A. M. (2016). miARma-Seq: a Comprehensive Tool for miRNA, mRNA and circRNA Analysis. Scientific Rep. 6 (1), 1–8.
Angermueller, C., Lee, H. J., Reik, W., and Stegle, O. (2017). Erratum to: DeepCpG: Accurate Prediction of Single-Cell DNA Methylation States Using Deep Learning. Genome Biol. 18 (1), 90–13. doi:10.1186/s13059-017-1233-z
Aryee, M. J., Jaffe, A. E., Corrada-Bravo, H., Ladd-Acosta, C., Feinberg, A. P., Hansen, K. D., et al. (2014). Minfi: a Flexible and Comprehensive Bioconductor Package for the Analysis of Infinium DNA Methylation Microarrays. Bioinformatics 30 (10), 1363–1369. doi:10.1093/bioinformatics/btu049
Azarkhalili, B., Saberi, A., Chitsaz, H., and Sharifi-Zarchi, A. (2019). DeePathology: Deep Multi-Task Learning for Inferring Molecular Pathology from Cancer Transcriptome. Sci. Rep. 9 (1), 16526–16614. doi:10.1038/s41598-019-52937-5
Bao, L., Zhou, M., and Cui, Y. (2005). nsSNPAnalyzer: Identifying Disease-Associated Nonsynonymous Single Nucleotide Polymorphisms. Nucleic Acids Res. 33 (Suppl. l_2), W480–W482. doi:10.1093/nar/gki372
Beck, M., Schmidt, A., Malmstroem, J., Claassen, M., Ori, A., Szymborska, A., et al. (2011). The Quantitative Proteome of a Human Cell Line. Mol. Syst. Biol. 7 (1), 549. doi:10.1038/msb.2011.82
Berlin, K., Koren, S., Chin, C.-S., Drake, J. P., Landolin, J. M., and Phillippy, A. M. (2015). Assembling Large Genomes with Single-Molecule Sequencing and Locality-Sensitive Hashing. Nat. Biotechnol. 33 (6), 623–630. doi:10.1038/nbt.3238
Berman, H., Henrick, K., Nakamura, H., and Markley, J. L. (2007). The Worldwide Protein Data Bank (wwPDB): Ensuring a Single, Uniform Archive of PDB Data. Nucleic Acids Res. 35, D301–D303. doi:10.1093/nar/gkl971
Bernhofer, M., Dallago, C., Karl, T., Satagopam, V., Heinzinger, M., Littmann, M., et al. (2021). PredictProtein - Predicting Protein Structure and Function for 29 Years. Nucleic Acids Res. 49 (W1), W535–W540. doi:10.1093/nar/gkab354
Blencowe, B. J. (2000). Exonic Splicing Enhancers: Mechanism of Action, Diversity and Role in Human Genetic Diseases. Trends Biochemical Sciences 25 (3), 106–110. doi:10.1016/s0968-0004(00)01549-8
Boža, V., Brejová, B., and Vinař, T. (2017). DeepNano: Deep Recurrent Neural Networks for Base Calling in MinION Nanopore Reads. PloS one 12 (6), e0178751. doi:10.1371/journal.pone.0178751
Brierley, A. S., Fernandes, P. G., Brandon, M. A., Armstrong, F., Millard, N. W., McPhail, S. D., et al. (2002). Antarctic Krill under Sea Ice: Elevated Abundance in a Narrow Band Just South of Ice Edge. Science 295 (5561), 1890–1892. doi:10.1126/science.1068574
Bru, C., Courcelle, E., Carrère, S., Beausse, Y., Dalmar, S., and Kahn, D. (2005). The ProDom Database of Protein Domain Families: More Emphasis on 3D. Nucleic Acids Res. 33, D212–D215. doi:10.1093/nar/gki034
Burge, C. B., Tuschl, T., and Sharp, P. A. (1999). Splicing of Precursors to mRNAs by the Spliceosomes. Cold Spring Harbor Monogr. Ser. 37, 525–560.
Caldwell, M. D., Berg, R. L., Zhang, K. Q., Glurich, I., Schmelzer, J. R., Yale, S. H., et al. (2007). Evaluation of Genetic Factors for Warfarin Dose Prediction. Clin. Med. Res. 5 (1), 8–16. doi:10.3121/cmr.2007.724
Carlson, A. K., Rawle, R. A., Adams, E., Greenwood, M. C., Bothner, B., and June, R. K. (2018). Application of Global Metabolomic Profiling of Synovial Fluid for Osteoarthritis Biomarkers. Biochem. biophysical Res. Commun. 499 (2), 182–188. doi:10.1016/j.bbrc.2018.03.117
Cartegni, L., Chew, S. L., and Krainer, A. R. (2002). Listening to Silence and Understanding Nonsense: Exonic Mutations that Affect Splicing. Nat. Rev. Genet. 3 (4), 285–298. doi:10.1038/nrg775
Cartegni, L., Wang, J., Zhu, Z., Zhang, M. Q., and Krainer, A. R. (2003). ESEfinder: A Web Resource to Identify Exonic Splicing Enhancers. Nucleic Acids Res. 31 (13), 3568–3571. doi:10.1093/nar/gkg616
Chaisson, M. J., and Tesler, G. (2012). Mapping Single Molecule Sequencing Reads Using Basic Local Alignment with Successive Refinement (BLASR): Application and Theory. BMC bioinformatics 13 (1), 238–318. doi:10.1186/1471-2105-13-238
Chen, L., Wang, C., Sun, H., Wang, J., Liang, Y., Wang, Y., et al. (2021). The Bioinformatics Toolbox for circRNA Discovery and Analysis. Brief. Bioinformatics 22 (2), 1706–1728. doi:10.1093/bib/bbaa001
Chen, Y., Li, Y., Narayan, R., Subramanian, A., and Xie, X. (2016). Gene Expression Inference with Deep Learning. Bioinformatics 32 (12), 1832–1839. doi:10.1093/bioinformatics/btw074
Chin, C.-S., Alexander, D. H., Marks, P., Klammer, A. A., Drake, J., Heiner, C., et al. (2013). Nonhybrid, Finished Microbial Genome Assemblies from Long-Read SMRT Sequencing Data. Nat. Methods 10 (6), 563–569. doi:10.1038/nmeth.2474
Cingolani, P., Platts, A., Wang, L. L., Coon, M., Nguyen, T., Wang, L., et al. (2012). A Program for Annotating and Predicting the Effects of Single Nucleotide Polymorphisms, SnpEff. Fly 6 (2), 80–92. doi:10.4161/fly.19695
Consortium, I. H., Altshuler, D. M., Gibbs, R. A., Peltonen, L., Altshuler, D. M., Gibbs, R. A., et al. (2010). Integrating Common and Rare Genetic Variation in Diverse Human Populations. Nature 467 (7311), 52–58. doi:10.1038/nature09298
Cooper, C. A., Gasteiger, E., and Packer, N. H. (2001). GlycoMod - A Software Tool for Determining Glycosylation Compositions from Mass Spectrometric Data. Proteomics 1 (2), 340–349. doi:10.1002/1615-9861(200102)1:2<340::aid-prot340>3.0.co;2-b
Cox, J., and Mann, M. (2011). Quantitative, High-Resolution Proteomics for Data-Driven Systems Biology. Annu. Rev. Biochem. 80, 273–299. doi:10.1146/annurev-biochem-061308-093216
David, M., Dursi, L. J., Yao, D., Boutros, P. C., and Simpson, J. T. (2017). Nanocall: an Open Source Basecaller for Oxford Nanopore Sequencing Data. Bioinformatics 33 (1), 49–55. doi:10.1093/bioinformatics/btw569
De Castro, E., Sigrist, C. J., Gattiker, A., Bulliard, V., Langendijk-Genevaux, P. S., Gasteiger, E., et al. (2006). ScanProsite: Detection of PROSITE Signature Matches and ProRule-Associated Functional and Structural Residues in Proteins. Nucleic Acids Res. 34 (Suppl. l_2), W362–W365. doi:10.1093/nar/gkl124
Delaneau, O., Zagury, J. F., Robinson, M. R., Marchini, J. L., and Dermitzakis, E. T. (2019). Accurate, Scalable and Integrative Haplotype Estimation. Nat. Commun. 10 (1), 5436–5510. doi:10.1038/s41467-019-13225-y
Dombi, J., Jónás, T., and Tóth, Z. E. (2017). “A Pliant Arithmetic-Based Fuzzy Time Series Model,” in International Work-Conference on Artificial Neural Networks (Springer).
Dudka, I., Chachaj, A., Sebastian, A., Tański, W., Stenlund, H., Gröbner, G., et al. (2021). Metabolomic Profiling Reveals Plasma GlycA and GlycB as a Potential Biomarkers for Treatment Efficiency in Rheumatoid Arthritis. J. Pharm. Biomed. Anal. 197, 113971. doi:10.1016/j.jpba.2021.113971
Eilbeck, K., Quinlan, A., and Yandell, M. (2017). Settling the Score: Variant Prioritization and Mendelian Disease. Nat. Rev. Genet. 18 (10), 599–612. doi:10.1038/nrg.2017.52
English, A. C., Richards, S., Han, Y., Wang, M., Vee, V., Qu, J., et al. (2012). Mind the gap: Upgrading Genomes with Pacific Biosciences RS Long-Read Sequencing Technology. PloS one 7 (11), e47768. doi:10.1371/journal.pone.0047768
Fairbrother, W. G., Yeh, R.-F., Sharp, P. A., and Burge, C. B. (2002). Predictive Identification of Exonic Splicing Enhancers in Human Genes. Science 297 (5583), 1007–1013. doi:10.1126/science.1073774
Ficarro, S. B., McCleland, M. L., Stukenberg, P. T., Burke, D. J., Ross, M. M., Shabanowitz, J., et al. (2002). Phosphoproteome Analysis by Mass Spectrometry and its Application to Saccharomyces cerevisiae. Nat. Biotechnol. 20 (3), 301–305. doi:10.1038/nbt0302-301
Flicek, P., and Birney, E. (2009). Sense from Sequence Reads: Methods for Alignment and Assembly. Nat. Methods 6 (11), S6–S12. doi:10.1038/nmeth.1376
Flicek, P., Aken, B. L., Beal, K., Ballester, B., Caccamo, M., Chen, Y., et al. (2008). Ensembl 2008. Nucleic Acids Research 36 (Database issue), D707–D714. doi:10.1093/nar/gkm988
Freshour, S. L., Kiwala, S., Cotto, K. C., Coffman, A. C., McMichael, J. F., Song, J. J., et al. (2020). Integration of the Drug-Gene Interaction Database (DGIdb 4.0) with Open Crowdsource Efforts. Nucleic Acids Res. 49 (D1), D1144–D1151. doi:10.1093/nar/gkaa1084
Gao, Y., Wang, J., and Zhao, F. (2015). CIRI: an Efficient and Unbiased Algorithm for De Novo Circular RNA Identification. Genome Biol. 16 (1), 4–16. doi:10.1186/s13059-014-0571-3
Gao, Y., Zhang, J., and Zhao, F. (2018). Circular RNA Identification Based on Multiple Seed Matching. Brief. Bioinformatics 19 (5), 803–810. doi:10.1093/bib/bbx014
Gasteiger, E., Alexandre, G., Christine, H., Ivan, I., Ron, D. A., and Amos, B. (2003). ExPASy: The Proteomics Server for In-Depth Protein Knowledge and Analysis. Nucleic Acids Res. 31 (13), 3784–3788. doi:10.1093/nar/gkg563
Gasteiger, E., Hoogland, C., Gattiker, A., Duvaud, S. e., Wilkins, M. R., Appel, R. D., et al. (2005). Protein Identification and Analysis Tools on the ExPASy serverThe Proteomics Protocols Handbook, 571–607. doi:10.1385/1-59259-890-0:571Protein Identification and Analysis Tools on the ExPASy Server
Gentleman, R. C., Carey, V. J., Bates, D. M., Bolstad, B., Dettling, M., Dudoit, S., et al. (2004). Bioconductor: Open Software Development for Computational Biology and Bioinformatics. Genome Biol. 5 (10), R80–R16. doi:10.1186/gb-2004-5-10-r80
González-Pérez, A., and López-Bigas, N. (2011). Improving the Assessment of the Outcome of Nonsynonymous SNVs with a Consensus Deleteriousness Score, Condel. Am. J. Hum. Genet. 88 (4), 440–449.
Goodwin, S., Gurtowski, J., Ethe-Sayers, S., Deshpande, P., Schatz, M. C., and McCombie, W. R. (2015). Oxford Nanopore Sequencing, Hybrid Error Correction, and De Novo Assembly of a Eukaryotic Genome. Genome Res. 25 (11), 1750–1756. doi:10.1101/gr.191395.115
Graveley, B. R. (2000). Sorting Out the Complexity of SR Protein Functions. Rna 6 (9), 1197–1211. doi:10.1017/s1355838200000960
Guo, F., Li, L., Li, J., Wu, X., Hu, B., Zhu, P., et al. (2017). Single-cell Multi-Omics Sequencing of Mouse Early Embryos and Embryonic Stem Cells. Cell Res 27 (8), 967–988. doi:10.1038/cr.2017.82
Gupta, A., Wang, H., and Ganapathiraju, M. (20152015). “Learning Structure in Gene Expression Data Using Deep Architectures, with an Application to Gene Clustering,” in IEEE international conference on bioinformatics and biomedicine (BIBM) (IEEE).
Gupta, A., and Zou, J. (2019). Feedback GAN for DNA Optimizes Protein Functions. Nat. Mach Intell. 1 (2), 105–111. doi:10.1038/s42256-019-0017-4
Habib, N., Avraham-Davidi, I., Basu, A., Burks, T., Shekhar, K., Hofree, M., et al. (2017). Massively Parallel Single-Nucleus RNA-Seq with DroNc-Seq. Nat. Methods 14 (10), 955–958. doi:10.1038/nmeth.4407
Han, X., Wang, R., Zhou, Y., Fei, L., Sun, H., Lai, S., et al. (2018). Mapping the Mouse Cell Atlas by Microwell-Seq. Cell 172 (5), 1091–1107. doi:10.1016/j.cell.2018.02.001
Harper, P. S. (2017). The European Society of Human Genetics: Beginnings, Early History and Development over its First 25 Years. United Kingdom: European Journal of Human Genetics, 1–8.
Herráez, A. (2006). Biomolecules in the Computer: Jmol to the rescue. Biochem. Mol. Biol. Educ. 34 (4), 255–261. doi:10.1002/bmb.2006.494034042644
Hoffman, G. E., Bendl, J., Girdhar, K., Schadt, E. E., and Roussos, P. (2019). Functional Interpretation of Genetic Variants Using Deep Learning Predicts Impact on Chromatin Accessibility and Histone Modification. Nucleic Acids Res. 47 (20), 10597–10611. doi:10.1093/nar/gkz808
Huang, D. W., Sherman, B. T., and Lempicki, R. A. (2009). Bioinformatics Enrichment Tools: Paths toward the Comprehensive Functional Analysis of Large Gene Lists. Nucleic Acids Res. 37 (1), 1–13. doi:10.1093/nar/gkn923
Ishikawa, J., and Hotta, K. (1999). FramePlot: a New Implementation of the Frame Analysis for Predicting Protein-Coding Regions in Bacterial DNA with a High G+C Content. FEMS Microbiol. Lett. 174 (2), 251–253. doi:10.1111/j.1574-6968.1999.tb13576.x
Jackson, D. A., Symons, R. H., and Berg, P. (1972). Biochemical Method for Inserting New Genetic Information into DNA of Simian Virus 40: Circular SV40 DNA Molecules Containing Lambda Phage Genes and the Galactose Operon of Escherichia coli. Proc. Natl. Acad. Sci. U.S.A. 69 (10), 2904–2909. doi:10.1073/pnas.69.10.2904
Jacob, M., and Gallinaro, H. (1989). The 5′ Splice Site: Phylogetic Evalution and Variable Geometry of Association with U1RNA. Nucl. Acids Res. 17 (6), 2159–2180. doi:10.1093/nar/17.6.2159
Jensen, L. J., Saric, J., and Bork, P. (2006). Literature Mining for the Biologist: from Information Retrieval to Biological Discovery. Nat. Rev. Genet. 7 (2), 119–129. doi:10.1038/nrg1768
Jia, G.-y., Wang, D.-l., Xue, M.-z., Liu, Y.-w., Pei, Y.-c., Yang, Y.-q., et al. (2019). CircRNAFisher: a Systematic Computational Approach for De Novo Circular RNA Identification. Acta Pharmacol. Sin 40 (1), 55–63. doi:10.1038/s41401-018-0063-1
Kelley, L. A., Mezulis, S., Yates, C. M., Wass, M. N., and Sternberg, M. J. E. (2015). The Phyre2 Web portal for Protein Modeling, Prediction and Analysis. Nat. Protoc. 10 (6), 845–858. doi:10.1038/nprot.2015.053
Kircher, M., Heyn, P., and Kelso, J. (2011). Addressing Challenges in the Production and Analysis of Illumina Sequencing Data. BMC genomics 12 (1), 382–414. doi:10.1186/1471-2164-12-382
Kircher, M., Witten, D. M., Jain, P., O'Roak, B. J., Cooper, G. M., and Shendure, J. (2014). A General Framework for Estimating the Relative Pathogenicity of Human Genetic Variants. Nat. Genet. 46 (3), 310–315. doi:10.1038/ng.2892
Koumakis, L. (2020). Deep Learning Models in Genomics; Are We There yet? Comput. Struct. Biotechnol. J. 18, 1466–1473. doi:10.1016/j.csbj.2020.06.017
Kuhn, M., von Mering, C., Campillos, M., Jensen, L. J., and Bork, P. (2008). STITCH: Interaction Networks of Chemicals and Proteins. Nucleic Acids Res. 36, D684–D688. doi:10.1093/nar/gkm795
Kuhn, M., Letunic, I., Jensen, L. J., and Bork, P. (2016). The SIDER Database of Drugs and Side Effects. Nucleic Acids Res. 44 (D1), D1075–D1079. doi:10.1093/nar/gkv1075
Lacal, I., and Ventura, R. (2018). Epigenetic Inheritance: Concepts, Mechanisms and Perspectives. Front. Mol. Neurosci. 11, 292. doi:10.3389/fnmol.2018.00292
Lander, E. S. (2011). Initial Impact of the Sequencing of the Human Genome. Nature 470 (7333), 187–197. doi:10.1038/nature09792
Laufer, B. I., Hwang, H., Jianu, J. M., Mordaunt, C. E., Korf, I. F., Hertz-Picciotto, I., et al. (2020). Low-pass Whole Genome Bisulfite Sequencing of Neonatal Dried Blood Spots Identifies a Role for RUNX1 in Down Syndrome DNA Methylation Profiles. Hum. Mol. Genet. 29 (21), 3465–3476. doi:10.1093/hmg/ddaa218
Laufer, B. I., Neier, K., Valenzuela, A. E., Yasui, D. H., Schmidt, R. J., Lein, P. J., et al. (2022). Placenta and Fetal Brain Share a Neurodevelopmental Disorder DNA Methylation Profile in a Mouse Model of Prenatal PCB Exposure. Cel Rep. 38 (9), 110442. doi:10.1016/j.celrep.2022.110442
Laurentino, S., Heckmann, L., Di Persio, S., Li, X., Meyer Zu Hörste, G., Wistuba, J., et al. (2019). High-resolution Analysis of Germ Cells from Men with Sex Chromosomal Aneuploidies Reveals normal Transcriptome but Impaired Imprinting. Clin. Epigenetics 11 (1), 127–213. doi:10.1186/s13148-019-0720-3
LeCun, Y., Bottou, L., Bengio, Y., and Haffner, P. (1998). Gradient-based Learning Applied to Document Recognition. Proc. IEEE 86 (11), 2278–2324. doi:10.1109/5.726791
Ledergerber, C., and Dessimoz, C. (2011). Base-calling for Next-Generation Sequencing Platforms. Brief. Bioinformatics 12 (5), 489–497. doi:10.1093/bib/bbq077
Lee, B. (2016). “deepTarget: End-To-End Learning Framework for microRNA Target Prediction Using Deep Recurrent Neural Networks,” in Proceedings of the 7th ACM International Conference on Bioinformatics, Computational Biology, and Health Informatics.
Lek, M., Karczewski, K. J., Minikel, E. V., Samocha, K. E., Banks, E., Fennell, T., et al. (2016). Analysis of Protein-Coding Genetic Variation in 60,706 Humans. Nature 536 (7616), 285–291. doi:10.1038/nature19057
Lelieveld, S. H., Veltman, J. A., and Gilissen, C. (2016). Novel Bioinformatic Developments for Exome Sequencing. Hum. Genet. 135 (6), 603–614. doi:10.1007/s00439-016-1658-6
Lemeer, S., and Heck, A. J. (2009). The Phosphoproteomics Data Explosion. Curr. Opin. Chem. Biol. 13 (4), 414–420. doi:10.1016/j.cbpa.2009.06.022
Li, H. (2016). Minimap and Miniasm: Fast Mapping and De Novo Assembly for Noisy Long Sequences. Bioinformatics 32 (14), 2103–2110. doi:10.1093/bioinformatics/btw152
Li, X., and Wu, Y. (2020). Detecting circular RNA from high-throughput sequence data with de Bruijn graph. BMC genomics 21 (1), 749–811. doi:10.1186/s12864-019-6154-7
Lienhard, M., Grimm, C., Morkel, M., Herwig, R., and Chavez, L. (2014). MEDIPS: Genome-wide Differential Coverage Analysis of Sequencing Data Derived from DNA Enrichment Experiments. Bioinformatics 30 (2), 284–286. doi:10.1093/bioinformatics/btt650
Liu, H.-X., Chew, S. L., Cartegni, L., Zhang, M. Q., and Krainer, A. R. (2000). Exonic Splicing Enhancer Motif Recognized by Human SC35 under Splicing Conditions. Mol. Cel Biol 20 (3), 1063–1071. doi:10.1128/mcb.20.3.1063-1071.2000
Liu, H. X., Zhang, M., and Krainer, A. R. (1998). Identification of Functional Exonic Splicing Enhancer Motifs Recognized by Individual SR Proteins. Genes Dev. 12 (13), 1998–2012. doi:10.1101/gad.12.13.1998
Liu, Q., Ding, C., Lang, X., Guo, G., Chen, J., and Su, X. (2021). Small Noncoding RNA Discovery and Profiling with sRNAtools Based on High-Throughput Sequencing. Brief. Bioinformatics 22 (1), 463–473. doi:10.1093/bib/bbz151
Loman, N. J., Quick, J., and Simpson, J. T. (2015). A Complete Bacterial Genome Assembled De Novo Using Only Nanopore Sequencing Data. Nat. Methods 12 (8), 733–735. doi:10.1038/nmeth.3444
Lopez, J. P., Diallo, A., Cruceanu, C., Fiori, L. M., Laboissiere, S., Guillet, I., et al. (2015). Biomarker Discovery: Quantification of microRNAs and Other Small Non-coding RNAs Using Next Generation Sequencing. BMC Med. Genomics 8 (1), 35–18. doi:10.1186/s12920-015-0109-x
Lundby, A., Secher, A., Lage, K., Nordsborg, N. B., Dmytriyev, A., Lundby, C., et al. (2012). Quantitative Maps of Protein Phosphorylation Sites across 14 Different Rat Organs and Tissues. Nat. Commun. 3 (1), 876–910. doi:10.1038/ncomms1871
Luscombe, N. M., Greenbaum, D., and Gerstein, M. (2001). What Is Bioinformatics? an Introduction and Overview. Yearb. Med. Inform. 10 (01), 83–100. doi:10.1055/s-0038-1638103
Ma, B., and Johnson, R. (2012). De Novo sequencing and Homology Searching. Mol. Cel Proteomics 11 (2), O111–O014902. doi:10.1074/mcp.O111.014902
MacArthur, D. G., Balasubramanian, S., Frankish, A., Huang, N., Morris, J., Walter, K., et al. (2012). A Systematic Survey of Loss-Of-Function Variants in Human Protein-Coding Genes. Science 335 (6070), 823–828. doi:10.1126/science.1215040
Marioni, J. C., Mason, C. E., Mane, S. M., Stephens, M., and Gilad, Y. (2008). RNA-seq: an Assessment of Technical Reproducibility and Comparison with Gene Expression Arrays. Genome Res. 18 (9), 1509–1517. doi:10.1101/gr.079558.108
Maxam, A. M., and Gilbert, W. (1977). A New Method for Sequencing DNA. Proc. Natl. Acad. Sci. U.S.A. 74 (2), 560–564. doi:10.1073/pnas.74.2.560
McCarthy, A. (2010). Third Generation DNA Sequencing: pacific Biosciences' Single Molecule Real Time Technology. Chem. Biol. 17 (7), 675–676. doi:10.1016/j.chembiol.2010.07.004
McLaren, W., Pritchard, B., Rios, D., Chen, Y., Flicek, P., and Cunningham, F. (2010). Deriving the Consequences of Genomic Variants with the Ensembl API and SNP Effect Predictor. Bioinformatics 26 (16), 2069–2070. doi:10.1093/bioinformatics/btq330
Meng, X., Chen, Q., Zhang, P., and Chen, M. (2017). CircPro: an Integrated Tool for the Identification of circRNAs with Protein-Coding Potential. Bioinformatics 33 (20), 3314–3316. doi:10.1093/bioinformatics/btx446
Merker, J. D., Wenger, A. M., Sneddon, T., Grove, M., Zappala, Z., Fresard, L., et al. (2018). Long-read Genome Sequencing Identifies Causal Structural Variation in a Mendelian Disease. Genet. Med. 20 (1), 159–163. doi:10.1038/gim.2017.86
Montgomery, S. B., Sammeth, M., Gutierrez-Arcelus, M., Lach, R. P., Ingle, C., Nisbett, J., et al. (2010). Transcriptome Genetics Using Second Generation Sequencing in a Caucasian Population. Nature 464 (7289), 773–777. doi:10.1038/nature08903
Müller, F., Scherer, M., Assenov, Y., Lutsik, P., Walter, J., Lengauer, T., et al. (2019). RnBeads 2.0: Comprehensive Analysis of DNA Methylation Data. Genome Biol. 20 (1), 55. doi:10.1186/s13059-019-1664-9
Nagaraj, N., Wisniewski, J. R., Geiger, T., Cox, J., Kircher, M., Kelso, J., et al. (2011). Deep Proteome and Transcriptome Mapping of a Human Cancer Cell Line. Mol. Syst. Biol. 7 (1), 548. doi:10.1038/msb.2011.81
Ng, P. C., and Henikoff, S. (2003). SIFT: Predicting Amino Acid Changes that Affect Protein Function. Nucleic Acids Res. 31 (13), 3812–3814. doi:10.1093/nar/gkg509
Ng, S. B., Turner, E. H., Robertson, P. D., Flygare, S. D., Bigham, A. W., Lee, C., et al. (2009). Targeted Capture and Massively Parallel Sequencing of 12 Human Exomes. Nature 461 (7261), 272–276. doi:10.1038/nature08250
Nguyen, T. M., Shafi, A., Nguyen, T., and Draghici, S. (2019). Correction to: Identifying Significantly Impacted Pathways: a Comprehensive Review and Assessment. Genome Biol. 20 (1), 234–315. doi:10.1186/s13059-019-1882-1
Nilsen, T. W. (2003). The Spliceosome: the Most Complex Macromolecular Machine in the Cell? Bioessays 25 (12), 1147–1149. doi:10.1002/bies.10394
Ozsolak, F. (2012). Third-generation Sequencing Techniques and Applications to Drug Discovery. Expert Opin. Drug Discov. 7 (3), 231–243. doi:10.1517/17460441.2012.660145
Paczkowska, M., Barenboim, J., Sintupisut, N., Fox, N. S., Zhu, H., Abd-Rabbo, D., et al. (2020). Integrative Pathway Enrichment Analysis of Multivariate Omics Data. Nat. Commun. 11 (1), 735–816. doi:10.1038/s41467-019-13983-9
Park, S. (2016). deepMiRGene: Deep Neural Network Based Precursor Microrna Prediction. arXiv preprint arXiv:1605.00017.
Pennisi, E. (2012). Single-cell Sequencing Tackles Basic and Biomedical Questions. American Association for the Advancement of Science.
Pereira, R., Barbosa, T., Gales, L., Oliveira, E., Santos, R., Oliveira, J., et al. (2019). Clinical and Genetic Analysis of Children with Kartagener Syndrome. Cells 8 (8), 900. doi:10.3390/cells8080900
Pereira, R., Oliveira, J., and Sousa, M. (2020). Bioinformatics and Computational Tools for Next-Generation Sequencing Analysis in Clinical Genetics. Jcm 9 (1), 132. doi:10.3390/jcm9010132
Pereira, R., Oliveira, M. E., Santos, R., Oliveira, E., Barbosa, T., Santos, T., et al. (2019). Characterization of CCDC103 Expression Profiles: Further Insights in Primary Ciliary Dyskinesia and in Human Reproduction. J. Assist. Reprod. Genet. 36 (8), 1683–1700. doi:10.1007/s10815-019-01509-7
Perez-Riverol, Y., Csordas, A., Bai, J., Bernal-Llinares, M., Hewapathirana, S., Kundu, D. J., et al. (2019). The PRIDE Database and Related Tools and Resources in 2019: Improving Support for Quantification Data. Nucleic Acids Res. 47 (D1), D442–d450. doi:10.1093/nar/gky1106
Peters, T. J., Buckley, M. J., Statham, A. L., Pidsley, R., Samaras, K., V Lord, R., et al. (2015). De Novo identification of Differentially Methylated Regions in the Human Genome. Epigenetics Chromatin 8 (1), 6–16. doi:10.1186/1756-8935-8-6
Pollard, K. S., Hubisz, M. J., Rosenbloom, K. R., and Siepel, A. (2010). Detection of Nonneutral Substitution Rates on Mammalian Phylogenies. Genome Res. 20 (1), 110–121. doi:10.1101/gr.097857.109
Prosdocimi, F., Cerqueira, G. C., Binneck, E., Silva, A. F., Reis, A. N., Junqueira, A. C. M., et al. (2002). Bioinformatics: User Manual - Biotechnology Science & Development.
Pruess, M., and Apweiler, R. (2003). Bioinformatics Resources for In Silico Proteome Analysis. J. Biomed. Biotechnol. 2003 (4), 231–236. doi:10.1155/s1110724303209219
Pushkarev, D., Neff, N. F., and Quake, S. R. (2009). Single-molecule Sequencing of an Individual Human Genome. Nat. Biotechnol. 27 (9), 847–850. doi:10.1038/nbt.1561
Quail, M. A., Smith, M., Coupland, P., Otto, T. D., Harris, S. R., Connor, T. R., et al. (2012). A Tale of Three Next Generation Sequencing Platforms: Comparison of Ion Torrent, Pacific Biosciences and Illumina MiSeq Sequencers. BMC genomics 13 (1), 341–413. doi:10.1186/1471-2164-13-341
Quang, D., and Xie, X. (2016). DanQ: a Hybrid Convolutional and Recurrent Deep Neural Network for Quantifying the Function of DNA Sequences. Nucleic Acids Res. 44 (11), e107. doi:10.1093/nar/gkw226
Ritchie, M. D., Holzinger, E. R., Li, R., Pendergrass, S. A., and Kim, D. (2015). Methods of Integrating Data to Uncover Genotype-Phenotype Interactions. Nat. Rev. Genet. 16 (2), 85–97. doi:10.1038/nrg3868
Robinson, P. N., Köhler, S., Oellrich, A., Wang, K., Mungall, C. J., Lewis, S. E., et al. (2014). Improved Exome Prioritization of Disease Genes through Cross-Species Phenotype Comparison. Genome Res. 24 (2), 340–348. doi:10.1101/gr.160325.113
Rosenberg, A. B., Roco, C. M., Muscat, R. A., Kuchina, A., Sample, P., Yao, Z., et al. (2018)., 360. New York, NY), 176–182. doi:10.1126/science.aam8999Single-cell Profiling of the Developing Mouse Brain and Spinal Cord with Split-Pool BarcodingScience6385
Sanger, F., and Coulson, A. R. (1975). A Rapid Method for Determining Sequences in DNA by Primed Synthesis with DNA Polymerase. J. Mol. Biol. 94 (3), 441–448. doi:10.1016/0022-2836(75)90213-2
Sanger, F., Nicklen, S., and Coulson, A. R. (1977). DNA Sequencing with Chain-Terminating Inhibitors. Proc. Natl. Acad. Sci. U.S.A. 74 (12), 5463–5467. doi:10.1073/pnas.74.12.5463
Schadt, E. E., Turner, S., and Kasarskis, A. (2010). A Window into Third-Generation Sequencing. Hum. Mol. Genet. 19 (R2), R227–R240. doi:10.1093/hmg/ddq416
Scherer, S. W., Lee, C., Birney, E., Altshuler, D. M., Eichler, E. E., Carter, N. P., et al. (2007). Challenges and Standards in Integrating Surveys of Structural Variation. Nat. Genet. 39 (7), S7–S15. doi:10.1038/ng2093
Schmidt, A., Forne, I., and Imhof, A. (2014). Bioinformatic Analysis of Proteomics Data. BMC Syst. Biol. 8 Suppl 2 (2), S3–S7. doi:10.1186/1752-0509-8-S2-S3
Schwarz, J. M., Rödelsperger, C., Schuelke, M., and Seelow, D. (2010). MutationTaster Evaluates Disease-Causing Potential of Sequence Alterations. Nat. Methods 7 (8), 575–576. doi:10.1038/nmeth0810-575
Shah, N. J., Sureshkumar, S., and Shewade, D. G. (2015). Metabolomics: a Tool Ahead for Understanding Molecular Mechanisms of Drugs and Diseases. Ind. J. Clin. Biochem. 30 (3), 247–254. doi:10.1007/s12291-014-0455-z
Shendure, J., and Ji, H. (2008). Next-generation DNA Sequencing. Nat. Biotechnol. 26 (10), 1135–1145. doi:10.1038/nbt1486
Sievers, F., Wilm, A., Dineen, D., Gibson, T. J., Karplus, K., Li, W., et al. (2011). Fast, Scalable Generation of High‐quality Protein Multiple Sequence Alignments Using Clustal Omega. Mol. Syst. Biol. 7, 539. doi:10.1038/msb.2011.75
Sims, D., Sudbery, I., Ilott, N. E., Heger, A., and Ponting, C. P. (2014). Sequencing Depth and Coverage: Key Considerations in Genomic Analyses. Nat. Rev. Genet. 15 (2), 121–132. doi:10.1038/nrg3642
Singh Nanda, J., Kumar, R., and Raghava, G. P. (2016). dbEM: A Database of Epigenetic Modifiers Curated from Cancerous and normal Genomes. Sci. Rep. 6 (1), 19340–19346. doi:10.1038/srep19340
Singh, N., Upadhyay, S., Jaiswar, A., and Mishra, N. (2016a). In Silico Analysis of Protein. J. Bioinform Genomics Proteomics 1 (2), 1007.
Singh, R., Lanchantin, J., Robins, G., and Qi, Y. (2016). DeepChrome: Deep-Learning for Predicting Gene Expression from Histone Modifications. Bioinformatics 32 (17), i639–i648. doi:10.1093/bioinformatics/btw427
Singleton, M. V., Guthery, S. L., Voelkerding, K. V., Chen, K., Kennedy, B., Margraf, R. L., et al. (2014). Phevor Combines Multiple Biomedical Ontologies for Accurate Identification of Disease-Causing Alleles in Single Individuals and Small Nuclear Families. Am. J. Hum. Genet. 94 (4), 599–610. doi:10.1016/j.ajhg.2014.03.010
Smith, B. E., Hill, J. A., Gjukich, M. A., and Andrews, P. C. (2011). Tranche Distributed Repository and ProteomeCommons.Org. Methods Mol. Biol. 696, 123–145. doi:10.1007/978-1-60761-987-1_8
Smits, S. L., Raj, V. S., Oduber, M. D., Schapendonk, C. M. E., Bodewes, R., Provacia, L., et al. (2013). Metagenomic Analysis of the Ferret Fecal Viral flora. PLoS One 8 (8), e71595. doi:10.1371/journal.pone.0071595
Snider, C., Jayasinghe, S., Hristova, K., and White, S. H. (2009). MPEx: a Tool for Exploring Membrane Proteins. Protein Sci. 18 (12), 2624–2628. doi:10.1002/pro.256
Sović, I., ikić, I., Wilm, A., Fenlon, S. N., Chen, S., and Nagarajan, N. (2016). Fast and Sensitive Mapping of Nanopore Sequencing Reads with GraphMap. Nat. Commun. 7, 11307. doi:10.1038/ncomms11307
Stelzer, G., Plaschkes, I., Oz-Levi, D., Alkelai, A., Olender, T., Zimmerman, S., et al. (2016). VarElect: the Phenotype-Based Variation Prioritizer of the GeneCards Suite. BMC genomics 17 Suppl 2 (2), 444–206. doi:10.1186/s12864-016-2722-2
Stephens, Z. D., Lee, S. Y., Faghri, F., Campbell, R. H., Zhai, C., Efron, M. J., et al. (2015). Big Data: Astronomical or Genomical? Plos Biol. 13 (7), e1002195. doi:10.1371/journal.pbio.1002195
Stitziel, N. O., Binkowski, T. A., Tseng, Y. Y., Kasif, S., and Liang, J. (2004). topoSNP: a Topographic Database of Non-synonymous Single Nucleotide Polymorphisms with and without Known Disease Association. Nucleic Acids Res. 32 (Suppl. l_1), D520–D522. doi:10.1093/nar/gkh104
Stoneking, M., and Krause, J. (2011). Learning about Human Population History from Ancient and Modern Genomes. Nat. Rev. Genet. 12 (9), 603–614. doi:10.1038/nrg3029
Stothard, P. (2000). The Sequence Manipulation Suite: JavaScript Programs for Analyzing and Formatting Protein and DNA Sequences. Biotechniques 28 (6), 1102–1104. doi:10.2144/00286ir01
Subramanian, A., Tamayo, P., Mootha, V. K., Mukherjee, S., Ebert, B. L., Gillette, M. A., et al. (2005). Gene Set Enrichment Analysis: a Knowledge-Based Approach for Interpreting Genome-wide Expression Profiles. Proc. Natl. Acad. Sci. U.S.A. 102 (43), 15545–15550. doi:10.1073/pnas.0506580102
Szalay, T., and Golovchenko, J. A. (2015). De Novo sequencing and Variant Calling with Nanopores Using PoreSeq. Nat. Biotechnol. 33 (10), 1087–1091. doi:10.1038/nbt.3360
Szklarczyk, D., Gable, A. L., Nastou, K. C., Lyon, D., Kirsch, R., Pyysalo, S., et al. (2021). Correction to 'The STRING Database in 2021: Customizable Protein-Protein Networks, and Functional Characterization of User-Uploaded Gene/measurement Sets'. Nucleic Acids Res. 49 (18), 10800. doi:10.1093/nar/gkab835
Tabas-Madrid, D., Nogales-Cadenas, R., and Pascual-Montano, A. (2012). GeneCodis3: a Non-redundant and Modular Enrichment Analysis Tool for Functional Genomics. Nucleic Acids Res. 40, W478–W483. doi:10.1093/nar/gks402
Takahashi, S., Saegusa, J., Onishi, A., and Morinobu, A. (2019). Biomarkers Identified by Serum Metabolomic Analysis to Predict Biologic Treatment Response in Rheumatoid Arthritis Patients. Rheumatology 58 (12), 2153–2161. doi:10.1093/rheumatology/kez199
Thompson, J. F., and Steinmann, K. E. (2010). Single Molecule Sequencing with a HeliScope Genetic Analysis System. Curr. Protoc. Mol. Biol. Chapter 7 (1), Unit7–10. doi:10.1002/0471142727.mb0710s92
Thorn, C. F., Klein, T. E., and Altman, R. B. (2013). PharmGKB: the Pharmacogenomics Knowledge Base. Methods Mol. Biol. (Clifton, N.J.) 1015, 311–320. doi:10.1007/978-1-62703-435-7_20
Tripathi, P., Somashekar, B. S., Ponnusamy, M., Gursky, A., Dailey, S., Kunju, P., et al. (2013). HR-MAS NMR Tissue Metabolomic Signatures Cross-Validated by Mass Spectrometry Distinguish Bladder Cancer from Benign Disease. J. Proteome Res. 12 (7), 3519–3528. doi:10.1021/pr4004135
Trost, B., and Kusalik, A. (2011). Computational Prediction of Eukaryotic Phosphorylation Sites. Bioinformatics 27 (21), 2927–2935. doi:10.1093/bioinformatics/btr525
van Dijk, E. L., Jaszczyszyn, Y., Naquin, D., and Thermes, C. (2018). The Third Revolution in Sequencing Technology. Trends Genet. 34 (9), 666–681. doi:10.1016/j.tig.2018.05.008
Venter, J. C., Adams, M. D., Myers, E. W., Li, P. W., Mural, R. J., Sutton, G. G., et al. (2001). The Sequence of the Human Genome. science 291 (5507), 1304–1351. doi:10.1126/science.1058040
Vitak, S. A., Torkenczy, K. A., Rosenkrantz, J. L., Fields, A. J., Christiansen, L., Wong, M. H., et al. (2017). Sequencing Thousands of Single-Cell Genomes with Combinatorial Indexing. Nat. Methods 14 (3), 302–308. doi:10.1038/nmeth.4154
Wang, K., Li, M., and Hakonarson, H. (2010). ANNOVAR: Functional Annotation of Genetic Variants from High-Throughput Sequencing Data. Nucleic Acids Res. 38 (16), e164. doi:10.1093/nar/gkq603
Wang, K., Singh, D., Zeng, Z., Coleman, S. J., Huang, Y., Savich, G. L., et al. (2010). MapSplice: Accurate Mapping of RNA-Seq Reads for Splice junction Discovery. Nucleic Acids Res. 38 (18), e178. doi:10.1093/nar/gkq622
Wang, X., Xiong, X., Cao, W., Zhang, C., Werren, J. H., and Wang, X. (2019). Genome Assembly of the A-Group Wolbachia in Nasonia oneida Using Linked-Reads Technology. Genome Biol. Evol. 11 (10), 3008–3013. doi:10.1093/gbe/evz223
Wattanachai, N., Kaewmoongkun, S., Pussadhamma, B., Makarawate, P., Wongvipaporn, C., Kiatchoosakun, S., et al. (2017). The Impact of Non-genetic and Genetic Factors on a Stable Warfarin Dose in Thai Patients. Eur. J. Clin. Pharmacol. 73 (8), 973–980. doi:10.1007/s00228-017-2265-8
Wen, L., and Tang, F. (2018). Boosting the Power of Single-Cell Analysis. Nat. Biotechnol. 36 (5), 408–409. doi:10.1038/nbt.4131
Westholm, J. O., Miura, P., Olson, S., Shenker, S., Joseph, B., Sanfilippo, P., et al. (2014). Genome-wide Analysis of drosophila Circular RNAs Reveals Their Structural and Sequence Properties and Age-dependent Neural Accumulation. Cel Rep. 9 (5), 1966–1980. doi:10.1016/j.celrep.2014.10.062
Whiteaker, J. R., Lin, C., Kennedy, J., Hou, L., Trute, M., Sokal, I., et al. (2011). A Targeted Proteomics-Based Pipeline for Verification of Biomarkers in Plasma. Nat. Biotechnol. 29 (7), 625–634. doi:10.1038/nbt.1900
Williams, R., and Zipser, D. D. (1989a). A Learning Algorithm for Continually Running Fully Recurrent Neural Networks. Neural Comput. 1. doi:10.1162/neco.1989.1.2.270
Wishart, D. S., Feunang, Y. D., Guo, A. C., Lo, E. J., Marcu, A., Grant, J. R., et al. (2018). DrugBank 5.0: a Major Update to the DrugBank Database for 2018. Nucleic Acids Res. 46 (D1), D1074–D1082. doi:10.1093/nar/gkx1037
Xiao, T., and Zhou, W. (2020). The Third Generation Sequencing: the Advanced Approach to Genetic Diseases. Transl Pediatr. 9 (2), 163–173. doi:10.21037/tp.2020.03.06
Yang, H., and Wang, K. (2015). Genomic Variant Annotation and Prioritization with ANNOVAR and wANNOVAR. Nat. Protoc. 10 (10), 1556–1566. doi:10.1038/nprot.2015.105
Yang, J., Yan, R., Roy, A., Xu, D., Poisson, J., and Zhang, Y. (2015). The I-TASSER Suite: Protein Structure and Function Prediction. Nat. Methods 12 (1), 7–8. doi:10.1038/nmeth.3213
Yang, W., Soares, J., Greninger, P., Edelman, E. J., Lightfoot, H., Forbes, S., et al. (2013). Genomics of Drug Sensitivity in Cancer (GDSC): a Resource for Therapeutic Biomarker Discovery in Cancer Cells. Nucleic Acids Res. 41, D955–D961. doi:10.1093/nar/gks1111
You, X., and Conrad, T. O. (2016). Acfs: Accurate circRNA Identification and Quantification from RNA-Seq Data. Sci. Rep. 6 (1), 38820–38911. doi:10.1038/srep38820
Zhang, A., Sun, H., and Wang, X. (2014). Urinary Metabolic Profiling of Rat Models Revealed Protective Function of Scoparone against Alcohol Induced Hepatotoxicity. Sci. Rep. 4 (1), 6768–8. doi:10.1038/srep06768
Zhang, A., Sun, H., Yan, G., Wang, P., and Wang, X. (2015). Metabolomics for Biomarker Discovery: Moving to the Clinic. Biomed. Res. Int. 2015, 354671. doi:10.1155/2015/354671
Zhang, A.-h., Sun, H., Han, Y., Yan, G.-l., Yuan, Y., Song, G.-c., et al. (2013). Ultraperformance Liquid Chromatography-Mass Spectrometry Based Comprehensive Metabolomics Combined with Pattern Recognition and Network Analysis Methods for Characterization of Metabolites and Metabolic Pathways from Biological Data Sets. Anal. Chem. 85 (15), 7606–7612. doi:10.1021/ac401793d
Zhang, X.-O., Wang, H.-B., Zhang, Y., Lu, X., Chen, L.-L., and Yang, L. (2014). Complementary Sequence-Mediated Exon Circularization. Cell 159 (1), 134–147. doi:10.1016/j.cell.2014.09.001
Zhang, X. H.-F., Leslie, C. S., and Chasin, L. A. (2005). Computational Searches for Splicing Signals. Methods 37 (4), 292–305. doi:10.1016/j.ymeth.2005.07.011
Zheng, G. X., Terry, J. M., Belgrader, P., Ryvkin, P., Bent, Z. W., Wilson, R., et al. (2017). Massively Parallel Digital Transcriptional Profiling of Single Cells. Nat. Commun. 8 (1), 14049–14112. doi:10.1038/ncomms14049
Zheng, G. X. Y., Lau, B. T., Schnall-Levin, M., Jarosz, M., Bell, J. M., Hindson, C. M., et al. (2016). Haplotyping Germline and Cancer Genomes with High-Throughput Linked-Read Sequencing. Nat. Biotechnol. 34 (3), 303–311. doi:10.1038/nbt.3432
Zheng, Y., Ji, P., Chen, S., Hou, L., and Zhao, F. (2019). Reconstruction of Full-Length Circular RNAs Enables Isoform-Level Quantification. Genome Med. 11 (1), 2–20. doi:10.1186/s13073-019-0614-1
Zhou, X., Ren, L., Meng, Q., Li, Y., Yu, Y., and Yu, J. (2010). The Next-Generation Sequencing Technology and Application. Protein Cell 1 (6), 520–536. doi:10.1007/s13238-010-0065-3
Zhu, J., Mayeda, A., and Krainer, A. R. (2001). Exon Identity Established through Differential Antagonism between Exonic Splicing Silencer-Bound hnRNP A1 and Enhancer-Bound SR Proteins. Mol. Cel. 8 (6), 1351–1361. doi:10.1016/s1097-2765(01)00409-9
Keywords: Single nucleotide polymorphisms (SNPs), Human Splice finder (HSF), Next Generation Sequencing (NGS), in silico, bioinformatics
Citation: Bhat GR, Sethi I, Rah B, Kumar R and Afroze D (2022) Innovative in Silico Approaches for Characterization of Genes and Proteins. Front. Genet. 13:865182. doi: 10.3389/fgene.2022.865182
Received: 29 January 2022; Accepted: 11 April 2022;
Published: 18 May 2022.
Edited by:
Prashanth N Suravajhala, Amrita Vishwa Vidyapeetham University, IndiaReviewed by:
Christos K. Kontos, National and Kapodistrian University of Athens, GreeceGeorge Potamias, Foundation for Research and Technology Hellas (FORTH), Greece
Indra Mani, University of Delhi, India
Copyright © 2022 Bhat, Sethi, Rah, Kumar and Afroze. This is an open-access article distributed under the terms of the Creative Commons Attribution License (CC BY). The use, distribution or reproduction in other forums is permitted, provided the original author(s) and the copyright owner(s) are credited and that the original publication in this journal is cited, in accordance with accepted academic practice. No use, distribution or reproduction is permitted which does not comply with these terms.
*Correspondence: Dil Afroze, YWZyb3plZGlsQGdtYWlsLmNvbQ==