 Yuxin Sun
 Daxing Cai
 Weitao Hu
 Taiyong Fang
- 1Department of Gastroenterology, The Second Affiliated Hospital of Fujian Medical University, Quanzhou, Fujian, China
- 2Department of Rheumatology, The Second Affiliated Hospital of Fujian Medical University, Quanzhou, Fujian, China
Introduction: Crohn’s disease (CD) is a disease that manifests mainly as chronic inflammation of the gastrointestinal tract, which is still not well understood in terms of its pathogenesis. The aim of this study was to use bioinformatics analysis to identify differentially expressed genes (DEGs) and miRNAs with diagnostic and therapeutic potential in CD.
Materials and methods: Three CD datasets (GSE179285, GSE102133, GSE75214) were downloaded from the Gene Expression Omnibus (GEO) database. DEGs between normal and CD tissues were identified using the GEO2R online tool. The Gene Ontology (GO) term and Kyoto Encyclopedia of Genes and Genomes (KEGG) pathway enrichment analyses of the DEGs were conducted using the clusterProfiler function in the R package. Protein-protein interaction network (PPI) analysis and visualization were performed with STRING and Cytoscape. Ten hub genes were identified using cytoHubba’s MCC algorithm and validated with datasets GSE6731 and GSE52746. Finally, the miRNA gene regulatory network was constructed by Cytoscape and NetworkAnalyst to predict potential microRNAs (miRNAs) associated with DEGs.
Results: A total of 97 DEGs were identified, consisting of 88 downregulated genes and 9 upregulated genes. The enriched functions and pathways of the DEGs include immune system process, response to stress, response to cytokine and extracellular region. KEGG pathway analysis indicates that the genes were significantly enriched in Cytokine-cytokine receptor interaction, IL-17 signaling pathway, Rheumatoid arthritis and TNF signaling pathway. In combination with the results of the protein-protein interaction (PPI) network and CytoHubba, 10 hub genes including IL1B, CXCL8, CXCL10, CXCL1, CXCL2, CXCL5, ICAM1, IL1RN, TIMP1 and MMP3 were selected. Based on the DEG-miRNAs network construction, 5 miRNAs including hsa-mir-21-5p, hsa-mir-93-5p, hsa-mir-98-5p, hsa-mir-1-3p and hsa-mir-335-5p were identified as potential critical miRNAs.
Conclusion: In conclusion, a total of 97 DEGs, 10 hub genes and 5 miRNAs that may be involved in the progression or occurrence of CD were identified in this study, which could be regarded as biomarkers of CD.
Introduction
Crohn’s disease (CD) is one of the inflammatory bowel diseases (IBD), mainly manifesting as chronic inflammation of different parts of the gastrointestinal tract, with a progressive and destructive course, whose incidence has been increasing in recent years (Roda et al., 2020). CD is still unclear in its etiology, but genetic, immune, and environmental factors increase its risk of development and progression (Torres et al., 2017). Crohn’s disease shows an overlap with regard to disease behaviour with ulcerative colitis (Atreya and Siegmund, 2021). The course of CD is progressive and destructive, and systemic and extra-intestinal manifestations can occur, which can seriously affect the quality of life and prognosis in patients (Ananthakrishnan et al., 2018).
Currently, promoting mucosal healing is the preferred treatment aim for CD (Bernstein et al., 2019). The use of anti-inflammatory treatments such as infliximab, adalimumab and Vedolizumab, for example, has transformed the management of CD in the last 2 decades (Dulai et al., 2016; Feagan et al., 2016). Although these targeted biologic therapies represent a significant advance in the treatment of CD, there are still some patients who are not sensitive to the targeted drugs (anti-TNF antibodies such as infliximab and adalimumab) that have been identified (Schmitt et al., 2021). However, biomarkers may help clinicians characterize disease severity and prognosis in early diagnosis and intervention, whereas biomarkers may be useful in defining treatment response and predicting postoperative CD recurrence. Therefore, the research and discovery of the precise molecular mechanisms of the disease are essential for the development of therapeutic strategies for CD.
Bioinformatics is an emerging subject that is already widely used for early diagnosis and predicting the prognosis of cancer patients (Wang and Liotta, 2011). This new approach has been used broadly in the study of various cancers (Li et al., 2017; Yan et al., 2018; Tsai and Gamblin, 2019), and has also played a role in the identification of a few new biomarkers for non-oncology diseases (Chen et al., 2018; Cakmak and Demir, 2020; Xie et al., 2020). Microarray technology is widely used to screen for genomic level differential alterations and can be used to participate in the prediction of CD development and progression. Nie et al. identified TLR2, TREM1, CXCR1, FPR1, and FPR2 as promising candidates for predicting anti-TNFα responses in CD patients by microarray analysis (Nie et al., 2022). Hu et al. found that Hsa_circ_0062142 and hsa_circ_0001666 may play a key role in pathogenesis and serve as potential biomarkers of CD by microarray analysis (Hu et al., 2021). MicroRNAs (miRNAs) are 19–25 nucleotide single-stranded non-coding RNA molecules which can inhibit translation and destabilize messenger RNAs (mRNAs). MiRNAs regulate gene expression by binding to mRNAs and may play a critical modulatory function in the progression of CD (Kalla et al., 2015). Growing evidence suggests that miRNAs contribute significantly to the complicated etiology and pathogenesis in CD (Schaefer et al., 2015). However, reliable results from individual microarray analysis are difficult to obtain owing to its high false positive rate. Accordingly, in our study, we downloaded 3 mRNA microarray datasets from Gene Expression Omnibus (GEO) and performed them to identify DEGs between normal and CD intestinal mucosal tissues. Afterwards, enrichment analysis of GO terms and KEGG pathways and PPI network analysis were conducted to identify the underlying molecular mechanisms of CD onset and progression. Lastly, miRNA gene regulatory networks were construct for predicting potential microRNAs (miRNAs) associated with DEGs with the use of Cytoscape and NetworkAnalyst. In summary, there were 97 DEGs, 10 hub genes and 5 potential miRNAs that were identified as potential target biomarkers for CD.
Materials and methods
Microarray data
GEO (http://www.ncbi.nlm.nih.gov/geo) (Edgar et al., 2002) is a public functional genomics data repository of high throughput gene expression data, chips and microarrays. The GSE75214 (Vancamelbeke et al., 2017) and GSE102133 (Verstockt et al., 2019) datasets generated using the Affymetrix GPL6244 platform, (Affymetrix Human Genome 1.0 ST Array), and GSE179285 (Keir et al., 2021) generated on the GPL6480 platform (Agilent-014850 Whole Human Genome Microarray 4 × 44K G4112F) were downloaded from GEO. Annotated information from the platform was used to convert the probes to the corresponding gene symbols. The GSE179285 dataset contained 47 CD intestinal mucosa tissue samples and 31 controls; the GSE75214 dataset contained 59 CD samples and 22 healthy controls; and the GSE102133 dataset contained 65 intestinal mucosal biopsies from CD patients and 12 intestinal mucosal tissues from controls.
Identification of DEGs
Identification of DEGs between CD and normal samples was performed using GEO2R (http://www.ncbi.nlm.nih.gov/geo/geo2r). GEO2R is an online interactive tool that allows users to identify DEGs for different experimental conditions by comparing two datasets in the GEO series (Barrett et al., 2013). Adjusted p-values (adj. P) and Benjamini and Hochberg’s false discovery rates were applied to provide a balance between discovering statistically significant genes and limiting false positives. Probe sets without corresponding gene symbols or genes with more than one probe set were deleted or normalized, respectively. |Log FC (fold change)| >1 and adj. p-value <0.01 were considered statistically significant.
Enrichment analysis of KEGG and GO for DEGs
KEGG is a database resource for elucidating high-level functions and effects of biological systems (Kanehisa, 2002; Kanehisa et al., 2017). GO is a major bioinformatics initiative for high-quality functional gene annotation based on biological processes (BP), molecular functions (MF) and cellular components (CC) (Pomaznoy et al., 2018). GO term and KEGG pathway analyses were conducted using the clusterProfiler function in the R package. The cutoff criteria of p < 0.05 and FDR <0.05 were defined as significant.
Construction of PPI network and module analysis
The PPI network was constructed using the Search Tool for the Retrieval of Interacting Genes (STRING; http://string-db.org) (version 11.5) (Franceschini et al., 2013) online database. Cytoscape (version 3.9.1) is an open-source bioinformatics software platform for visualizing molecular interaction networks (Smoot et al., 2011). Molecular Complex Detection (MCODE) (version 2.0) is a plug-in in Cytoscape used to identify densely connected regions by clustering a given network based on the topology (Bandettini et al., 2012). Using Cytoscape to map the PPI network, the MCODE was used to identify the most significant modules in the PPI network. The following selection criteria were used: MCODE scores >5, degree cut-off = 2, node score cut-off = 0.2, Max depth = 100 and k-score = 2.
Selection and analysis of hub genes
The top 10 genes were obtained using MCC algorithm with Cytoscape’s plug-in cytoHubba. GO term and KEGG pathway analyses were conducted using the clusterProfiler function in the R package.
Validation of hub gene expression of CD datasets
The two microarray datasets of CD (GSE6731: 7 inflamed CD vs. 4 healthy controls; GSE52746:10 active CD vs. 17 healthy controls) that were retrieved from the GEO database were used to verify the expressions of the hub genes The “limma” package was also applied to identify the DEGs with thresholds of |log2FC| ≥ 1 and adjust. p < 0.05. The results were visualized in volcano plots and the hub genes were marked.
MiRNAs related to hub genes
The top 9 hub genes were mapped to the respective miRNAs with NetworkAnalyst 3.0 (Zhou et al., 2019) (https://www.networkanalyst.ca/), an online platform for visualization that helps to identify miRNA-gene interactions in Gene Regulatory Networks. For each hub gene, miRNAs were identified as having a degree cutoff = 1.0. Lastly, a mapping of these hub genes and miRNAs was performed by Cytoscape 3.9.1.
Results
Identification of DEGs in CD
A total of three datasets (GSE179285, GSE75214 and GSE102133) containing gene expression profiles of both healthy and CD-active intestinal mucosal tissue samples were obtained from the GEO database. Details for the three datasets are shown in Table 1. DEGs were identified after normalization of microarray results (634 in GSE179285, 388 in GSE75214, and 291 in GSE102133). A total of 517 upregulated and 117 downregulated genes, 303 upregulated and 85 downregulated genes and 191 upregulated and 100 downregulated genes were included in the DEGs in the GSE179285, GSE75214 and GSE102133 datasets, respectively. All DEGs were identified by comparison of the gene expression profiles of normal healthy controls and CD samples. Figure 1 shows the gene expression profiles of DEGs in three datasets containing data from 2 sets of samples.
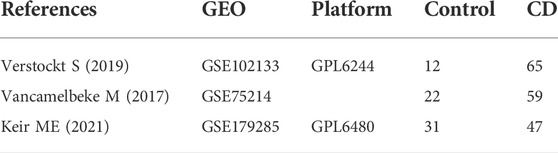
TABLE 1. Details for GEO Crohn’s disease data.
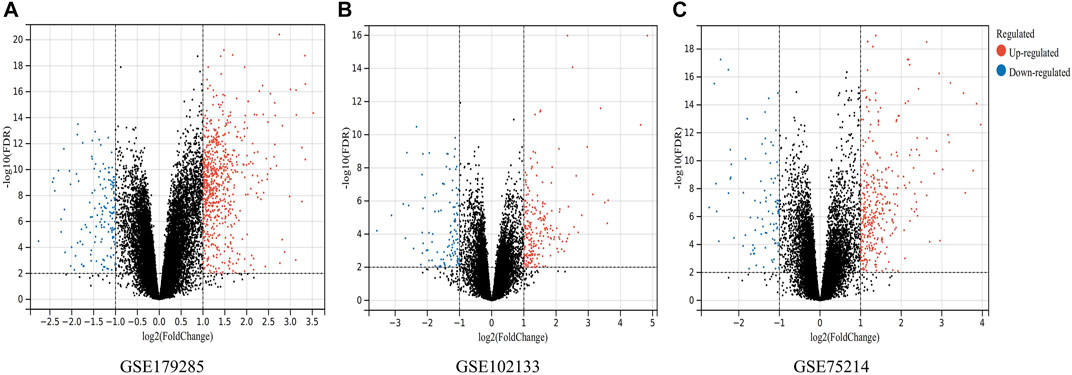
FIGURE 1. Volcano plots indicating differentially expressed genes (DEGs) among the control and CD groups. (A–C) DEGs of the GSE179285, GSE102133 and GSE75214 datasets are shown, separately. Red data points represent upregulated genes and blue ones represent downregulated genes. Genes without any significant differences are in black.
Such genes were presented by further screening and Venn diagrams were drawn to demonstrate these genes. The 97 DEGs were found to be significantly differentially expressed in the 3 groups, as shown in Figure 2, with 88 genes upregulated and 9 genes downregulated (Table 2).
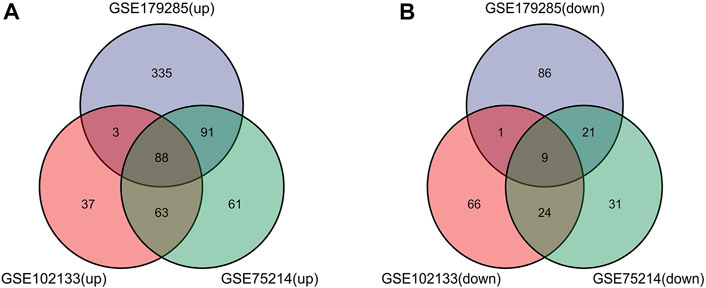
FIGURE 2. Venn diagrams showing the differentially expressed genes (DEGs) that overlapped among the 3 datasets retrieved from Gene Expression Omnibus (GEO). (A,B) Indicate the overlap of upregulated and downregulated genes in the GSE179285, GSE102133 and GSE75214 datasets, separately.
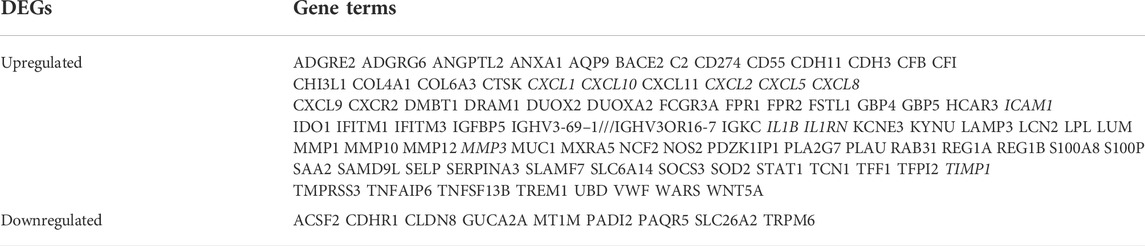
TABLE 2. Screening DEGs in Crohn’s disease patients by integrated microarray.
Enrichment analysis of KEGG and GO for DEGs
In order to make predictions about the biological functions of DEGs, we carried out functional enrichment analysis of upregulated and downregulated genes. Results of GO analysis showed that the upregulated genes were mainly enriched in immune system process, response to stress, response to cytokine and extracellular region (Figure 3A), while the downregulated genes were significantly enriched in cell projection membrane and plasma membrane region (Figure 3B). KEGG pathway analysis indicated that the DEGs were significantly enriched in Cytokine-cytokine receptor interaction, IL-17 signaling pathway, Rheumatoid arthritis and TNF signaling pathway (Figure 3C).
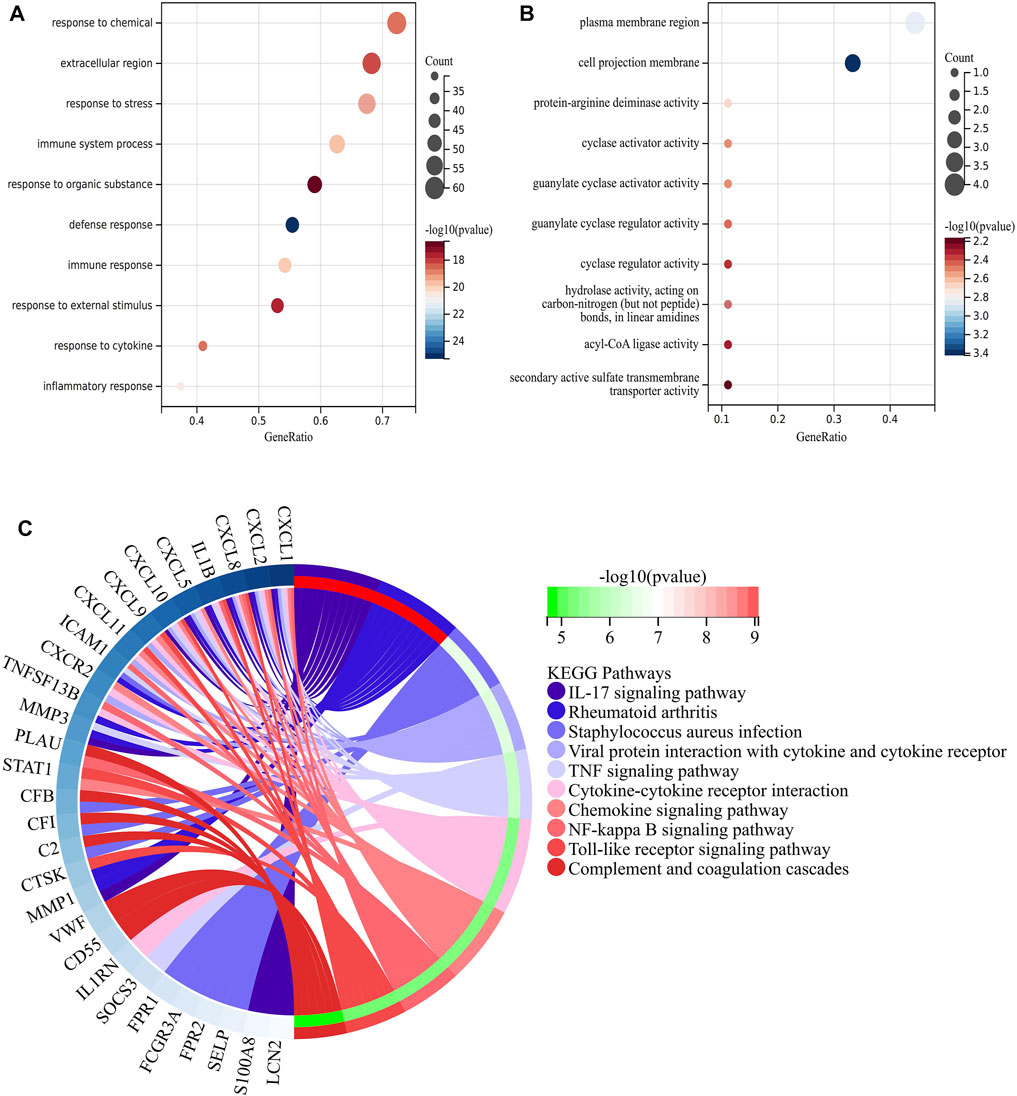
FIGURE 3. Function enrichment analysis of DEGs related to CD. (A) Bubble plot of enriched GO terms showing upregulated DEGs. (B) Bubble plot of enriched GO terms showing downregulated DEGs. A darker color and a larger bubble denote a more significant difference. (C) KEGG enrichment analysis of DEGs related to CD; The genes are linked to their assigned pathway terms via colored ribbons and are ordered according to the observed log10 p-value, which is displayed in descending intensity of red-green squares next to the selected genes.
PPI network construction, module analysis and hub genes identification
PPI analysis of the DEGs was based on the STRING database and the results were visualized using Cytoscape (Figure 4A). Using MCODE, a plug-in in Cytoscape, we identified the most densely connected regions (13 nodes, 75 edges) in the PPI network (Figure 4B). The top 10 genes, including IL1B, CXCL8, CXCL10, CXCL1, CXCL2, CXCL5, ICAM1, IL1RN, TIMP1 and MMP3, were obtained using MCC algorithm with Cytoscape’s plug-in cytoHubba (Figure 4C). The results showed that IL1B (Interleukin 1 Beta, score 4.21E+07) and CXCL8(C-X-C motif chemokine ligand 8, score 4.21E+07) were the most significant genes, followed by CXCL10(C-X-C motif chemokine ligand 10, score 4.20E+07), CXCL1(C-X-C motif chemokine ligand 1, score 4.19E+07), CXCL2(C-X-C motif chemokine ligand 2, score 4.19E+07), CXCL5(C-X-C motif chemokine ligand 5, score 4.18E+07), ICAM1(Intercellular adhesion molecule 1, score 4.17E+07), IL1RN(Interleukin-1 receptor antagonist protein, score 4.10E+07), TIMP1(Metallopeptidase inhibitor 1, score 4.03E+07) and MMP3(Matrix metalloproteinase-3, score 4.03E+07).
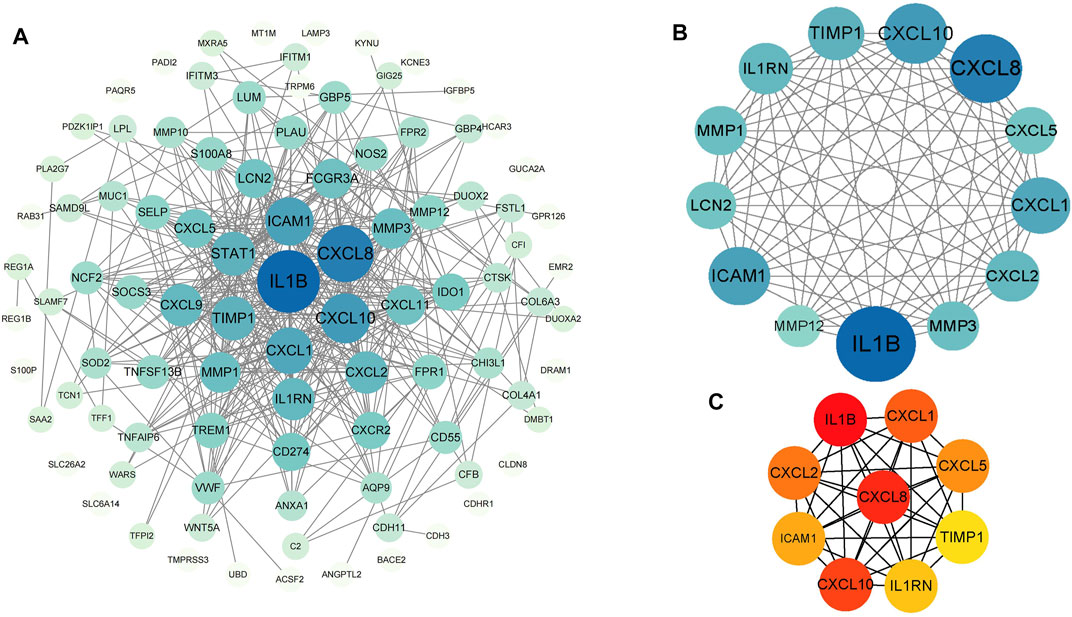
FIGURE 4. PPI networks of 88 upregulated genes and 9 downregulated genes by Cytoscape. The network consists of 97 nodes and 376 edges. 2 edges between nodes represent the interactions between genes. Each gene corresponding to the node is sized and colored according to the degree of interaction. The color grade indicates the change in the degree of each gene from high (blue) to low (white). The nearer the blue node, the higher the connection between the 2 nodes (A). The densest connected region in the PPI network (13 nodes, 75 edges) was identified using MCODE (B). Using the MCC algorithm in cytoHubba, 10 hub genes were identified in the densest connected regions. The scores are shown in red color. A darker color means a higher score (C).
Analysis of hub genes
The symbols, abbreviations and functions of the hub genes are listed in Table 3. Functional enrichment analysis revealed 10 hub genes mainly centered on biological processes (BP), such as cytokine-mediated signaling pathway, regulation of signaling receptor activity, cellular response to cytokine stimulus, response to cytokine, while KEGG was mainly focused on IL-17 signaling pathway, Rheumatoid arthritis, TNF signaling pathway, Cytokine-cytokine receptor interaction and NF-kappa B signaling pathway (Figures 5A,B; Table 4).
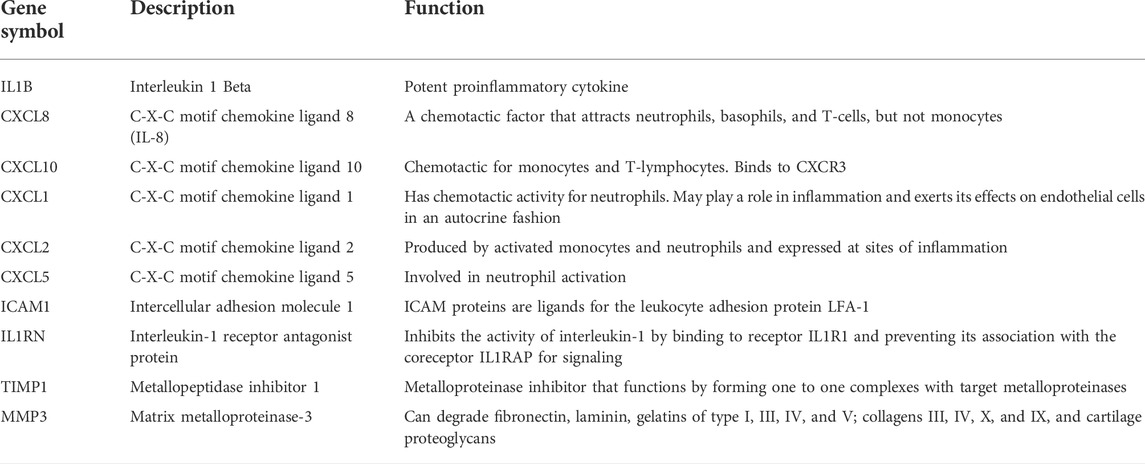
TABLE 3. 10 hub genes and their functions.
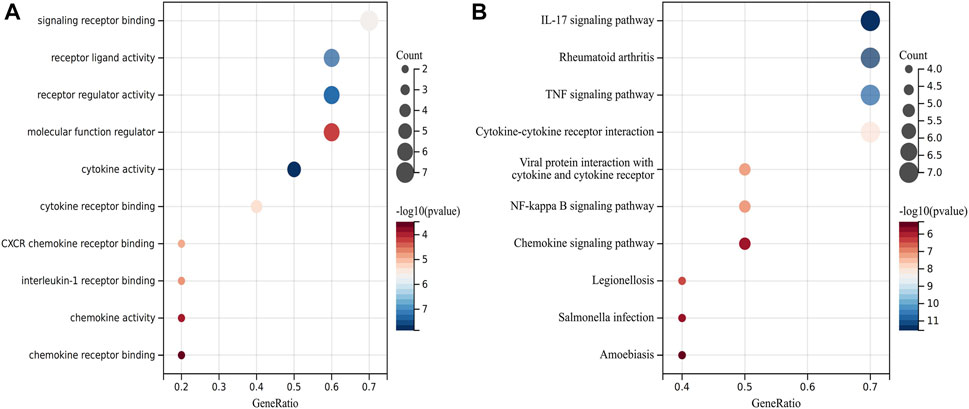
FIGURE 5. Analysis of functional enrichment for hub genes. (A) Bubble plot of enriched GO terms showing hub genes. (B) Bubble plot of enriched KEGG showing hub genes.
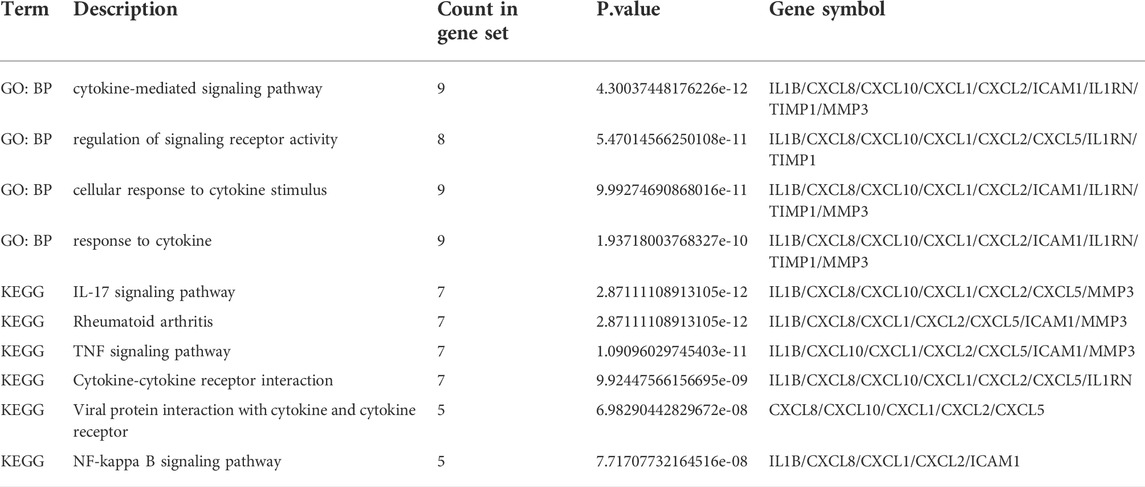
TABLE 4. Functional enrichment analysis of hub genes.
Validation of hub gene expression in CD
To determine whether the hub genes were differentially expressed in the datasets of CD, we selected two other microarray datasets (GSE52746 and GSE6731) for analysis. A total of 464 DEGs were found in GSE52746 and 167 DEGs were found in GSE6731 (Figures 6A,B). In dataset GSE52746, all 10 previously screened hub genes were upregulated DEGs; whereas in dataset GSE6731, all the hub genes were upregulated DEGs except CXCL5 and MMP3.
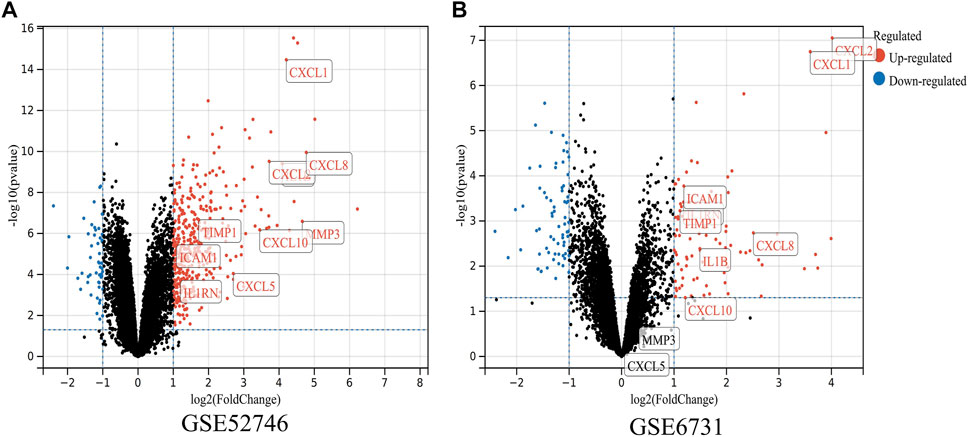
FIGURE 6. Validation of the expressions of hub genes in CD. (A,B) DEGs of the GSE52746 and GSE6731 datasets are shown, separately. Red data points represent upregulated genes and blue ones represent downregulated genes. Genes without any significant differences are in black.
Establishment of miRNAs-hub genes regulatory network
MiRNAs perform multiple roles in regulating gene expression. Based on the NetworkAnalyst database, Cytoscape was used to construct miRNAs-hub genes regulatory networks to identify miRNAs aimed at hub genes. Finally, all of the 10 genes, with the exception of IL1RN, were identified to be related to miRNAs.9 hub genes and their correspondent regulatory miRNAs molecules are shown in Figure 7 and Table 5. Hsa-mir-21-5p had 3 target genes (ICAM1, CXCL10 and IL1B). Among the 9 hub genes, CXCL2, CXCL8 and ICAM1 were common targets of 2 miRNAs (hsa-mir-98-5p and hsa-mir-335-5p).
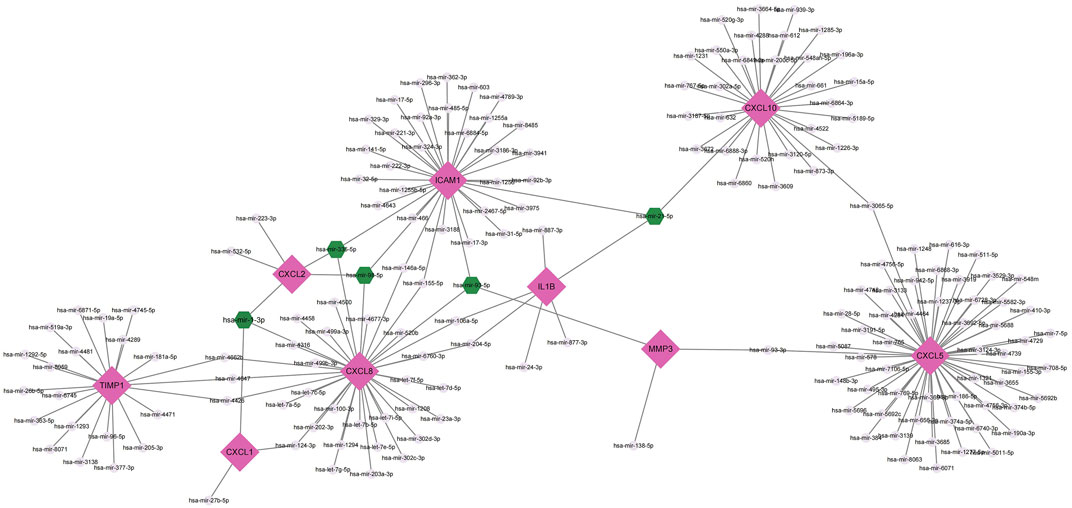
FIGURE 7. Top 9 hub genes in the integrated miRNA-DEGs network. The pink diamond shape indicates the 9 hub genes. The grey circles indicate miRNAs with low connective properties to the hub genes. Green hexagons indicate miRNAs with high connective properties to the hub genes.
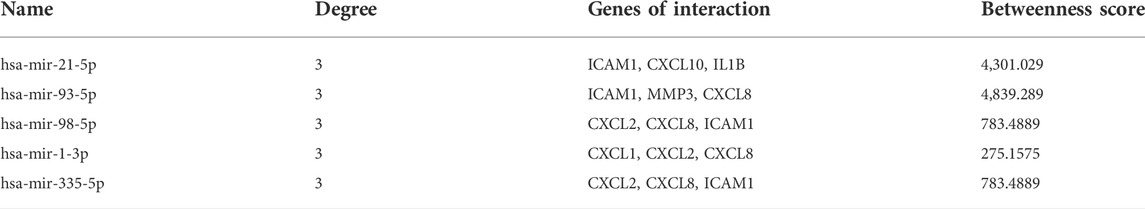
TABLE 5. The critical miRNAs in CD.
Discussion
Bioinformatics studies have enriched the field of complex polygenic diseases and have helped to identify several genes responsible for CD, thus providing new insights into the pathogenesis of CD. In this study, 97 DEGs were identified, consisting of 88 upregulated genes and 9 downregulated genes. The results of GO functional classification indicated that the DEGs were mainly enriched in immune system process, response to stress, response to cytokine and extracellular region. KEGG pathway analysis indicated that the DEGs were significantly enriched in IL-17 signaling pathway, Rheumatoid arthritis, TNF signaling pathway and Cytokine-cytokine receptor interaction. In the PPI network of DEGs, 10 (IL1B, CXCL8, CXCL10, CXCL1, CXCL2, CXCL5, ICAM1, IL1RN, TIMP1 and MMP3) out of 97 genes had high degree of interation. All of the 10 hub genes were upregulated in patients with CD. GO term analysis showed that these 10 genes were highly enriched in cytokine-mediated signaling pathway, regulation of signaling receptor activity, cellular response to cytokine stimulus, response to cytokine, while KEGG pathway analysis were mainly enriched IL-17 signaling pathway, Rheumatoid arthritis, TNF signaling pathway, Cytokine-cytokine receptor interaction and NF-kappa B signaling pathway. Numerous studies have suggested that the pro-inflammatory cytokine IL17 is associated with the pathogenesis of CD (Schmitt et al., 2021). Through the action of the TNF signaling pathway, anti-TNF therapy was approved for Crohn’s disease in 1998 and has transformed the treatment landscape, allowing for improved patient response and remission rates (Adegbola et al., 2018). A variety of complex roles regarding NF-κB signaling in the pathogenesis of IBD have also been elucidated in previous studies (Huang et al., 2019; Nguyen et al., 2021). These enrichment results for GO terms and the KEGG pathway indicate that the DEGs or hub genes found in our study might be participating in the disease progression of CD by the aforementioned means.
The IL17 and IL23 signaling pathways could trigger a cascade of pro-inflammatory molecules such as TNF, IL22, lymphotoxin, IL1B and lipopolysaccharide (LPS) thus affecting the progression of CD (Schmitt et al., 2021). IL23 binding to the receptor activates Janus kinase 2 (JAK2) and tyrosine kinase 2 (TYK2), which leads to subsequent signal transduction and phosphorylation of transcriptional activator 3 (STAT3) in the p19 subunit and STAT4 in the p40 subunit, and subsequent IL23R signaling initiation leads to the activation of several pathways including P38 MAPK, PI3K-Akt, and NFкB. Activation of these pathways leads to the release of CD-associated cytokines such as IL17A, IL17F, or IL22, which contribute in the pathogenesis of CD (Cho et al., 2006; Floss et al., 2013; Razawy et al., 2018).
IL1B (IL-1β) is a pivotal mediator in the inflammatory response and is essential for both host response and defense against pathogens (Lopez-Castejon and Brough, 2011). It has been shown that alterations in IL1B gene expression can be a predictive factor for non-response to anti-TNF treatment among patients with CD (Lykowska-Szuber et al., 2021). It has been indicated that IL-1β could be a target for potential clinical intervention in patients with colitis who have not responded to the neutralization of TNFα (De Santis et al., 2017). In the present study, IL1B was the most significant upregulated gene, which indicated its possible use as a potential indicator for the diagnosis of CD.
CXC chemokines can be divided into two groups: the ELR + CXC family is structurally characterized by a Glu-Leu-Arg tripeptide pattern at its N-terminal end; CXCL1, CXCL2, CXCL5, and CXCL8 belong to the ELR + CXC family. Unlike the ELR + CXC family, the ELR-CXC family lacks this tripeptide pattern, to which CXCL10 belongs (Clark-Lewis et al., 1993; Strieter et al., 1995). Several ELR + CXC chemokines have been identified in association with IBD: CXCL1-2, CXCL5 and CXCL8 chemokines are significantly expressed in areas of intestinal inflammation in patients with IBD compared to normal tissues (Autschbach et al., 2002; Banks et al., 2003; Gijsbers et al., 2004). Dhawan et al. showed that high CXCL8 expression was associated with reduced expression of choline acetyltransferase in resected intestinal epithelial cells from patients with CD (Dhawan et al., 2015). ELR-CXC chemokines are highly responsive to memory T cells and NK cells (Cole et al., 1998; Cole et al., 2001). CXCL10 is a ligand for the CXCR3 receptor and its activation leads to the recruitment of T lymphocytes and the perpetuation of mucosal inflammation (Ostvik et al., 2013). It has been suggested that atorvastatin to reduce plasma CXCL10 levels may be a candidate for future treatment of Crohn’s disease (Grip and Janciauskiene, 2009). In our study, all 5 chemokines were upregulated in CD patients, suggesting a potential role in the future as biological targets to forecast and guide CD therapy.
ICAM1 causes leukocytes to migrate to the inflamed mucosa by binding to its receptor. (Dustin et al., 1986). Anti-ICAM-1 antibodies have been shown to reduce colitis and prolong the survival of dss-induced ICAM-1-deficient mice (Bendjelloul et al., 2000). ICAM1 has been suggested as a possible early predictor that can determine the response to vedolizumab treatment in CD patients (Holmer et al., 2020). In combination with our study, ICAM1 may serve as a molecular target for the treatment of CD in the future.
TIMP1 is one of the four members of the glycoproteome (TIMP1-4), whose main function is the translocation of the extracellular matrix, while it is involved in various pathological processes, including wound healing (Gardner and Ghorpade, 2003). TIMP1 has been used as a predictor of CD-associated intestinal strictures (Zorzi et al., 2012). Further research is needed to determine whether TIMP1 can be used as a therapeutic target for CD.
IL1RN (IL-1RA) is a competitive inhibitor of naturally occurring interleukin-1 (IL-1)-induced pro-inflammatory activity (Witkin et al., 2002). Dobre et al. suggested that transcript levels of IL1RN are candidate biomarkers that can contribute to the differential diagnosis of UC and CD in clinical practice (Dobre et al., 2018). A study by Bank et al. suggested that genetic polymorphisms involved in the regulation of the cytokine pathway (IL1RN) were associated with the response to anti-TNF therapy (Bank et al., 2019). Infliximab is effective in inducing and maintaining remission in CD patients, and MMP3 has been shown to be a promising biomarker for predicting primary non-response to infliximab (Li et al., 2021). The role of MMP3 and IL1RN in CD is still unexplored and more studies are needed to clarify it.
For microRNAs (miRNAs), a major role is to regulate the expression of most human genes; they perform a crucial function in the development of autoimmune diseases, including CD (Zhou et al., 2021a). The results of our study suggest that several miRNAs, including hsa-mir-21-5p, hsa-mir-93-5p, hsa-mir-98-5p, hsa-mir-1-3p, and hsa-mir-335-5p, may play critical roles in CD. It has been shown that elevated levels of miR-21-5p in the stool of IBD patients could be a guide for the noninvasive clinical diagnosis of IBD (Zhou et al., 2021b). It has been demonstrated that miR-93-5p is upregulated before surgery and downregulated in relapsed CD patients (Moret-Tatay et al., 2021). Wang et al. found that the lncRNA MEG3 could improve ulcerative colitis by upregulating miR-98-5p-Sponed IL-10 (Wang et al., 2021). It has been shown that MiR-1-3p and MiR-124-3p could synergistically disrupt the intestinal barrier in the aging colon to promote the development of IBD (Sun et al., 2022). However, the relationship between mir-335-5p and CD has not been reported and needs to be explored further. In previous studies, mir-335-5p has been found to inhibit the inflammatory response in chronic rhinosinusitis (Gu et al., 2020); and moreover mir-335-5p could alleviate the inflammatory response and airway fibrosis by modulating ATG5, resulting in relief of childhood asthma (Liang et al., 2022). It is also shown that fibroblasts with high ICAM1 expression act as a key driver of inflammation and play a facilitative role in the process of fibrosis (Layton et al., 2020). In our study, miR-335-5p was interlinked with CXCL2, CXCL8 and ICAM1, which led us to speculate that miR-335-5p may alleviate the progression of CD by suppressing the intestinal inflammatory response (CXCL2, CXCL8) and intestinal fibrosis (ICAM1). These results may provide us with new research ideas about their interactions in CD. In addition, studies about genes and miRNAs in CD remains to be limited.
There is no doubt that gene-miRNA regulatory networks act as an essential role in the CD mechanism. This not only enhances the understanding of CD, but also provides targeted therapeutic strategies and predictions for CD. The study is limited in that microarray expression profiles were analyzed using bioinformatics analysis and not validated with primary experiments. Additionally, we did not explore the detailed mechanisms for how hub genes and miRNAs modulate CD. As a result, further validation of our findings with additional clinical samples and research is necessary in the future.
Conclusion
In conclusion, a total of 97 DEGs, 10 hub genes and 5 miRNAs (hsa-mir-21-5p, hsa-mir-93-5p, hsa-mir-98-5p, hsa-mir-1-3p, and hsa-mir-335-5p) that may be involved in the progression or occurrence of CD were identified in this study, which could be regarded as biomarkers of CD. In addition, these hub genes act mainly on IL-17 signaling pathway, TNF signaling pathway, and NF-kappa B signaling pathway to influence the progression of CD. However, further studies are still needed to define their biofunction in CD.
Data availability statement
Publicly available datasets were analyzed in this study. This data can be found here: https://www.ncbi.nlm.nih.gov/geo/.
Author contributions
YS and DC participated in the design of the study, carried out the study, performed the statistical analysis, and drafted the manuscript. WH helped to carried out the study. TF reviewed and edited the manuscript. All authors read and approved the final manuscript.
Funding
This work was support by Quanzhou City Science & Technology Program of China (No. 2021N003S).
Acknowledgments
Thanks to all the people in our laboratory for their help.
Conflict of interest
The authors declare that the research was conducted in the absence of any commercial or financial relationships that could be construed as a potential conflict of interest.
Publisher’s note
All claims expressed in this article are solely those of the authors and do not necessarily represent those of their affiliated organizations, or those of the publisher, the editors and the reviewers. Any product that may be evaluated in this article, or claim that may be made by its manufacturer, is not guaranteed or endorsed by the publisher.
References
Adegbola, S. O., Sahnan, K., Warusavitarne, J., Hart, A., and Tozer, P. (2018). Anti-Tnf Therapy in Crohn's Disease. Int. J. Mol. Sci. 19 (8), E2244. doi:10.3390/ijms19082244
Ananthakrishnan, A. N., Bernstein, C. N., Iliopoulos, D., Macpherson, A., Neurath, M. F., Ali, R. A. R., et al. (2018). Environmental Triggers in Ibd: a Review of Progress and Evidence. Nat. Rev. Gastroenterol. Hepatol. 15 (1), 39–49. doi:10.1038/nrgastro.2017.136
Atreya, R., and Siegmund, B. (2021). Location Is Important: Differentiation between Ileal and Colonic Crohn's Disease. Nat. Rev. Gastroenterol. Hepatol. 18 (8), 544–558. doi:10.1038/s41575-021-00424-6
Autschbach, F., Giese, T., Gassler, N., Sido, B., Heuschen, G., Heuschen, U., et al. (2002). Cytokine/chemokine Messenger-RNA Expression Profiles in Ulcerative Colitis and Crohn's Disease. Virchows Arch. 441 (5), 500–513. doi:10.1007/s00428-002-0684-z
Bandettini, W. P., Kellman, P., Mancini, C., Booker, O. J., Vasu, S., Leung, S. W., et al. (2012). MultiContrast Delayed Enhancement (MCODE) Improves Detection of Subendocardial Myocardial Infarction by Late Gadolinium Enhancement Cardiovascular Magnetic Resonance: a Clinical Validation Study. J. Cardiovasc. Magn. Reson. 14, 83. doi:10.1186/1532-429X-14-83
Bank, S., Julsgaard, M., Abed, O. K., Burisch, J., Broder Brodersen, J., Pedersen, N. K., et al. (2019). Polymorphisms in the NFkB, TNF-Alpha, IL-1beta, and IL-18 Pathways Are Associated with Response to Anti-TNF Therapy in Danish Patients with Inflammatory Bowel Disease. Aliment. Pharmacol. Ther. 49 (7), 890–903. doi:10.1111/apt.15187
Banks, C., Bateman, A., Payne, R., Johnson, P., and Sheron, N. (2003). Chemokine Expression in Ibd. Mucosal Chemokine Expression Is Unselectively Increased in Both Ulcerative Colitis and Crohn's Disease. J. Pathol. 199 (1), 28–35. doi:10.1002/path.1245
Barrett, T., Wilhite, S. E., Ledoux, P., Evangelista, C., Kim, I. F., Tomashevsky, M., et al. (2013). Ncbi Geo: Archive for Functional Genomics Data Sets-Uupdate. Nucleic Acids Res. 41, D991–D995. doi:10.1093/nar/gks1193
Bendjelloul, F., Maly, P., Mandys, V., Jirkovska, M., Prokesova, L., Tuckova, L., et al. (2000). Intercellular Adhesion Molecule-1 (ICAM-1) Deficiency Protects Mice against Severe Forms of Experimentally Induced Colitis. Clin. Exp. Immunol. 119 (1), 57–63. doi:10.1046/j.1365-2249.2000.01090.x
Bernstein, C. N., Hitchon, C. A., Walld, R., Bolton, J. M., Sareen, J., Walker, J. R., et al. (2019). Increased Burden of Psychiatric Disorders in Inflammatory Bowel Disease. Inflamm. Bowel Dis. 25 (2), 360–368. doi:10.1093/ibd/izy235
Cakmak, H. A., and Demir, M. (2020). MicroRNA and Cardiovascular Diseases. Balk. Med. J. 37 (2), 60–71. doi:10.4274/balkanmedj.galenos.2020.2020.1.94
Chen, L., Su, W., Chen, H., Chen, D. Q., Wang, M., Guo, Y., et al. (2018). Proteomics for Biomarker Identification and Clinical Application in Kidney Disease. Adv. Clin. Chem. 85, 91–113. doi:10.1016/bs.acc.2018.02.005
Cho, M. L., Kang, J. W., Moon, Y. M., Nam, H. J., Jhun, J. Y., Heo, S. B., et al. (2006). STAT3 and NF-kappaB Signal Pathway Is Required for IL-23-mediated IL-17 Production in Spontaneous Arthritis Animal Model IL-1 Receptor Antagonist-Deficient Mice. J. Immunol. 176 (9), 5652–5661. doi:10.4049/jimmunol.176.9.5652
Clark-Lewis, I., Dewald, B., Geiser, T., Moser, B., and Baggiolini, M. (1993). Platelet Factor 4 Binds to Interleukin 8 Receptors and Activates Neutrophils when its N Terminus Is Modified with Glu-Leu-Arg. Proc. Natl. Acad. Sci. U. S. A. 90 (8), 3574–3577. doi:10.1073/pnas.90.8.3574
Cole, A. M., Ganz, T., Liese, A. M., Burdick, M. D., Liu, L., and Strieter, R. M. (2001). Cutting Edge: IFN-Inducible ELR- CXC Chemokines Display Defensin-like Antimicrobial Activity. J. Immunol. 167 (2), 623–627. doi:10.4049/jimmunol.167.2.623
Cole, K. E., Strick, C. A., Paradis, T. J., Ogborne, K. T., Loetscher, M., Gladue, R. P., et al. (1998). Interferon-inducible T Cell Alpha Chemoattractant (I-TAC): a Novel Non-ELR CXC Chemokine with Potent Activity on Activated T Cells through Selective High Affinity Binding to CXCR3. J. Exp. Med. 187 (12), 2009–2021. doi:10.1084/jem.187.12.2009
De Santis, S., Kunde, D., Galleggiante, V., Liso, M., Scandiffio, L., Serino, G., et al. (2017). TNFα Deficiency Results in Increased IL-1β in an Early Onset of Spontaneous Murine Colitis. Cell Death Dis. 8 (8), e2993. doi:10.1038/cddis.2017.397
Dhawan, S., Hiemstra, I. H., Verseijden, C., Hilbers, F. W., Te Velde, A. A., Willemsen, L. E. M., et al. (2015). Cholinergic Receptor Activation on Epithelia Protects against Cytokine-Induced Barrier Dysfunction. Acta Physiol. 213 (4), 846–859. doi:10.1111/apha.12469
Dobre, M., Milanesi, E., Manuc, T. E., Arsene, D. E., Tieranu, C. G., Maj, C., et al. (2018). Differential Intestinal Mucosa Transcriptomic Biomarkers for Crohn's Disease and Ulcerative Colitis. J. Immunol. Res. 2018, 9208274. doi:10.1155/2018/9208274
Dulai, P. S., Singh, S., Jiang, X., Peerani, F., Narula, N., Chaudrey, K., et al. (2016). The Real-World Effectiveness and Safety of Vedolizumab for Moderate-Severe Crohn's Disease: Results from the US VICTORY Consortium. Am. J. Gastroenterol. 111 (8), 1147–1155. doi:10.1038/ajg.2016.236
Dustin, M. L., Rothlein, R., Bhan, A. K., Dinarello, C. A., and Springer, T. A. (1986). Induction by IL 1 and Interferon-Gamma: Tissue Distribution, Biochemistry, and Function of a Natural Adherence Molecule (ICAM-1). J. Immunol. 137 (1), 245–254.
Edgar, R., Domrachev, M., and Lash, A. E. (2002). Gene Expression Omnibus: NCBI Gene Expression and Hybridization Array Data Repository. Nucleic Acids Res. 30 (1), 207–210. doi:10.1093/nar/30.1.207
Feagan, B. G., Sandborn, W. J., Gasink, C., Jacobstein, D., Lang, Y., Friedman, J. R., et al. (2016). Ustekinumab as Induction and Maintenance Therapy for Crohn's Disease. N. Engl. J. Med. 375 (20), 1946–1960. doi:10.1056/NEJMoa1602773
Floss, D. M., Mrotzek, S., Klocker, T., Schroder, J., Grotzinger, J., Rose-John, S., et al. (2013). Identification of Canonical Tyrosine-dependent and Non-canonical Tyrosine-independent STAT3 Activation Sites in the Intracellular Domain of the Interleukin 23 Receptor. J. Biol. Chem. 288 (27), 19386–19400. doi:10.1074/jbc.M112.432153
Franceschini, A., Szklarczyk, D., Frankild, S., Kuhn, M., Simonovic, M., Roth, A., et al. (2013). STRING v9.1: Protein-Protein Interaction Networks, with Increased Coverage and Integration. Nucleic Acids Res. 41, D808–D815. doi:10.1093/nar/gks1094
Gardner, J., and Ghorpade, A. (2003). Tissue Inhibitor of Metalloproteinase (TIMP)-1: the TIMPed Balance of Matrix Metalloproteinases in the Central Nervous System. J. Neurosci. Res. 74 (6), 801–806. doi:10.1002/jnr.10835
Gijsbers, K., Van Assche, G., Joossens, S., Struyf, S., Proost, P., Rutgeerts, P., et al. (2004). CXCR1-binding Chemokines in Inflammatory Bowel Diseases: Down-Regulated IL-8/CXCL8 Production by Leukocytes in Crohn's Disease and Selective GCP-2/CXCL6 Expression in Inflamed Intestinal Tissue. Eur. J. Immunol. 34 (7), 1992–2000. doi:10.1002/eji.200324807
Grip, O., and Janciauskiene, S. (2009). Atorvastatin Reduces Plasma Levels of Chemokine (CXCL10) in Patients with Crohn's Disease. PLoS One 4 (5), e5263. doi:10.1371/journal.pone.0005263
Gu, X., Yao, X., and Liu, D. (2020). Up-regulation of microRNA-335-5p Reduces Inflammation via Negative Regulation of the TPX2-Mediated AKT/GSK3β Signaling Pathway in a Chronic Rhinosinusitis Mouse Model. Cell. Signal. 70, 109596. doi:10.1016/j.cellsig.2020.109596
Holmer, A. K., Battat, R., Dulai, P. S., Vande Casteele, N., Nguyen, N., Jain, A., et al. (2020). Biomarkers Are Associated with Clinical and Endoscopic Outcomes with Vedolizumab Treatment in Crohn's Disease. Ther. Adv. Gastroenterol. 13, 1756284820971214. doi:10.1177/1756284820971214
Hu, Y. A., Zhu, Y., Liu, G., Yao, X., Yan, X., Yang, Y., et al. (2021). Expression Profiles of Circular RNAs in Colon Biopsies from Crohn's Disease Patients by Microarray Analysis. J. Clin. Lab. Anal. 35 (6), e23788. doi:10.1002/jcla.23788
Huang, Y. F., Li, Q. P., Dou, Y. X., Wang, T. T., Qu, C., Liang, J. L., et al. (2019). Therapeutic Effect of Brucea Javanica Oil Emulsion on Experimental Crohn's Disease in Rats: Involvement of TLR4/NF-Κb Signaling Pathway. Biomed. Pharmacother. 114, 108766. doi:10.1016/j.biopha.2019.108766
Kalla, R., Ventham, N. T., Kennedy, N. A., Quintana, J. F., Nimmo, E. R., Buck, A. H., et al. (2015). Micrornas: New Players in Ibd. Gut 64 (3), 504–517. doi:10.1136/gutjnl-2014-307891
Kanehisa, M., Furumichi, M., Tanabe, M., Sato, Y., and Morishima, K. (2017). KEGG: New Perspectives on Genomes, Pathways, Diseases and Drugs. Nucleic Acids Res. 45 (D1), D353–D361. doi:10.1093/nar/gkw1092
Kanehisa, M. (2002). The KEGG Database. Novartis Found. Symp. 247, 91–101; discussion 101-103, 119-128, 244-252.
Keir, M. E., Fuh, F., Ichikawa, R., Acres, M., Hackney, J. A., Hulme, G., et al. (2021). Regulation and Role of αE Integrin and Gut Homing Integrins in Migration and Retention of Intestinal Lymphocytes during Inflammatory Bowel Disease. J. Immunol. 207 (9), 2245–2254. doi:10.4049/jimmunol.2100220
Layton, T. B., Williams, L., McCann, F., Zhang, M., Fritzsche, M., Colin-York, H., et al. (2020). Author Correction: Cellular Census of Human Fibrosis Defines Functionally Distinct Stromal Cell Types and States. Nat. Commun. 11 (1), 3275. doi:10.1038/s41467-020-17073-z
Li, L., Chen, R., Zhang, Y., Zhou, G., Chen, B., Zeng, Z., et al. (2021). A Novel Model Based on Serum Biomarkers to Predict Primary Non-response to Infliximab in Crohn's Disease. Front. Immunol. 12, 646673. doi:10.3389/fimmu.2021.646673
Li, L., Lei, Q., Zhang, S., Kong, L., and Qin, B. (2017). Screening and Identification of Key Biomarkers in Hepatocellular Carcinoma: Evidence from Bioinformatic Analysis. Oncol. Rep. 38 (5), 2607–2618. doi:10.3892/or.2017.5946
Liang, Q., He, J., Yang, Q., Zhang, Q., and Xu, Y. (2022). MicroRNA-335-5p Alleviates Inflammatory Response, Airway Fibrosis, and Autophagy in Childhood Asthma through Targeted Regulation of Autophagy Related 5. Bioengineered 13 (1), 1791–1801. doi:10.1080/21655979.2021.1996315
Lopez-Castejon, G., and Brough, D. (2011). Understanding the Mechanism of IL-1β Secretion. Cytokine Growth Factor Rev. 22 (4), 189–195. doi:10.1016/j.cytogfr.2011.10.001
Lykowska-Szuber, L., Walczak, M., Skrzypczak-Zielinska, M., Suszynska-Zajczyk, J., Stawczyk-Eder, K., Waszak, K., et al. (2021). Effect of Anti-TNF Therapy on Mucosal Apoptosis Genes Expression in Crohn's Disease. Front. Immunol. 12, 615539. doi:10.3389/fimmu.2021.615539
Moret-Tatay, I., Cerrillo, E., Hervas, D., Iborra, M., Saez-Gonzalez, E., Forment, J., et al. (2021). Specific Plasma MicroRNA Signatures in Predicting and Confirming Crohn's Disease Recurrence: Role and Pathogenic Implications. Clin. Transl. Gastroenterol. 12 (10), e00416. doi:10.14309/ctg.0000000000000416
Nguyen, V. Q., Eden, K., Morrison, H. A., Sammons, M. B., Knight, K. K., Sorrentino, S., et al. (2021). Noncanonical NF-Κb Signaling Upregulation in Inflammatory Bowel Disease Patients Is Associated with Loss of Response to Anti-TNF Agents. Front. Pharmacol. 12, 655887. doi:10.3389/fphar.2021.655887
Nie, K., Zhang, C., Deng, M., Luo, W., Ma, K., Xu, J., et al. (2022). A Series of Genes for Predicting Responses to Anti-tumor Necrosis Factor Alpha Therapy in Crohn's Disease. Front. Pharmacol. 13, 870796. doi:10.3389/fphar.2022.870796
Ostvik, A. E., Granlund, A. V. B., Bugge, M., Nilsen, N. J., Torp, S. H., Waldum, H. L., et al. (2013). Enhanced Expression of CXCL10 in Inflammatory Bowel Disease: Potential Role of Mucosal Toll-like Receptor 3 Stimulation. Inflamm. Bowel Dis. 19 (2), 265–274. doi:10.1002/ibd.23034
Pomaznoy, M., Ha, B., and Peters, B. (2018). GOnet: a Tool for Interactive Gene Ontology Analysis. BMC Bioinforma. 19 (1), 470. doi:10.1186/s12859-018-2533-3
Razawy, W., van Driel, M., and Lubberts, E. (2018). The Role of IL-23 Receptor Signaling in Inflammation-Mediated Erosive Autoimmune Arthritis and Bone Remodeling. Eur. J. Immunol. 48 (2), 220–229. doi:10.1002/eji.201646787
Roda, G., Chien Ng, S., Kotze, P. G., Argollo, M., Panaccione, R., Spinelli, A., et al. (2020). Crohn's Disease. Nat. Rev. Dis. Prim. 6 (1), 22. doi:10.1038/s41572-020-0156-2
Schaefer, J. S., Attumi, T., Opekun, A. R., Abraham, B., Hou, J., Shelby, H., et al. (2015). MicroRNA Signatures Differentiate Crohn's Disease from Ulcerative Colitis. BMC Immunol. 16, 5. doi:10.1186/s12865-015-0069-0
Schmitt, H., Neurath, M. F., and Atreya, R. (2021). Role of the IL23/IL17 Pathway in Crohn's Disease. Front. Immunol. 12, 622934. doi:10.3389/fimmu.2021.622934
Smoot, M. E., Ono, K., Ruscheinski, J., Wang, P. L., and Ideker, T. (2011). Cytoscape 2.8: New Features for Data Integration and Network Visualization. Bioinformatics 27 (3), 431–432. doi:10.1093/bioinformatics/btq675
Strieter, R. M., Polverini, P. J., Kunkel, S. L., Arenberg, D. A., Burdick, M. D., Kasper, J., et al. (1995). The Functional Role of the ELR Motif in CXC Chemokine-Mediated Angiogenesis. J. Biol. Chem. 270 (45), 27348–27357. doi:10.1074/jbc.270.45.27348
Sun, T. Y., Li, Y. Q., Zhao, F. Q., Sun, H. M., Gao, Y., Wu, B., et al. (2022). MiR-1-3p and MiR-124-3p Synergistically Damage the Intestinal Barrier in the Ageing Colon. J. Crohns Colitis 16 (4), 656–667. doi:10.1093/ecco-jcc/jjab179
Torres, J., Mehandru, S., Colombel, J. F., and Peyrin-Biroulet, L. (2017). Crohn's Disease. Lancet 389 (10080), 1741–1755. doi:10.1016/S0140-6736(16)31711-1
Tsai, S., and Gamblin, T. C. (2019). Molecular Characteristics of Biliary Tract and Primary Liver Tumors. Surg. Oncol. Clin. N. Am. 28 (4), 685–693. doi:10.1016/j.soc.2019.06.004
Vancamelbeke, M., Vanuytsel, T., Farre, R., Verstockt, S., Ferrante, M., Van Assche, G., et al. (2017). Genetic and Transcriptomic Bases of Intestinal Epithelial Barrier Dysfunction in Inflammatory Bowel Disease. Inflamm. Bowel Dis. 23 (10), 1718–1729. doi:10.1097/MIB.0000000000001246
Verstockt, S., De Hertogh, G., Van der Goten, J., Verstockt, B., Vancamelbeke, M., Machiels, K., et al. (2019). Gene and Mirna Regulatory Networks during Different Stages of Crohn's Disease. J. Crohns Colitis 13 (7), 916–930. doi:10.1093/ecco-jcc/jjz007
Wang, X., and Liotta, L. (2011). Clinical Bioinformatics: a New Emerging Science. J. Clin. Bioinforma. 1 (1), 1. doi:10.1186/2043-9113-1-1
Wang, Y., Wang, N., Cui, L., Li, Y., Cao, Z., Wu, X., et al. (2021). Long Non-coding RNA MEG3 Alleviated Ulcerative Colitis through Upregulating miR-98-5p-Sponged IL-10. Inflammation 44 (3), 1049–1059. doi:10.1007/s10753-020-01400-z
Witkin, S. S., Gerber, S., and Ledger, W. J. (2002). Influence of Interleukin-1 Receptor Antagonist Gene Polymorphism on Disease. Clin. Infect. Dis. 34 (2), 204–209. doi:10.1086/338261
Xie, K., Kong, S., Li, F., Zhang, Y., Wang, J., and Zhao, W. (2020). Bioinformatics-Based Study to Investigate Potential Differentially Expressed Genes and miRNAs in Pediatric Sepsis. Med. Sci. Monit. 26, e923881. doi:10.12659/MSM.923881
Yan, P., He, Y., Xie, K., Kong, S., and Zhao, W. (2018). In Silico analyses for Potential Key Genes Associated with Gastric Cancer. PeerJ 6, e6092. doi:10.7717/peerj.6092
Zhou, G., Soufan, O., Ewald, J., Hancock, R. E. W., Basu, N., and Xia, J. (2019). NetworkAnalyst 3.0: a Visual Analytics Platform for Comprehensive Gene Expression Profiling and Meta-Analysis. Nucleic Acids Res. 47 (W1), W234–W241. doi:10.1093/nar/gkz240
Zhou, J., Liu, J., Gao, Y., Shen, L., Li, S., and Chen, S. (2021). miRNA-Based Potential Biomarkers and New Molecular Insights in Ulcerative Colitis. Front. Pharmacol. 12, 707776. doi:10.3389/fphar.2021.707776
Zhou, R., Qiu, P., Wang, H., Yang, H., Yang, X., Ye, M., et al. (2021). Identification of microRNA-16-5p and microRNA-21-5p in Feces as Potential Noninvasive Biomarkers for Inflammatory Bowel Disease. Aging (Albany NY) 13 (3), 4634–4646. doi:10.18632/aging.202428
Zorzi, F., Calabrese, E., Monteleone, I., Fantini, M., Onali, S., Biancone, L., et al. (2012). A Phase 1 Open-Label Trial Shows that Smad7 Antisense Oligonucleotide (GED0301) Does Not Increase the Risk of Small Bowel Strictures in Crohn's Disease. Aliment. Pharmacol. Ther. 36 (9), 850–857. doi:10.1111/apt.12051
Keywords: Crohn’s disease, bioinformatics analysis, differentially expressed genes, MicroRNAs, hub genes
Citation: Sun Y, Cai D, Hu W and Fang T (2022) Identifying hub genes and miRNAs in Crohn’s disease by bioinformatics analysis. Front. Genet. 13:950136. doi: 10.3389/fgene.2022.950136
Received: 24 May 2022; Accepted: 08 August 2022;
Published: 31 August 2022.
Edited by:
Yuan Zhou, Peking University, ChinaReviewed by:
Nikolas Dovrolis, Democritus University of Thrace, GreeceHuangan Wu, Shanghai University of Traditional Chinese Medicine, China
Copyright © 2022 Sun, Cai, Hu and Fang. This is an open-access article distributed under the terms of the Creative Commons Attribution License (CC BY). The use, distribution or reproduction in other forums is permitted, provided the original author(s) and the copyright owner(s) are credited and that the original publication in this journal is cited, in accordance with accepted academic practice. No use, distribution or reproduction is permitted which does not comply with these terms.
*Correspondence: Taiyong Fang, ZmFuZ3RhaXlvbmdAMTYzLmNvbQ==
†These authors have contributed equally to this work and share first authorship