 Andrew T. DeWan1*†
 Megan E. Cahill1†Diana M. Cornejo-Sanchez2
 Yining Li1
 Zihan Dong3Tabassum Fabiha2Hao Sun2
 Gao Wang2Suzanne M. Leal2,4
- 1Department of Chronic Disease Epidemiology and Center for Perinatal, Pediatric and Environmental Epidemiology, Yale School of Public Health, New Haven, CT, United States
- 2Center for Statistical Genetics, Gertrude H. Sergievsky Centerand the Department of Neurology, Columbia University Medical Center, New York, NY, United States
- 3Department of Biostatistics, Yale School of Public Health, New Haven, CT, United States
- 4Taub Institute for Alzheimer’s Disease and the Aging Brain, Columbia University Medical Center, New York, NY, United States
Background: Asthma, type 2 diabetes (T2D), and anthropometric measures are correlated complex traits that all have a major genetic component.
Objective: To investigate the overlap in genetic variants associated with these complex traits.
Methods: Using United Kingdom Biobank data, we performed univariate association analysis, fine-mapping, and mediation analysis to identify and dissect shared genomic regions associated with asthma, T2D, height, weight, body mass index (BMI), and waist circumference (WC).
Results: We found several genome-wide significant variants in and around the JAZF1 gene that are associated with asthma, T2D, or height with two of these variants shared by the three phenotypes. We also observed an association in this region with WC when adjusted for BMI. However, there was no association with WC when it was not adjusted for BMI or weight. Additionally, only suggestive associations between variants in this region and BMI were observed. Fine-mapping analyses suggested that within JAZF1 there are non-overlapping regions harboring causal susceptibility variants for asthma, T2D, and height. Mediation analyses supported the conclusion that these are independent associations.
Conclusion: Our findings indicate that variants in the JAZF1 are associated with asthma, T2D, and height, but the associated causal variant(s) are different for each of the three phenotypes.
Introduction
Asthma, Type 2 Diabetes (T2D), and anthropometric measurements are all complex traits and are often correlated, suggesting there are shared etiological factors. The global prevalence of individuals with a current asthma diagnosis is estimated to be 262 million, with 37 million incident cases each year. (Vos et al., 2020). As of 2012, prevalence of asthma in the United Kingdom (United Kingdom) is ∼8%, with ∼12% of the population ever having an asthma diagnosis. (Strachan et al., 2017). Globally, there are an estimated 438 million cases of T2D, (Vos et al., 2020), and more than four million cases in the United Kingdom. (Whicher et al., 2020) Cases of obesity, defined as a body mass index (BMI) greater than 30, have been increasing globally, with 26% of men and 29% of women in England classified as obese. (Team, 2020). Studies have shown individuals with both obesity and asthma are more likely to have severe asthma that is poorly controlled, (Lavoie et al., 2006; Taylor et al., 2008; Juel and Ulrik, 2013), and one meta-analysis found individuals with both asthma and T2D also had poorer control of asthma. (Torres et al., 2021).
Obesity is a well-established risk factor for both asthma and T2D. (Barnes, 2011; Ali and Ulrik, 2013; Shore, 2013). While highly correlated, waist circumference (WC) can provide distinct information on adiposity as it is a measure of visceral obesity, specifically WC adjusted for BMI. WC is often used in studies of chronic diseases. (Jacobs et al., 2010; Darsini et al., 2020). Increased WC has been shown to be an additional risk factor for T2D (Feller et al., 2010) and asthma (Von Behren et al., 2009) even after adjusting for BMI. Elevated blood glucose and T2D have been linked to increased risk of asthma in adults, (Brumpton et al., 2013), and conversely, asthma has been associated with increased risk of developing T2D in adults. (Mueller et al., 2013). These epidemiological studies suggest a biological link between asthma, T2D, and WC, although the underlying mechanisms of these comorbidities are not completely understood, (Perez and Piedimonte, 2014), there is evidence pointing to shared genetic variants. (Zhu et al., 2020).
Height is a highly heritable polygenic trait. (Yang et al., 2010). There is evidence that shorter individuals have an increased risk for developing T2D (Shrestha et al., 2019) and individuals with childhood onset asthma have shorter stature as adults compared to non-asthmatics. (Chen et al., 2022).
Genetic variants have been well documented to influence each of these phenotypes, (Xue et al., 2018; Kim and Ober, 2019; Pulit et al., 2019; Yengo et al., 2022), and genetic pleiotropy, wherein variants affect more than one trait or disease, could be an additional cause of disease comorbidity. (Visscher et al., 2017). By identifying cross-phenotype associations, there is the potential to identify novel genetic links between phenotypes and new insight into the underlying mechanisms of known comorbid conditions.
To identify whether variants contribute to asthma, T2D, and anthropometric measurements, we analyzed the United Kingdom Biobank dataset (Sudlow et al., 2015), studying genetic and phenotypic data collected on White Europeans. We were able to identify cross-phenotype associations for three of our phenotypes of interest (asthma, T2D, and height), identifying variants in JAZF1 that were significantly associated with all three phenotypes. Fine-mapping analysis, suggested that the underlying causal variants are not shared between asthma, T2D, and height. This finding was also supported by mediation analysis.
Methods
Data access and ethical approval. This research was conducted using the United Kingdom Biobank Resource (application number 32285). The United Kingdom Biobank study was conducted under generic approval from the National Health Services’ National Research Ethics Service. The present analyses were approved by the Human Investigations Committee at Yale University (2000026836) and by the Institutional Review Board at Columbia University (IRB-AAAS3494).
Discovery Dataset. Participants were enrolled in the United Kingdom Biobank, and data accessed under an approved agreement (application ID 32285). Genotypes were assayed on either the United Kingdom BiLEVE array or the United Kingdom Biobank Axiom array with 733,332 autosomal variants overlapping between the two arrays. Subject and variant quality control is described in Supplementary Table S1, with subjects limited to those who self-defined as White British (field 22006) that have very similar genetic ancestry based on a principal components (PCs) analysis of their genotypes and have >99% of their genotypes (N = 366,752) (Supplementary Figure S1). For the analysis only variants with a call rate >99%, that did not deviate from Hardy-Weinberg Equilibrium (p-value > 5 × 10⁻⁸), and minor allele frequency (MAF) > 0.01 were included (N = 529,024). Additionally, imputed variants provide by the United Kingdom Biobank that had a MAF >0.001 and Info Score >0.8 were analyzed (N = 13,407,279). All variants were annotated using ANNOVAR. (Wang et al., 2010).
For analyses requiring unrelated individuals, we limited the dataset of White British by using the indicator variable (field 22020) to obtain study subjects that are unrelated (more distantly related than third degree relatives). This resulted in a subset of 307,259 unrelated individuals for analysis (Supplementary Figure S1).
Replication Dataset. For the replication sample, we identified a set of non-British White Europeans using self-reported ancestry and pre-computed PCs (field 22009). First, the mean and covariance were calculated for 40 PCs from all genetically confirmed White British subjects. For each subject, the Mahalanobis distance from the empirical PC distribution was calculated. Among all 488,377 United Kingdom Biobank subjects prior to any exclusions, 409,615 are self-reported White British (field 22006); 50,518 are self-reported White Europeans but who are not British (field 21000). After quality control, the final replication dataset consisted of 44,173 individuals who are non-British White Europeans (Supplementary Figure S1) with 13,243,888 imputed and 550,028 directly genotyped variants.
Phenotype Definitions. The T2D phenotype was defined by either ICD-10 code (United Kingdom Biobank field 41270, code E11) or self-reported diagnosis by a doctor at ≥ 30 years of age (fields 2,443 and 2,976). Individuals with type 1 diabetes [self-reported diabetes that occurred <30 years of age or E10] or gestational diabetes [self-report (field 4,011) or O24] were excluded from both cases and controls. Asthma was defined by either ICD-10 code (field 41270, J45 or J46) or self-reported diagnosis by a doctor (field 6,152). Individuals with autoimmune conditions were excluded from both the asthma and T2D controls [field 20002, self-reported diagnosis of an autoimmune disease, (Harpsoe et al., 2014), or self-report of sarcoidosis diagnosis by doctor in field 22133]. Individuals who did not report a diagnosis of asthma or T2D at the recruitment visit but did report a diagnosis at a later visit were also excluded from both the cases and controls for that phenotype. In the discovery dataset, for T2D, there were 22,670 cases and 313,404 controls, and for asthma, there were 48,623 cases and 290,722 controls. In the replication dataset, for T2D, there were 2,625 cases and 39,324 controls, and for asthma, there were 5,822 cases and 36,615 controls. WC (field 48) excluded women pregnant at time of recruitment (field 3,140), for a total of 365,499 subjects included in the discovery WC analysis and 43,954 subjects in the replication analysis. Height was obtained from field 50 (N = 365,934 discovery and N = 44,010 replication) and weight from field 21002 (N = 365,703 discovery and N = 43,976 replication). BMI was obtained from field 21001 (N = 365,498 discovery and N = 43,966 replication) which was computed from height (field 50) and weight (field 21002). When used as outcomes, WC, BMI, height, and weight were transformed using rank-based inverse normal transformation as implemented in R. A summary of the phenotypes, age, and sex for the individuals included in the discovery and replication datasets is provided in Table 1.

TABLE 1. Discovery and replication sample demographics.
Phenotype Specific Principal Components Analyses. Using the directly genotyped variants, the data was pruned for linkage disequilibrium (LD) using the default parameters of PLINK1.9 (Purcell et al., 2007) (50 variant window, pairwise r2 < 0.2, and shifting by 5 variants after each step). PCs analysis was performed for each trait separately using the smartPCA program in EIGENSOFT-7.2.1. (Patterson et al., 2006). These PCs were included in the univariate analysis.
Univariate Analyses. Univariate association analysis was performed on the discovery and replication samples using the full set of imputed and directly genotyped variants using linear mixed models (LMM) and generalized (LMM) as implemented in REGENIE. (Mbatchou et al., 2021). REGENIE implements a multi-stage procedure which starts by fitting a null model with whole genome regression, which is an approximation of the LMM/GLMM, using ridge regression on the directly genotyped variants to estimate the polygenic effects parameter to account for relatedness and population stratification and subsequently using the full set of imputed variants to estimate the genetic prediction of each phenotype using a leave one chromosome out procedure. For binary traits, Firth regression is used to ensure that the results are well calibrated in the presence of low frequency variants and unbalanced case-control ratios, both of which are present in this analysis. REGENIE implements an approximate Firth regression so that this approach can be run on a genome-wide scale. For the analysis of all phenotypes [asthma, T2D, WC adjusted for BMI (WCadjBMI), WC, height, weight, and BMI], age at recruitment (field 21022), genetic sex (field 22001), and 10 PCs were included in the regression model. Due to the well-known associations in the HLA regions with these phenotypes, variants in the HLA region were not considered for further evaluation. LD clumping of the univariate association results from the discovery sample was performed for asthma, T2D, and height in PLINK using a 4 MB region surrounding the index variant and a r2 threshold of 0.2 to identify overlapping genome-wide significant (p ≤ 5 × 10⁻⁸) signals across the three phenotypes. LD clumping takes into account the correlation structure between variants due to LD and significance level to obtain a set of independently associated loci.
Region visualization. Using LocusZoom (Boughton et al., 2021) regional plots were created from summary statistic data obtained for each phenotype for the discovery sample. The most significant variant from each phenotype association analysis was used as the reference variant in each of the three plots. For the eight cross-phenotype associated variants, r2 values were calculated using the genetic data obtained from the unrelated subjects and plotted using Haploview. (Barrett et al., 2005).
Fine-mapping. To identify a set of causal independent variants for asthma, T2D, and height, we used the Sum of Single Effects (SuSiE) model. (Wang et al., 2020). SuSiE identifies credible sets in a region that contain independent or highly correlated variants with nonzero effects by implementing an iterative Bayesian stepwise selection procedure. Fine-mapping was performed on the JAZF1 region using variants that were selected via LD clumping (see Univariate Analyses). The summary statistics and genotypes for these regions were extracted and the sample and population LD matrices were calculated using in-house workflows. For fine-mapping, we assumed a maximum of 10 casual variants with non-zero effects and identified the 95% credible sets using the summary statistics and LD matrices obtained for the discovery sample.
Mediation analysis. To address whether or not the cross-phenotype associations could be explained by mediation through one or more of the phenotypes, mediation analysis was conducted using the Mediation R package. (Tingley et al., 2014). The two variants in JAZF1 showing cross-phenotype associations for all three phenotypes were included. Given the temporal ordering of the phenotypes, with T2D in general having a later onset than asthma in the majority of our subjects (average age of diagnosis for T2D was 53.6 years and for asthma was 31.3 years, and in subjects with both T2D and asthma, the T2D diagnosis was an average of 20.5 years after the asthma diagnosis), we considered T2D to be the outcome and asthma the mediator when considering those two phenotypes in the mediation analysis. Despite WC being measured at baseline in UKB, for consistency with the T2D and asthma mediation analysis, we considered T2D as the outcome and height as the mediator. Since Mediation can only use standard linear or logistic regression, we only included the unrelated subjects (N = 307,259) and among those, subjects that had both asthma and T2D (N = 302,457) and height and T2D (N = 300,329) data. We performed mediation analyses using the two SNPs in JAZF1 that were genome-wide significant for asthma, T2D, and height. Each mediation analysis aimed to decompose the total effect of the SNP on T2D into direct and indirect effect estimates. Direct and indirect SNP effects were estimated as previously described. (Imai et al., 2010). Ninety-five percent confidence intervals for all effect estimates are bias corrected and accelerated intervals (DiCiccio and Efron, 1996) estimated via nonparametric bootstrapping. A significance threshold of α = 0.05 was used to evaluate the significance of the total, direct, and indirect effects.
Results
To identify variants potentially displaying biological pleiotropy across asthma, T2D, and several anthropometric measures, we first conducted a genome-wide association study for each phenotype (Supplementary Figure S2). We then performed LD clumping, as described in the Methods, to identify independent regions and variants associated with asthma T2D and anthropometric measurement (height, weight, BMI, WCadjBMI, WC). We filtered variants from the association results that had genome-wide significant p-values (≤5 × 10⁻⁸) in for asthma, T2D and at least one anthropometric measure. Outside of the HLA region, only one region, located on chromosome 7, contained eight variants that were genome-wide significant for at least three of the phenotypes (Table 2). The variants with the smallest p-values in this region were rs10245867 for asthma, rs849138 for height, 7:28178625 for T2D, and WCadjBMI. These variants are in the coding region of the JAZF1 and JAZF1 antisense RNA 1 (JAZF1-AS1) genes (Figure 1). Across this region, all eight variants were in relatively high LD, with r2 values ranging from 0.84 to 1.00 (Figure 2).
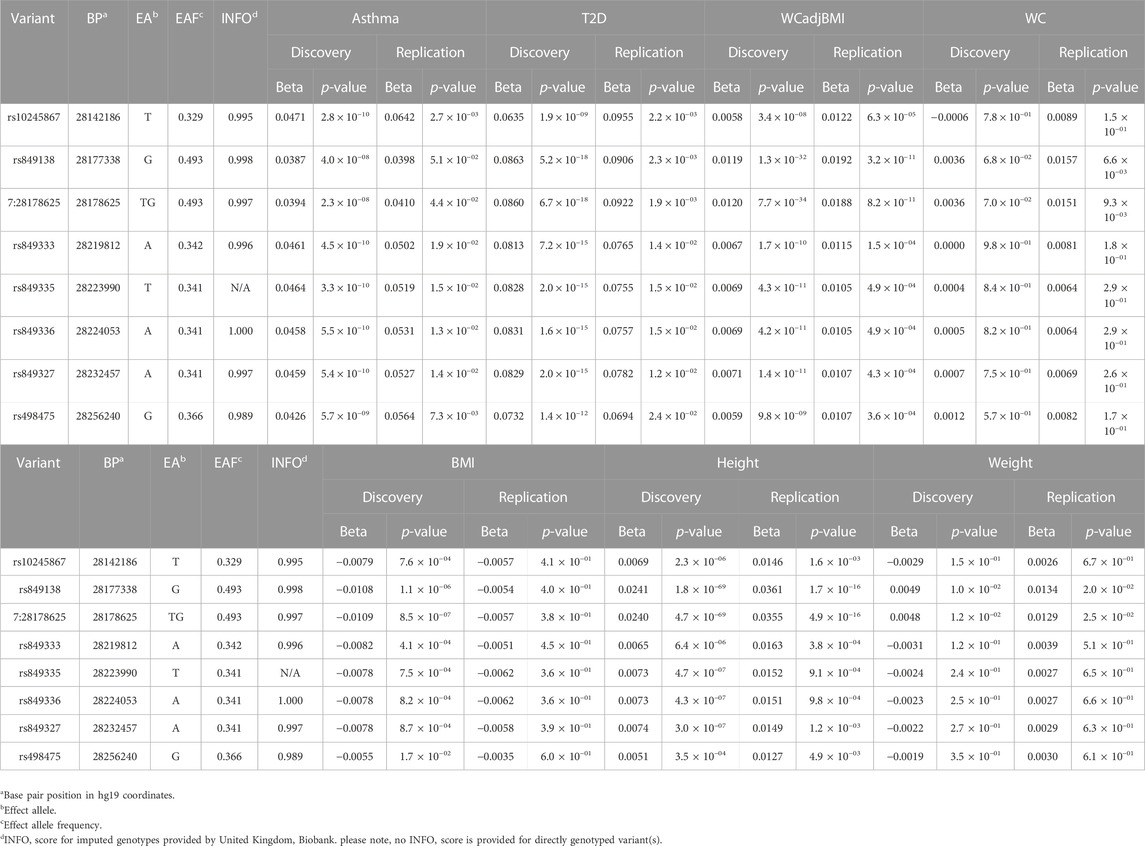
TABLE 2. Variants in JAZF1 with genome-wide significant associations with asthma, T2D and at least one anthropometric measure.
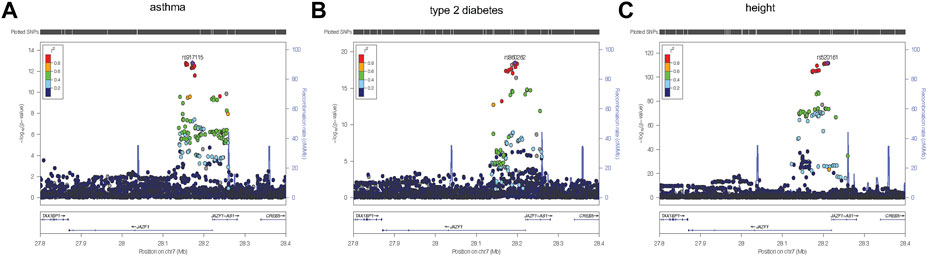
FIGURE 1. Regional plots were created using LocusZoom (Boughton et al., 2021) from the discovery association results for asthma (A), type 2 diabetes (B), and height (C). The most significantly associated variant for each of the three phenotypes, was selected as the reference variant and is indicated with purple diamond in each plot. Linkage disequilibrium (as measured by r2) was estimated from the data. It is evident from each plot that the strongest association signal for each phenotype is within JAZF1 rather than JAZF1-AS1.
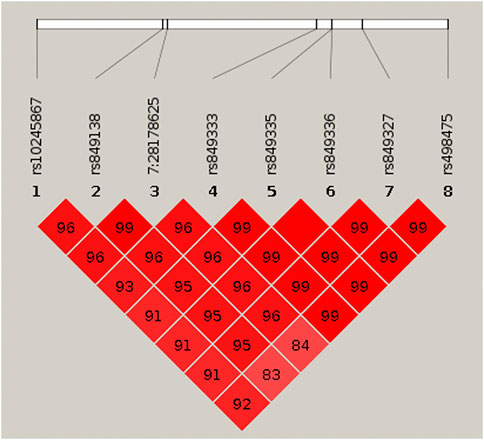
FIGURE 2. HaploView plot for the eight genome-wide significant cross-phenotype associated variants in and around JAZF1. Pairwise linkage disequilibrium (as measured by r2) is displayed for the eight genome-wide significant variants (see Table 2). Where an r2 value is not indicated, r2 = 1.0. The plot was created in HaploView (Barrett et al., 2005) using the subset of unrelated subjects.
Of note, WC not adjusted for BMI was not associated with any of the JAZF1 SNPs, while BMI showed nominally significant associations with all eight SNPs, with the most significant association with the variant at position 7:28178625 which was also associated with WCadjBMI. Height also had a genome-wide significant association with the variant at position 7:28178625 and rs849138 and at least a nominal association with all other SNPs in this region whereas weight was not associated with any of the JAZF1 SNPs except for a nominal association with the variant at position 7:28178625. These findings indicate that the association of the JAZF1 SNPs with WCadjBMI was due to collider bias, when both the exposure and outcome are each causing another variable and that variable is adjusted for in the analysis. In this case, adjusting WC for BMI (collider) resulted in an association with the JAZF1 SNPs (collider bias). This association was actually due to the JAZF1 SNPs being associated with height, a component of BMI (Supplementary Figure S3).
To pursue these novel cross-phenotype associations, we analyzed the associations for these variants with all phenotypes in the replication dataset (Table 2). All variants identified as genome-wide significant in the discovery sample, were replicated with a p-value <0.05 in the replication dataset. For example, the variant at position 7: 28178625, had a replication p-value of 4.40 × 10⁻² for asthma, 2.30 × 10⁻³ for T2D, and 1.70 × 10⁻¹⁶ for height.
Plots of the variants in the JAZF1 region showed the variants most strongly associated with each phenotype were located near the transcriptional start site, first exon, and intron of this gene as well as in JAZF1-AS1 (Figure 1). However, the association signal for each phenotype was stronger with variants in JAZF1 rather than JAZF1-AS1, an observation confirmed by fine-mapping.
Fine-mapping of the JAZF1 region identified one credible set for asthma, a second, non-overlapping credible set for T2D and four non-overlapping credible sets for height (Table 3). Since none of the variants in the credible sets across phenotypes were shared, our findings indicate different putative causal variants are associated with asthma, T2D, and height. All variants in the credible sets were in JAZF1, not JAZF1-AS1.
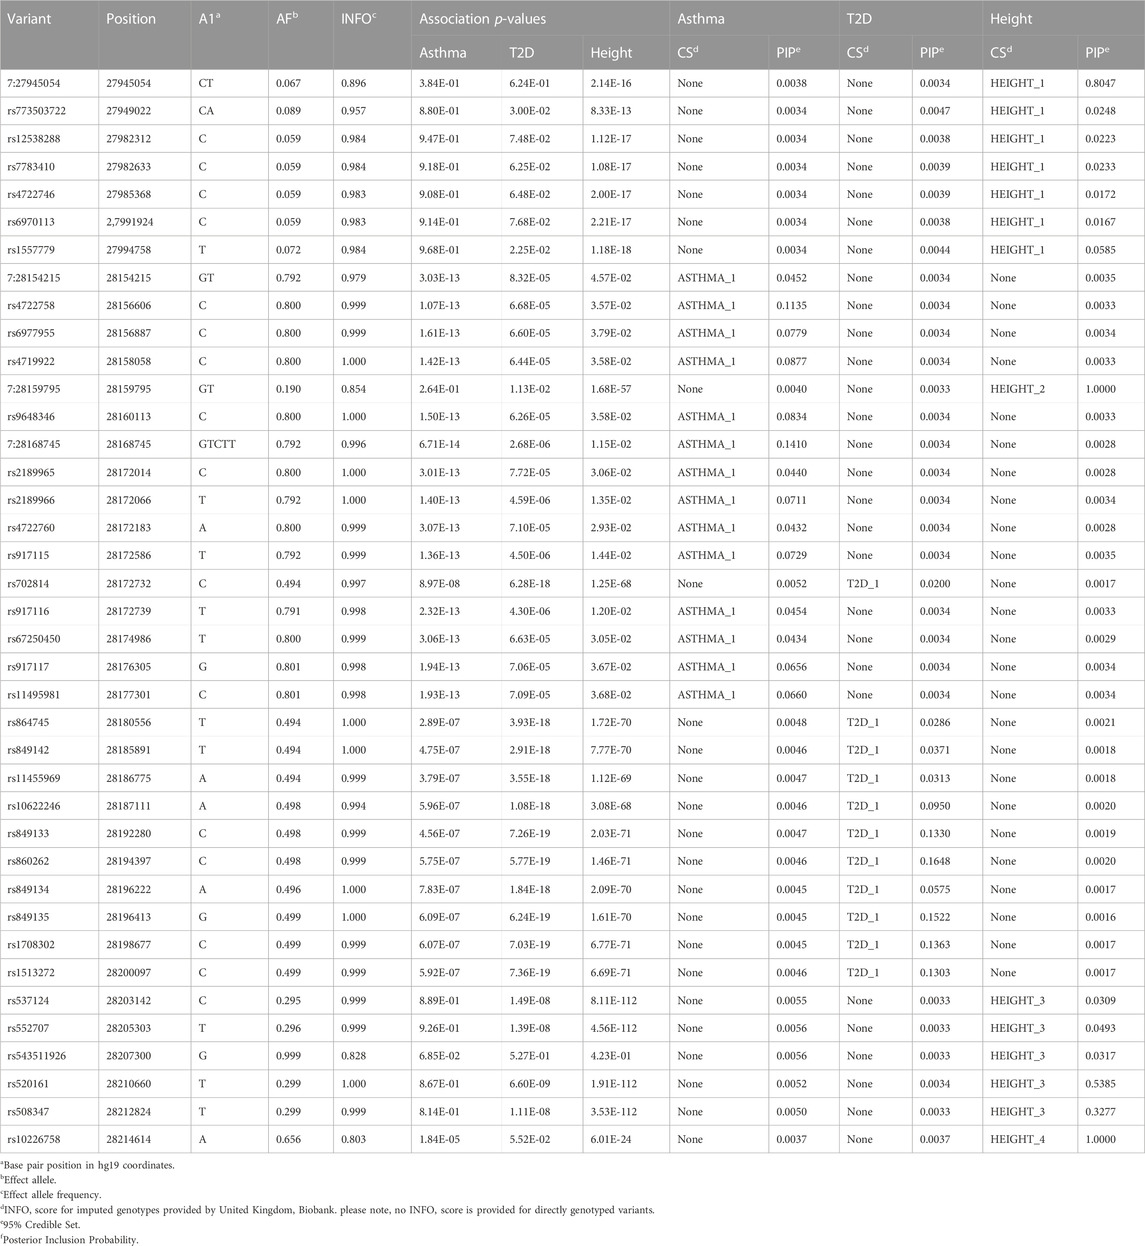
TABLE 3. Univariate fine-mapping results in the JAZF1 region for asthma, T2D and height.
To further explore the two genome-wide significant variants identified in the JAZF1 region shared between asthma, T2D and height, we conducted mediation analyses in the discovery dataset with T2D as the outcome, mediated by either asthma or height (Table 4). The analysis of T2D mediated by asthma indicated that these two variants exhibited significant indirect effect through asthma, but that this mediation accounted for 5% or less of the total effect on T2D. A similar pattern was present for the mediation analysis through height; both variants had a significant indirect effect on T2D through height (Table 4), but the proportion mediated for rs849138 was negative due to the negative indirect effect of this variant on T2D through height. At the gene level, these mediation results are more consistent with biological rather than mediated pleiotropy given the small indirect effect.
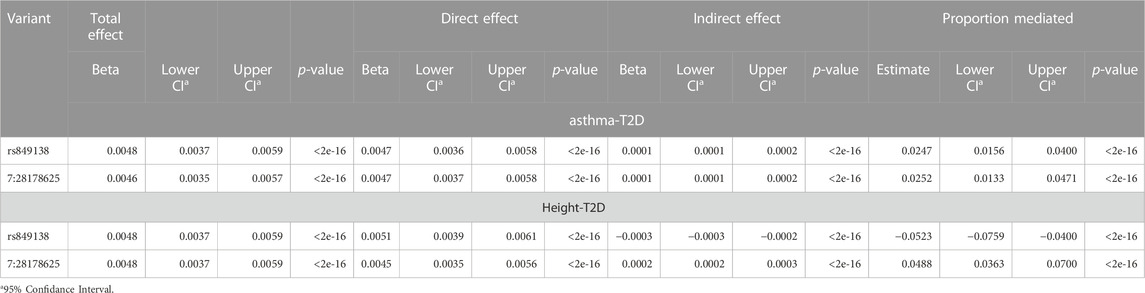
TABLE 4. Mediation results for the two variants in JAZF1 with cross-phenotype associations for asthma, T2D and height.
Discussion
Cross-phenotype associations can provide greater insight into correlated phenotypes, as well as elucidate underlying biological pathways. Anthropometric measures, asthma, and T2D are often correlated, and we used a homogenous subset of the United Kingdom Biobank to identify variants associated with all three phenotypes.
Across the phenotypes of interest, the only set of variants that are genome-wide significant outside of the HLA region for asthma, T2D, and at least one anthropometric measure are located in and around JAZF1. We focused our fine-mapping and mediation analyses on variants in this region.
Fine-mapping of the JAZF1 region, suggests independent credible sets for each phenotype, with asthma and T2D each having one independent credible set and height having four credible sets which do not overlap with those for asthma or T2D (Table 3). This suggests independent causal variants for asthma, T2D, and height. A significant indirect effect was detected in the analysis of T2D mediated by asthma or height, this indirect effect represents less than 5% of the total effect. This small proportion of mediation through asthma or height likely not meaningful level (Table 4). The overlap of genetic signals are unlikely explained by mediation and these significant indirect effects are probably due to confounding from genetic correlation between traits and/or LD between the causal variants for each trait. The significance of the relatively small indirect effects of the variants on T2D either through asthma or height are driven primarily by the large sample size which make very small indirect effects detectable. Our goal in performing mediation analysis was not to estimate the proportion mediated, since it has been pointed out that there are substantial issues with this measure and its interpretation (Hayes, 2018), but to evaluate whether a substantial proportion of the total effect of the variant on T2D could be explained by its association with asthma or height. Here it was not, which supports a conclusion of gene-level biological pleiotropy.
JAZF1 encodes a protein with three zinc fingers and acts as a transcriptional repressor. (Nakajima et al., 2004). It is member of a chaperone complex that orchestrates acetylation at regulatory regions controlling the expression of many genes involved in ribosome biogenesis. (Procida et al., 2021). Work on the Jazf1 knockout mouse induced pluripotent stem cells suggests JAZF1 is involved in differentiation of β-cells and glucose homeostasis. (Park et al., 2021). JAZF1 appears to limit inflammation in adipose tissue and mice overexpressing JAZF1 have lower body and fat weight. (Tighe et al., 1998). Finally, in mouse airway epithelial (Johnson et al., 2018) cultures, JAZF1 expression was shown to be necessary for multiciliated cell differentiation, which is important for removing contaminants from the airway. These functional studies suggest the plausibility of the role of JAZF1 in asthma and T2D, but do not suggest a genetic link between these phenotypes.
Previous studies have found variants within JAZF1 to be associated separately with T2D, obesity phenotypes, as well as, height. (Jang et al., 2014; Liao et al., 2019; Kobiita et al., 2020; Yengo et al., 2022). These findings include at least one study that reports a significant association with SNPs in JAZF1 with WCadjBMI. (Christakoudi et al., 2021). Further, there is evidence JAZF1 is associated with child-onset and possibly adult-onset asthma, (Ferreira et al., 2019; Laulajainen-Hongisto et al., 2020; Ma et al., 2020), demonstrating associations of variants in and around JAZF1 with each of these phenotypes. However, this is the first time that asthma, T2D, and anthropometric measurements have been analyzed simultaneously in the same dataset. These findings also suggest that previous associations with SNPs in JAZF1 with WCadjBMI are likely due to the same collider bias we observed, and the variants are associated with height, not adiposity. Additionally, this study is the first attempt at dissecting whether there are overlapping causal variants and/or biological pathways for these phenotypes and provides the strongest evidence for an association of variants in and around JAZF1 with asthma.
The cohort data used here offers a unique opportunity to study cross-phenotype associations, as the phenotypes in question are available on almost all study subjects. This is particularly beneficial for dissecting overlapping signals, as mediation analyses largely rely on phenotypic and genetic data being available on the same subjects. Although methods are available that allow for mediation using summary statistics generated using different datasets, (Park et al., 2019), these approaches have not been sufficiently evaluated.
There is also the potential for misclassification of cases and controls for both asthma and T2D, but several measures were taken to limit any misclassification: 1) asthma and T2D were defined using data from both self-reported health questionnaires and ICD-10 codes; 2) inclusion criteria were based on the data collected during the first visit to ensure the same level of data collection across the study participants, given the different enrollment dates and varying number of follow-up visits across the UKB study; and 3) if an individual could be classified as a control for asthma or T2D at baseline but subsequently reported a diagnosis of asthma or T2D they were excluded.
When case-control studies are performed where individuals are ascertained based on a specific phenotype and then additional qualitative or quantitative phenotypes are analyzed that are correlated with the primary phenotype under study, biases can be introduced and type I and II errors increased. The United Kingdom Biobank was not ascertained on a particular phenotype, therefore we do not expect analyzing multiple phenotypes, even those that are correlated, will introduce biases. Meta-analysis methods have been proposed to detect pleiotropy that combine data across phenotypes to increase power and detect heterogeneity. When these methods are applied to summary statistics that contain overlapping subjects, this overlap needs to be taken into account, such as proposed in PLEIO. (Lee et al., 2021). We did not perform a meta-analysis because our univariate results showed genome-wide significant associations for all three phenotypes for variants in JAZF1 and performing meta-analysis would not increase our power to detect these cross phenotype associations.
While the United Kingdom Biobank offers substantial power to detect associations, one major limitation is that the majority of subjects are of White European ancestry with only a relatively small number of subjects of non-European ancestry, primarily of African and South Asian ancestry. Unfortunately, due to the limited sample sizes for individuals of African and South Asian ancestry, for many of the United Kingdom Biobank phenotypes, particularly for dichotomous phenotypes, the power to detect association is low. Future efforts should be made to study the reported associations in individuals of sufficiently powered studies of non-European ancestry to determine if the same patterns are observed.
Conclusion: Asthma and T2D are comorbidities which are also correlated with anthropometric measurements. JAZF1 was previously shown to be associated with these phenotypes. Here we show that JAZF1 is likely associated with height and not adiposity. We also show that for asthma, T2D, and height, the association with JAFZ1 is due to biological pleiotropy on the gene-level but likely due to different causal variants underlying these phenotypes.
Regional plots were created using LocusZoom (Boughton et al., 2021) from the discovery association results for asthma (A), type 2 diabetes (B), and height. The most significantly associated variant for each of the three phenotypes, was selected as the reference variant and is indicated with purple diamond in each plot. Linkage disequilibrium (as measured by r2) was estimated from the data. It is evident from each plot that the strongest association signal for each phenotype is within JAZF1 rather than JAZF1-AS1.
Pairwise linkage disequilibrium (as measured by r2) is displayed for the eight genome-wide significant variants (see Table 2). Where an r2 value is not indicated, r2 = 1.0. The plot was created in HaploView (Barrett et al., 2005) using the subset of unrelated subjects.
Data availability statement
The datasets presented in this article are not readily available because all researchers who wish to access the research resource must register with UK Biobank by completing the registration form. Requests to access the datasets should be directed to https://www.ukbiobank.ac.uk/.
Ethics statement
The United Kingdom Biobank study was conducted under generic approval from the National Health Services' National Research Ethics Service. The present analyses were approved by the Human Investigations Committee at Yale University (2000026836) and by the Institutional Review Board at Columbia University (IRB-AAAS3494). The patients/participants provided their written informed consent to participate in this study.
Author contributions
AD and SL conceived of the overall study design. MC performed the discovery dataset data cleaning, phenotype construction, the initial discovery and replication genome-wide association studies and mediation analyses. AD and YL performed additional discovery and replication genome-wide association analyses and AD performed additional mediation analyses. ZD constructed the replication dataset. TF, HS, and GW performed the fine-mapping. AD, GW, and SL supervised the work. All authors contributed to the article and approved the submitted version.
Funding
This work was funded by a grant from the National Institutes of Health-National Heart, Lung, and Blood Institute (R01HL145660 to AD and SL).
Acknowledgments
The authors would like to thank the researchers and participants of the United Kingdom Biobank. All data was accessed as part of project 32285 from the United Kingdom Biobank. We thank the Yale Center for Research Computing for the use of the Farnam High Performance Computing cluster. The authors would also like to thank Yasmmyn Salinas for helpful discussions on the analysis strategies.
Conflict of interest
The authors declare that the research was conducted in the absence of any commercial or financial relationships that could be construed as a potential conflict of interest.
Publisher’s note
All claims expressed in this article are solely those of the authors and do not necessarily represent those of their affiliated organizations, or those of the publisher, the editors and the reviewers. Any product that may be evaluated in this article, or claim that may be made by its manufacturer, is not guaranteed or endorsed by the publisher.
Supplementary material
The Supplementary Material for this article can be found online at: https://www.frontiersin.org/articles/10.3389/fgene.2023.1129389/full#supplementary-material
Abbreviations
BMI, body mass index; GLMM, generalized linear mixed models; HLA, human leukocyte antigen; ICD, international classification of disease; JAZF1, juxtaposed with another zinc finger protein 1; JAZF1-AS1, JAZF1 antisense RNA 1; LD, linkage disequilibrium; LMM, linear mixed models; MAF, minor allele frequency; PC, principal component; T2D, Type 2 Diabetes; WC, waist circumference and WC adjusted for BMI (WCadjBMI).
References
Ali, Z., and Ulrik, C. S. (2013). Obesity and asthma: A coincidence or a causal relationship? A systematic review. Respir. Med. 107, 1287–1300. doi:10.1016/j.rmed.2013.03.019
Barnes, A. S. (2011). The epidemic of obesity and diabetes: Trends and treatments. Tex. Heart Inst. J. 38, 142–144.
Barrett, J. C., Fry, B., Maller, J., and Daly, M. J. (2005). Haploview: Analysis and visualization of LD and haplotype maps. Bioinformatics 21, 263–265. doi:10.1093/bioinformatics/bth457
Boughton, A. P., Welch, R. P., Flickinger, M., Vandehaar, P., Taliun, D., Abecasis, G. R., et al. (2021). LocusZoom.js: Interactive and embeddable visualization of genetic association study results. Bioinformatics 37, 3017–3018. doi:10.1093/bioinformatics/btab186
Brumpton, B. M., Camargo, C. A., Romundstad, P. R., Langhammer, A., Chen, Y., and Mai, X.-M. (2013). Metabolic syndrome and incidence of asthma in adults: The HUNT study. Eur. Respir. J. 42, 1495–1502. doi:10.1183/09031936.00046013
Chen, W., Yang, H., Hou, C., Sun, Y., Shang, Y., Zeng, Y., et al. (2022). The influence of childhood asthma on adult height: Evidence from the UK biobank. BMC Med. 20, 94. doi:10.1186/s12916-022-02289-1
Christakoudi, S., Evangelou, E., Riboli, E., and Tsilidis, K. K. (2021). GWAS of allometric body-shape indices in UK Biobank identifies loci suggesting associations with morphogenesis, organogenesis, adrenal cell renewal and cancer. Sci. Rep. 11, 10688. doi:10.1038/s41598-021-89176-6
Darsini, D., Hamidah, H., Notobroto, H. B., and Cahyono, E. A. (2020). Health risks associated with high waist circumference: A systematic review. J. public health Res. 9, 1811. doi:10.4081/jphr.2020.1811
Diciccio, T. J., and Efron, B. (1996). Bootstrap confidence intervals. Stat. Sci. 11, 189–212. doi:10.1214/ss/1032280214
Feller, S., Boeing, H., and Pischon, T. (2010). Body mass index, waist circumference, and the risk of type 2 diabetes mellitus: Implications for routine clinical practice. Dtsch. Arzteblatt Int. 107, 470–476. doi:10.3238/arztebl.2010.0470
Ferreira, M. A. R., Mathur, R., Vonk, J. M., Szwajda, A., Brumpton, B., Granell, R., et al. (2019). Genetic architectures of childhood- and adult-onset asthma are partly distinct. Am. J. Hum. Genet. 104, 665–684. doi:10.1016/j.ajhg.2019.02.022
Harpsoe, M. C., Basit, S., Andersson, M., Nielsen, N. M., Frisch, M., Wohlfahrt, J., et al. (2014). Body mass index and risk of autoimmune diseases: A study within the Danish national birth cohort. Int. J. Epidemiol. 43, 843–855. doi:10.1093/ije/dyu045
Hayes, A. F. (2018). Introduction to mediation, moderation, and conditional process analysis: A regression-based approach. New York: Guilford Press.
Imai, K., Keele, L., and Tingley, D. (2010). A general approach to causal mediation analysis. Psychol. Methods 15, 309–334. doi:10.1037/a0020761
Jacobs, E. J., Newton, C. C., Wang, Y., Patel, A. V., Mccullough, M. L., Campbell, P. T., et al. (2010). Waist circumference and all-cause mortality in a large US cohort. Arch. Intern Med. 170, 1293–1301. doi:10.1001/archinternmed.2010.201
Jang, W. Y., Bae, K. B., Kim, S. H., Yu, D. H., Kim, H. J., Ji, Y. R., et al. (2014). Overexpression of Jazf1 reduces body weight gain and regulates lipid metabolism in high fat diet. Biochem. Biophys. Res. Commun. 444, 296–301. doi:10.1016/j.bbrc.2013.12.094
Johnson, J. A., Watson, J. K., Nikolic, M. Z., and Rawlins, E. L. (2018). Fank1 and Jazf1 promote multiciliated cell differentiation in the mouse airway epithelium. Biol. Open 7, bio033944. doi:10.1242/bio.033944
Juel, C. T.-B., and Ulrik, C. S. (2013). Obesity and asthma: Impact on severity, asthma control, and response to therapy. Respir. Care 58, 867–873. doi:10.4187/respcare.02202
Kim, K. W., and Ober, C. (2019). Lessons learned from GWAS of asthma. Allergy Asthma Immunol. Res. 11, 170–187. doi:10.4168/aair.2019.11.2.170
Kobiita, A., Godbersen, S., Araldi, E., Ghoshdastider, U., Schmid, M. W., Spinas, G., et al. (2020). The diabetes gene JAZF1 is essential for the homeostatic control of ribosome biogenesis and function in metabolic stress. Cell Rep. 32, 107846. doi:10.1016/j.celrep.2020.107846
Laulajainen-Hongisto, A., Lyly, A., Hanif, T., Dhaygude, K., Kankainen, M., Renkonen, R., et al. (2020). Genomics of asthma, allergy and chronic rhinosinusitis: Novel concepts and relevance in airway mucosa. Clin. Transl. Allergy 10, 45. doi:10.1186/s13601-020-00347-6
Lavoie, K. L., Bacon, S. L., Labrecque, M., Cartier, A., and Ditto, B. (2006). Higher BMI is associated with worse asthma control and quality of life but not asthma severity. Respir. Med. 100, 648–657. doi:10.1016/j.rmed.2005.08.001
Lee, C. H., Shi, H., Pasaniuc, B., Eskin, E., and Han, B. (2021). Pleio: A method to map and interpret pleiotropic loci with GWAS summary statistics. Am. J. Hum. Genet. 108, 36–48. doi:10.1016/j.ajhg.2020.11.017
Liao, Z. Z., Wang, Y. D., Qi, X. Y., and Xiao, X. H. (2019). JAZF1, a relevant metabolic regulator in type 2 diabetes. Diabetes Metab. Res. Rev. 35, e3148. doi:10.1002/dmrr.3148
Ma, X., Wang, P., Xu, G., Yu, F., and Ma, Y. (2020). Integrative genomics analysis of various omics data and networks identify risk genes and variants vulnerable to childhood-onset asthma. BMC Med. Genomics 13, 123. doi:10.1186/s12920-020-00768-z
Mbatchou, J., Barnard, L., Backman, J., Marcketta, A., Kosmicki, J. A., Ziyatdinov, A., et al. (2021). Computationally efficient whole-genome regression for quantitative and binary traits. Nat. Genet. 53, 1097–1103. doi:10.1038/s41588-021-00870-7
Mueller, N. T., Koh, W.-P., Odegaard, A. O., Gross, M. D., Yuan, J.-M., and Pereira, M. A. (2013). Asthma and the risk of type 2 diabetes in the Singapore Chinese Health Study. Diabetes Res. Clin. Pract. 99, 192–199. doi:10.1016/j.diabres.2012.11.019
Nakajima, T., Fujino, S., Nakanishi, G., Kim, Y. S., and Jetten, A. M. (2004). TIP27: A novel repressor of the nuclear orphan receptor TAK1/TR4. Nucleic Acids Res. 32, 4194–4204. doi:10.1093/nar/gkh741
Park, S. J., Kwon, W., Park, S., Jeong, J., Kim, D., Jang, S., et al. (2021). Jazf1 acts as a regulator of insulin-producing beta-cell differentiation in induced pluripotent stem cells and glucose homeostasis in mice. FEBS J. 288, 4412–4427. doi:10.1111/febs.15751
Park, Y., Sarkar, A., Nguyen, K., and Kellis, M. (2019). Causal mediation analysis leveraging multiple types of summary statistics data. arXiv. 08540.
Patterson, N., Price, A. L., and Reich, D. (2006). Population structure and eigenanalysis. PLOS Genet. 2, e190. doi:10.1371/journal.pgen.0020190
Perez, M. K., and Piedimonte, G. (2014). Metabolic asthma: Is there a link between obesity, diabetes, and asthma? Immunol. allergy Clin. N. Am. 34, 777–784. doi:10.1016/j.iac.2014.07.002
Procida, T., Friedrich, T., Jack, A. P. M., Peritore, M., Bonisch, C., Eberl, H. C., et al. (2021). JAZF1, A novel p400/TIP60/NuA4 complex member, regulates H2A.Z acetylation at regulatory regions. Int. J. Mol. Sci. 22, 678. doi:10.3390/ijms22020678
Pulit, S. L., Stoneman, C., Morris, A. P., Wood, A. R., Glastonbury, C. A., Tyrrell, J., et al. (2019). Meta-analysis of genome-wide association studies for body fat distribution in 694 649 individuals of European ancestry. Hum. Mol. Genet. 28, 166–174. doi:10.1093/hmg/ddy327
Purcell, S., Neale, B., Todd-Brown, K., Thomas, L., Ferreira, M. A., Bender, D., et al. (2007). Plink: A tool set for whole-genome association and population-based linkage analyses. Am. J. Hum. Genet. 81, 559–575. doi:10.1086/519795
Shore, S. A. (2013). Obesity and asthma: Location, location, location. Eur. Respir. J. 41, 253–254. doi:10.1183/09031936.00128812
Shrestha, S., Rasmussen, S. H., Pottegard, A., Angquist, L. H., Jess, T., Allin, K. H., et al. (2019). Associations between adult height and type 2 diabetes mellitus: A systematic review and meta-analysis of observational studies. J. Epidemiol. Community Health 73, 681–688. doi:10.1136/jech-2018-211567
Strachan, D., Gupta, R., Limb, E., Hansell, A., Ghosh, R., Bakolis, I., et al. (2017). “Asthma statistics,” in The respiratory health of the nation (British Lung Foundation). Available at: https://statistics.blf.org.uk/asthma.
Sudlow, C., Gallacher, J., Allen, N., Beral, V., Burton, P., Danesh, J., et al. (2015). UK biobank: An open access resource for identifying the causes of a wide range of complex diseases of middle and old age. PLoS Med. 12, e1001779. doi:10.1371/journal.pmed.1001779
Taylor, B., Mannino, D., Brown, C., Crocker, D., Twum-Baah, N., and Holguin, F. (2008). Body mass index and asthma severity in the National Asthma Survey. Thorax 63, 14–20. doi:10.1136/thx.2007.082784
Tighe, O., Carmody, M., and Croke, D. T. (1998). Identification of a novel PKD1 mutation in an Irish autosomal dominant polycystic kidney disease kindred. Biochem. Soc. Trans. 26, S265. doi:10.1042/bst026s265
Tingley, D., Yamamoto, T., Hirose, K., Keele, L., and Imai, K. (2014). Mediation: R package for causal mediation analysis. J. Stat. Softw. 59, 1–38. doi:10.18637/jss.v059.i05
Torres, R. M., Souza, M. D. S., Coelho, A. C. C., De Mello, L. M., and Souza-Machado, C. (2021). Association between asthma and type 2 diabetes mellitus: Mechanisms and impact on asthma control—a literature review. Can. Respir. J. 2021, 8830439. doi:10.1155/2021/8830439
Visscher, P. M., Wray, N. R., Zhang, Q., Sklar, P., Mccarthy, M. I., Brown, M. A., et al. (2017). 10 Years of GWAS discovery: Biology, function, and translation. Am. J. Hum. Genet. 101, 5–22. doi:10.1016/j.ajhg.2017.06.005
Von Behren, J., Lipsett, M., Horn-Ross, P. L., Delfino, R. J., Gilliland, F., Mcconnell, R., et al. (2009). Obesity, waist size and prevalence of current asthma in the California Teachers Study cohort. Thorax 64, 889–893. doi:10.1136/thx.2009.114579
Vos, T., Lim, S. S., Abbafati, C., Abbas, K. M., Abbasi, M., Abbasifard, M., et al. (2020). Global burden of 369 diseases and injuries in 204 countries and territories, 1990–2019: A systematic analysis for the global burden of disease study 2019. Lancet 396, 1204.
Wang, G., Sarkar, A., Carbonetto, P., and Stephens, M. (2020). A simple new approach to variable selection in regression, with application to genetic fine mapping. J. R. Stat. Soc. Ser. B-Statistical Methodol. 82, 1273–1300. doi:10.1111/rssb.12388
Wang, K., Li, M., and Hakonarson, H. (2010). Annovar: Functional annotation of genetic variants from high-throughput sequencing data. Nucleic Acids Res. 38, e164. doi:10.1093/nar/gkq603
Whicher, C. A., O'Neill, S., and Holt, R. I. G. (2020). Diabetes in the UK: 2019. Diabet. Med. 37, 242–247. doi:10.1111/dme.14225
Xue, A., Wu, Y., Zhu, Z., Zhang, F., Kemper, K. E., Zheng, Z., et al. (2018). Genome-wide association analyses identify 143 risk variants and putative regulatory mechanisms for type 2 diabetes. Nat. Commun. 9, 2941. doi:10.1038/s41467-018-04951-w
Yang, J., Benyamin, B., Mcevoy, B. P., Gordon, S., Henders, A. K., Nyholt, D. R., et al. (2010). Common SNPs explain a large proportion of the heritability for human height. Nat. Genet. 42, 565–569. doi:10.1038/ng.608
Yengo, L., Vedantam, S., Marouli, E., Sidorenko, J., Bartell, E., Sakaue, S., et al. (2022). A saturated map of common genetic variants associated with human height. Nature 610, 704–712. doi:10.1038/s41586-022-05275-y
Keywords: asthma, type 2 diabetes, height, pleiotropy, genome-wide association study, mediation analysis, fine-mapping, United Kingdom Biobank
Citation: DeWan AT, Cahill ME, Cornejo-Sanchez DM, Li Y, Dong Z, Fabiha T, Sun H, Wang G and Leal SM (2023) Variants in JAZF1 are associated with asthma, type 2 diabetes, and height in the United Kingdom biobank population. Front. Genet. 14:1129389. doi: 10.3389/fgene.2023.1129389
Received: 21 December 2022; Accepted: 25 May 2023;
Published: 12 June 2023.
Edited by:
Lisa J. Martin, Cincinnati Children’s Hospital Medical Center, United StatesReviewed by:
Shu-Yi Liao, National Jewish Health, United StatesBahram Namjou, Cincinnati Children’s Hospital Medical Center, United States
Copyright © 2023 DeWan, Cahill, Cornejo-Sanchez, Li, Dong, Fabiha, Sun, Wang and Leal. This is an open-access article distributed under the terms of the Creative Commons Attribution License (CC BY). The use, distribution or reproduction in other forums is permitted, provided the original author(s) and the copyright owner(s) are credited and that the original publication in this journal is cited, in accordance with accepted academic practice. No use, distribution or reproduction is permitted which does not comply with these terms.
*Correspondence: Andrew T. DeWan, YW5kcmV3LmRld2FuQHlhbGUuZWR1
†These authors have contributed equally to this work and share first authorship