 Conrad Chibunna Achilonu1,2*
 Marieka Gryzenhout2
 Gert Johannes Marais1M. Thabang Madisha3
 Soumya Ghosh2
- 1Department of Plant Sciences, Division of Plant Pathology, Faculty of Natural and Agricultural Sciences, University of the Free State, Bloemfontein, South Africa
- 2Department of Genetics, Faculty of Natural and Agricultural Sciences, University of the Free State, Bloemfontein, South Africa
- 3Agricultural Research Council (ARC), Pretoria, South Africa
Limited information regarding the occurrence of black spot disease of pecan (Carya illinoinensis), caused by A. alternata, in South Africa is known. The pecan industry is growing rapidly, so it is essential to understand the impact of the fungal pathogen to pecan health. In this study, the genetic variation of 364 A. alternata isolates was investigated by two RAMS primers (CCA5 and CGA5). In total, 6,525 alleles were produced, with a minimum of 3,182 alleles on the CGA5 primer and maximum of 3,343 alleles for CCA5 primer. Further analysis of the primers showed relatively low genetic diversity of A. alternata isolate populations, with mean values; (H = 0.12) and Shannon’s information index (I = 0.20). The analysis of molecular variance (AMOVA) revealed significant differences between populations, with 88% of the genetic variation was found within populations (Nm = 3.59, PhiPT = 0.12), and were not significantly different (p > 0.001). While 12% variation was observed among populations (Nm = 2.89, PhiPT = 0.08) and the estimates were statistically significant (p < 0.001). STRUCTURE HARVESTER output showed that K value is K = 8, where ΔK cannot find the true number of populations because of less variation. The dendrogram cluster tree generated by Ward’s analysis unveiled two main distinct clades and 10 sub-clades, revealing similar findings as those of PCoA analysis clusters. Therefore, it was evident that these analyses depicted no distinct relationship between the A. alternata isolates and their geographic locations or the prevalence of distribution among the populations.
Introduction
Carya illinoinensis (pecan) is one of the premier tree nut crops experiencing a rapid upsurge in nut production and sales across the global tree nut market (Persistence Market Research, 2018). The revenue growth of the global market is mainly driven by the awareness of various health benefits associated with pecans (Healthline, 2020). The United States of America produces about 52.0% of pecan nuts globally, followed by Mexico (44.1%) and South Africa (3.9%) (McEachern, 2014; SAPPA, 2016). Furthermore, there is a strong interest in the South African pecan industry to export pecans particularly to China, because of the quality and high value of pecan nuts (Lemmer, 2020).
The ecological imbalance caused by biotic or abiotic factors across major production regions in South Africa have favoured the emergence of pathogenic microorganisms such as Alternaria alternata on pecans, thereby influencing the productivity and quality of pecan nuts (Achilonu et al., 2023c). Alternaria alternata has 9 to 11 chromosomes and a genome of up to 33.6 Mb (Akamatsu et al., 1999; Nguyen et al., 2016). It is a widespread ubiquitous endophytic fungus, as well as an aggressive and opportunistic plant pathogen (Lawrence et al., 2013; Woudenberg et al., 2013). The fungus produces grey to olive or olive brown woolly colonies (Simmons, 2007), with either single or long branched chains of brown and obclavate shaped conidia (Simmons, 1999). Alternaria alternata is known to primarily reproduce asexually (Thomma, 2003), and the developed conidia are mainly dispersed by air and rain splash across environments, or biotic activity such as human-mediated activities, insects, and animals (Woudenberg et al., 2015a).
Alternaria alternata causes black spot disease or Alternaria black spot (ABS) in plants (Kaur M. et al., 2020). Symptoms of ABS on plant tissues occur as dark brown circular lesions that enlarge, and eventually cause leaf death or rotten nuts (Achilonu et al., 2023c). The pathogen has been reported to cause ABS on crops such as citrus (Tran, 2018), shell ginger (Yan et al., 2022), cabbage (Rahimloo and Ghosta, 2015), persimmons (Kurt et al., 2010), pomegranates (Berbegal et al., 2014), pears (Terakami et al., 2016), sunflowers (Kgatle et al., 2018), and rubber trees (Cai et al., 2008). The fungus has also been shown to be responsible for black spot disease of nut trees such as hazelnuts and walnuts (Cheng et al., 2016). No research has been reported on the disease in pecans.
In South Africa, ABS is a common disease in pecan orchards, and it is caused by A. alternata (Achilonu et al., 2023c). In recent years, pecan farmers have stressed that the disease has become a growing problem, especially in major pecan production areas of the country. The importance of this pathogen in relation to the severity of disease has increased, contributing to an estimated yield loss of 25%–36% of the pecan nut production in South Africa, and ultimately the export capacity to China (Lemmer, 2020; Otto, 2021). Therefore, it is paramount to ease the risk of black spot disease by further studies.
A variety of registered fungicides are currently available and tested to control the attack of A. alternata against South African pecans (Achilonu et al., 2023a). Planting resistant pecan cultivars can be the most cost-effective and durable approach to manage this pathogen. The damage caused by the fungus, as well as the effectiveness of fungicide applications made to manage the ABS disease in pecans, appear inseparably linked to the ubiquitous and endophytic nature of A. alternata (Ding et al., 2019; Turzhanova et al., 2020). Usually, the rapid growth rate of asexual reproduction and short life cycle of A. alternata result in a lower ability to overcome the sensitivity to fungicides (Yang et al., 2019). Genetic structure and molecular mechanisms are needed to access the potential to alter this sensitivity and overcome resistance of the plant host (Drew et al., 2021; Sánchez-Torres, 2021). Hence it is important that these aspects be investigated for the ABS pathogen in the future.
Different molecular markers have been employed to identify genetic diversity of A. alternata, a pathogen causing diseases in various plants and vegetative crops. For example, simple-sequence repeats (SSRs), random amplified polymorphic DNA (RAPD) and inter-simple sequence repeat (ISSR) markers were successfully used to determine the genetic variability of A. alternata causing black spot in potato in China (Meng J. et al., 2015) and Iran (Nasr Esfahani, 2018). Restriction fragment length polymorphisms (RFLPs) outlined the distribution of Alternaria species causing early blight of potato (Solanum tuberosum) and tomato (Solanum lycopersicum) in Algeria and India (Ayad et al., 2019; Kaur T. et al., 2020). RFLPs was also employed to screen a large collection of A. alternata isolates causing black spot of pecan (C. illinoinensis) in South Africa without the need for expensive sequencing (Achilonu et al., 2023b). However, RFLP molecular markers have limited ability to discriminate between genetically similar isolates within A. alternata populations (Pryor and Michailides, 2002).
Random amplified microsatellites (RAMs) are based on Polymerase Chain Reaction (PCR) and is effective to detect high polymorphism levels for genetic diversity studies (Delgado-Alvarado et al., 2018). RAMs markers are co-dominant, fast, reproducible, and are also expressed throughout the fungal genome (Hantula et al., 1996; Hantula and Müller, 1997). The high frequencies of these microsatellites with motif makes RAMs ideal to resolve genetic variation of fungal populations (Sillo et al., 2016). Importantly, RAMs was able to precisely resolve the genetic diversity and population structure of pathogen populations, overcoming several limitations of gel electrophoresis and capillary-based methods (Luchi et al., 2020; Mugao, 2023). RAMs have been used previously to evaluate genetic diversity of other fungi, such as Trichoderma spp. (Siddiquee et al., 2012), and Perenniporia fraxinea (Sillo et al., 2016). RAMs markers (CCA5 and CGA5) have also been successfully used to assess the intraspecific genetic variation among 112 isolates of an A. alternata population from Pinus tabulaeformis in India (Ginoya and Gohel, 2016) and China (Guo et al., 2004).
No data have been generated regarding the genetic diversity of the ABS pathogen across the major pecan production regions in the Free State (FS), Eastern Cape (EC), Gauteng (GP), Kwazulu-Natal (KZN), Limpopo (LP), Northern Cape (NC), and North West (NW) provinces of South Africa. This hinders effective management of the pathogen. In the current study, RAMs was used to evaluate the genetic variation within and between A. alternata populations, sampled from pecan leaves, nuts-in-shucks, and shoots in the FS, EC, GP, KZN, LP, NC, and NW. This is to test the hypotheses that population subdivision exists among isolates of A. alternata based on geographic location. The information derived from this study could provide insight to the genetic diversity of this pathogen and help identify future genetic threats that could have a positive impact on the pathogenic ability of A. alternata on pecans.
Material and methods
Sampling locations and isolation of Alternaria alternata
Symptomatic and non-symptomatic pecan tissues such as nuts-in-shucks, leaves, and shoots were randomly collected in pecan orchards from eight major pecan geographical locations in South Africa between the 2017–2020 growing seasons (Figure 1). A total of 364 A. alternata isolates sampled from eight geographical locations were used in this study (Supplementary Table S1). Following the isolation procedures leading to single hyphal-tip cultures as described (Achilonu et al., 2023c), stock cultures were transferred into 2 mL cryogenic tubes (Merck Millipore, Pretoria, South Africa) containing 0.85% saline (NaCl)—15% glycerol solution and stored at −80°C until required.
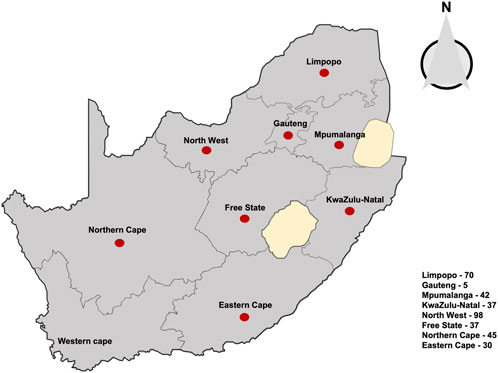
FIGURE 1. Map representing pecan plantations across eight provinces of South Africa where the 364 Alternaria alternata isolates was sampled, indicated by red dots. Numbers of isolates are indicated in the box, (see Supplementary Table S1 for detailed survey information).
Random amplified microsatellites amplification and fragment analysis
Genomic (gDNA) was extracted from the newly isolated cultures using the ZR Quick DNA Fungal/Bacterial Microprep™Kit (Zymo Research, Johannesburg, South Africa). The DNA concentration and purity were determined with the NanoDrop Lite ND-2000 spectrophotometer (Thermo Fisher Scientific, Massachusetts, United States). The acquired gDNA purity for all the A. alternata isolates was ≥1.7 (A260 nm/A280 nm) (Sambrook et al., 2006), with the concentrations ranging between 10.0 and 802.8 ng/μL. Samples were diluted in sterile water to a concentration of 10 ng/μL, which was sufficient for RAMs molecular analysis (Delgado-Alvarado et al., 2018).
DNA samples were amplified in two separate PCR, using two modified labelled degenerate RAMs primers (CCA5 and CGA5) (Table 1) as described by Hantula et al. (1996) and these reactions were repeated twice. Each PCR amplification consisted of 50–100 ng of template DNA, 0.3 μM of each primer, 2.5 mM MgCl2, 0.3 mM of each dNTP, and 1 U KAPA HiFi HotStart DNA Polymerase (Kapa Biosystems-Roche, Basel, Switzerland), and ultra-pure dH2O to a final volume of 25 μL. The cycling conditions consisted of an initial denaturation step of 3 min at 95°C followed by 32 cycles of 20 s at 98°C, annealing 30 s at 56.3°C for CCA5 and 53.8°C for CGA5, extension at 72°C for 40 s, and a final extension step of 3 min at 72°C. The PCR reactions were performed in a T100TM Thermal Cycler (Bio-Rad, California, United States). For confirmation, RAMs amplicons were stained with GelRed nucleic acid stain (Thermo Fisher Scientific), separated by 5% agarose gels electrophoresed at 100 V—constant power, estimated using 1 Kb DNA ladder molecular weight marker, and visualised under UV light “Gel Doc EZ Gel Documentation System” (Bio-Rad).
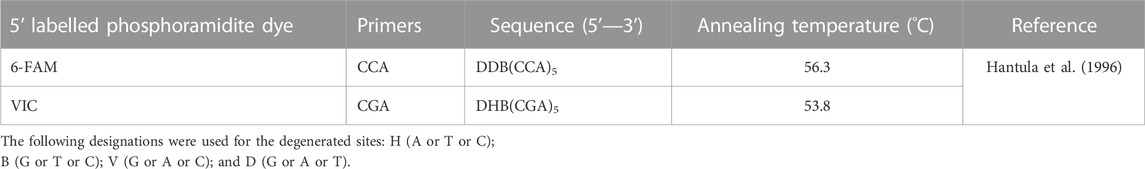
TABLE 1. Random amplified microsatellites primers and annealing temperatures used to determine the genetic diversity of Alternaria alternata isolated from South African pecans (Carya illinoinensis).
All the RAMs amplicons were pooled according to the biological sample, which resulted in one well per fungal isolate for the fragment analysis. Samples were run on an ABI 3500xl Genetic Analyser (Applied Biosystems), using standard protocols. The Genetic Analyser used matrix standard dye set (ROXTM) to analyse amplicons amplified with RAMs primers labelled with fluorescent dyes, namely, 6-FAM and VIC (Thermo Fisher Scientific). The total reaction volume of 10 μL consisted of 8.6 μL Hi-Di™ formamide (Thermo Fisher Scientific) mixed with 0.4 μL GeneScan™2500 ROX™ and 1 μL of PCR product. Only the fragments shorter than 1,060 base pairs (bp) were considered reproducible because of the limited fragment size (±1,100 bp) of the Genetic Analyser capillary. Data containing the alleles (Supplementary Table S2) were manually scored for each primer using GeneMapper v1.6 software (Applied Biosystems).
Data analysis
GenAlEx v6.5 software was used to evaluate the genetic diversity within the 8 A. alternata populations (Peakall and Smouse, 2012). Each fragment was distinguished according to the base pair size (bp) and thus, considered as a single molecular character. The amplicon profiles for each sample-primer combination were assessed and used to construct a binary matrix coded by 1 (presence) or 0 (absence) with all individual samples per amplified loci. The genetic variability of the 364 A. alternata isolates for both individual and combined primers (binary haploid data) was determined with the following parameters: Alleles: Na (number of average alleles), Ne (number of effective alleles), I (Shannon’s information index), H (observed diversity), Uh (unbiased expected diversity), and PPL (percentage of polymorphic loci) by using GenAlEx v6.5 software. Notably, identical samples of individuals were identified using the probability identity matrices.
Hierarchical analysis of molecular variance (AMOVA) was evaluated using GenAlEx v6.5 (Peakall and Smouse, 2012). The analysis provided an alternative clustering approach to view the genetic similarity and diversity of isolates among and within the eight populations. Principal coordinate analysis (PCoA) was conducted based on genetic distance (GD) for the combined data by covariance-standardised method as implemented using the same statistical package. Genetic structure for the eight populations was analysed using STRUCTURE v2.3.4 (Pritchard et al., 2000). K-values from 2 to 8 populations were tested, at least 10 simulations were executed by each K-value, after which the burn-in length was set to 1,000,000, and the number of MCMC repetitions after burn-in at 500,000. The result files from the runs were uploaded to online STRUCTUREHARVESTER, and then the delta K (ΔK ad hoc) method described by Evanno et al. (2005) was used to detect the most probable number of genetic clusters (K). The genetic relationships between isolates were further estimated by submitting the combined data set to a cluster analysis (Ward´s method) using Past 4.05 package (Hammer et al., 2001).
Results
Random amplified microsatellites amplification and fragment analysis
Agarose gel images for both primers showed visible banding patterns from 450 to 1,500 bp (Figure 2A). More fragment sizes were generated with fragment analysis by GeneMapper v3, between 13 bp and 1,060 bp for CCA5 primer and 15 and 1,060 bp for CGA5 primer (data not shown). The result of the band patterns of the combined primers across populations revealed that there were 4,319 (66%) polymorphic bands, 142 (2%) bands were unique to a single population and 2092 (32%) were monomorphic bands (Freq. >= 5%) found in 50% or fewer populations (Figure 2B).
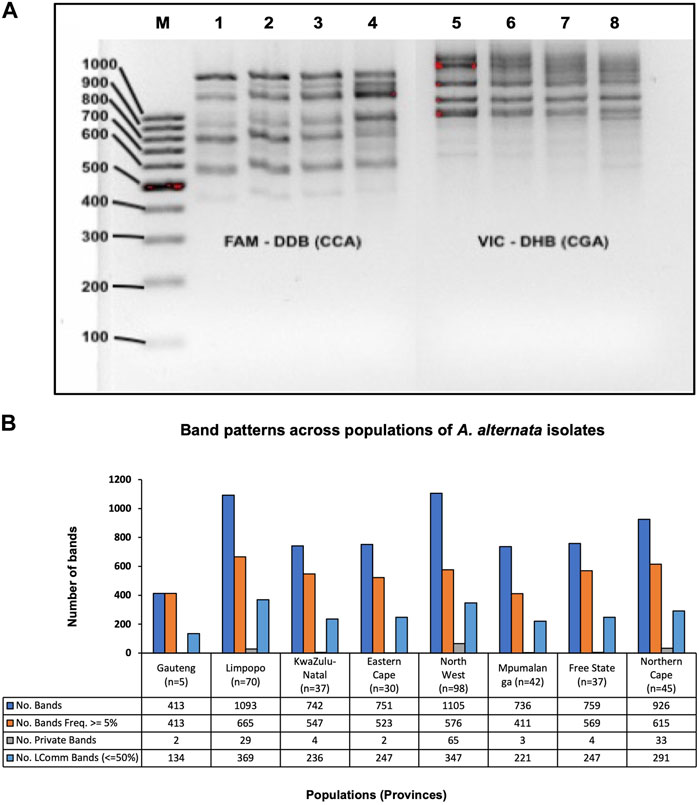
FIGURE 2. (A) An example of RAMs agarose gel (5%) depicting visible bands of A. alternata isolates. Lanes left to right: M = molecular weight marker of 100 bp ladder (Thermo Fisher Scientific, Massachusetts, USA), Lane 1–4 = amplicons with RAMs marker (CCA5), Lane 5–8 = amplicons with RAMs marker (CGA5). (B) Combined amplified RAMs markers (CCA5 and CGA5) band patterns across 364 A. alternata isolates from 8 populations. No. bands = No. of total bands (6525), No. Bands Freq. ≥5% = No. of different bands (4319) with a Frequency ≥5%, No. Private Bands = No. of bands (142) unique to a single population, No. LComm Bands (≤ 50%) = No. of locally common bands (2092) Freq. ≥5%) found in 50% or fewer populations. Abbreviation: n = number of A. alternata isolates, No. = number.
Genetic variation
The results showed various levels of genetic diversity indices of A. alternata in all sub-populations (Table 2). The two RAMs primers amplified a total of 6,525 alleles, with 3,182 alleles for the CGA5 primer and 3,343 alleles for the CCA5 primer. The combined primer analysis showed that the parentage of polymorphism within population varied from 28.0% to 80.6% in the Gauteng and North-West populations, respectively. The number of different alleles ranged from 0.58 (GP) to 1.61 (NW), and the number of effective alleles ranged between 1.16 (NW and MP) and 1.23 (NC). The Shannon’s information diversity index (I) ranged from 0.16 (GP) to (LP and NC), with average at 0.20. Nei’s observed genetic diversity (H) ranged between 0.11 (GP, EC, and MP) and 0.15 (NC). Nei’s unbiased genetic diversity (Uh) ranged from 0.11 (MP) to 0.15 (LP and NC). The mean expected diversity for the total of isolates was 0.13, indicating about 13% were expected to be heterozygous at a given locus. There was a slight increase in the mean value of Nei’s unbiased estimate of expected genetic diversity (Uh), contrary to the observed diversity (H) across both individual primers and combined for each population.
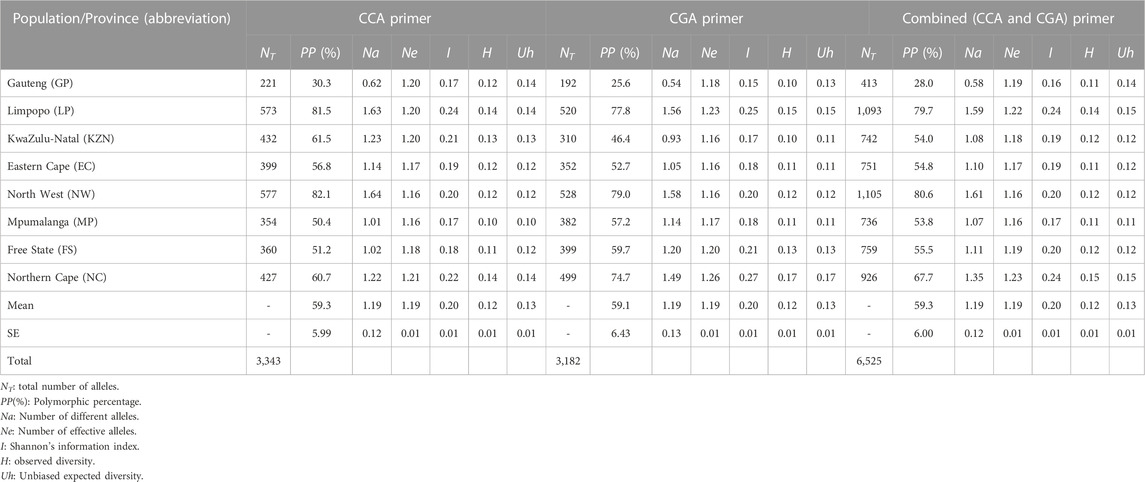
TABLE 2. Population’s estimation of Alternaria alternata isolates based on number of different alleles, polymorphism (%), and diversity level.
The analysis of molecular variance (AMOVA) showed that there was a significant difference (p < 0.001) within and among A. alternata populations (Table 3). The results showed that 88% of the genetic variation was found within populations with no significant (p > 0.001) genetic differentiation (Nm = 3.59, PhiPT = 0.12). A 12% variation was observed among populations with significant (p < 0.001) genetic differentiation (Nm = 2.89, PhiPT = 0.08). The estimated gene flow value of 3.59 and 2.89 indicated high gene flow of A. alternata within and among populations, respectively. Nm is the product of population size and the proportion of the number of alleles exchanged between populations per generation (Whitlock and Mccauley, 1999). The mean PhiPT value of 0.12 and 0.14, indicated low genetic differentiation within and among populations, respectively. PhiPT represents the analogous standardised measures of the degree of genetic differentiation of within and among populations, indicating scores for both measures range from 0 to 1 that equals no differentiation (Peakall and Smouse, 2012).
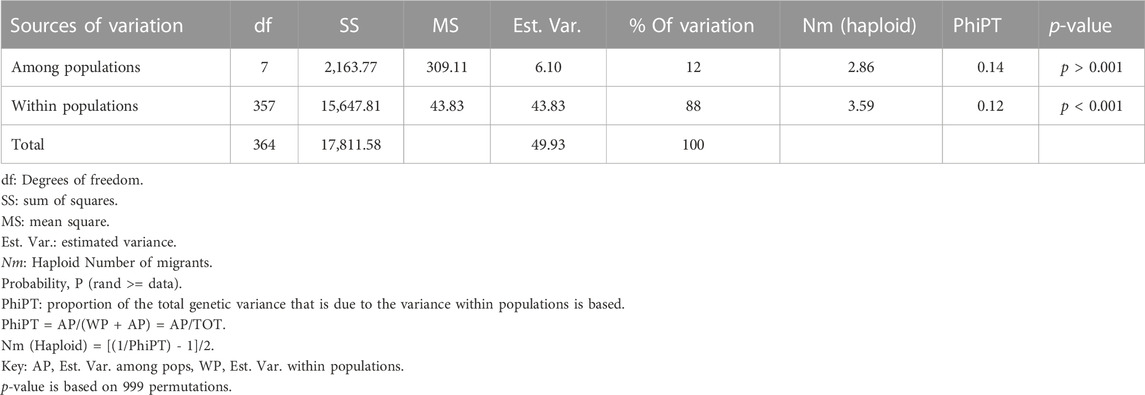
TABLE 3. Summary of analysis of molecular variance (AMOVA) showing the genetic variation within and among populations of 364 Alternaria alternata isolates from South African pecans (Carya illinoinensis).
The Principal Coordinate analysis (PCoA) (Figure 3A) depicted a cumulative 12.93% variation between populations that grouped into two clusters of the first three axes. Cluster 1 contained fungal isolates from EC, GP, NW, and LP, with few isolates from FS, MP, NC and KZN. Cluster 2 was formed by isolates from MP, KZN, FS and NC with few representative isolates from EC, NW, and LP. The PCoA analysis also showed that a small number of fungal isolates from Limpopo, North-West, and Eastern Cape were distributed in all the four coordinates. A schematic map shows the distributions of the A. alternata genotypes (Figure 3B), where the pie charts contained genotypes from each cluster. Cluster 1 (red) contained genotypes from NW (92), GP (5), EC (25), and LP (58). Cluster 2 (green) had genotypes from NC (42), MP (39), KZN (33), and FS (33), while yellow indicated genotypes overlapping the two clusters.
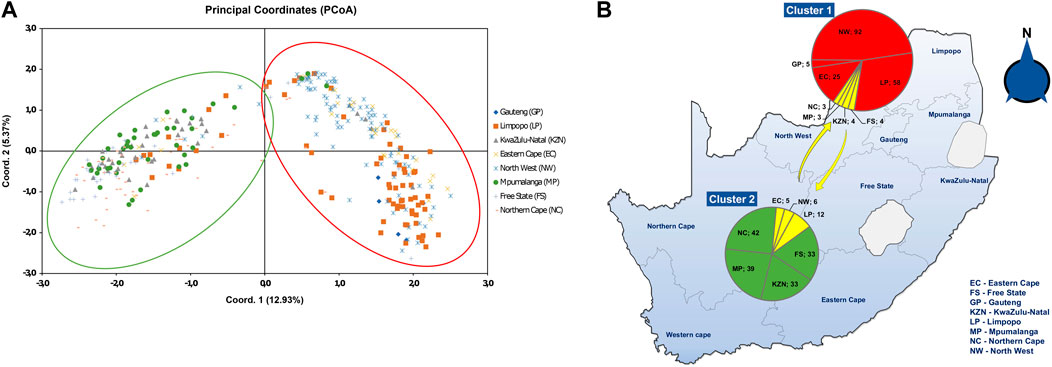
FIGURE 3. (A) Principal coordinate analysis (PCoA) plot of 364 A. alternata isolates from eight populations, based on RAMs markers (CCA5 and CGA5) and the genetic distance matrix for haploid distance using GenAlEx. The scatter plot shows the first and second principal coordinates that best explain the diversity in the population. Cluster 1 consists mostly fungal isolates from Eastern Cape, Gauteng, North-West and Limpopo, with few isolates from Northern Cape, Mpumalanga, KwaZulu-Natal, and Free State. Cluster 2 depicts isolates mostly from Mpumalanga, KwaZulu-Natal, Free State and Northern Cape, with few representative isolates from Eastern Cape, North-West and Limpopo. (B) Schematic map distribution of the A. alternata isolates showing presence of the two clusters as area in pie graphs. Red area in cluster 1 and green area in cluster 2 shows most isolates per population, and yellow depicts some isolate overlap.
Population structure and Alternaria alternata dendrogram clusters
STRUCTURE showed no even distribution of genotypes and thus, no distinct geographic population structure was observed in the data based on the STRUCTURE HARVESTER output (Supplementary Figure S1), with the most likely K value as K = 8 (Figure 4). Each coloured bar represented an individual isolate of the Alternaria population. The isolates from the same collection location had almost a similar level of admixture. Notably, though, ΔK cannot find the true number of populations if there is less variation of the fungal, i.e., if K = 1. However, none of the multiple STRUCTURE analyses contradicted the finding that K = 1.
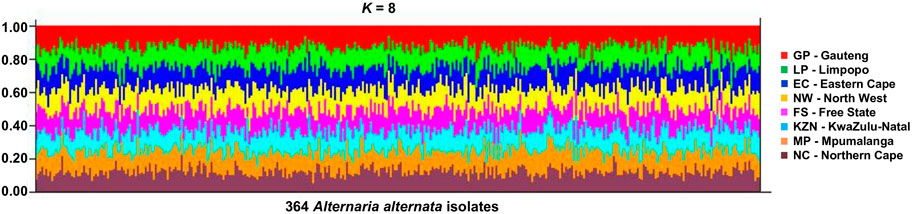
FIGURE 4. Structure output for the various possible values of K = 8 for the 364 A. alternata isolates from eight populations—Free State (FS), Eastern Cape (EC), Gauteng (GP), Kwazulu-Natal (KZN), Limpopo (LP), Northern Cape (NC), and North-West (NW) province (South Africa). Each vertical line represents one individual genotype, and each shade of colours refer to the eight populations. The proportion of each colour segment indicates the likelihood of an individual being assigned to the population represented by that colour.
The dendrogram cluster tree generated by Ward’s analysis unveiled two main distinct clades consisting of 10 subclades (Figure 5) that revealed similar findings as those of PCoA analysis clusters. Clade 1 consists of 198 A. alternata isolates, with majority isolates from GP (5), EC (25), LP (57), and NW (92). A small number of isolates from MP (3), NC (3), KZN (6), and FS (7) were found in the clade. Five subclades (1A, 1B, 1C, 1D, and 1E) were formed within clade 1. Subclade “1A” contained 16 isolates from NW, while subclade “1B” had 70 isolates distributed amongst LP (9), MP (3), NC (3), EC (3), KZN (1), and NW (46). Subclade “1C” consisted of 51 isolates from KZN (5), EC (22), LP (7), and NW (17). Twenty-six A. alternata isolates from FS (1), LP (14), GP (2), and NW (9) were grouped in subclade “1D”, and sub-cluster “1E” had 35 isolates from FS (1), GP (3), NW (4), and LP (27).
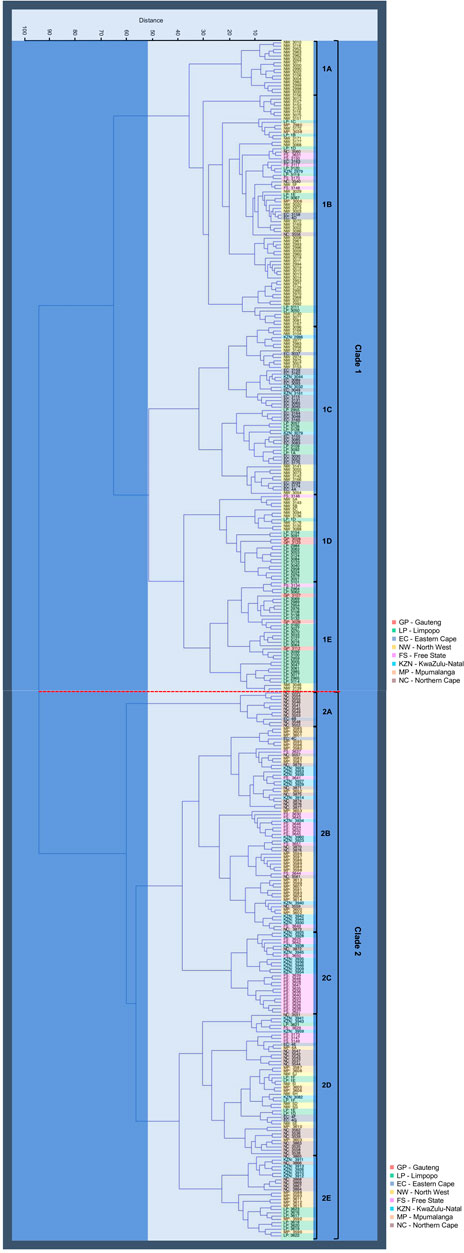
FIGURE 5. Hierarchical dendrogram cluster analysis (Euclidean distance and Ward Group linkage Method) for the 364 A. alternata isolates from eight populations - Free State (FS), Eastern Cape (EC), Gauteng (GP), Kwazulu-Natal (KZN), Limpopo (LP), Northern Cape (NC), and North-West (NW) province (South Africa), annotated by different colours in block. The analysis unveiled two main distinct clades (clade 1 and 2) and 5 subclades (1A—1E and 2A—2E) was formed on the respective two clades.
Clade 2 had a cluster pattern similar to clade 1, comprised of 166 isolates, the majority of which came from FS (30), KZN (31), MP (39), and NC (42) and few isolates from EC (5), NW (6), and LP (13). Five subclades were distinguished (2A, 2B, 2C, 2D, and 2E). Subclade “2A” had 11 isolates from EC (1), and NC (10), subclade “2B” consisted of 62 isolates from EC (1), FS (11), NC (12), KZN (13), and MP (25), and subclade “2C” had 25 isolates shared between NC (1), KZN (9), and FS (15). Subclade “2D” had 43 A. alternata isolates between EC (3), FS (4), KZN (4), NW (5), LP (6), MP (7), NC (14), and subclade “2E” included 25 isolates from KZN (5), NC (6), MP (7), and LP (7).
Discussion
The present study was conducted to evaluate the genetic diversity and population structure in A. alternata populations sampled from South African pecans (C. illinoinensis) in the FS, EC, GP, KZN, LP, NC, and NW. The study is the first to document the use of RAMs primers to evaluate the genetic diversity of A. alternata isolates causing black spot disease on pecans in South Africa. The analyses showed low genetic diversity in all A. alternata populations. There were no major dominant genotypes present across all provincial geographical areas, but two major groups from the Northern and Southern parts of South Africa were formed. This fungus has low genetic variation, which has positive implications for the efficacy of fungicides and reduced genetic fitness due to the low pathogen variability.
RAMs proved valuable to study the genetic diversity and population structure of A. alternata. In this study, RAMs assisted to produce a high number of 6,525 alleles from the 364 A. alternata isolates across the eight populations. The percentage polymorphism of the number of alleles was above average and effective alleles. The number of alleles obtained exceeded the only previous study reported to describe the genetic diversity (H = 2.79) of 112 A. alternata isolates from Pinus tabuliformis in China (Guo et al., 2004), with 1,273 alleles detected using the same two RAMS primers as in this study. This could be due to the poor band resolution produced from agarose gel method the authors used (Barril and Nates, 2012), and are not suitable for amplified samples with low molecular weight (Akbari et al., 2008).
The analysis of genetic variability across all loci confirmed low genetic diversity within and among A. alternata populations. This is shown by a low mean percentage of polymorphic loci (59.3), number of observed alleles (1.19), number of effective alleles (1.19), Shannon’s information index (0.20), Observed diversity (0.12), and Unbiased expected diversity (0.13) across the eight populations. Similar, but generally lower numbers. Similar levels (H = 0.11 and 0.16) of genetic diversity was found by Weir et al. (1998), where the authors used RAPDs technique to evaluate the genetic variation of predominantly United States isolates of A. solani and A. alternata, known to cause early blight in potato (S. tuberosum) and tomato (S. lycopersicum). In South Africa, van der Waals et al. (2004) reported a mean genetic diversity of 0.20 for A. solani isolates from potatoes (S. tuberosum) using similar RAMS primer combinations. In contrast, relatively high genetic diversity values (H = 0.952, 0.923, and 0.916) were reported for A. alternata populations across the mainland in the United States (Woudenberg et al., 2015a).
The AMOVA and STRUCTURE analyses demonstrated the genetic differentiation and population structure of A. alternata populations. The AMOVA accounted for a high level of genetic variation within populations, and low variability among populations. The mean genetic differentiation among A. alternata populations indicated a weak and nonsignificant genetic differentiation existing within the populations. Our finding based on the significant genetic differentiation of A. alternata populations was similar and consistent with previous studies on genetic diversity of Alternaria species (Turzhanova et al., 2020). Gene flow (Nm) for the combined dataset also explains the level of genetic variability in the populations. High level of gene flow can only indicate a more homogeneous population structure and a lower degree of genetic differentiation among populations of A. tenuissima from wheat kernels in Russia (Gannibal et al., 2007). The high average gene flow (Nm = 3.59) within populations and among populations (Nm = 2.86) in the present study can be associated to the low genetic differentiation. Similar to those reported in other studies by (Meng J. W. et al., 2015; Yang et al., 2018), showed Nm values of 5.80 and 3.70, respectively. Low genetic differentiation and the lack of shape between certain populations (Garant et al., 2007; Stefansson et al., 2014) was supported by the results of STRUCTURE analyses. The analysis weakly inferred eight sub-groups (K = 8), where all individual isolates tested share genetic information (alleles) inherited from the sub-groups. Thus, this corroborates the presence of high potential of genetic admixture and closed relationships among isolates of the different sampling pecan sites as a result of high gene flow. In accordance with STRUCTURE analyses in this study, no population substructure in A. alternata populations were found from wheat (Triticum aestivum) in Kazakhstan (Turzhanova et al., 2020), and from (Citrus spp.) in Morocco (Zelmat et al., 2021).
The PCoA and UPGMA cluster analyses did not sharply group the A. alternata populations according to their geographical origins and the clustering pattern was weak enough to support the concept of “isolation by distance”. Our findings showed two main clusters of similar haplotypes, with each cluster containing the majority of isolates from four different populations. It was evident that both analyses depicted no distinct relationship between the fungal isolates and their geographic locations. The current results support previous studies (Yang et al., 2018), revealing that A. alternata isolates were not clustered based on their locations.
These overall findings have implications for the management of ABS on South African pecans. Firstly, asexually reproducing populations of A. alternata could account for low genetic diversity and random association between different loci (Woudenberg et al., 2015b; Kreis et al., 2016; Ozkilinc and Sevinc, 2018). A proposed explanation in this study was that asexual populations can reproduce many spores, the spore spreads, and high levels of clonality are dominated by few genotypes and low gene diversity, therefore promotes the low level of genetic variation within populations of A. alternata. In addition, other forms of recombination could also take place. For instance, a study of A. alternata populations, causing early blight in potato (S. tuberosum) in China revealed two subpopulations that showed the ability to recombine through many parasexual cycles of asexual propagation with fewer cycles of cryptic sexual reproduction (Meng J. W. et al., 2015), based on the evolving loci and the presence of both mating-types (MAT1-1 and MAT1-2).
Another explanation for the random association of alleles in A. alternata can be ascribed to the nature of microsatellites. For example, Buschiazzo and Gemmell (2006) proposed that these evolving loci are altered through birth-and-death evolution such that they are highly polymorphic in eukaryotes. It is likely that over lengthy periods of asexual reproduction, a microsatellite locus can hyper-mutate in large populations such as those usually found in A. alternata (Woudenberg et al., 2015b). If this is equally applicable on every microsatellite, such events could explain the high number of evolving alleles found in the present study. The aforementioned results accounts for two possibilities: either the size limitations on microsatellite loci led to a very high probability of size homoplasy, which confuses the detection of hyper-mutation (Angers et al., 2000; Buschiazzo and Gemmell, 2006) or A. alternata isolates has been propagating asexually for such a long time that loci are hyper-mutated. Thus, future studies should perhaps look at more than one approach.
Large quantities of fungal spores can be spread mostly through wind, rain, and human-mediated dispersal (Meng et al., 2018; Yang et al., 2018). South Africa has some heavy winds and rain, which could result in high spread of A. alternata within the populations. Also, the isolates in this study were sampled from eight geographic regions, separated by more than 800 km from each other (www.google.com/maps/dir/), which makes it difficult for A. alternata spores to be disseminated through wind for such a distance. Long-distance movement of spores can most likely be attributed to human-mediated gene flow, which has been reported in A. alternata populations in potato growing areas in China (Meng et al., 2018). How pecan farmers in South Africa obtained and move their grafted seedling plants from nurseries within and across different locations could also account for the distribution of genotypes. Most pecan nurseries still use self-seeding plants and grafting for cultivation (Krüger, 2016) and A. alternata could already be present in the plant tissue in nurseries. Another possibility could be that the diversity of genotypes was already present in the environment from different plant hosts, soils, and decaying organic material. This then acts as a reservoir of inoculum to infect pecans, especially newly planted seedlings, or planting of trees in virgin land.
Conclusion
This study laid the groundwork for future studies on the population of A. alternata across pecan orchards in South Africa. Low genetic diversity was established in A. alternata populations, brought about by the high gene flow within and among the populations. This may explain the non-correlation with the geographic distribution of the A. alternata pathogen, which is predominantly isolated in the eight major pecan producing provinces. Cautious intervention could be implemented by pecan farmers when applying different fungicides that can specifically inhibit the growth of this fungus. Finally, the production of pathogen free pecan trees in nurseries, whether through resistance breeding or careful selection of plant material, could improve the control of ABS, since pathogen populations with high evolutionary potential are more likely to overcome host genetic resistance (McDonald and Linde, 2002).
Data availability statement
The original contributions presented in the study are included in the article/Supplementary Material, further inquiries can be directed to the corresponding author.
Author contributions
CA: Conceptualization; GM: Resources and project administration; CA: Data Curation, Writing-Original and -Final Draft; CA and MM.: Formal analysis and Visualization, Methodology; MG, SG, and GM: Review and Editing. All authors contributed to the article and approved the submitted version.
Funding
This research was funded by the South African Pecan Nut Producers Association, (Grant No. UFS-ESD2020/0043/0611), affiliated to the University of the Free State, South Africa.
Acknowledgments
The authors are thankful to the South African Pecan Nut Producers Association (SAPPA) for providing financial support for this study. Our acknowledgement also goes to the Department of Genetics, and the Department of Plant Science, Division of Plant Pathology—University of the Free State, South Africa, for the laboratory facilities for the studies. We thank Errol Cason for his assistance in arranging the raw allele data set.
Conflict of interest
The authors declare that the research was conducted in the absence of any commercial or financial relationships that could be construed as a potential conflict of interest.
Publisher’s note
All claims expressed in this article are solely those of the authors and do not necessarily represent those of their affiliated organizations, or those of the publisher, the editors and the reviewers. Any product that may be evaluated in this article, or claim that may be made by its manufacturer, is not guaranteed or endorsed by the publisher.
Supplementary material
The Supplementary Material for this article can be found online at: https://www.frontiersin.org/articles/10.3389/fgene.2023.1213102/full#supplementary-material
References
Achilonu, C. C., Gryzenhout, M., Ghosh, S., and Marais, G. J. (2023a). In vitro evaluation of azoxystrobin, boscalid, fentin-hydroxide, propiconazole, pyraclostrobin fungicides against Alternaria alternata pathogen isolated from Carya illinoinensis in South Africa. Microorganisms 11, 1691. doi:10.3390/MICROORGANISMS11071691
Achilonu, C. C., Gryzenhout, M., Marais, G. J., and Ghosh, S. (2023b). Differential detection of Alternaria alternata haplotypes isolated from Carya illinoinensis using PCR-RFLP analysis of Alt a1 gene region. Genes (Basel) 14, 1115–1129. doi:10.3390/genes14051115
Achilonu, C. C., Marais, G. J., Ghosh, S., and Gryzenhout, M. (2023c). Multigene phylogeny and pathogenicity trials revealed Alternaria alternata as the causal agent of black spot disease and seedling wilt of pecan (Carya illinoinensis) in South Africa. Pathogens 12, 672–691. doi:10.3390/pathogens12050672
Akamatsu, H., Taga, M., Kodama, M., Johnson, R., Otani, H., and Kohmoto, K. (1999). Molecular karyotypes for Draft Genome Sequence of Alternaria ATCC 34957 plant pathogens known to produce host-specific toxins. Curr. Genet. 35, 647–656. doi:10.1007/s002940050464
Akbari, A., Marthinsen, G., Lifjeld, J. T., Albregtsen, F., Wennerberg, L., Stenseth, N. C., et al. (2008). Improved DNA fragment length estimation in capillary electrophoresis. Electrophoresis 29, 1273–1285. doi:10.1002/elps.200700523
Angers, B., Estoup, A., and Jarne, P. (2000). Microsatellite size homoplasy, SSCP, and population structure: A case study in the freshwater snail Bulinus truncatus. Mol. Biol. Evol. 17, 1926–1932. doi:10.1093/oxfordjournals.molbev.a026294
Ayad, D., Aribi, D., Hamon, B., Kedad, A., Simoneau, P., and Bouznad, Z. (2019). Distribution of large-spored Alternaria species associated with early blight of potato and tomato in Algeria. Phytopathol. Mediterr. 58, 139–149. doi:10.13128/Phytopathol_Mediterr-23988
Barril, P., and Nates, S. (2012). “Introduction to agarose and polyacrylamide gel electrophoresis matrices with respect to their detection sensitivities,” in Gel electrophoresis - principles and basics (InTech), 3–14. doi:10.5772/38573
Berbegal, M., López-Cortés, I., Salazar, D., Gramaje, D., Pérez-Sierra, A., García-Jiménez, J., et al. (2014). First report of Alternaria black spot of pomegranate caused by Alternaria alternata in Spain. Plant Dis. 98, 689. doi:10.1094/PDIS-07-13-0717-PDN
Buschiazzo, E., and Gemmell, N. J. (2006). The rise, fall and renaissance of microsatellites in eukaryotic genomes. BioEssays 28, 1040–1050. doi:10.1002/bies.20470
Cai, L., Guo, X. Y., and Hyde, K. D. (2008). Morphological and molecular characterisation of a new anamorphic genus Cheirosporium, from freshwater in China. Pers.: Mol. Phylogeny Evol. 20, 53–58. doi:10.3767/003158508X314732
Cheng, Y., Ming, Y., Yang, B., Liu, T., and Liu, J. (2016). First report of Alternaria alternata causing hybrid hazel (Corylus heterophylla × C. avellana) fruit drop in China. Dis. notes 101, 382. doi:10.1094/PDIS-07-16-1079-PDN
Delgado-Alvarado, E. A., Almaraz-Abarca, N., Escamirosa-Tinoco, C., Uribe-Soto, J. N., Antonio ávila-Reyes, J., Torres-Ricario, R., et al. (2018). Potential of random amplified microsatellites (RAMS) to typify and discriminate varieties of Physalis ixocarpa Brot. ex Hornem. Emir J. Food Agric. 30, 396–403. doi:10.9755/ejfa.2018.v30.i5.1684
Ding, S., Meinholz, K., Cleveland, K., Jordan, S. A., and Gevens, A. J. (2019). Diversity and virulence of Alternaria spp. causing potato early blight and brown spot in Wisconsin. Phytopathology 109, 436–445. doi:10.1094/PHYTO-06-18-0181-R
Drew, D., North, R. A., Nagarathinam, K., and Tanabe, M. (2021). Structures and general transport mechanisms by the major facilitator superfamily (MFS). Chem. Rev. 121, 5289–5335. doi:10.1021/ACS.CHEMREV.0C00983
Evanno, G., Regnaut, S., and Goudet, J. (2005). Detecting the number of clusters of individuals using the software structure: A simulation study. Mol. Ecol. 14, 2611–2620. doi:10.1111/j.1365-294X.2005.02553.x
Gannibal, P. B., Klemsdal, S. S., and Levitin, M. M. (2007). AFLP analysis of Russian Alternaria tenuissima populations from wheat kernels and other hosts. Eur. J. Plant Pathol. 119, 175–182. doi:10.1007/s10658-007-9159-z
Garant, D., Forde, S. E., and Hendry, A. P. (2007). The multifarious effects of dispersal and gene flow on contemporary adaptation. Funct. Ecol. 21, 434–443. doi:10.1111/j.1365-2435.2006.01228.x
Ginoya, C. M., and Gohel, N. M. (2016). RAPD based molecular diversity analysis of different Alternaria alternata (Fr.) Keissler isolates of chilli fruit rot. J. Pure Appl. Microbiol. 10, 183–190.
Guo, L. D., Xu, L., Zheng, W. H., and Hyde, K. D. (2004). Genetic variation of Alternaria alternata, an endophytic fungus isolated from Pinus tabulaeformis as determined by random amplified microsatellites (RAMS). Fungal divers. 16, 53–65.
Hammer, Ø., Harper, D. A. T., and Ryan, P. D. (2001). Past: paleontological statistics software package for education and data analysis. Palaeontol. Electron. 4, 1–9.
Hantula, J., Dusabenyagasani, M., and Hamelin, R. C. (1996). Random amplified microsatellites (RAMS) - a novel method for characterizing genetic variation within fungi. Eur. J. For. Pathology 26, 159–166. doi:10.1111/j.1439-0329.1996.tb00720.x
Hantula, J., and Müller, M. M. (1997). Variation within gremmeniella abietina in Finland and other countries as determined by random amplified microsatellites (RAMS). Mycol. Res. 101, 169–175. doi:10.1017/S0953756296002225
Healthline (2020). Are pecans good for you? Healthline, 1–14. Available at: https://www.healthline.com/nutrition/are-pecans-good-for-you#nutrition (Accessed January 30, 2021).
Kaur, M., Thind, S. K., and Arora, A. (2020a). Prevalence of ber black fruit spot (Alternaria alternata) and its management. Indian Phytopathol. 73, 245–251. doi:10.1007/s42360-020-00229-8
Kaur, T., Yadav, A. N., Sharma, S., and Singh, N. (2020b). Diversity of fungal isolates associated with early blight disease of tomato from mid Himalayan region of India. Archives Phytopathology Plant Prot. 53, 612–624. doi:10.1080/03235408.2020.1785098
Kgatle, M. G., Truter, M., Ramusi, T. M., Flett, B., and Aveling, T. A. S. (2018). Alternaria alternata, the causal agent of leaf blight of sunflower in South Africa. Eur. J. Plant Pathol. 151, 677–688. doi:10.1007/s10658-017-1402-7
Kreis, R. A., Dillard, H. R., and Smart, C. D. (2016). Population diversity and sensitivity to azoxystrobin of Alternaria brassicicola in New York State. Plant Dis. 100, 2422–2426. doi:10.1094/PDIS-03-16-0414-RE
Krüger, R. (2016). Growing a valuable pecan nut orchard. South african pecan nut Producers association (SAPPA). Available at: https://www.farmersweekly.co.za/farm-basics/how-to-crop/growing-a-valuable-pecan-nut-orchard/.
Kurt, Ş., Soylu, E. M., and Soylu, S. (2010). First report of black spot disease caused by Alternaria alternata in persimmon fruits in Turkey. Plant Dis. 94, 1069. doi:10.1094/pdis-94-8-1069c
Lawrence, D. P., Gannibal, P. B., Peever, T. L., and Pryor, B. M. (2013). The sections of Alternaria: formalizing species-group concepts. Mycologia 105, 530–546. doi:10.3852/12-249
Luchi, N., Ioos, R., and Santini, A. (2020). Fast and reliable molecular methods to detect fungal pathogens in woody plants. Appl. Microbiol. Biotechnol. 104, 2453–2468. doi:10.1007/S00253-020-10395-4
McDonald, B. A., and Linde, C. (2002). Pathogen population genetics, evolutionary potential, and durable resistance. Annu. Rev. Phytopathol. 40, 349–379. doi:10.1146/ANNUREV.PHYTO.40.120501.101443
McEachern, G. (2014). Future pecan production,” in Texas Pecan Growers Association’s 93th Annual Conference & Trade Show. Texas Pecan Growers Association, Frisco, TX.
Meng, J. W., He, D. C., Zhu, W., Yang, L. N., Wu, E. J., Xie, J. H., et al. (2018). Human-mediated gene flow contributes to metapopulation genetic structure of the pathogenic fungus Alternaria alternata from potato. Front. Plant Sci. 9, 198–210. doi:10.3389/FPLS.2018.00198
Meng, J. W., Zhu, W., He, M. H., Wu, E. J., Duan, G. H., Xie, Y. K., et al. (2015a). Population genetic analysis reveals cryptic sex in the phytopathogenic fungus Alternaria alternata. Sci. Rep. 5, 18250. doi:10.1038/srep18250
Meng, J., Zhu, W., He, M., Wu, E., Yang, L., Shang, L., et al. (2015b). High genotype diversity and lack of isolation by distance in the Alternaria solani populations from China. Plant Pathol. 64, 434–441. doi:10.1111/PPA.12275
Mugao, L. (2023). Morphological and molecular variability of Alternaria solani and Phytophthora infestans causing tomato blights. Int. J. Microbiol. 2023, 8951351. doi:10.1155/2023/8951351
Nasr Esfahani, M. (2018). Analysis of virulence and genetic variability of Alternaria alternata associated with leaf spot disease in potato plants in Iran. Acta Mycol. 53, 1–9. doi:10.5586/am.1105
Nguyen, H. D. T., Lewis, C. T., Lévesque, C. A., and Gräfenhan, T. (2016). Draft genome sequence of Alternaria alternata ATCC 34957. Genome Announc. 4, e01554-15. doi:10.1128/GENOMEA.01554-15
Ozkilinc, H., and Sevinc, U. (2018). Molecular phylogenetic species in Alternaria pathogens infecting pistachio and wild relatives. 3 Biotech. 8, 250–257. doi:10.1007/s13205-018-1277-0
Peakall, R., and Smouse, P. E. (2012). GenALEx 6.5: genetic analysis in excel. Population genetic software for teaching and research-an update. Bioinformatics 28, 2537–2539. doi:10.1093/bioinformatics/bts460
Persistence Market Research (2018). Pecans market to reach US$ 3,000 Mn by 2026 - persistence market research. Persistence market research, 1. Available at: https://www.globenewswire.com/news-release/2018/04/16/1471843/0/en/Pecans-Market-to-Reach-US-3-000-Mn-by-2026-Persistence-Market-Research.html (Accessed January 30, 2021).
Pritchard, J. K., Stephens, M., and Donnelly, P. (2000). Inference of population structure using multilocus genotype data. Genetics 155, 945–959. doi:10.1093/genetics/155.2.945
Pryor, B., and Michailides, T. (2002). Morphological, pathogenic, and molecular characterization of Alternaria isolates associated with Alternaria late blight of pistachio. Phytopathology 92, 406–416. doi:10.1094/PHYTO.2002.92.4.406
Rahimloo, T., and Ghosta, Y. (2015). The occurrence of Alternaria species on cabbage in Iran. Zemdirb. Agric. 102, 343–350. doi:10.13080/z-a.2015.102.044
Sambrook, J., Russell, D. W., and Sambrook, J. (2006). The condensed protocols from molecular cloning: a laboratory manual. New York: Cold Spring Harbor Laboratory Press.
Sánchez-Torres, P. (2021). Molecular mechanisms underlying fungicide resistance in citrus postharvest green mold. J. Fungi 7, 783–801. doi:10.3390/JOF7090783
SAPPA (2016). SA Pecan,” in South African Pecan Nut Producers Association (SAPPA) NPC Magazine. Available at: https://www.sappa.za.org/publications/.
Siddiquee, S., Tan, S. G., Yusuf, U. K., Fatihah, N. H. N., and Hasan, M. M. (2012). Characterization of Malaysian Trichoderma isolates using random amplified microsatellites (RAMS). Mol. Biol. Rep. 39, 715–722. doi:10.1007/s11033-011-0790-6
Sillo, F., Savino, E., Giordano, L., Girometta, C., Astegiano, D., Picco, A. M., et al. (2016). Analysis of genotypic diversity provides a first glimpse on the patterns of spread of the wood decay fungus Perenniporia fraxinea in an urban park in northern Italy. J. Plant Pathology 98, 617–624. doi:10.4454/JPP.V98I3.005
Simmons, E. G. (2007). Alternaria: An identification manual. CBS biodiversity series. Utrecht, The Netherlands: CBS Fungal Biodiversity Centre.
Stefansson, T. S., McDonald, B. A., and Willi, Y. (2014). The influence of genetic drift and selection on quantitative traits in a plant pathogenic fungus. PLoS One 9, 112523. doi:10.1371/journal.pone.0112523
Terakami, S., Moriya, S., Adachi, Y., Kunihisa, M., Nishitani, C., Saito, T., et al. (2016). Fine mapping of the gene for susceptibility to black spot disease in Japanese pear (Pyrus pyrifolia Nakai). Breed. Sci. 66, 271–280. doi:10.1270/jsbbs.66.271
Thomma, B. P. H. J. (2003). Alternaria spp.: from general saprophyte to specific parasite. Mol. Plant Pathol. 4, 225–236. doi:10.1046/J.1364-3703.2003.00173.X
Tran, N. T., Miles, A. K., Smith, M. W., Dietzgen, R. G., and Drenth, A. (2018). Pathogenicity of Phyllosticta citricarpa ascospores on citrus spp. Plant Dis. 102, 1386–1393. doi:10.1094/PDIS-08-17-1331-RE
Turzhanova, A., Khapilina, O. N., Tumenbayeva, A., Shevtsov, V., Raiser, O., and Kalendar, R. (2020). Genetic diversity of Alternaria species associated with black point in wheat grains. PeerJ 2020, e9097. doi:10.7717/peerj.9097
van der Waals, J. E., Korsten, L., and Slippers, B. (2004). Genetic diversity among Alternaria solani isolates from potatoes in South Africa. Plant Dis. 88, 959–964. doi:10.1094/PDIS.2004.88.9.959
Weir, T. L., Huff, D. R., Christ, B. J., Peter Romaine, C., and Christ C Peter Romaine, B. J. (1998). RAPD-PCR analysis of genetic variation among isolates of Alternaria solani and Alternaria alternata from potato and tomato. Mycologia 90, 813–821. doi:10.1080/00275514.1998.12026975
Whitlock, M. C., and Mccauley, D. E. (1999). Indirect measures of gene flow and migration: FST not equal to 1/(4nm + 1). Heredity 82, 117–125. doi:10.1038/sj.hdy.6884960
Woudenberg, J., Groenewald, J., Binder, M., and Crous, P. (2013). Alternaria redefined. Stud. Mycol. 75, 171–212. doi:10.3114/sim0015
Woudenberg, J. H. C., Groenewald, J. Z., van der Merwe, N. A., and Crous, P. W. (2015a). Diversity and movement of indoor Alternaria alternata across the mainland USA. Fungal Genet. Biol. 81, 62–72. doi:10.1016/j.fgb.2015.05.003
Woudenberg, J. H. C., Seidl, M. F., Groenewald, J. Z., de Vries, M., Stielow, J. B., Thomma, B. P., et al. (2015b). Alternaria section Alternaria: species, formae speciales or pathotypes? Stud. Mycol. 82, 1–21. doi:10.1016/j.simyco.2015.07.001
Yan, K., Pei, Z., Meng, L., Zheng, Y., Wang, L., Feng, R., et al. (2022). Determination of community structure and diversity of seed-vectored endophytic fungi in Alpinia zerumbet. Front. Microbiol. 13, 814864. doi:10.3389/fmicb.2022.814864
Yang, L. N., He, M. H., Ouyang, H. B., Zhu, W., Pan, Z. C., Sui, Q. J., et al. (2019). Cross-resistance of the pathogenic fungus Alternaria alternata to fungicides with different modes of action. BMC Microbiol. 19, 205–210. doi:10.1186/s12866-019-1574-8
Yang, N., Ma, G., Chen, K., and Wu, X. (2018). The population genetics of Alternaria tenuissima in four regions of China as determined by microsatellite markers obtained by transcriptome sequencing. Front. Microbiol. 9, 2904. doi:10.3389/fmicb.2018.02904
Keywords: Alternaria alternata, ascomycota fungi, Carya illinoinensis, genetic diversity, microsatellites
Citation: Achilonu CC, Gryzenhout M, Marais GJ, Madisha MT and Ghosh S (2023) Random amplified microsatellites (RAMS) analysis ascertains genetic variation of Alternaria alternata causing black spot disease on Carya illinoinensis in South Africa. Front. Genet. 14:1213102. doi: 10.3389/fgene.2023.1213102
Received: 27 April 2023; Accepted: 11 September 2023;
Published: 27 September 2023.
Edited by:
Guillaume J. Bilodeau, Canadian Food Inspection Agency (CFIA), CanadaReviewed by:
Ahmed H. El-Sappah, Zagazig University, EgyptRichard Hamelin, University of British Columbia, Canada
Copyright © 2023 Achilonu, Gryzenhout, Marais, Madisha and Ghosh. This is an open-access article distributed under the terms of the Creative Commons Attribution License (CC BY). The use, distribution or reproduction in other forums is permitted, provided the original author(s) and the copyright owner(s) are credited and that the original publication in this journal is cited, in accordance with accepted academic practice. No use, distribution or reproduction is permitted which does not comply with these terms.
*Correspondence: Conrad Chibunna Achilonu, Y2NhY2hpbG9udUBnbWFpbC5jb20=