 Wenyu Zhang
 Zhixiang Lin
- Department of Statistics, The Chinese University of Hong Kong, Hong Kong, China
Single-cell multiomics technologies, where the transcriptomic and epigenomic profiles are simultaneously measured in the same set of single cells, pose significant challenges for effective integrative analysis. Here, we propose an unsupervised generative model, iPoLNG, for the effective and scalable integration of single-cell multiomics data. iPoLNG reconstructs low-dimensional representations of the cells and features using computationally efficient stochastic variational inference by modelling the discrete counts in single-cell multiomics data with latent factors. The low-dimensional representation of cells enables the identification of distinct cell types, and the feature by factor loading matrices help characterize cell-type specific markers and provide rich biological insights on the functional pathway enrichment analysis. iPoLNG is also able to handle the setting of partial information where certain modality of the cells is missing. Taking advantage of GPU and probabilistic programming, iPoLNG is scalable to large datasets and it takes less than 15 min to implement on datasets with 20,000 cells.
1 Introduction
With the rapid development of single-cell technologies, the abundant biological information in the single cell is collected at unprecedented resolution. More recently, sequencing methods enable the simultaneous measurement of epigenome and transcriptome from a common set of single cells. For example, sci-CAR (Cao et al., 2018) jointly profiles chromatin accessibility and mRNA (CAR) in each of thousands of single cells; SNARE-seq (Chen et al., 2019b), SHARE-seq (Ma et al., 2020), Paired-seq (Zhu et al., 2019) can measure chromatin accessibility and gene expression in the same single cell; Paired-Tag (Zhu et al., 2021) is an ultra-high-throughput method for joint profiling of histone modifications and transcriptome in single cells to produce cell-type-resolved maps of chromatin state and transcriptome in complex tissues.
The single-cell multiomics datasets generated by these technologies pose challenges for effective integrative analysis due to the characteristics of the datasets. First, the single-cell data is high-dimensional yet very sparse, and high technical variation is present in single-cell datasets. Second, the level of noise in chromatin accessibility data or histone modification data is usually higher than gene expression data in single-cell multiomics datasets, which suggests that different data modalities cannot be simply treated the same.
Computational tools for the integrative analysis of single-cell assays are essential to provide more comprehensive biological insights at the cellular level. Integration problems in single-cell biology can be divided into those associated with the integration of unmatched data (that is, different modalities profiled from different cells) or matched (that is, different modalities profiled from the same cell) data (Miao et al., 2021). A few methods have been developed for the integrative analysis of unmatched data (Duren et al., 2018; Zeng et al., 2019; Cao et al., 2020; Lin et al., 2020; Wangwu et al., 2021; Zeng et al., 2021; Zeng and Lin, 2021; Cao et al., 2022; Demetci et al., 2022), which are not applicable to matched data. Some matched data integration methods (Kim et al., 2020; Wang et al., 2020; Gayoso et al., 2021) are designed for technologies that jointly profile transcriptomic and surface protein data such as CITE-seq (Stoeckius et al., 2017) and REAP-seq (Peterson et al., 2017). In this study, we mainly focus on single-cell multiomics technologies simultaneously measuring transcriptomic and epigenomic profiles in the same individual cells. Unsupervised methods have been developed for this type of data, including Multi-Omics Factor Analysis (MOFA+) (Argelaguet et al., 2018; Argelaguet et al. 2020), single-cell Aggregation and Integration (scAI) (Jin et al., 2020) and jointly semi-orthogonal non-negative matrix factorization (JSNMF) (Ma et al., 2022). Both MOFA+ and scAI infers a low-dimensional representation of the data using a small number of latent factors that are expected to capture the heterogeneous cellular variability. The key difference between MOFA+ and scAI is that MOFA+ is based on the Bayesian Group Factor Analysis framework, while scAI is based on non-negative matrix factorization. JSNMF assumes different latent variables for the two molecular modalities, and integrates the information of transcriptomic and epigenomic data with consensus graph fusion.
In this paper, we propose an unsupervised generative model, iPoLNG, for the effective and scalable integration of single-cell multiomics data, where transcriptomic and epigenomic (chromatin accessibility or histone modifications) data were obtained from the same cell. iPoLNG reconstructs low-dimensional representations of the cells and features using computationally efficient stochastic variational inference by modelling the discrete counts in single-cell multiomics data with latent factors. The hyperparameters introduced to tackle the difference in the levels of noise across different data modalities can be estimated automatically through a heuristic procedure. By applying iPoLNG to real datasets, we demonstrate that the low-dimensional representation of cells leads to improved clustering performance, and the feature by factor loading matrices help characterize cell-type specific markers and provide rich and consistent biological insights on the functional pathway enrichment analysis. iPoLNG is also able to handle the setting of partial information where certain modality of the cells is missing. We also illustrate the effectiveness of our model in the simulation study. Taking advantage of GPU and probabilistic programming, iPoLNG is scalable to large datasets and it takes less than 15 min to implement on datasets with 20,000 cells.
2 Materials and methods
2.1 PoLNG for one data modality
We first introduce some notations. Let
2.1.1 Model formulation
The basic idea of the PoLNG model is to model the data matrix W as random variables sampled from Poisson distributions, the parameters of which are determined by two low-rank non-negative matrices
where σ(⋅) is the softmax function, the lth element of which is given by
μk is a vector of length J serving as the mean of the Logit-Normal distribution, Σk is a J by J diagonal matrix serving as the covariance matrix of the Logit-Normal distribution, and si is the scaling factor to take into account the sequencing depth for the ith cell.
The PoLNG model is designed to facilitate the downstream analysis of single-cell data. In general, each column of L represents a latent factor that can disentangle the heterogeneous cellular information, while each row of Θ represents a latent factor for features. Since Θ is constrained to have row sum equal to 1, we also impose a soft normalization on L by introducing the scaling factor si.
We further illustrate the choice of si. Utilizing the simplex constraint for each row of Θ, we have
which suggests that the choice of si will softly constrain the row sum of L. To alleviate the effect of the difference in sequencing depth for the cells, we constrain the summation
To obtain the parameter estimation, we implement the stochastic variational inference (SVI) algorithm (Hoffman et al., 2013) with the deep universal probabilistic program Pyro (Bingham et al., 2019). Conditional on the data W, we assume the independency across all li,k, across all
By default, the hyperparameters in the prior in model (1) are set as
The default initial values for the parameters in the variational distributions are set as
The estimated parameters
Note that the covariance matrix Σk in the Logit-Normal distribution can capture the correlation structure in the features if we do not constrain it to be diagonal. However, if we do not impose the diagonal constraint on the covariance matrix, the number of free parameters in one covariance matrix will increase from J to J(J + 1)/2, which brings high computational cost. Therefore, we assume that the covariance matrix Σk is diagonal for efficient and lightweight implementation of the model.
2.1.2 Relationship to existing models
The PoLNG model can be considered as a special case in Poisson Factor Analysis (Zhou et al., 2012) under novel priors. One model that is closely related to our PoLNG model is called the Gamma-Poisson (GaP) model (Canny, 2004), and Buntine and Jakulin (2006) extended the GaP model with Dirichlet priors on θk,⋅:
where γk is the concentration parameter in the Dirichlet distribution.
The difference between the GaP model and the PoLNG model is that the Dirichlet prior in the GaP model is replaced by the Logit-Normal distribution in the softmax basis in the PoLNG model, as suggested by Atchison and Shen (1980). This change keeps the simplex constraint for each row of Θ, but it allows for carrying out unconstrained optimization of the cost function without the simplex constraints (Srivastava and Sutton, 2017). Moreover, it improves computational stability in the stochastic variational inference method. When coded in the Pyro program, our model (1) with logit-normal distribution is less likely to raise numerical errors than model (9) with the Dirichlet prior.
For the parameter estimation in the GaP model, Buntine and Jakulin (2006) proposed a mean-field variational inference algorithm and a Gibbs sampling algorithm by introducing a latent variable with dimension I × J × K. However, because I and J are typically large in single-cell data, the computational and memory cost of introducing such a 3-dimensional latent variable would be unaffordable for a moderate K. In contrast, our SVI algorithm does not introduce memory consuming latent variables and enables GPU acceleration when coded in the deep universal probabilistic program Pyro.
The PoLNG model is also related to non-negative matrix factorization (NMF) (Lee and Seung, 1999). It can be viewed as a probabilistic non-negative matrix factorization model, as it models the expectation of the count data as the multiplication of two non-negative matrices, i.e.,
2.2 iPoLNG for multiomics data
For the single-cell multiomics data, suppose we have two data modalities,
To model single-cell multiomics data, we extend the PoLNG model to the iPoLNG model. The model overview is presented in Figure 1. In the iPoLNG model, we model the expectation of the mth data modality as the multiplication of two non-negative matrices, i.e.,
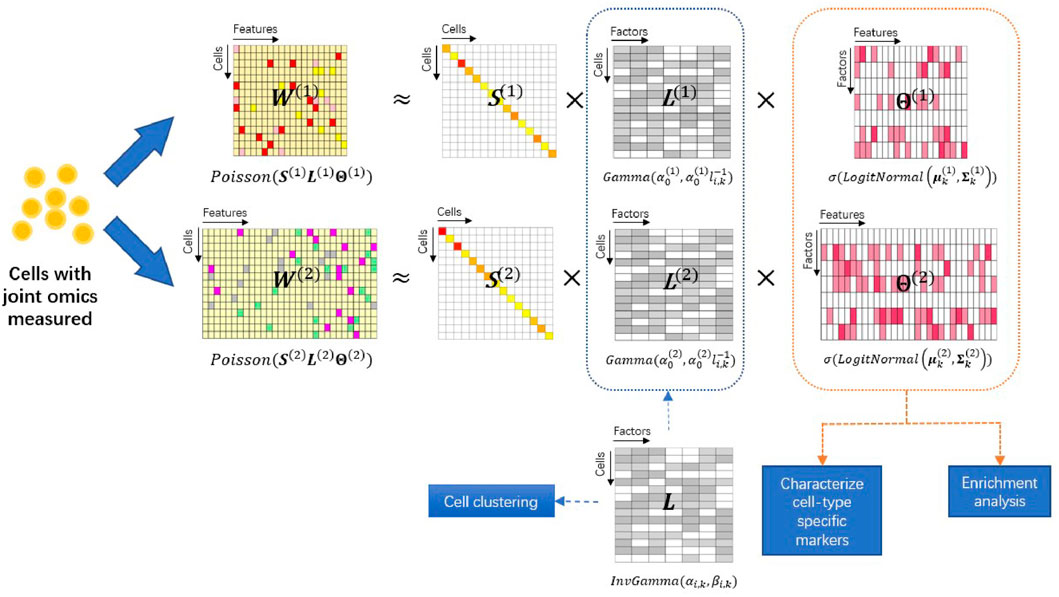
FIGURE 1. Overview of the iPoLNG model. The input consists of two data modalities measuring different aspects of biological profiles in the same set of cells. Each data modality W(m) is approximated by the matrix product of a diagonal matrix S(m) that takes into account the cell sequencing depth, a feature loading matrix Θ(m) and a cell loading matrix L(m) for m = 1, 2. The feature loading matrices can characterize cell-type specific markers and facilitate functional pathway enrichment analysis. The cell loading matrices have different variances due to the levels of noise across different data modalities, but share the same mean, L, which represents the low-dimensional cell embedding and facilitates cell clustering.
More specifically, the iPoLNG model is proposed as follows:
where li,k is the element in the ith row and the kth column in L, αi,k, βi,k is the shape and scale parameter in the inverse Gamma distribution,
In the iPoLNG model, we use an inverse gamma distribution to model the elements in L, such that
note that the variance of
To obtain the parameter estimation in Pyro, conditional on the data W(1), W(2), we assume the independency across all
by default, the hyperparameters in the prior in model (10) are set as
if no initial values are provided, the default initial values for the parameters in the variational distributions are set as
the estimated parameters
We propose a heuristic procedure to select
The idea behind this heuristic procedure is based on Eq. 11, while the conditional mean and variance are approximated with the variational mean and variance. According to Eq. 11, there exists a linear relationship between
We also use the variational parameters obtained from fitting the PoLNG model to individual data modality as the warm start for the iPoLNG model. Because a large
3 Results
3.1 Real data analysis
To show that our model facilitates downstream analysis, iPoLNG is applied to several single-cell multiomics datasets, including one dataset generated from SHARE-seq, which measures gene expression and chromatin accessibility in the same single cells from a mouse brain, one dataset generated from Paired-Tag, which jointly profiles H3K27me3 histone modification and transcriptome in the same single cells from a mouse brain, and two cryopreserved human peripheral blood mononuclear (PBMC) datasets generated from 10X Genomics Single Cell Multiome ATAC + Gene Expression Sequencing.
For these datasets, we first filter out the low-quality cells that express in less than 500 genes in the gene expression data or in less than 200 regions in the epigenomic data. To select the informative features, we perform log-normalization with a scaling factor of 10,000 and select the top 5,000 highly variable genes and top 20,000 highly variable regions with selection.method = ‘‘vst” using R package Seurat (Stuart et al., 2019). The log normalizaion is merely used for selecting the highly variable features and the counts of the features are modeled by iPoLNG. Finally we take out the common cells in both data modalities as the input of the single cell multiomics data analysis.
3.1.1 iPoLNG achieves good clustering performance on datasets from different technologies
We evaluate the clustering performance of iPoLNG on these datasets and compare our method with several existing methods designed for single-cell multiomics data integration, including scAI (Jin et al., 2020) and MOFA+ (Argelaguet et al., 2018; Argelaguet et al., 2020). scAI is implemented with the default parameters, and MOFA+ is implemented with the default parameters and two algorithms: mean-field variational inference (VI) using CPU and stochastic variational inference (SVI) with GPU acceleration. iPoLNG accepts raw count data as the input, while scAI and MOFA + accept the log-normalized data as the input. All these three methods can infer a low-dimensional representation of the data with a user-defined number of latent factors. We set the number of latent factors K = 50. After obtaining the cell by factor loading matrix, we perform Leiden clustering algorithm (Traag et al., 2019) with a binary search for the resolution parameter to cluster the data into the specific number of clusters. For datasets with given cell-type labels in the publications, the number of clusters is set as the number of the unique labels. The number of cluster is set as 8 for PBMC3k dataset and 19 for PBMC10k dataset.
For datasets with given cell-type labels, Adjusted Rand Index (ARI) (Hubert and Arabie, 1985) is computed to measure the accuracy of the clustering results. For PBMC datasets with unknown cell-type labels, Residual Average Gini Index (RAGI) score (Chen et al., 2019a) is computed based on canonical marker genes and housekeeping genes (see Supplementary Materials). A high RAGI score indicates a reasonable clustering result where the expression of marker genes is high in one or a few clusters, while the expression of housekeeping genes is broadly distributed across all the clusters. Considering the fact that the given cell-type labels in the original publications are also from some computational methods and can be wrong for some of the cells, we also compute the RAGI score. As Leiden clustering algorithm makes use of greedy search and leads to different clustering results with different initialization, we calculate the mean and standard error in 10 runs with different random seeds in the clustering step.
The clustering performance evaluated by ARI or RAGI is presented in Figure 2. In the Paired-Tag mouse brain dataset, iPoLNG achieves the highest ARI score (0.698), followed by scAI (0.653). In the SHARE-seq mouse brain dataset, iPoLNG reaches an ARI score of 0.606, which is comparable to the ARI score of 0.607 in scAI, although the clustering results of iPoLNG show a relatively high fluctuation. Neither VI nor SVI versions of MOFA + performs well in these two datasets. The clustering performance measured by RAGI also shows a trend similar to that measured by ARI for Paired-Tag and SHARE-seq mouse brain datasets. In 10xPBMC3k dataset, iPoLNG has the highest RAGI score (0.423). In 10xPBMC10k dataset, the RAGI score of iPoLNG is 0.426, slightly higher than that of MOFA+ (0.418 for SVI and 0.419 for VI), while scAI cannot perform as well as the other methods in this dataset.
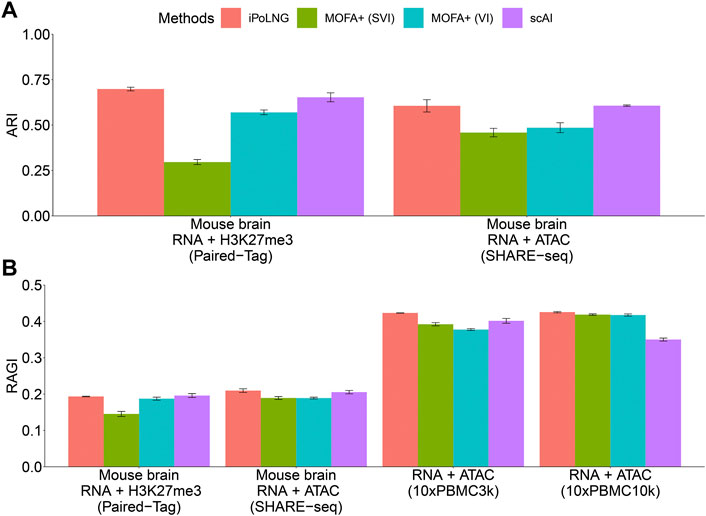
FIGURE 2. Clustering performance of iPoLNG, MOFA+ (SVI), MOFA+ (VI), and scAI on real data. (A) Comparison of ARI scores for Paired-Tag and SHARE-seq with given cell-type labels. (B) Comparison of RAGI scores for Paired-Tag, SHARE-seq, 10xPBMC3k, and 10xPBMC10k. The error bar represents the mean and standard error in 10 runs with different random seeds in the clustering step.
In some applications, the cell structure revealed by different modalities can be different. We illustrate that iPoLNG is able to handle such scenarios by comparing the clustering performance of PoLNG (the simplified version of iPoLNG with just one data modality) with iPoLNG. In the Paired-Tag mouse brain dataset, the ARI score of running PoLNG for the single-cell RNA-seq data is 0.594, while the ARI score of running PoLNG for the single-cell histone modification data is very close to 0. In the SHARE-seq mouse brain dataset, the ARI score of running PoLNG for the single-cell RNA-seq data is 0.500, while the ARI score of running PoLNG for the single-cell ATAC-seq data is 0.02. The large difference in ARI between the two modalities indicates that the cell structure revealed by these modalities are different. When we integrate the information of both modalities using iPoLNG, the ARI score improves significantly compared to using RNA alone (from 0.594 to 0.698 in the Paired-Tag mouse brain dataset, and from 0.500 to 0.606 in the SHARE-seq mouse brain dataset).
3.1.2 The factor loading matrices in iPoLNG provide rich biological insights
We inspect the cell by factor loading matrix
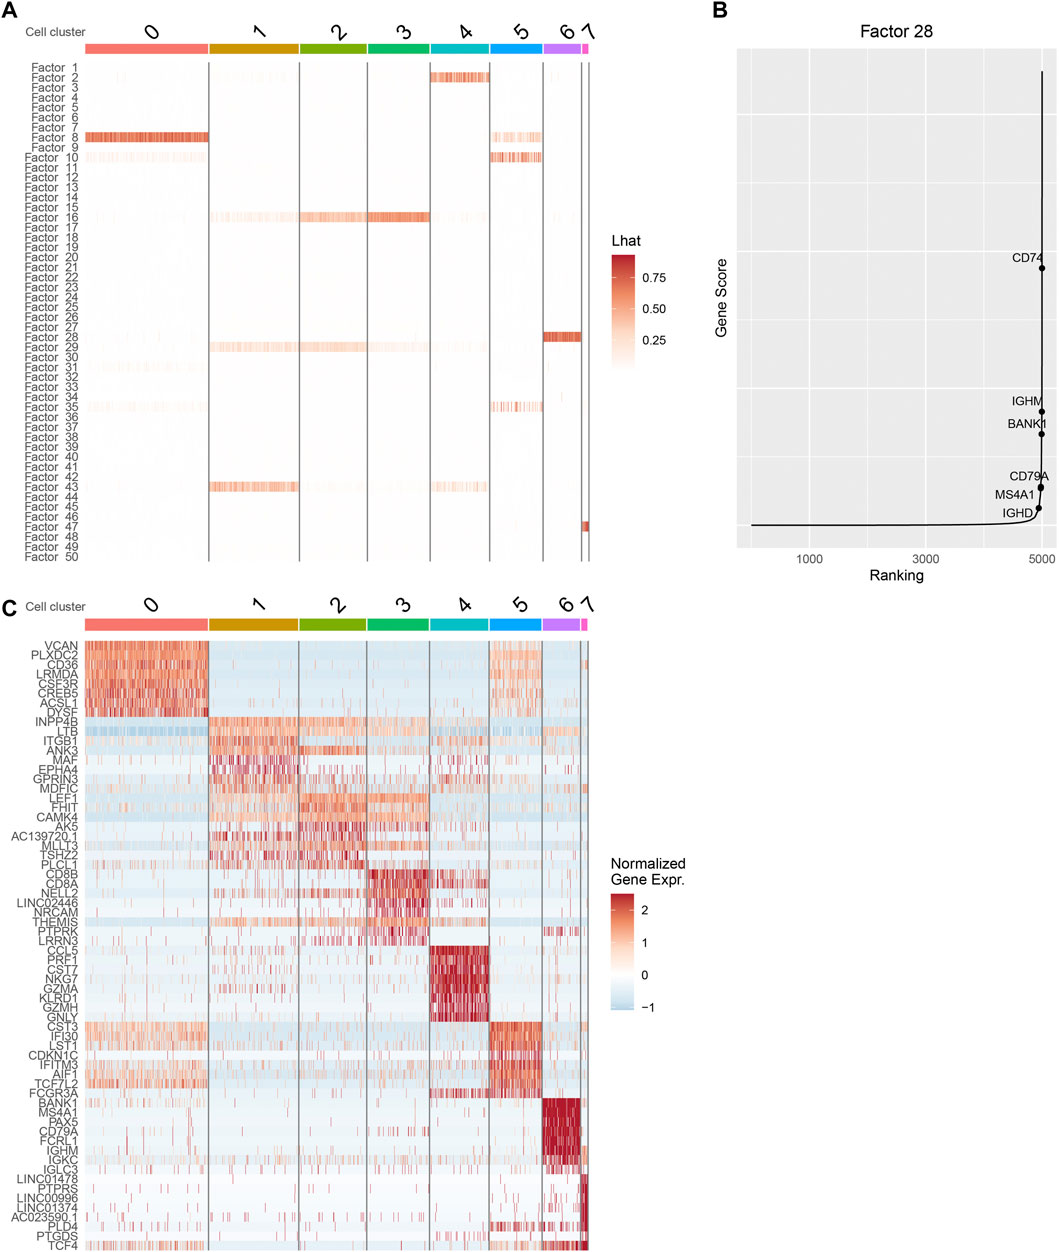
FIGURE 3. Downstream analysis with iPoLNG for 10xPBMC3k data. (A) The heatmap of the cell by factor loading matrix
Next, we focus on cluster 6, whose major factor score is allocated to factor 28. From the heatmap of gene expression, we find that cells in cluster 6 tend to have high gene expression values in canonical marker genes of B cells, including BANK1, MS4A1, CD79A, and IGHM (Figure 3C). By plotting
We also perform gene ontology (GO) enrichment analysis using the feature by factor loading matrices
3.1.3 iPoLNG is able to handle partial information in the input
In some applications, we have one dataset that have multiple modalities, but the other dataset that only measures one of the modalities, and we expect that the dataset with only one modality can be jointly trained with the multi-modal dataset so that it can borrow some information from the multi-modal dataset. iPoLNG is able to handle such partial information in the input by setting the unobserved count as 0, which is mathematically equivalent to not including the unobserved data in the likelihood function of the data.
We design a new experiment to illustrate the power of iPoLNG to handle partial information and compare the result with Cobolt (Gong et al., 2021), which also enables integrating single-modality dataset with multi-modal dataset. First, for the epigenomic data modality W(2), we randomly mask the data matrix for a certain percentage of the cells by setting the observed count as 0, i.e.,
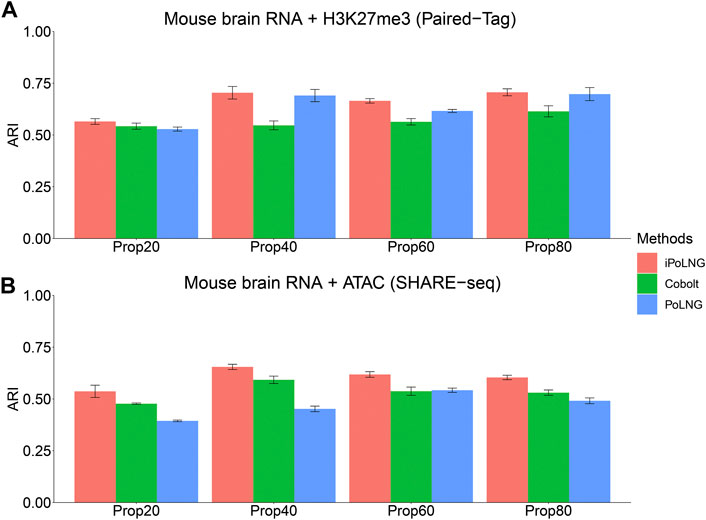
FIGURE 4. Clustering performance of iPoLNG, Cobolt and PoLNG on the partially masked dataset for (A) Paired-Tag mouse brain RNA + H3K27me3 and (B) SHARE-seq mouse brain RNA + ATAC. We set the percentage of masked cells to be 20%, 40%, 60% and 80% of all the cells.
3.2 Model validation and comparison using simulated data
We next perform simulation study to demonstrate the effectiveness of our proposed method.
To generate simulated data, we first fit the iPoLNG model with K = 50 to one dataset from Paired-Tag, where W(1) is the transcriptome data and W(2) is the H3K27me3 histone modification data of a mouse brain, and obtain the hyperparameters
We again evaluate the clustering performance of iPoLNG and compare our method with scAI and MOFA+. We varied the number of factors K as 5, 20, 50 for all methods. The boxplots of ARI values for the simulated datasets are presented in Figure 5A. When the level of noise is low (sequencing depth divided by 1 or 2), both iPoLNG and scAI can reach ARI values of nearly 1, which suggests that they can accurately recover the cell types in the simulated data. As the level of noise increases, the performance of all methods becomes worse as expected, but iPoLNG still remains the best method among all settings. We also note that iPoLNG is robust to the choice of the number of factors. When K is larger than 5, i.e. the number of cell types, the clustering performance of iPoLNG does not decrease significantly under small or moderate levels of noise.
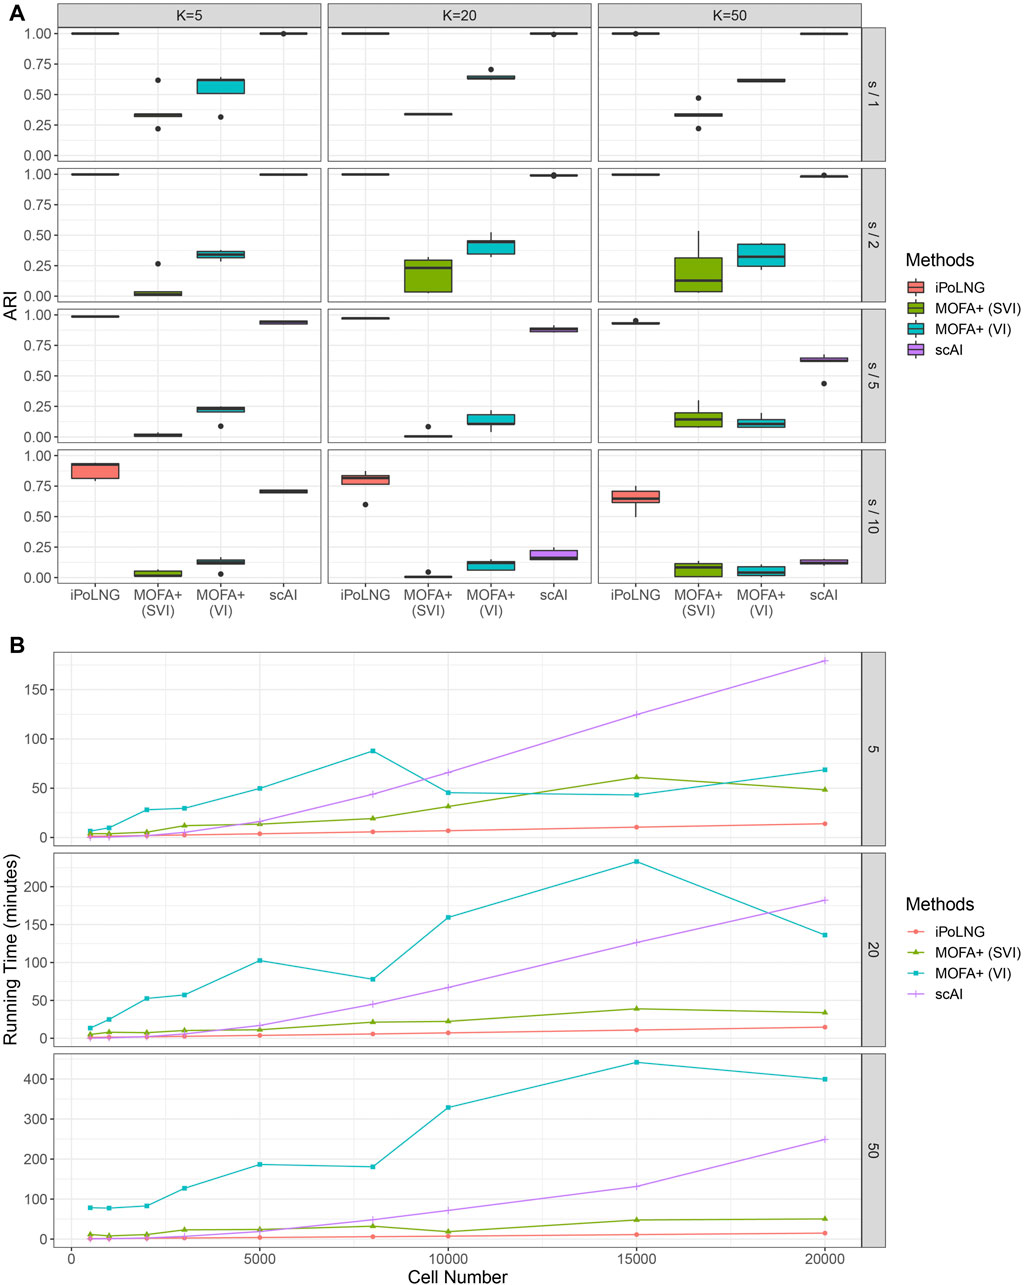
FIGURE 5. Comparison of clustering performance and running time for simulated data. (A) ARI scores for K = 5, 20, 50 and the level of noise is adjusted by dividing the sequencing depth by 1, 2, 5, and 10. The boxplot represents the ARI scores for 5 simulated datasets under the same setting. (B) Computational time for iPoLNG, MOFA+ and scAI. MOFA+ (VI) and scAI were run on a server with Intel Xeon Gold 6246R CPU and 120 GB RAM. iPoLNG and MOFA+ (SVI) were run on a server with NVIDIA Tesla V100 GPU and 80 GB RAM.
We also evaluate the running time of the methods (Figure 5B). Cells are sampled with replacement from the preprocessed 10xPBMC3k dataset to generate simulated data with different numbers of cells. With GPU acceleration, the running time of iPoLNG for the simulated dataset with 20,000 cells is 13.9 min for K = 5, 14.7 min for K = 20 and 14.9 min for K = 50, which remains the smallest among all the methods under the same setting. MOFA+ (SVI) is the second fastest method, but its running time is 2–6 times the running time of iPoLNG. The slight change of running time across K also illustrates iPoLNG’s running time is robust to the number of factors K. By contrast, the running time of MOFA+ and scAI can be significantly affected by the number of factors.
4 Discussion
Single-cell multiomics technologies generate datasets with multi-modal measurements from the same set of cells, thus posing significant challenges for integrating and characterizing multiple types of measurements in a biologically meaningful way. The single-cell data is high-dimensional yet intrinsically sparse, and different layers of single-cell multiomics data usually exhibit different levels of noise.
In this study, we introduced iPoLNG, an unsupervised method for integrating single-cell multiomics data to dissect the cellular heterogeneity from multiple data modalities. From a biological perspective, iPoLNG infers two kinds of low-dimensional representations of the high-dimensional single-cell multiomics data: one cell by factor loading matrix and two feature by factor loading matrices. The cell by factor loading matrix can identify distinct cell types and improve clustering accuracy compared to other models that reconstruct the latent space of cells, and the feature by factor loading matrices can characterize cell-type specific markers and facilitate gene ontology (GO) enrichment analysis. From a technical perspective, iPoLNG presents several advantages. First, it directly models the unique molecular identifiers (UMIs) of single-cell multiomics data and takes into account the sequencing depths of cells, which suggests the discrete counts without any normalization procedure can directly serve as the input of the model. Second, as a scalable algorithm, stochastic variational inference with GPU acceleration in iPoLNG potentially enables the computation of large-scale single-cell datasets with a considerably high speed. Third, the hyperparameters that control the levels of noise across different data modalities in iPoLNG are automatically learned by fitting the PoLNG model to individual data modality, which saves the efforts to tune these hyperparameters.
iPoLNG also exhibits some limitations. First, modelling the discrete counts directly suggests that it lacks the flexibility to fit continuous data. Second, this method is tailored specifically for multi-modal measurements from the same sample space, contrasting with some other methods (Stuart et al., 2019; Welch et al., 2019) that aim at integrating cells on the same feature space. Third, iPoLNG assumes independence between features by a diagonal covariance matrix in the Logit-Normal distribution, but genomic features are known to show interaction via gene regulatory networks (Duren et al., 2017; Colomé-Tatché and Theis, 2018; Delgado and Gómez-Vela, 2019).
We speculate the future direction of iPoLNG as follows. We may incorporate the idea of Deep Exponential Families (Ranganath et al., 2015) to model the complex biological structures by adding additional layers for the latent factors. The model may also be extended to analyze spatial epigenome-transcriptome co-profiling data by modelling the information of spatial coordinates with links (Chang and Blei, 2009). Additionally, the model may be extended to incorporate the regulatory links between transcriptome and epigenome (Colomé-Tatché and Theis, 2018).
Data availability statement
Publicly available datasets were analyzed in this study. This data can be found here: https://www.ncbi.nlm.nih.gov/geo/query/acc.cgi?acc=GSE140203 https://www.ncbi.nlm.nih.gov/geo/query/acc.cgi?acc=GSE152020 https://www.10xgenomics.com/resources/datasets/pbmc-from-a-healthy-donor-granulocytes-removed-through-cell-sorting-10-k-1-standard-2-0-0. The processed data can also be accessed from GitHub repository: iPoLNG_source. https://github.com/cuhklinlab/iPoLNG_source. iPoLNG is implemented in Python, and it is freely available under the LGPL-3.0 license on GitHub (https://github.com/cuhklinlab/iPoLNG).
Author contributions
WZ conducted the research. ZL supervised the research. WZ wrote the first draft of the manuscript. All authors contributed to manuscript revision, read, and approved the submitted version.
Funding
This work has been supported by The Chinese University of Hong Kong startup grant (4930181), The Chinese University of Hong Kong Science Faculty’s Collaborative Research Impact Matching Scheme (CRIMS 4620033), and Hong Kong Research Grant Council (ECS 24301419 and GRF 14301120).
Conflict of interest
The authors declare that the research was conducted in the absence of any commercial or financial relationships that could be construed as a potential conflict of interest.
Publisher’s note
All claims expressed in this article are solely those of the authors and do not necessarily represent those of their affiliated organizations, or those of the publisher, the editors and the reviewers. Any product that may be evaluated in this article, or claim that may be made by its manufacturer, is not guaranteed or endorsed by the publisher.
Supplementary material
The Supplementary Material for this article can be found online at: https://www.frontiersin.org/articles/10.3389/fgene.2023.998504/full#supplementary-material
References
Argelaguet, R., Velten, B., Arnol, D., Dietrich, S., Zenz, T., Marioni, J. C., et al. (2018). Multi-omics factor analysis—A framework for unsupervised integration of multi-omics data sets. Mol. Syst. Biol. 14, e8124. doi:10.15252/msb.20178124
Argelaguet, R., Arnol, D., Bredikhin, D., Deloro, Y., Velten, B., Marioni, J. C., et al. (2020). Mofa+: A statistical framework for comprehensive integration of multi-modal single-cell data. Genome Biol. 21, 111–117. doi:10.1186/s13059-020-02015-1
Atchison, J., and Shen, S. M. (1980). Logistic-normal distributions: Some properties and uses. Biometrika 67, 261–272. doi:10.2307/2335470
Bingham, E., Chen, J. P., Jankowiak, M., Obermeyer, F., Pradhan, N., Karaletsos, T., et al. (2019). Pyro: Deep universal probabilistic programming. J. Mach. Learn. Res. 20, 973–978.
Buntine, W., and Jakulin, A. (2006). “Discrete component analysis,” in Subspace, latent structure and feature selection. Editors C. Saunders, M. Grobelnik, S. Gunn, and J. Shawe-Taylor (Berlin, Heidelberg: Springer Berlin Heidelberg), 1–33.
Canny, J. (2004). “Gap: A factor model for discrete data,” in Proceedings of the 27th Annual International ACM SIGIR Conference on Research and Development in Information Retrieval, 122–129.
Cao, J., Cusanovich, D. A., Ramani, V., Aghamirzaie, D., Pliner, H. A., Hill, A. J., et al. (2018). Joint profiling of chromatin accessibility and gene expression in thousands of single cells. Science 361, 1380–1385. doi:10.1126/science.aau0730
Cao, K., Bai, X., Hong, Y., and Wan, L. (2020). Unsupervised topological alignment for single-cell multi-omics integration. Bioinformatics 36, i48–i56. doi:10.1093/bioinformatics/btaa443
Cao, K., Hong, Y., and Wan, L. (2022). Manifold alignment for heterogeneous single-cell multi-omics data integration using pamona. Bioinformatics 38, 211–219. doi:10.1093/bioinformatics/btab594
Chang, J., and Blei, D. (2009). “Relational topic models for document networks,” in Artificial intelligence and statistics (PMLR), 81–88.
Chen, H., Lareau, C., Andreani, T., Vinyard, M. E., Garcia, S. P., Clement, K., et al. (2019). Assessment of computational methods for the analysis of single-cell atac-seq data. Genome Biol. 20, 241–325. doi:10.1186/s13059-019-1854-5
Chen, S., Lake, B. B., and Zhang, K. (2019). High-throughput sequencing of the transcriptome and chromatin accessibility in the same cell. Nat. Biotechnol. 37, 1452–1457. doi:10.1038/s41587-019-0290-0
Colomé-Tatché, M., and Theis, F. J. (2018). Statistical single cell multi-omics integration. Curr. Opin. Syst. Biol. 7, 54–59. doi:10.1016/j.coisb.2018.01.003
Delgado, F. M., and Gómez-Vela, F. (2019). Computational methods for gene regulatory networks reconstruction and analysis: A review. Artif. Intell. Med. 95, 133–145. doi:10.1016/j.artmed.2018.10.006
Demetci, P., Santorella, R., Sandstede, B., Noble, W. S., and Singh, R. (2022). Scot: Single-cell multi-omics alignment with optimal transport. J. Comput. Biol. 29, 3–18. doi:10.1089/cmb.2021.0446
Duren, Z., Chen, X., Jiang, R., Wang, Y., and Wong, W. H. (2017). Modeling gene regulation from paired expression and chromatin accessibility data. Proc. Natl. Acad. Sci. 114, E4914–E4923. doi:10.1073/pnas.1704553114
Duren, Z., Chen, X., Zamanighomi, M., Zeng, W., Satpathy, A. T., Chang, H. Y., et al. (2018). Integrative analysis of single-cell genomics data by coupled nonnegative matrix factorizations. Proc. Natl. Acad. Sci. 115, 7723–7728. doi:10.1073/pnas.1805681115
Gayoso, A., Steier, Z., Lopez, R., Regier, J., Nazor, K. L., Streets, A., et al. (2021). Joint probabilistic modeling of single-cell multi-omic data with totalvi. Nat. Methods 18, 272–282. doi:10.1038/s41592-020-01050-x
Gong, B., Zhou, Y., and Purdom, E. (2021). Cobolt: Integrative analysis of multimodal single-cell sequencing data. Genome Biol. 22, 351–421. doi:10.1186/s13059-021-02556-z
Hoffman, M. D., Blei, D. M., Wang, C., and Paisley, J. (2013). Stochastic variational inference. J. Mach. Learn. Res. 14, 1303–1347.
Hubert, L., and Arabie, P. (1985). Comparing partitions. J. Classif. 2, 193–218. doi:10.1007/bf01908075
Jin, S., Zhang, L., and Nie, Q. (2020). Scai: An unsupervised approach for the integrative analysis of parallel single-cell transcriptomic and epigenomic profiles. Genome Biol. 21, 25–19. doi:10.1186/s13059-020-1932-8
Kim, H. J., Lin, Y., Geddes, T. A., Yang, J. Y. H., and Yang, P. (2020). Citefuse enables multi-modal analysis of cite-seq data. Bioinformatics 36, 4137–4143. doi:10.1093/bioinformatics/btaa282
Lee, D. D., and Seung, H. S. (1999). Learning the parts of objects by non-negative matrix factorization. Nature 401, 788–791. doi:10.1038/44565
Lin, Z., Zamanighomi, M., Daley, T., Ma, S., and Wong, W. H. (2020). Model-based approach to the joint analysis of single-cell data on chromatin accessibility and gene expression. Stat. Sci. 35, 2–13. doi:10.1214/19-sts714
Ma, S., Zhang, B., LaFave, L. M., Earl, A. S., Chiang, Z., Hu, Y., et al. (2020). Chromatin potential identified by shared single-cell profiling of rna and chromatin. Cell 183, 1103–1116. doi:10.1016/j.cell.2020.09.056
Ma, Y., Sun, Z., Zeng, P., Zhang, W., and Lin, Z. (2022). Jsnmf enables effective and accurate integrative analysis of single-cell multiomics data. Briefings Bioinforma. 23, bbac105. doi:10.1093/bib/bbac105
McLean, C. Y., Bristor, D., Hiller, M., Clarke, S. L., Schaar, B. T., Lowe, C. B., et al. (2010). Great improves functional interpretation of cis-regulatory regions. Nat. Biotechnol. 28, 495–501. doi:10.1038/nbt.1630
Miao, Z., Humphreys, B. D., McMahon, A. P., and Kim, J. (2021). Multi-omics integration in the age of million single-cell data. Nat. Rev. Nephrol. 17, 710–724. doi:10.1038/s41581-021-00463-x
Peterson, V. M., Zhang, K. X., Kumar, N., Wong, J., Li, L., Wilson, D. C., et al. (2017). Multiplexed quantification of proteins and transcripts in single cells. Nat. Biotechnol. 35, 936–939. doi:10.1038/nbt.3973
Ranganath, R., Tang, L., Charlin, L., and Blei, D. (2015). “Deep exponential families,” in Artificial intelligence and statistics (PMLR), 762–771.
Srivastava, A., and Sutton, C. (2017). Autoencoding variational inference for topic models. arXiv preprint arXiv:1703.01488
Stoeckius, M., Hafemeister, C., Stephenson, W., Houck-Loomis, B., Chattopadhyay, P. K., Swerdlow, H., et al. (2017). Simultaneous epitope and transcriptome measurement in single cells. Nat. Methods 14, 865–868. doi:10.1038/nmeth.4380
Stuart, T., Butler, A., Hoffman, P., Hafemeister, C., Papalexi, E., Mauck, W. M., et al. (2019). Comprehensive integration of single-cell data. Cell 177, 1888–1902. doi:10.1016/j.cell.2019.05.031
Traag, V. A., Waltman, L., and Van Eck, N. J. (2019). From louvain to leiden: Guaranteeing well-connected communities. Sci. Rep. 9, 5233–5312. doi:10.1038/s41598-019-41695-z
Wang, X., Sun, Z., Zhang, Y., Xu, Z., Xin, H., Huang, H., et al. (2020). Brem-sc: A bayesian random effects mixture model for joint clustering single cell multi-omics data. Nucleic Acids Res. 48, 5814–5824. doi:10.1093/nar/gkaa314
Wangwu, J., Sun, Z., and Lin, Z. (2021). Scamace: model-based approach to the joint analysis of single-cell data on chromatin accessibility, gene expression and methylation. Bioinformatics 37, 3874–3880. doi:10.1093/bioinformatics/btab426
Welch, J. D., Kozareva, V., Ferreira, A., Vanderburg, C., Martin, C., and Macosko, E. Z. (2019). Single-cell multi-omic integration compares and contrasts features of brain cell identity. Cell 177, 1873–1887. doi:10.1016/j.cell.2019.05.006
Zeng, P., and Lin, Z. (2021). Couple coc+: An information-theoretic co-clustering-based transfer learning framework for the integrative analysis of single-cell genomic data. PLoS Comput. Biol. 17, e1009064. doi:10.1371/journal.pcbi.1009064
Zeng, W., Chen, X., Duren, Z., Wang, Y., Jiang, R., and Wong, W. H. (2019). Dc3 is a method for deconvolution and coupled clustering from bulk and single-cell genomics data. Nat. Commun. 10, 4613–4711. doi:10.1038/s41467-019-12547-1
Zeng, P., Wangwu, J., and Lin, Z. (2021). Coupled co-clustering-based unsupervised transfer learning for the integrative analysis of single-cell genomic data. Briefings Bioinforma. 22, bbaa347. doi:10.1093/bib/bbaa347
Zhou, M., Hannah, L., Dunson, D., and Carin, L. (2012). “Beta-negative binomial process and Poisson factor analysis,” in Proceedings of the Fifteenth International Conference on Artificial Intelligence and Statistics, Editors. N. D. Lawrence, and M. Girolami (La Palma, Canary Islands: PMLR), 22. Proceedings of Machine Learning Research, 1462–1471.
Zhou, Y., Zhou, B., Pache, L., Chang, M., Khodabakhshi, A. H., Tanaseichuk, O., et al. (2019). Metascape provides a biologist-oriented resource for the analysis of systems-level datasets. Nat. Commun. 10, 1523–1610. doi:10.1038/s41467-019-09234-6
Zhu, C., Yu, M., Huang, H., Juric, I., Abnousi, A., Hu, R., et al. (2019). An ultra high-throughput method for single-cell joint analysis of open chromatin and transcriptome. Nat. Struct. Mol. Biol. 26, 1063–1070. doi:10.1038/s41594-019-0323-x
Keywords: integrative analysis, single-cell multi-omics data, probabilistic non-negative matrix factorization, generative model, unsupervised learning, stochastic variational inference
Citation: Zhang W and Lin Z (2023) iPoLNG—An unsupervised model for the integrative analysis of single-cell multiomics data. Front. Genet. 14:998504. doi: 10.3389/fgene.2023.998504
Received: 20 July 2022; Accepted: 24 January 2023;
Published: 07 February 2023.
Edited by:
Lin Hou, Tsinghua University, ChinaReviewed by:
Lin Wan, Academy of Mathematics and Systems Science (CAS), ChinaJingshu Wang, The University of Chicago, United States
Copyright © 2023 Zhang and Lin. This is an open-access article distributed under the terms of the Creative Commons Attribution License (CC BY). The use, distribution or reproduction in other forums is permitted, provided the original author(s) and the copyright owner(s) are credited and that the original publication in this journal is cited, in accordance with accepted academic practice. No use, distribution or reproduction is permitted which does not comply with these terms.
*Correspondence: Zhixiang Lin , emhpeGlhbmdsaW5AY3Voay5lZHUuaGs=