 Hui Miao
 Yunke Zhu†
 Fei Tang
 Xi Liu
- Department of Nephrology, Longgang Central Hospital of Shenzhen, Shenzhen, China
Background: Diabetic nephropathy (DN) is a major microvascular complication of diabetes, and its pathogenesis is closely associated with abnormal epigenetic regulation, particularly the silencing of tumor suppressor genes due to hypermethylation of promoter regions. This study was to investigate the workings of demethylation in diabetic nephropathy by applying bioinformatics methods.
Methods: DN-related datasets (GSE142153 and GSE154881) and demethylation-related genes (D-RGs) were included. Differentially expressed genes (DEGs) (DN vs. normal) were obtained. Candidate genes were obtained from the intersection of DEGs and D-RGs. To identify key genes, the Least absolute shrinkage and selection operator (LASSO) and Boruta algorithm, and expression validation were used for screening. The expression validation was used to identify biomarkers. The receiver operating characteristic (ROC) curve was subsequently utilized to assess the biomarkers’ capability to distinguish diseased from normal samples. Subsequently, a predictive nomogram was created to estimate the likelihood of developing DN. In addition, functional enrichment, immune infiltration, subcellular localization, correlation of biomarker expression with renal function, correlation for other diseases, network analysis of molecular interactions and computational drug prediction were carried out. Lastly, Real-Time Quantitative Reverse Transcription Polymerase Chain Reaction (RT-qPCR) was carried out to confirm the expression levels of biomarkers in blood samples.
Results: CXCL2 and MLF1 were determined to be biomarkers that exhibited notably elevated expression levels in the DN, in contrast to the normal group. Then the nomogram network was built, which had high prediction accuracy. Pathways most significantly enriched by CXCL2 and MLF1 included cytokine-cytokine receptor interaction and MAPK signaling pathway. Five types of immune cells were identified by immune infiltration analysis. In the RNA binding protein (RBP) -mRNA regulatory network, seven pathways were co-enriched in both biomarkers. In the TF-mRNA regulatory network, TFs shared by both biomarkers include JUN, GATA2, and SRF. Finally drug prediction analysis found a total of 172 target drugs for CXCL2 and MLF1. RT-qPCR experiment revealed that both biomarkers showed a notable rise in the DN group relative to the normal group. RT-qPCR results revealed the DN exhibited notably increased expression levels of the two biomarkers (CXCL2 and MLF1) compared to the normal group.
Conclusion: CXCL2 and MLF1 were identified as diagnostic biomarkers for DN, offering a new reference for its treatment.
1 Introduction
Diabetic nephropathy (DN), a progressive microvascular complication of diabetes mellitus, is characterized by glomerular sclerosis, proteinuria, and renal fibrosis, and it is one of the primary causes of chronic kidney disease (CKD) and end-stage renal disease (ESRD) globally (Sagoo and Gnudi, 2020; Anders et al., 2018). The progression from DN to ESRD is driven by persistent hyperglycemia, chronic inflammation, and renal fibrosis (Yuan et al., 2017; Qiu et al., 2023). In a chronic hyperglycemic environment, epigenetic regulation interacts with renal hemodynamic alterations (glomerular hypertension, hyperfiltration) and metabolic disturbances (oxidative stress, inflammation) to drive renal cell injury and the activation of mesangial cells and myofibroblasts (Amorin et al., 2019; Li et al., 2024). This process ultimately leads to proteinuria and renal failure through glomerulosclerosis and tubulointerstitial fibrosis (Zhao et al., 2024) (Supplementary Figure S1). Epidemiological studies indicate that DN accounts for approximately 40%–50% of ESRD cases globally, with regional variations observed across different populations (Taylor et al., 2019; Yoshida et al., 2017). The increasing prevalence of DN, driven by the rising incidence of diabetes and population aging, significantly contributes to morbidity, mortality, and healthcare expenditures, with annual costs exceeding $100 billion globally (Thomas, 2019; GBD, 2015 Eastern Mediterranean Region Diabetes and Chronic Kidney Disease Collaborators, 2018). The primary risk factors for DN include chronic hyperglycemia, hypertension, and obesity, which collectively induce oxidative stress, inflammation, and renal injury (Jin et al., 2023; Nadaf and Killedar, 2020; O'Connor et al., 2021). While lifestyle modifications and dietary interventions, such as weight loss and glycemic control, may delay disease onset, the progression of DN remains a critical challenge (Sagoo and Gnudi, 2020). The development of DN is driven by a complex array of molecular mechanisms, including oxidative stress, chronic inflammation, dysregulated autophagy, and programmed cell death, which collectively contribute to renal injury and fibrosis (Jin et al., 2023; Nadaf and Killedar, 2020; O'Connor et al., 2021). Emerging evidence suggests that polyphenols, due to their antioxidant and anti-inflammatory properties, may have therapeutic potential in DN. Additionally, sodium-glucose cotransporter 2 (SGLT2) inhibitors have demonstrated renoprotective effects in clinical trials (Jin et al., 2023; Zhou et al., 2022; Knaus et al., 2021). However, despite these advancements, the absence of reliable biomarkers for early detection and risk stratification remains a major barrier in DN management, limiting the timely initiation of targeted therapies and personalized treatment strategies (Ruiz-Ortega et al., 2020). Therefore, identifying novel biomarkers is essential to improve early diagnosis, elucidate disease mechanisms, and facilitate the development of targeted therapies.
One important epigenetic alteration that is essential for controlling gene expression and maintaining genomic integrity is DNA methylation (Deng et al., 2022). In DN, aberrant DNA methylation patterns have been increasingly implicated in disease progression, with hypermethylation of specific genes contributing to renal fibrosis and dysfunction (Quinn et al., 2021). Active DNA demethylation, primarily mediated by ten-eleven translocation (TET) enzymes, plays a crucial role in cellular homeostasis; however, dysregulation of this process has been associated with increased oxidative stress and renal injury (Wang et al., 2022). Recent advances suggest that targeting DNA methylation and demethylation pathways may represent a novel therapeutic approach for DN. DNA methyltransferase (DNMT) inhibitors, such as 5-Aza-2′-deoxycytidine, have been shown to reverse hypermethylation and restore gene expression; however, their clinical application is hindered by toxicity and limited specificity (Fossum et al., 2021). Natural compounds, such as epigallocatechin gallate (EGCG), have demonstrated the ability to modulate methylation patterns, thereby reducing renal fibrosis and inflammation via the NF-κB signaling pathway (He et al., 2022). Furthermore, blood-based DNA methylation signatures are emerging as potential biomarkers for predicting DN progression and may shed light on the early disease processes and identify possible therapeutic approaches (Nguyen et al., 2022). Additionally, the interaction between DNA methylation and key transcription factors, such as AP-1 and TET1, has been shown to regulate critical protective pathways, including the Nrf2/ARE pathway, which plays a vital role in mitigating oxidative stress and inflammation in DN (24). These findings highlight the importance that epigenetic control in the progression of DN and suggest its potential as a valuable target for future therapeutic strategies.
Bioinformatics plays a significant role in type 2 diabetes (T2D) research, providing robust support for the diagnosis and treatment strategies of this disease (Kato et al., 2024; Chen R. et al., 2024).This study identified CXCL2 and MLF1 as novel diagnostic biomarkers for diabetic nephropathy through integrated bioinformatics and machine learning approaches, with experimental validation confirming their significant upregulation in patient samples. Functional analyses revealed their involvement in key pathological pathways including immune signaling and cellular stress response, associated with specific immune cell infiltration patterns. Regulatory network analysis uncovered core transcription factors (JUN, GATA2, SRF) co-regulating these biomarkers. Furthermore, 172 potential targeted drugs were predicted, providing new insights for precision diagnosis and targeted therapy of diabetic nephropathy.
2 Materials and methods
This section detailed the data sources, analytical methods, and experimental workflow employed in this study, which comprised the following key components: data acquisition and preprocessing; candidate gene identification and analysis; biomarker characterisation; functional enrichment analysis; immune infiltration analysis; regulatory network construction; drug prediction; and experimental validation. The research workflow is presented in Supplementary Figure S2.
2.1 Data source
The Gene Expression Omnibus (GEO) (https://www.ncbi.nlm.nih.gov/geo/) was utilized to obtain diabetic nephropathy (DN) related transcriptomic data. Specifically, GSE142153 (GPL6480) included 23 peripheral blood specimens collected from DN (DN group) and 10 from healthy donors (control group) (Li et al., 2021). In addition, GSE154881 (GPL24676) included five samples of blood samples from DN patients (DN group) and five samples of blood samples from healthy individuals (control group) (Zhang et al., 2024). In addition, a search for the keyword “demethylation” via the GeneCards platform (https://www.genecards.org) yielded a total of 3741 demethylation-related genes (D-RGs) (Supplementary Table S1) (Kang et al., 2024).
2.2 Identifying and analysing candidate genes
Differentially expressed genes (DEGs) were collected in the GSE142153 (DN vs. normal) and used the package of “limma” (v 3.54.0) (Ritchie et al., 2015) (p value <0.05 and |log2fold change (FC)| > 1). Volcano map and heat map were developed employing the “ggplot2” (v 3.4.1) (Ito and Murphy, 2013) and the “ComplexHeatmap” (v 1.0.12) (Gu et al., 2016), respectively. The intersection between DEGs and D-RGs was used to identify candidate genes, and the “VennDiagram” (v 1.7.1) (Chen and Boutros, 2011) was utilized for draw a Venn diagram to show the result. Finally, Gene Ontology (GO) and Kyoto Encyclopedia of Genes and Genomes (KEGG) were conducted utilizing the “clusterProfiler” (v 4.2.2) (Wu et al., 2021) (a djust P < 0.05). A protein-protein interaction (PPI) network was drawn using the STRING (https://string-db.org/). The threshold was an interaction score ≥0.4.
2.3 Identification of biomarkers
Machine learning was employed to identify key genes. First, we got the candidate characterization genes one in the GSE142153 all sample using regression analysis using least absolute shrinkage and selection operator (LASSO) with the “glmnet” (v 1.0.13) (Li et al., 2022) was conducted. Configuration details: nfold set to ten, with the best lambda value is determined using a tenfold cross-validation process. Next, the Boruta algorithm was constructed using the R package “Boruta” (v 8.0.0) (Mahmoudian et al., 2021) to get candidate characterization genes 2. The VennDiagram package (v 1.7.1) was utilized to determine the intersection of the two algorithms (candidate characterization genes one and candidate characterization genes 2), which was denoted as the key genes. The key genes with statistically notable differences were observed. and consistent matched expression patterns in GSE142153 and GSE154881 were used as biomarkers (p < 0.05). The Receiver Operating Characteristic (ROC) curve was used in the GSE142153 using the “pROC” (v 1.18.0) (Robin et al., 2011), and the area under the curve (AUC) value was calculated to evaluate its capacity for accurate diagnosis for DN, with an AUC >0.7. In the GSE142153, the nomogram network was constructed using the R package “rms” (v 6.8.1) (Li M. et al., 2023). In GSE142153, the R package “calibrate” (v 1.7.7) (Sui et al., 2022) was utilized to assess predictive performance through the use of calibration curves. Additionally, in the GSE142153, By plotting the ROC curve based on the nomogram network using the “pROC” (v 1.18.0).
2.4 Gene set enrichment analysis (GSEA)
First, the “psych” (v 2.1.6) (Harrison and Goozee, 2014) was employed to determine The Spearman correlation coefficient between each of the biomarkers and the other genes in the GSE142153. The biomarker-gene interactions were then quantified and ranked by correlation coefficients (from big to small). Subsequently, c2. cp.kegg_legacy.v2024.1.Hs.symbols.gmtt have been downloaded from Molecular Signatures Database (MSigDB) (https://www.gsea-msigdb.org/gsea/msigdb/) as background sets. Finally, the R package “clusterProfiler” (v 4.2.2) (Wu et al., 2021) (|NES|>1, a djust p < 0.05) was used for biomarker GSEA analysis. The visualization of the results was achieved by utilizing “enrichplot” (v 1.18.3) (Shi et al., 2022).
2.5 Analysis of the immune infiltration
First, the immune richness of 22 immune cells in the GSE142153 between two groups (DN vs. normal) was calculated using the CIBERSORT algorithm (v 0.1.0) (Chen et al., 2018). The Wilcoxon test was employed to evaluate immune cell infiltration differences between the two groups, and the differential immune cells were screened out as differential immune cells (p < 0.05). Box plots were used using the “ggplot2” (v 3.4.1) (Kato et al., 2024). The R package “psych” (v 2.1.6) (Musselman and Kay, 1986) was then employed for conducting Spearman correlation analysis between the differential immune cells and differential immune cells, |(cor)| > 0.3 and p < 0.05. Additionally, the R package “psych” (v 2.1.6) was then employed for conducting Spearman correlation analysis among the differential immune cells and biomarkers, |(cor)| > 0.3 and p < 0.05.
2.6 Biomarker function analysis
To gain insight into the organelles where the biomarkers exert their functions, the Hum-mPLoc 3.0 (http://www.csbio.sjtu.edu.cn/bioinf/Hum-mPLoc3/) was used to analyze the subcellular localization of the biomarkers, and the bar charts were drawn using the “ggplot2” (v 3.4.1) for visual presentation. To visualize the chromosomal locations of the biomarkers, the “OmicCircos” package (v 1.38.0) (Zhang et al., 2013) was employed to graphically represent the chromosomal distribution of the biomarkers. To investigate the clinical significance of biomarkers in DN, the correlation between biomarkers and renal function was further analyzed. The biomarker expression level and GFR values in Ju CKD TubInt dataset were downloaded from Nephroseq V5 database (http://v5.nephroseq.org), and Correlation between biomarker expression and GFR values was analysed using Spearman correlation analysis using the R package “psych” (v 2.1.6), with |(cor)| > 0.3 and p < 0.05. The CTD (http://ctdbase.org/) was used to investigate relationships between biomarkers and multiple diseases.
2.7 Construction of the network
To analyze the molecular regulatory mechanisms of biomarkers (mRNAs), the Starbase v2.0 (http://starbase.sysu.edu.cn/) was utilized for predicting the targeting linkages between mRNAs and RBPs, and the software Cytoscape (v 3.8.2) (Szklarczyk et al., 2017) was used for the construction of mRNA-RBP regulatory networks. Transcriptional level regulation is an important part of gene expression regulation, in which transcription factors (TFs) realize transcriptional regulation of a gene by binding to specific nucleotide sequences upstream of the gene. The TRRUST database (https://jaspar.genereg.net) of the NetworkAnalyst platform (https://www.grnpedia.org/trrust/) was utilized for TFs prediction of biomarkers, and a network diagram of TF-mRNA interactions was constructed using Cytoscape (v 3.8.2).
2.8 Drugs forecasting
To identify potential compounds for the biomarkers using the DGIdb (https://dgidb.genome.wustl.edu/), the targeted drugs that were able to upregulate these two biomarkers and had a supported reference greater than one. And Cytoscape (v 3.8.2) was applied to create a network graph of the biomarkers and all the drugs they predicted.
2.9 RT-qPCR
Blood samples were obtained from five individuals diagnosed with DN at Longgang Central Hospital of Shenzhen. In addition, blood samples were collected from five healthy individuals as controls.RT-qPCR analysis was performed using these samples. The Longgang Central Hospital of Shenzhen Ethics Committee gave ethical approval for this research. Consent was given by all participating patients. RT-qPCR was employed to verify the expression levels of the biomarkers. Extraction of total RNA was carried out from 10 samples using TRIzol (Ambion, Austin, USA). The total RNA was converted into cDNA utilizing the SureScript First-strand cDNA Synthesis Kit (Servicebio, Wuhan, China), and RT-qPCR was carried out with the 2x Universal Blue SYBR Green qPCR Master Mix (Servicebio, Wuhan, China). Supplementary Table S2 contains the PCR primer sequences. GAPDH served as the internal control, with biomarker expression levels calculated using the 2−ΔΔCt method (Livak and Schmittgen, 2001). Finally, the PCR results were imported into Graphpad for statistics and plotting. This study was approved by the Longgang Central Hospital of Shenzhen Ethics Committee. All participants provided written informed consent before sample collection, and all procedures adhered to the principles of the Declaration of Helsinki.
2.10 Statistical analysis
Statistical computations were executed in R (v 4.3.1). Group differences were evaluated using the Wilcoxon test. For RT-qPCR comparisons, the t-test was used, and statistical significance was considered to be less than 0.05.
2.11 Ethics approval and consent to participate
I certify that the research study titled [Identification and experimental validation of demethylation-related genes in diabetic nephropathy] has been approved by the relevant ethics committee or institutional review board (IRB).The approval number and date of approval are as follow: [2024ECYJ122]and [13 November 2024].
3 Results
This section systematically presented research findings from candidate gene screening to biomarker validation. First, based on differential expression analysis, we identified 161 candidate genes potentially associated with the pathogenesis of diabetic kidney disease (DKD). These genes were predominantly enriched in key biological processes such as inflammatory immune responses and tissue remodelling. Subsequently, we employed multiple machine learning methods to screen and select five key genes from this cohort; further expression validation and ROC curve analysis ultimately confirmed CXCL2 and MLF1 as core biomarkers with diagnostic potential. We then conducted in-depth investigations into the functional characteristics of these two biomarkers, their involvement in immune regulatory networks, and their potential therapeutic targets. Finally, all research findings were experimentally validated, confirming the expression levels of the biomarkers in independent samples.
3.1 Screening and analysis of enrichment patterns in candidate genes
GSE142153 identified 161 DEGs, of which 106 were upregulated genes and 55 were downregulated genes (Figures 1A,B). The DEGs and D-RGs were selected to be intersected, and 57 candidate genes were detected (Figure 1C). A total of 812 Gene Ontology (GO) biological functions were identified, including 758 biological processes (BP), 22 cellular components (CC), and 32 molecular functions (MF) (Figure 1D). In BP, these candidate genes were primarily associated with regulation of angiogenesis, regulation of vasculature development and epithelial cell proliferation (Supplementary Table S3); In CC, these candidate genes were mainly involved in ficolin-1-rich granule, serine-type peptidase complex and ficolin-1-rich granule lumen (Supplementary Table S4); In MF, these candidate genes were mainly involved in cytokine activity, receptor ligand activity and cytokine receptor binding (Supplementary Table S5). KEGG identified a total of 65 functional pathways that were enriched, specifically: lipid and atherosclerosis, colorectal cancer, and malaria. The PPI network constructed based on candidate genes contained 207 interactions of 48 proteins; there were nine proteins that did not interact with other proteins. Notably, the IL6, IL1B, and MMP9 protein interacts with most of the proteins in the network (Figure 1E) (Supplementary Table S6).

Figure 1. Screening and analysis of enrichment patterns in candidate genes. (A) Volcano plot of differentially expressed genes (DEGs) in diabetic nephropathy (DN). The top 10 up- and downregulated genes are shown. (B) Heatmap of DEGs between sample groups. Red: Case group Blue: control group. (C) Venn diagram showing the intersection of DEGs and demethylation-related genes (D-RGs). 57 candidate genes were detected. (D) Functional enrichment analysis of candidate genes. The depth of color reflects the adjusted P-value, with darker colors indicating smaller P-values. (E) Protein-protein interaction (PPI) network of candidate genes. The nodes in the graph represent specific proteins, while the edges indicate their interactions with each other.
3.2 CXCL2 and MLF1 as the biomarkers
The LASSO algorithm selected optimal candidate genes based on minimum error criteria (lambda.min = 0.037), leading to a total of 12 candidate characterization genes 1 (Figure 2A). Furthermore, the Boruta algorithm identified 18 candidate characterization genes 2 (Figure 1B). The candidate characterization genes one and candidate characterization genes two were selected to be intersected, then five key genes were acquired: CXCL2, IL19, MLF1, NOG, and WNT5B (Figure 2C). The key genes expression was examined in DN patients, as well as in normal samples in GSE142153 (p < 0.05) and validated in the GSE154881 (p < 0.05). As shown in Figure (Figure 2D), the results indicated that CXCL2 and MLF1 exhibited significantly high expression in DN samples and the same trends in the two datasets. Therefore, we chose CXCL2 and MLF1 as biomarkers for this study. The ROC curves were analyzed for the two biomarkers. Analysis revealed that the AUC of the CXCL2 and MLF1 were greater than 0.7 in the GSE142153 (Figure 2E). Based on the two biomarkers identified as previously described, a nomogram was developed using the GSE142153, the higher total scores in the nomogram indicated a greater risk of DN development (Figure 2F), The calibration curve’s close alignment with the ideal curve suggested that the nomogram was more accurate (Figure 2G), and the results in ROC curves showed the nomogram had good predictive effects in GSE142153 (Figure 2H), with the model’s AUC values was 0.943.
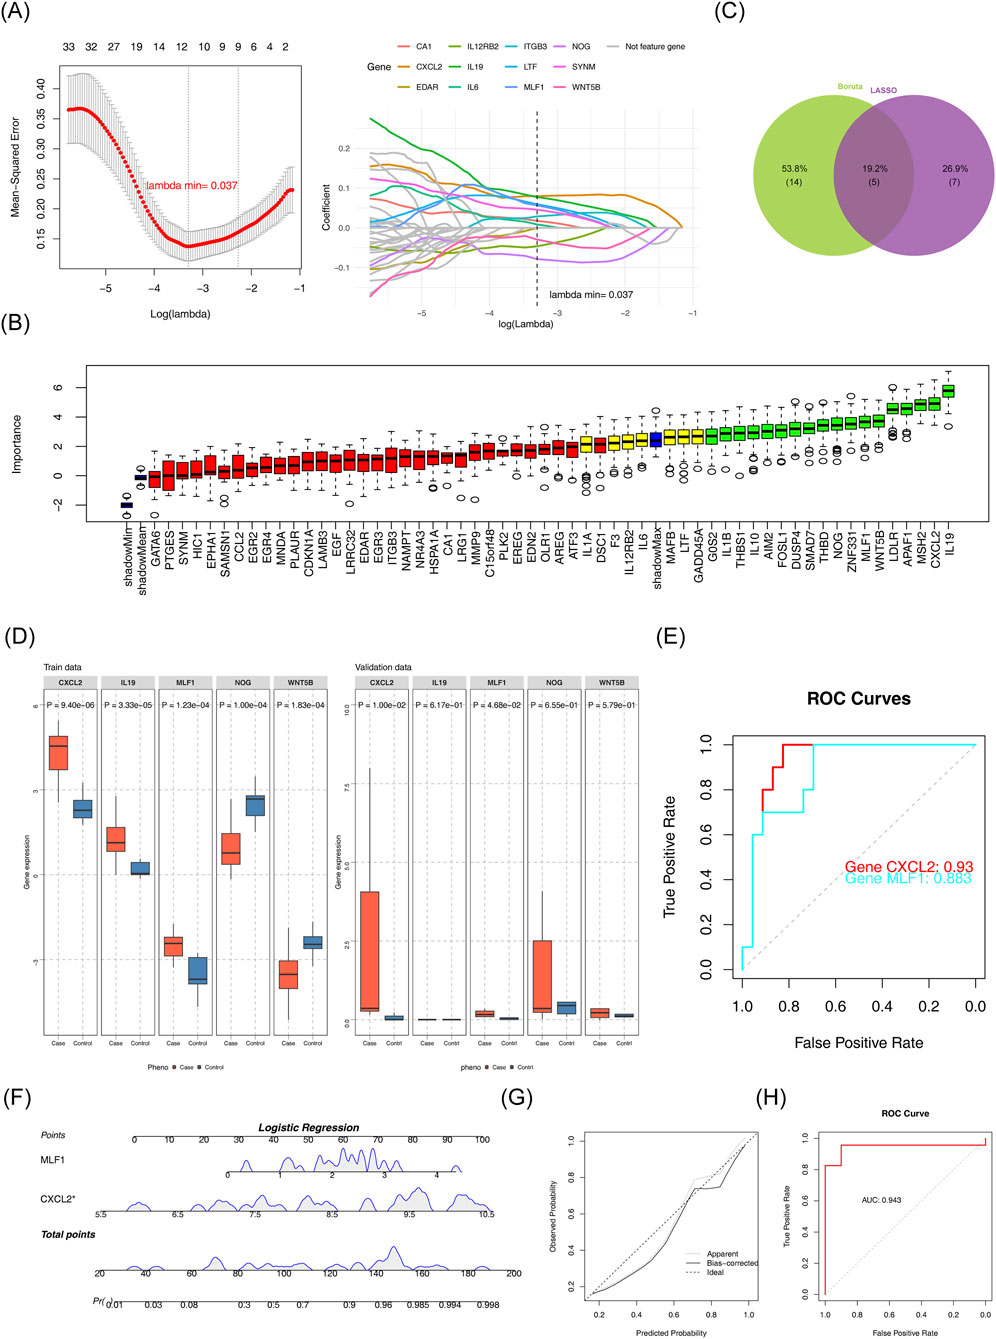
Figure 2. Identification of biomarkers (A) LASSO regression model and cross-validation results. (B) Importance plot for the LASSO regression model. (C) Feature selection results from Boruta and LASSO. (D) Gene expression comparison between case and control groups. (E) Receiver Operating Characteristic (ROC) curves for gene performance. (F) Logistic regression analysis for candidate gene prediction. (G) Calibration plot for the logistic regression model. (H) Receiver Operating Characteristic (ROC) curve for logistic regression model.
3.3 GSEA results for biomarkers
GSEA results showed that CXCL2 enriched 50 functional pathways (Figure 3A) (Supplementary Table S7). MLF1 was enriched for a total of 30 functional pathways (Figure 3B) (Supplementary Table S8). The most significantly enriched pathways for both CXCL2 and MLF1 were kegg cytokine cytokine receptor interaction (CXCL2: NES = 2.057, Adjust P < 0.05; MLF1: NES = 1.840, Adjust P < 0.05) and kegg mapk signaling pathway (CXCL2: NES = 1.858, Adjust P < 0.05; MLF1: NES = 1.757, Adjust P < 0.05).

Figure 3. GSEA results for biomarkers (A) Enrichment analysis of CXCL2 in KEGG pathways. (B) Enrichment analysis of MLF1 in KEGG pathways.
3.4 A total of five differential immune cells
Stacked plots illustrated the comparative percentages of 22 immune cells (Figure 4A). Comparative analysis of immune cell infiltration revealed statistically significant differences in activated dendritic cells, eosinophils, activated NK cells, naive CD4+ T cells, and gamma delta T cells between DN and control groups. (Figure 4B). The correlation analysis between various differential immune cells was conducted, revealing a remarkable positive association between NK cells activated and dendritic cells activated (cor = 0.365, p < 0.05). The correlation analysis between various differential immune cells was conducted, unveiling a remarkable negative association between naive CD4+ T cells and NK cells activated (cor = - 0.4, p < 0.05) (Figure 4C) (Supplementary Table S9). Differential immune cell and biomarker correlation were a remarkable positive association CXCL2 and NK cells activated (cor = 0.476,p value <0.05), However, the most significant negative correlation was CXCL2 and gamma delta T cells (cor = - 0.296, p < 0.05); The strongest positive association was MLF1 and NK cells activated (cor = 0.502, p < 0.05). However, the most significant negative correlation was MLF1 and naive CD4+ T cells (cor = − 0.219, p < 0.05) (Figure 4D) (Supplementary Table S10).
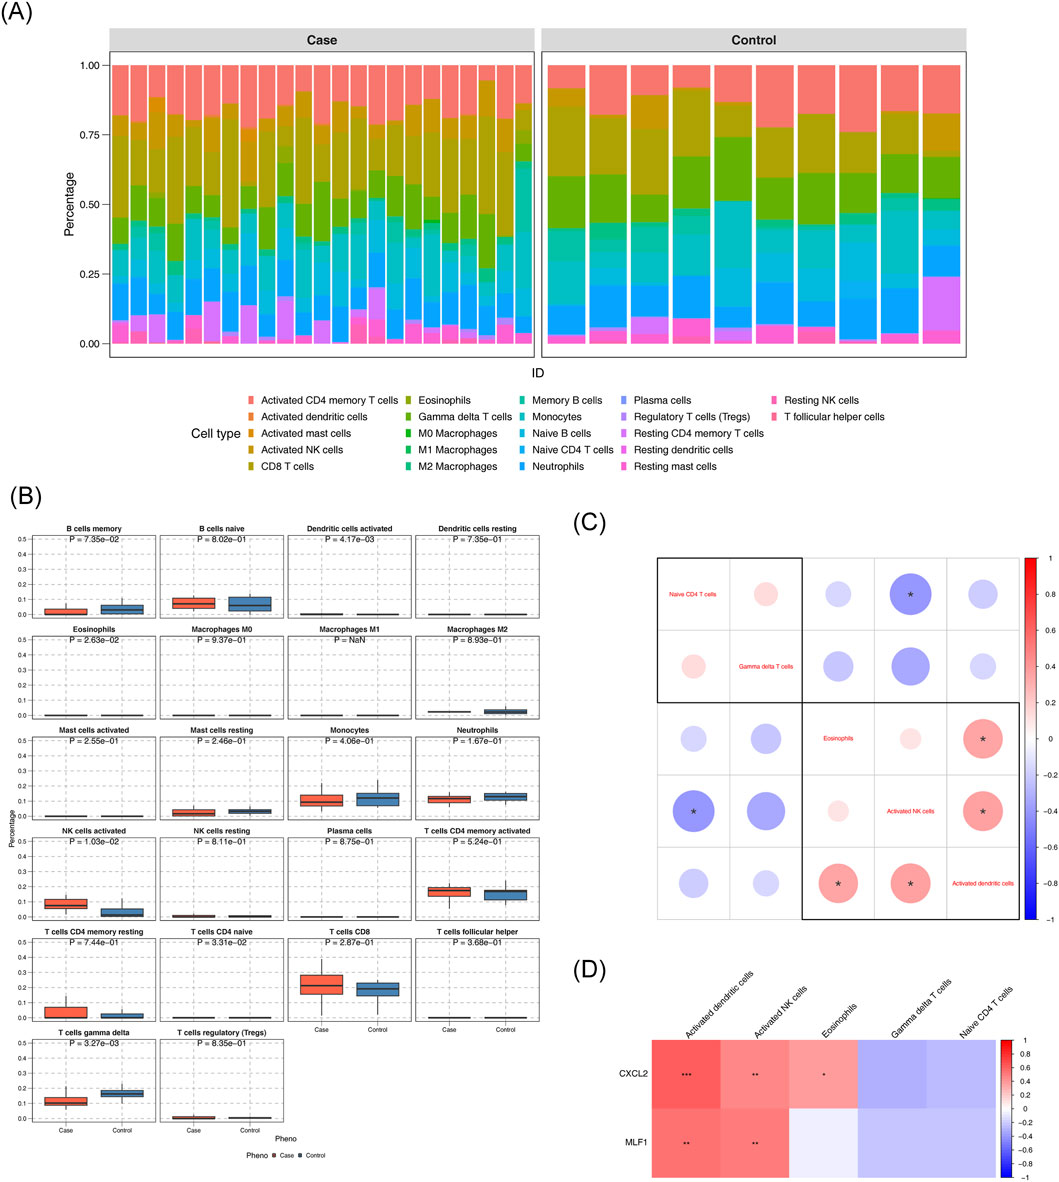
Figure 4. Analysis of the immune infiltration (A) Immune cell composition in diabetic nephropathy (DN) and control groups. (B) Comparison of immune cell percentages between case and control groups. (C) Differential expression of immune cell markers in DN. (D) Correlation of immune cell markers with gene expression.
3.5 Subcellular localization, chromosome localization, renal function correlation, and disease relevance of biomarkers
Subcellular localization analysis of biomarkers showed that CXCL2 was more expressed in the extracellular space, while MLF1 was more expressed in the cytoplasm (Figure 5A). Chromosome localization analysis of biomarkers showed that CXCL2 was localized to chromosome 4, and MLF1 was localized to chromosome 3 (Figure 5B). The correlation analysis between biomarkers and kidney function yielded statistically significant negative results between CXCL2 expression levels and GFR values (cor = −0.400, p < 0.05), and statistically significant negative association between MLF1 expression levels and GFR values (cor = −0.325, p < 0.05) (Figure 5C). Diseases that were significantly associated with CXCL2 include cholestasis, inflammation, acute lung injury, pulmonary fibrosis and hypertension, and those that were significantly associated with MLF1 was stomach neoplasms (Figure 5D).
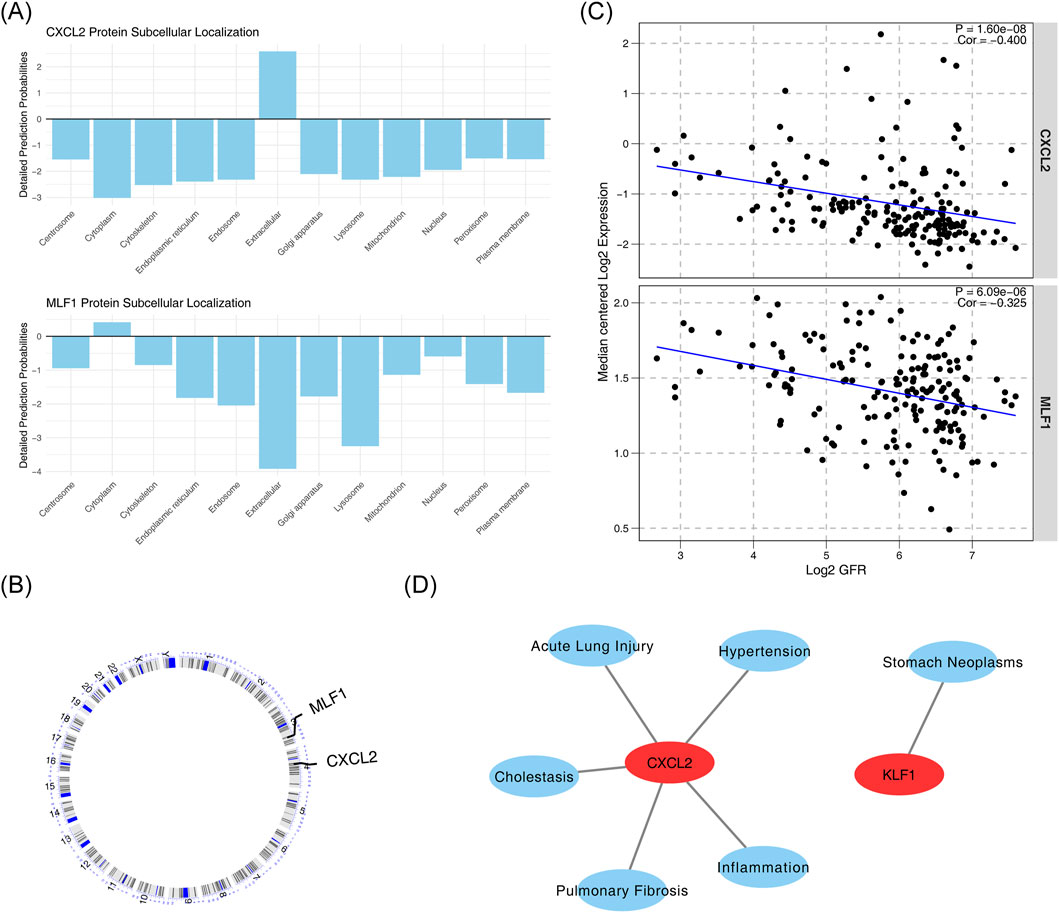
Figure 5. Subcellular localization, chromosome localization, renal function correlation, and disease relevance of biomarkers. (A) Subcellular localization of CXCL2 and MLF1 proteins. (B) Correlation between CXCL2 and MLF1 protein expression. (C) Correlation between CXCL2 and MLF1 expression with Log2 GFR. (D) Association of CXCL2 with various diseases and conditions.
3.6 Regulatory networks for biomarkers
Firstly, the mRNA-RBP, the study results indicated that five RNA binding proteins were significantly enriched in both biomarkers, including DDX3X, ELAVL1, HNRNPA2B1, IGF2BP3, RC3H1, U2AF1, and UPF1 (Figure 6A). In addition, the mRNA-TF network was constructed CXCL2 obtained 3 TFs acting on biomarkers, including RELA, NFKB1, and SMAD1 (Figure 6B).
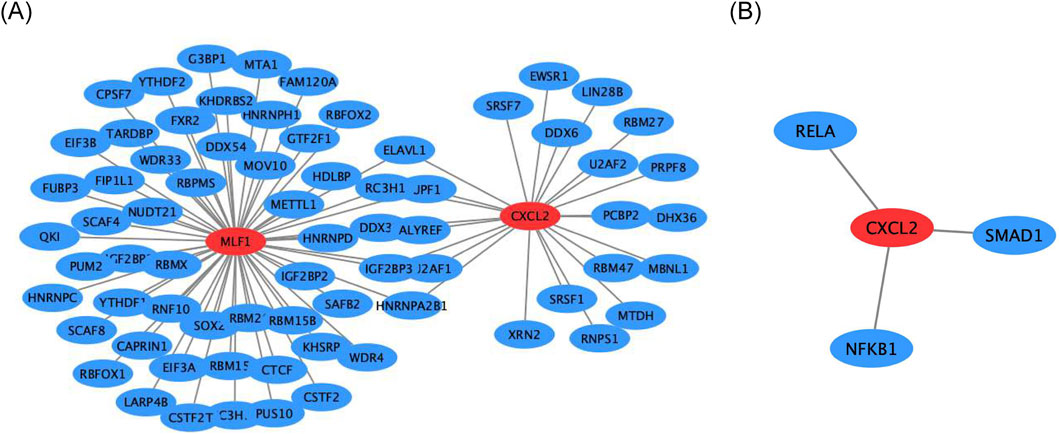
Figure 6. Regulatory networks for biomarkers (A) Gene interaction network of CXCL2 and MLF1. (B) Gene interaction network of CXCL2 with RELA, SMAD1, and NFKB1.
3.7 A total of 172 target drugs
The database was searched for the 172 target drugs of the two biomarkers, and both biomarkers predicted nine drugs, including valproic acid, trichostatin A, puromycin, MG-262, menadione, estradiol, copper sulfate, and calcitriol (Figure 7) (Supplementary Table S11).
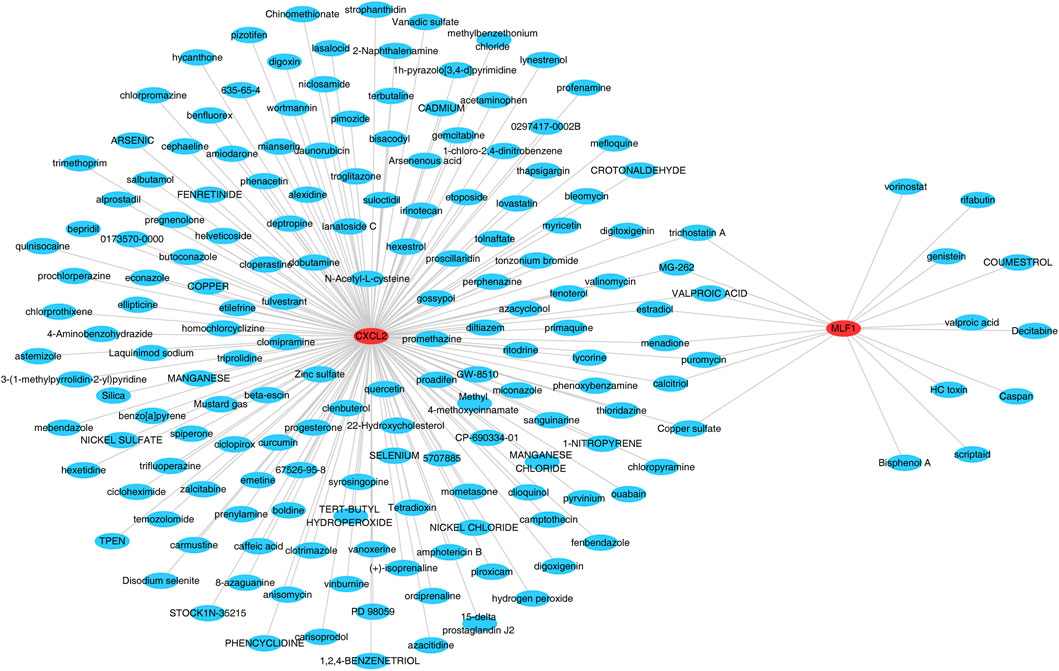
Figure 7. Gene interaction network of CXCL2 and MLF1.
3.8 Confirmation of biomarker expression
RT-qPCR was employed to quantify and compare the expression levels of CXCL2 and MLF1 between the DN and normal groups (Figure 8; Table 1). The DN group exhibited significantly elevated levels of both CXCL2 and MLF1 compared to the normal groups (p < 0.05).

Figure 8. Expression levels of CXCL2 and MLF1 in control and DN samples (Mean ± SD).

Table 1. Detection of CXCL2 and MLF1 expression levels in control and DN samples by RT-PCR (Mean ± SD).
4 Discussion
DN, one of the most severe microvascular complications of diabetes, has emerged as a primary cause of end-stage renal disease worldwide, with its pathogenesis involving complex interactions among glucose metabolism disorders, oxidative stress, inflammatory responses, and epigenetic dysregulation (Jin et al., 2023; Thipsawat, 2021; Samsu, 2021). Through integrated multi-omics analysis and machine learning approaches, this study has successfully identified CXCL2 and MLF1 as novel diagnostic biomarkers for DN, laying a crucial foundation for developing innovative diagnostic and therapeutic strategies.CXCL2 (C-X-C Motif Chemokine Ligand 2) is a small protein that is secreted by cells such as active monocytes, neutrophils, and macrophages. It belongs to the CXC chemokine family and is also known as MIP-2, GRO-Beta, or GR O -2 (Guo et al., 2020). In terms of amino acid sequence, it has 90% similarity to the related chemokine CXCL1 (Lin et al., 2021). It binds to the CXCR2 receptor and is located on human chromosome 4 (51). CXCL2 exhibits chemotactic activity toward neutrophils, polymorphonuclear leukocytes, and hematopoietic stem cells, facilitating their recruitment to sites of inflammation or injury (Guo et al., 2020; Cai et al., 2023). In terms of immune regulation, CXCL2 is involved in a variety of immune responses, including wound healing, cancer metastasis, and angiogenesis. As a protein encoded by an oncogene, CXCL2 promotes angiogenesis and plays a critical role in the initiation, progression, and metastasis of tumors (Cai et al., 2023). CXCL2 induces a dose-dependent increase in the migration of colorectal tumor cells in vitro. Silencing CXCL1 and CXCL2 downregulates multiple metastasis-promoting genes and inhibits the metastatic potential of breast cancer cells (Cai et al., 2023). Regarding blood regulation, CXCL2 inhibits the proliferation of hematopoietic progenitor cells while activating ERK to enhance the proliferation of bone marrow-derived macrophage precursor cells (BMMS). The knockout of CXCL2 suppresses both proliferation and ERK activation in BMMS. In models of platelet-activating factor-induced shock and intestinal injury, lipopolysaccharide (LPS) induces CXCL2 expression, thereby promoting neutrophil migration (Guo et al., 2020). In acute lung injury, CXCR2 ligands (including CXCL1/2/3) exhibit chemotactic activity toward polymorphonuclear leukocytes (Zhang et al., 2023). CXCL2 represents a novel therapeutic target for inflammatory bone destruction diseases. Recent research employs CXCL2 chemokine as an intermediary in sepsis treatment (Zhang et al., 2023). The expression and significance of CXCL2 in tumors have garnered significant attention, potentially serving as a diagnostic marker for various tumors, a detection factor for tumor recurrence, and a promising therapeutic target. Studies indicate that during tolerance induction, lymphocyte circulation can modulate new therapies such as autoimmunity management, transplantation acceptance, and tumor suppression. In our study, CXCL2 levels were high in DN patients. This fits with earlier work showing that CXCL2 can worsen kidney scarring and stress (He et al., 2022). We also saw that CXCL2 is involved in the MAPK pathway. This pathway is known to cause kidney cell death and inflammation when blood sugar is high (Ambujakshan and Sahu, 2025). Moreover, higher CXCL2 levels are linked with lower kidney function (GFR), which supports its use as a marker for kidney decline (Nguyen et al., 2022).
MLF1 (Myeloid leukemia factor 1) is a protein that works in the cell nucleus to control gene activity. It has a signal that sends it to the nucleus, and it can bind to DNA. MLF1 is found in many cells, including blood, nerve, and cancer cells. MLF1 functions as either a transcriptional repressor or activator, thereby participating in the regulation of various gene transcriptions. It modulates gene expression levels through interactions with DNA or other transcription factors (Li Z. et al., 2023). MLF1 exhibits DNA-binding capability and can recognize and bind to specific DNA sequences, directly impacting the transcriptional activity of target genes. Furthermore, MLF1 interacts with other transcription factors, cofactors, or chromatin-associated proteins to form a complex regulatory network (Lv et al., 2025; Vinopalová et al., 2024). These interactions may influence MLF1’s functionality by altering its DNA-binding affinity, transcriptional activity, or subcellular localization. MLF1 plays a pivotal role in cell proliferation and differentiation by influencing cell cycle progression and promoting or inhibiting cell proliferation. Additionally, MLF1 contributes to determining the differentiation direction of cells, thereby shaping their functional and phenotypic characteristics (Tang et al., 2023). Studies have shown that MLF1 plays a critical role in tumor initiation and progression across various cancer types. In certain types of tumors, alterations in MLF1 expression levels have been observed, which may correlate with tumor malignancy, prognosis, and therapeutic outcomes (Shimosato et al., 2025). Modulating the expression or function of MLF1 could potentially provide novel insights and strategies for tumor treatment (Huang et al., 2020). Other work has shown that MLF1 plays a role in aging and cell regulation (Li Z. et al., 2023). Our study shows that MLF1 is high in DN. It is linked to the enhanced function of natural killer (NK) cells and dendritic cells. This suggests that MLF1 may connect changes in gene methylation to problems in immune control (Lv et al., 2025). We also found that both MLF1 and CXCL2 are active in the MAPK pathway, which means they may work together to worsen DN (53). As a promising target for tumor therapy, MLF1 has garnered significant attention. Ongoing research aims to elucidate the precise mechanisms underlying MLF1’s role in tumorigenesis and progression, as well as to develop targeted therapeutic approaches. Regulating the expression level or function of MLF1 may offer new gene therapy strategies for certain genetic disorders or tumors, while also providing potential drug screening targets.
Our differential immune cell correlation analysis revealed significant positive correlations between activatedNK cells and activated dendritic cells (DCs), whereas naive CD4+ T cells showed a pronounced negative correlation with activated NK cells. In biomarker-immune cell correlation assessments: CXCL2 exhibited strong positive correlations with activated NK cells but negative correlations with γδ T cells; MLF1 demonstrated the strongest positive correlation with activated NK cells and the most pronounced negative correlation with naive CD4+ T cells. Mo Li et al. reported that miR-218 ameliorates DN by targeting IKK-β and suppressing NF-κB-mediated inflammation, evidenced by reduced levels of TNF-α, IL-6, IL-1β, and MCP-1 upon miR-218 overexpression (Li et al., 2020). Concurrently, Qianqian Han et al. identified elevated CD4+ T cell infiltration density as a predictor of severe nephropathic lesions and renal function decline in DN patients (Han et al., 2024). These findings delineate a “dual track” immunopathogenic model for diabetic nephropathy (DN): On one hand, chemokines such as CXCL2 drive the activation of innate immune components including NK cells; on the other hand, they induce functional dysregulation of CD4+ T cells. These dual immunologic perturbations converge through NF-κB signaling pathways, culminating in chronic renal inflammation and fibrosis. This comprehensive understanding not only deepens mechanistic insights into DN pathogenesis but also informs the development of precision immunomodulatory strategies. Future therapeutic exploration may prioritize combined interventions targeting NK cell activation thresholds and T cell functional recalibration to achieve synergistic efficacy.
Our study used several methods to find DN markers. We compared gene expression between DN patients and healthy controls and then combined this with demethylation data. This allowed us to screen out key candidate genes. We then applied LASSO and Boruta algorithms to pick the best markers. Our work shows that CXCL2 and MLF1 link gene methylation changes with inflammation. We built a prediction model (nomogram) that had a high AUC of 0.943. This method supports recent ideas that use both gene and immune data to study kidney disease (Jin et al., 2023; Bhayana et al., 2025; Shapiro et al., 2023).
We also found 172 drugs that might target CXCL2 and MLF1. Some drugs, such as valproic acid and trichostatin A, have been shown to reduce kidney damage. For example, trichostatin A can lower kidney scarring and inflammation in animal models (Gupta et al., 2023). The link between CXCL2/MLF1 levels and immune cell changes suggests that targeting these markers may alter the immune environment in DN, which could lead to new treatments (Chen Y. et al., 2024).
Our study has some limitations. We used blood samples to study gene expression. This may not capture all the changes that occur in the kidney. This is a common issue in DN marker studies (Nguyen et al., 2022). We confirmed the high levels of CXCL2 and MLF1 by RT-qPCR, but more experiments are needed to prove that these genes cause DN. Future work should use animal models or CRISPR-based methods to study these genes further. Other studies, such as those on TET1 in diabetic eye disease, show that such methods can be useful (Tan et al., 2021). Additionally, the datasets used in this study suffers from class imbalance, which may adversely affect the stability of machine learning models. Although we employed multiple strategies such as cross-validation and independent dataset validation during the research, future studies are still required to further verify our findings in larger and more balanced datasets.
In short, our study shows that CXCL2 and MLF1 are promising markers for diagnosing DN. They link gene methylation changes with immune and inflammatory pathways. Our use of machine learning and various data methods provides a strong way to find markers and treatment targets. Future research should confirm these results in larger groups and study the detailed roles of these genes in DN.
Data availability statement
The datasets analyzed for this study can be found in the Gene Expression Omnibus (GEO) database at https://www.ncbi.nlm.nih.gov/geo/. Specifically, the accession numbers are GSE142153 and GSE154881.
Ethics statement
The studies involving humans were approved by Longgang Central Hospital of Shenzhen Ethics Committee. The studies were conducted in accordance with the local legislation and institutional requirements. The participants provided their written informed consent to participate in this study.
Author contributions
HM: Writing – original draft, Writing – review and editing, Conceptualization, Funding acquisition, Resources, Software, Validation. YuZ: Data curation, Investigation, Writing – review and editing. JZ: Formal Analysis, Methodology, Software, Writing – review and editing. CD: Data curation, Validation, Writing – review and editing. YiZ: Data curation, Investigation, Validation, Writing – review and editing. FT: Data curation, Formal Analysis, Visualization, Writing – review and editing. XL: Conceptualization, Project administration, Resources, Supervision, Writing – review and editing.
Funding
The authors declare that no financial support was received for the research and/or publication of this article.
Acknowledgements
We would like to express our sincere gratitude to all individuals and organizations who supported and assisted us throughout this research. Special thanks to the Gene Expression Omnibus (GEO) database for providing the transcriptomic datasets. We also acknowledge Longgang Central Hospital of Shenzhen for providing clinical samples and facilities. Without your support, this research would not have been possible.
Conflict of interest
The authors declare that the research was conducted in the absence of any commercial or financial relationships that could be construed as a potential conflict of interest.
Generative AI statement
The authors declare that no Generative AI was used in the creation of this manuscript.
Any alternative text (alt text) provided alongside figures in this article has been generated by Frontiers with the support of artificial intelligence and reasonable efforts have been made to ensure accuracy, including review by the authors wherever possible. If you identify any issues, please contact us.
Publisher’s note
All claims expressed in this article are solely those of the authors and do not necessarily represent those of their affiliated organizations, or those of the publisher, the editors and the reviewers. Any product that may be evaluated in this article, or claim that may be made by its manufacturer, is not guaranteed or endorsed by the publisher.
Supplementary material
The Supplementary Material for this article can be found online at: https://www.frontiersin.org/articles/10.3389/fgene.2025.1675592/full#supplementary-material
Supplementary Table 1 | 3741 demethylation-related genes.
Supplementary Table 2 | Summary Table of PCR primer sequences.
Supplementary Table 3 | Summary Table of GO analysis.
Supplementary Table 4 | Summary Table of GO analysisi cellular components.
Supplementary Table 5 | Summary Table of GO analysisi molecular functions.
Supplementary Table 6 | Summary Table of KEGG analysis.
Supplementary Table 7 | Summary Table of f GSEA Results for CXCL2.
Supplementary Table 8 | Summary Table of GSEA Results for MLF1.
Supplementary Table 9 | Summary Table of correlation analysis between various differential immune cells.
Supplementary Table 10 | Summary Table of Differential immune cell and biomarker correlation.
Supplementary Table 11 | Summary Table of target drugs.
Supplementary Image 1 | Mechanism diagram of diabetic nephropathy.
Abbreviations
DN, Diabetic Nephropathy; YSXZF, Yi-Shen-Xie-Zhuo Formula; TCM, Traditional Chinese Medicine.
References
Ambujakshan, A., and Sahu, B. D. (2025). Unraveling the role of RIPKs in diabetic kidney disease and its therapeutic perspectives. Biochem. Pharmacol. 231, 116642. doi:10.1016/j.bcp.2024.116642
Amorin, R. G., Guedes, G. S., Vasconcelos, S. M. L., and Santos, J. C. F. (2019). Kidney disease in diabetes mellitus: cross-linking between hyperglycemia, redox imbalance and inflammation. Arq. Bras. Cardiol. 112 (5), 577–587. doi:10.5935/abc.20190077
Anders, H. J., Huber, T. B., Isermann, B., and Schiffer, M. (2018). CKD in diabetes: diabetic kidney disease versus nondiabetic kidney disease. Nat. Rev. Nephrol. 14, 361–377. doi:10.1038/s41581-018-0001-y
Bhayana, S., Schytz, P. A., Bisgaard Olesen, E. T., Soh, K., and Das, V. (2025). Single-cell advances in investigating and understanding chronic kidney disease and diabetic kidney disease. Am. J. Pathol. 195, 55–68. doi:10.1016/j.ajpath.2024.07.007
Cai, H., Chen, Y., Chen, X., Sun, W., and Li, Y. (2023). Tumor-associated macrophages mediate gastrointestinal stromal tumor cell metastasis through CXCL2/CXCR2. Cell Immunol. 384, 104642. doi:10.1016/j.cellimm.2022.104642
Chen, H., and Boutros, P. C. (2011). VennDiagram: a package for the generation of highly-customizable venn and euler diagrams in R. BMC Bioinforma. 12, 35. doi:10.1186/1471-2105-12-35
Chen, B., Khodadoust, M. S., Liu, C. L., Newman, A. M., and Alizadeh, A. A. (2018). Profiling tumor infiltrating immune cells with CIBERSORT. Methods Mol. Biol. 1711, 243–259. doi:10.1007/978-1-4939-7493-1_12
Chen, R., Zhou, J., Li, H., Cheng, F., Wang, Y., Xu, W., et al. (2024a). Histone lactylation-boosted ALKBH3 potentiates renal fibrosis via demethylation of SOX9 mRNA. Kidney Int. 106 (1), 113–129. doi:10.1016/j.kint.2024.04.022
Chen, Y., Liao, L., Wang, B., and Wu, Z. (2024b). Identification and validation of immune and cuproptosis - related genes for diabetic nephropathy by WGCNA and machine learning. Front. Immunol. 15, 1332279. doi:10.3389/fimmu.2024.1332279
Deng, S., Zhang, J., Su, J., Zuo, Z., Zeng, L., Liu, K., et al. (2022). RNA m(6)A regulates transcription via DNA demethylation and chromatin accessibility. Nat. Genet. 54, 1427–1437. doi:10.1038/s41588-022-01173-1
Fossum, C. C., Navarro, S., Farias, A. J., and Ballas, L. K. (2021). Racial disparities in the use of palliative radiotherapy for black patients with multiple myeloma in the United States. Leuk. Lymphoma 62, 3235–3243. doi:10.1080/10428194.2021.1953012
GBD 2015 Eastern Mediterranean Region Diabetes and Chronic Kidney Disease Collaborators (2018). Diabetes mellitus and chronic kidney disease in the Eastern Mediterranean Region: findings from the Global Burden of Disease 2015 study. Int. J. Public Health 63, 177–186. doi:10.1007/s00038-017-1014-1
Gu, Z., Eils, R., and Schlesner, M. (2016). Complex heatmaps reveal patterns and correlations in multidimensional genomic data. Bioinformatics 32, 2847–2849. doi:10.1093/bioinformatics/btw313
Guo, L. Y., Yang, F., Peng, L. J., Li, Y. B., and Wang, A. P. (2020). CXCL2, a new critical factor and therapeutic target for cardiovascular diseases. Clin. Exp. Hypertens. 42, 428–437. doi:10.1080/10641963.2019.1693585
Gupta, S., Dominguez, M., and Golestaneh, L. (2023). Diabetic kidney disease: an update. Med. Clin. North Am. 107, 689–705. doi:10.1016/j.mcna.2023.03.004
Han, Q., Xu, H., Li, L., Lei, S., Li, Z., Zhao, L., et al. (2024). Higher density of CD4+ T cell infiltration predicts severe renal lesions and renal function decline in patients with diabetic nephropathy. Front. Immunol. 15, 1474377. doi:10.3389/fimmu.2024.1474377
Harrison, A. M., and Goozee, R. (2014). Psych-related iPhone apps. J. Ment. Health 23, 48–50. doi:10.3109/09638237.2013.869575
He, C., Wang, D., Wang, R., Huang, Y., Huang, X., Shen, S., et al. (2022). Epigallocatechin gallate induces the demethylation of actinin alpha 4 to inhibit diabetic nephropathy renal fibrosis via the NF-KB signaling pathway In vitro. Dose Response 20, 15593258221105704. doi:10.1177/15593258221105704
Huang, D., Liu, C., Sun, X., Sun, X., Qu, Y., Tang, Y., et al. (2020). CRL4(DCAF8) and USP11 oppositely regulate the stability of myeloid leukemia factors (MLFs). Biochem. Biophys. Res. Commun. 529, 127–132. doi:10.1016/j.bbrc.2020.05.186
Ito, K., and Murphy, D. (2013). Application of ggplot2 to pharmacometric graphics. CPT Pharmacometrics Syst. Pharmacol. 2, e79. doi:10.1038/psp.2013.56
Jin, Q., Liu, T., Qiao, Y., Liu, D., Yang, L., Mao, H., et al. (2023). Oxidative stress and inflammation in diabetic nephropathy: role of polyphenols. Front. Immunol. 14, 1185317. doi:10.3389/fimmu.2023.1185317
Kang, K., Huang, H., and Chen, Z. (2024). Identification and validation of the prognostic signature of a novel demethylation-related gene associated with the clinical features of Colon cancer. Int. Immunopharmacol. 139, 112798. doi:10.1016/j.intimp.2024.112798
Kato, M., and Natarajan, R. (2024). Metabolic memory in diabetic kidney disease: an epigenetic perspective. Nat. Rev. Nephrol. 20 (2), 115–130. doi:10.1038/s41581-023-00773-2
Knaus, M. E., Weiman, D. S., and Valaulikar, G. (2021). Pulmonary artery and intercostal artery pseudoaneurysms after penetrating injury. Ann. Thorac. Surg. 112, e353–e355. doi:10.1016/j.athoracsur.2021.02.045
Li, M., Guo, Q., Cai, H., Wang, H., Ma, Z., and Zhang, X. (2020). miR-218 regulates diabetic nephropathy via targeting IKK-β and modulating NK-κB-mediated inflammation. J. Cell Physiol. 235, 3362–3371. doi:10.1002/jcp.29224
Li, G., Zhang, J., Liu, D., Wei, Q., Wang, H., Lv, Y., et al. (2021). Identification of hub genes and potential ceRNA networks of diabetic nephropathy by weighted gene Co-Expression network analysis. Front. Genet. 12, 767654. doi:10.3389/fgene.2021.767654
Li, Y., Lu, F., and Yin, Y. (2022). Applying logistic LASSO regression for the diagnosis of atypical Crohn's disease. Sci. Rep. 12, 11340. doi:10.1038/s41598-022-15609-5
Li, M., Wei, X., Zhang, S. S., Li, S., Chen, S. H., Shi, S. J., et al. (2023a). Recognition of refractory Mycoplasma pneumoniae pneumonia among myocoplasma pneumoniae pneumonia in hospitalized children: development and validation of a predictive nomogram model. BMC Pulm. Med. 23, 383. doi:10.1186/s12890-023-02684-1
Li, Z., Yang, Y., Wu, K., Li, Y., and Shi, M. (2023b). Myeloid leukemia factor 1: a double-edged sword in health and disease. Front. Oncol. 13, 1124978. doi:10.3389/fonc.2023.1124978
Li, Z., Liu, J., Li, H., Zhang, Y., Yang, F., Wang, C., et al. (2024). Histone H3K27 methyltransferase PRC2 mediates the pathogenesis of diabetic nephropathy through metabolic memory. Kidney Int. 106 (3), 665–680. doi:10.1016/j.kint.2024.06.022
Lin, T., Zhang, E., Mai, P. P., Zhang, Y. Z., Chen, X., and Peng, L. S. (2021). CXCL2/10/12/14 are prognostic biomarkers and correlated with immune infiltration in hepatocellular carcinoma. Biosci. Rep. 41, BSR20204312. doi:10.1042/bsr20204312
Livak, K. J., and Schmittgen, T. D. (2001). Analysis of relative gene expression data using real-time quantitative PCR and the 2(-Delta Delta C(T)) method. Methods 25, 402–408. doi:10.1006/meth.2001.1262
Lv, J., Chen, Q., Wang, J., Guo, N., Fang, Y., Guo, Q., et al. (2025). Downregulation of MLF1 safeguards cardiomyocytes against senescence-associated chromatin opening. Nucleic Acids Res. 53, gkae1176. doi:10.1093/nar/gkae1176
Mahmoudian, M., Venäläinen, M. S., Klén, R., and Elo, L. L. (2021). Stable iterative variable selection. Bioinformatics 37, 4810–4817. doi:10.1093/bioinformatics/btab501
Musselman, P., and Kay, R. (1986). The spectrum of urinary tract fibroepithelial polyps in children. J. Urol. 136, 476–477. doi:10.1016/s0022-5347(17)44915-9
Nadaf, S. J., and Killedar, S. G. (2020). Nanoliposome precursors for shape modulation: use of heuristic algorithm and QBD principles for encapsulating phytochemicals. Curr. Drug Deliv. 17, 599–612. doi:10.2174/1567201817666200512102532
Nguyen, L. T., Larkin, B. P., Wang, R., Faiz, A., Pollock, C. A., and Saad, S. (2022). Blood DNA methylation predicts diabetic kidney disease progression in high fat diet-fed mice. Nutrients 14, 785. doi:10.3390/nu14040785
O'Connor, R., van De Wouw, M., Moloney, G. M., Ventura-Silva, A. P., O'Riordan, K., Golubeva, A. V., et al. (2021). Strain differences in behaviour and immunity in aged mice: relevance to autism. Behav. Brain Res. 399, 113020. doi:10.1016/j.bbr.2020.113020
Qiu, Y., Tang, J., Zhao, Q., Jiang, Y., Liu, Y. N., and Liu, W. J. (2023). From diabetic nephropathy to end-stage renal disease: the effect of chemokines on the immune system. J. Diabetes Res. 2023, 3931043. doi:10.1155/2023/3931043
Quinn, M. H., Bauer, A. M., Fox, E. N., Hatzell, J., Randle, T., Purnell, J., et al. (2021). Rationale and design of a randomized factorial clinical trial of pharmacogenetic and adherence optimization strategies to promote tobacco cessation among persons with HIV. Contemp. Clin. Trials 110, 106410. doi:10.1016/j.cct.2021.106410
Ritchie, M. E., Phipson, B., Wu, D., Hu, Y., Law, C. W., Shi, W., et al. (2015). Limma powers differential expression analyses for RNA-sequencing and microarray studies. Nucleic Acids Res. 43, e47. doi:10.1093/nar/gkv007
Robin, X., Turck, N., Hainard, A., Tiberti, N., Lisacek, F., Sanchez, J. C., et al. (2011). pROC: an open-source package for R and S+ to analyze and compare ROC curves. BMC Bioinforma. 12, 77. doi:10.1186/1471-2105-12-77
Ruiz-Ortega, M., Rodrigues-Diez, R. R., Lavoz, C., and Rayego-Mateos, S. (2020). Special issue diabetic nephropathy: diagnosis, prevention and treatment. J. Clin. Med. 9, 813. doi:10.3390/jcm9030813
Sagoo, M. K., and Gnudi, L. (2020). Diabetic nephropathy: an overview. Methods Mol. Biol. 2067, 3–7. doi:10.1007/978-1-4939-9841-8_1
Samsu, N. (2021). Diabetic nephropathy: challenges in pathogenesis, diagnosis, and treatment. Biomed. Res. Int. 2021, 1497449. doi:10.1155/2021/1497449
Shapiro, J. S., Chang, H. C., Tatekoshi, Y., Zhao, Z., Waxali, Z. S., Hong, B. J., et al. (2023). Iron drives anabolic metabolism through active histone demethylation and mTORC1. Nat. Cell Biol. 25, 1478–1494. doi:10.1038/s41556-023-01225-6
Shi, H., Hou, Y., Su, X., Qiao, J., Wang, Q., Guo, X., et al. (2022). Mechanism of action of Tripterygium wilfordii for treatment of idiopathic membranous nephropathy based on network pharmacology. Ren. Fail 44, 116–125. doi:10.1080/0886022x.2021.2024850
Shimosato, Y., Yamamoto, K., Jia, Y., Zhang, W., Shiba, N., Hayashi, Y., et al. (2025). NPM1-fusion proteins promote myeloid leukemogenesis through XPO1-dependent HOX activation. Leukemia 39, 75–86. doi:10.1038/s41375-024-02438-w
Sui, Z., Wu, X., Du, L., Wang, H., Yuan, L., Zhang, J. V., et al. (2022). Characterization of the immune cell infiltration landscape in esophageal squamous cell carcinoma. Front. Oncol. 12, 879326. doi:10.3389/fonc.2022.879326
Szklarczyk, D., Morris, J. H., Cook, H., Kuhn, M., Wyder, S., Simonovic, M., et al. (2017). The STRING database in 2017: quality-controlled protein-protein association networks, made broadly accessible. Nucleic Acids Res. 45, D362–d368. doi:10.1093/nar/gkw937
Tan, Y., Cao, H., Li, Q., and Sun, J. (2021). The role of transcription factor Ap1 in the activation of the Nrf2/ARE pathway through TET1 in diabetic nephropathy. Cell Biol. Int. 45, 1654–1665. doi:10.1002/cbin.11599
Tang, Z., Yang, Y., Chen, W., and Liang, T. (2023). Epigenetic deregulation of MLF1 drives intrahepatic cholangiocarcinoma progression through EGFR/AKT and Wnt/β-catenin signaling. Hepatol. Commun. 7, e0204. doi:10.1097/hc9.0000000000000204
Taylor, K., Lowes, S., Stanley, E., Hamilton, P., Redman, A., Leaver, A., et al. (2019). Evidence for avoiding the biopsy of typical fibroadenomas in women aged 25-29 years. Clin. Radiol. 74, 676–681. doi:10.1016/j.crad.2019.02.019
Thipsawat, S. (2021). Early detection of diabetic nephropathy in patient with type 2 diabetes mellitus: a review of the literature. Diab Vasc. Dis. Res. 18, 14791641211058856. doi:10.1177/14791641211058856
Thomas, B. (2019). The global burden of diabetic kidney disease: Time trends and gender gaps. Curr. Diab Rep. 19, 18. doi:10.1007/s11892-019-1133-6
Vinopalová, M., Arbonová, L., Füssy, Z., Dohnálek, V., Samad, A., Bílý, T., et al. (2024). Mlf mediates proteotoxic response via formation of cellular foci for protein folding and degradation in Giardia. PLoS Pathog. 20, e1012617. doi:10.1371/journal.ppat.1012617
Wang, D., Wu, W., Callen, E., Pavani, R., Zolnerowich, N., Kodali, S., et al. (2022). Active DNA demethylation promotes cell fate specification and the DNA damage response. Science 378, 983–989. doi:10.1126/science.add9838
Wu, T., Hu, E., Xu, S., Chen, M., Guo, P., Dai, Z., et al. (2021). clusterProfiler 4.0: a universal enrichment tool for interpreting omics data. Innov. (Camb) 2, 100141. doi:10.1016/j.xinn.2021.100141
Yoshida, Y., Kuroiwa, H., Shimada, T., Yoshida, M., Ohnuma, M., Fujiwara, T., et al. (2017). Glycosyltransferase MDR1 assembles a dividing ring for mitochondrial proliferation comprising polyglucan nanofilaments. Proc. Natl. Acad. Sci. U. S. A. 114, 13284–13289. doi:10.1073/pnas.1715008114
Yuan, C. M., Nee, R., Ceckowski, K. A., Knight, K. R., and Abbott, K. C. (2017). Diabetic nephropathy as the cause of end-stage kidney disease reported on the medical evidence form CMS2728 at a single center. Clin. Kidney J. 10, 257–262. doi:10.1093/ckj/sfw112
Zhang, H., Meltzer, P., and Davis, S. (2013). RCircos: an R package for Circos 2D track plots. BMC Bioinforma. 14, 244. doi:10.1186/1471-2105-14-244
Zhang, L., Pan, Q., Zhang, L., Xia, H., Liao, J., Zhang, X., et al. (2023). Runt-related transcription factor-1 ameliorates bile acid-induced hepatic inflammation in cholestasis through JAK/STAT3 signaling. Hepatology 77, 1866–1881. doi:10.1097/hep.0000000000000041
Zhang, Y., Liu, J., Li, H., Zhang, Y., Yang, F., Wang, C., et al. (2024). METTL3-dependent N6-methyladenosine modification of Gsta4 mRNA regulates mitochondrial dysfunction and tubular damage in diabetic kidney disease. Nat. Commun. 15 (1), 6462. doi:10.1038/s41467-024-50925-8
Zhao, M., Wang, J., Li, X., Hu, S., Ma, L., Zhou, H., et al. (2024). SIRT3-dependent delactylation of PDHA1 alleviates hypertensive renal fibrosis. Cell Metab. 36 (6), 1341–1359.e9. doi:10.1016/j.cmet.2024.04.015
Keywords: diabetic nephropathy, demethylation, machine Learning, Biomarkers, drug forecasting
Citation: Miao H, Zhu Y, Zheng J, Deng C, Zeng Y, Tang F and Liu X (2025) Identification and experimental validation of demethylation-related genes in diabetic nephropathy. Front. Genet. 16:1675592. doi: 10.3389/fgene.2025.1675592
Received: 21 August 2025; Accepted: 07 November 2025;
Published: 26 November 2025.
Edited by:
Michael Rossbach, roßbach and company, GermanyReviewed by:
Reaz Ahmmed, University of Rajshahi, BangladeshYang Liu, Qilu Medical University, China
Copyright © 2025 Miao, Zhu, Zheng, Deng, Zeng, Tang and Liu. This is an open-access article distributed under the terms of the Creative Commons Attribution License (CC BY). The use, distribution or reproduction in other forums is permitted, provided the original author(s) and the copyright owner(s) are credited and that the original publication in this journal is cited, in accordance with accepted academic practice. No use, distribution or reproduction is permitted which does not comply with these terms.
*Correspondence: Xi Liu, VzEzNzYwNDQ4ODI5QDEyNi5jb20=
†These authors have contributed equally to this work