 Xiaopo Zhang
 Qinshuang Dang2
 Zhenggen Deng
 Weidong Gan
 Hongqian Guo
- 1Department of Urology, Nanjing Drum Tower Hospital, Nanjing Drum Tower Hospital Clinical College, Nanjing Medical University, Nanjing, China
- 2Department of Urology, Nanjing Drum Tower Hospital, Nanjing Drum Tower Hospital Clinical College, Nanjing University of Chinese Medicine, Nanjing, China
- 3Department of Urology, Nanjing Drum Tower Hospital, Affiliated Hospital of Medical School, Nanjing University, Nanjing, China
Background/Objectives: To address the unelucidated mechanisms of breakpoint formation in TFE3-rearranged renal cell carcinoma (TFE3-rRCC), this study characterizes breakpoint distribution within the TFE3 gene. We further explore how non-canonical DNA structures and their thermodynamic stability fluctuation may act as predisposing factors for the genomic instability driving these characteristic translocations.
Methods: TFE3 breakpoints were identified in a cohort of 31 TFE3-rRCC tumor samples. The chi-square test was used to assess the statistical significance of breakpoint clustering. To investigate potential structural determinants, we predicted the distribution of G-quadruplex-forming sequences and palindromic motifs. Moving beyond simple motif density, we calculated the local Gibbs free energy changes (ΔG) associated with DNA secondary structures using Mfold and RNAfold to model thermodynamic stability across the TFE3 gene. This thermodynamic stability fluctuation was quantified as the maximum absolute local change in folding free energy (|dΔG|). Finally, this correlation between thermodynamic stability fluctuation and breakpoint location was validated by analyzing the 13 most frequently rearranged genes reported in the COSMIC database.
Results: A significant breakpoint cluster was identified within intron 5 of TFE3, containing 23 of 31 breakpoints (74.19%; chi-square test, P < 0.05). While the simple density of G-quadruplex or palindromic motifs did not directly correlate with breakpoint locations, a strong association with local thermodynamic stability fluctuation was observed. The region within intron 5 exhibited the highest thermodynamic stability fluctuation. This result suggests that regions of high thermodynamic stability fluctuation are correlated with increased susceptibility to DNA breakage. This finding was corroborated in the COSMIC dataset, where breakpoints in 12 of the 13 most frequently rearranged genes were similarly located near peaks of high |dΔG|.
Conclusion: Our findings indicate that breakpoint events in TFE3-rRCC are non-randomly clustered within intron 5. This clustering correlates strongly with regions characterized by high thermodynamic stability fluctuation (|dΔG|) of potential non-canonical DNA secondary structures. The principle that elevated local thermodynamic stability fluctuation is a feature of breakpoint locations was supported by analysis of a broader set of oncogenes, suggesting that high local thermodynamic stability fluctuation is a common feature of translocation-prone regions in cancer, representing a plausible, though not proven, contributor to genomic fragility.
1 Introduction
Transcription Factor Binding to IGHM Enhancer 3-rearranged renal cell carcinoma (TFE3-rRCC) is a distinct subtype of renal cell carcinoma that predominantly affects young and middle-aged patients and is characterized by chromosome translocations involving the Transcription Factor E3 (TFE3) gene (HGNC:11752) (Pinto and Chetty, 2020). These tumors exhibit a variety of TFE3 gene fusions, with partners including ASPSCR1, CLTC, DVL2, LUC7L3, KHSRP, PRCC, PARP14, NONO, SFPQ1, MED15, RBM10, NEAT1, and KAT6A (Pei et al., 2019). The resulting chimeric TFE3 proteins, generated by these chromosomal rearrangements, retain the bHLH-Zip domain and act as oncogenic transcription factors (Tang and Baba, 2023). Consequently, disruption of the TFE3 gene is considered to be the initiating oncogenic event.
The TFE3 gene is located within FRAXG, a common fragile site (CFS) (Mrasek et al., 2010). CFSs are specific, heritable chromosomal regions that exhibit a high susceptibility to forming gaps or breaks when cells are subjected to replicative stress, such as exposure to DNA replication inhibitors (Mirceta et al., 2022). The fragility of these sites is a major contributor to genomic instability. Over half of the breakpoints in gene pairs involved in cancer-specific recurrent translocations have been mapped to fragile human chromosomal sites. Among the 25 genes involved in TFE3-rRCC (TFE3 and its fusion partners), 16 (64%) are located within known human chromosomal fragile sites (Supplementary File 1). While multiple mechanisms, such as R-loops and replication timing, contribute to genomic fragility, this study focuses on the role of thermodynamic stability fluctuation arising from non-canonical DNA structures (Sinai et al., 2019). Since then, more than 15 types of DNA structure that differ from canonical B-DNA have been reported, including hairpins/cruciform, Z-DNA, triplexes, tetraplexes, slipped DNA, and sticky DNA and so on (Wang and Vasquez, 2023).
AT-rich DNA sequences, known for their structural flexibility, can promote the formation of secondary structures that impede replication fork progression, leading to stalling and an increased propensity for DNA breakage at these loci (Sinai et al., 2019; Duardo et al., 2023). During DNA replication, transient single-stranded DNA (ssDNA) regions are exposed, particularly on the lagging-strand template. These exposed ssDNA regions are thermodynamically unstable and can fold into non-canonical secondary structures, such as hairpins (formed from palindromic sequences) and G-quadruplexes, to achieve a more stable, lower-energy conformation. This folding process releases energy that is quantifiable as Gibbs free energy change (ΔG). The thermodynamic stability of these structures can be quantified by the change in Gibbs free energy (ΔG) at physiological temperature (37 °C), providing insight into their potential for formation (Takahashi et al., 2022). ΔG = ΔH − TΔS, where ΔH represents the change in enthalpy, T is the temperature, and ΔS is the change in entropy. A more negative ΔG value indicates a more spontaneous folding process and a more stable resulting structure.
Currently, investigations into the link between thermodynamic stability fluctuation and chromosomal translocations have been largely correlational and lack validation at the nucleotide-resolution of precise breakpoints. This study aims to address this gap by analyzing the thermodynamic landscape at the precise breakpoints of the TFE3 gene in TFE3-rRCC patients, thereby elucidating a potential biophysical mechanism underlying TFE3 gene disruption.
2 Materials and methods
2.1 Detecting TFE3 breakpoints in TFE3-rRCC patients using second-generation sequencing technology
This retrospective study was approved by the Research Ethics Committee of Nanjing Drum Tower Hospital, and a waiver of informed consent was granted for all included cases. A total of 31 formalin-fixed, paraffin-embedded tumor tissue samples, with a diagnosis of TFE3-rearranged renal cell carcinoma (TFE3-rRCC) confirmed by TFE3 immunohistochemistry and break-apart fluorescence in situ hybridization (FISH) probes, were selected from the case database of Nanjing Drum Tower Hospital (2018–2024). These 31 FFPE tumor tissue blocks were profiled using both Illumina RNA sequencing (RNA-seq) and DNA targeted gene capture sequencing to characterize the underlying TFE3 fusion events. Subsequently, the sequencing data were analyzed to identify the specific fusion partner genes and to precisely map the genomic breakpoints.
While RNA sequencing (RNA-seq) can identify the transcriptomic fusion junction by detecting the chimeric mRNA sequence, this junction does not precisely delineate the genomic breakpoint. Specifically, when a genomic breakpoint occurs within an intron, the process of pre-mRNA splicing removes the intron-containing sequence, thereby eliminating the breakpoint information from the mature mRNA transcript (Figure 1). Consequently, RNA-seq can reveal which exons are involved in the fusion but can only approximate the location of the genomic breakpoint to the flanking introns. Similarly, for breakpoints occurring within an exon, RNA-seq can detect the fusion site, but it cannot resolve the exact genomic coordinates or account for small insertions and deletions (indels) that may arise during the DNA repair process.
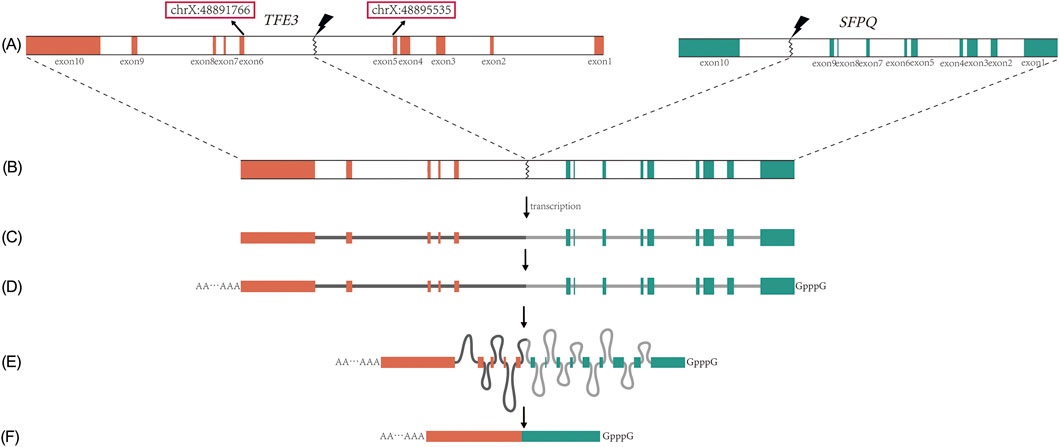
Figure 1. Fusion, transcription, and splicing of the TFE3 and its partner gene (illustrated by SFPQ). (A) Breakage of the TFE3 and SFPQ, with the red box indicating the 5th intron start/end; (B) SFPQ-TFE3 fusion gene; (C) Transcriptional precursor, i.e., pre-mRNA; (D) Modification of the start and end of pre-mRNA; (E) Formation of lariat RNA during splicing, loss of breakage information at the intron; (F) mRNA appearing in the cytoplasm, with the lariat removed.
Bioinformatic analysis commenced with quality control for both raw RNA and DNA sequencing reads using fastp (v0.23.4) to remove adapters and low-quality sequences (Chen et al., 2018). For the RNA-seq data, TFE3 fusion transcripts were identified using STAR-Fusion (v1.15.1) (Haas et al., 2017). For the DNA-seq data, paired-end reads were aligned to the human reference genome (GRCh37/hg19) using the BWA-MEM (v0.7.17). The resulting Sequence Alignment Map (SAM) files were converted to Binary Alignment Map (BAM) format, sorted, and indexed using Samtools (v1.17). Finally, the precise genomic breakpoints of the TFE3 rearrangements were identified from the aligned DNA-seq data using Factera (v1.4.4) (Newman et al., 2014).
2.2 Breakpoint distribution and exon/intron length normalization
A chi-square (χ2) goodness-of-fit test was utilized to determine if the observed breakpoint distribution within the TFE3 gene deviated significantly from a random distribution. The genomic coordinates, structure, and lengths of TFE3 introns and exons were retrieved from GENCODE annotations corresponding to the human reference genome assembly GRCh37/hg19. Considering the oncogenic selective pressure of TFE3 fusion proteins, it is sufficient to analyze whether the breakpoints in the TFE3 gene are randomly distributed between exon 1 and intron 6. The null hypothesis (H0) stated that breakpoints were distributed randomly across upstream of exon 7 of TFE3, with the frequency in any given region being proportional to its length. The expected number of breakpoints (Eᵢ) for each region was calculated using the formula: Eᵢ = (Lᵢ/L_total) × N, where Lᵢ is the length of a given region, L_total is the cumulative length of upstream of exon 7 of TFE3, and N is the total number of observed breakpoints (N = 31). For the primary analysis, breakpoints were categorized into two groups for comparison: those within intron 5 and those located in all other genic regions (introns and exons) combined in upstream of exon 7 of TFE3. A P-value <0.05 was set as the threshold for statistical significance. Subsequently, to normalize for the varying lengths of these regions, breakpoint density was calculated for each feature as the number of breakpoints per kilobase (kb). This normalization enabled a direct comparison of breakpoint density across different genic regions.
2.3 Analysis of GC content
To investigate local GC content as a potential confounding factor in breakpoint localization, we calculated the GC percentage for all introns and exons of the TFE3 gene. Genomic sequences for these regions were extracted from the human reference genome (GRCh37/hg19), and their respective GC contents were computed using the nuc utility within bedtools. This descriptive analysis aimed to determine if the breakpoint-dense intron 5 possessed anomalous GC content compared to other regions of the gene that are less prone to breakage.
2.4 Prediction of non-canonical DNA structures and computational pipeline for thermodynamic stability fluctuation analysis
To investigate the structural features of the TFE3 gene, we performed two distinct computational analyses: a motif-based search for known non-canonical DNA structures and a comprehensive biophysical analysis of local thermodynamic stability.
2.4.1 Motif-based prediction of G-Quadruplexes and palindromes
The genomic sequence for human TFE3 (based on transcript NM_006521.6) was extracted from the human reference genome (GRCh37/hg19). We first scanned this sequence for motifs known to form non-canonical DNA structures that can impede replication fork progression. G-quadruplex Prediction: Putative G-quadruplex forming sequences were identified using two independent algorithms to ensure robustness. QGRS Mapper (parameters: max length 30, min G-group 2, loop size 0–36) was used for its established G-scoring algorithm. Predictions were cross-validated using G4Hunter. G-quadruplexes, were evident to be the reason behind TFE3 induced oncogenesis executed by translocation (Verma and Das, 2018), were predicted using multiple algorithms (Lerner and Sale, 2019). Both tools have been successfully applied in previous studies (Bezzi et al., 2021; Obara et al., 2024; Nie et al., 2023). Palindrome Prediction: Palindromic sequences, which can form cruciform or hairpin structures, were identified using the Palindrome analysis tool (parameters: min length 6 bp, max length 30 bp, spacer 0–10 bp, mismatches ≤1) and cross-validated with EMBOSS Palindrome (Lu et al., 2015).
2.4.2 Computational pipeline for thermodynamic stability fluctuation analysis
To move beyond simple motif counts, we designed a computational pipeline to model the biophysical stability of the DNA sequence at high resolution. The entire pipeline, from sequence preparation to peak identification, is detailed below.
Step 1: Rationale and Sequence Preparation. Our central hypothesis is that transiently single-stranded DNA (ssDNA), which forms during replication and transcription, can fold into secondary structures. The stability of these structures can influence genomic integrity. To model this, we employed a sliding window approach across the TFE3 gene sequence. A window size of 300 base pairs (bp) was selected to approximate the length of transiently exposed ssDNA, such as that seen in Okazaki fragments on the lagging strand (Hay and DePamphilis, 1982; Anderson and DePamphilis, 1979). The analysis advanced with a 1-nucleotide (nt) step size to generate a high-resolution, nucleotide-by-nucleotide profile of local folding potential.
Step 2: Calculation of Folding Free Energy (ΔG). For each 300-bp window, the minimum free energy of folding (ΔG, in kcal/mol) was calculated using the Mfold software (v3.6), which is widely used for predicting nucleic acid secondary structures. The ΔG value represents the thermodynamic stability of the most stable secondary structure a sequence can form; more negative values indicate more stable structures. Calculations were performed under simulated physiological conditions (temperature = 37 °C [Na+] = 1.0 M [Mg2+] = 0.0 M) (Zuker, 2003). Dillon et al. demonstrate the validity of Mfold secondary structure predictions (Dillon et al., 2013). The resulting ΔG for each window was assigned to the coordinate of its starting nucleotide, creating a comprehensive energy landscape across the gene. To ensure our findings were not tool-dependent, the entire analysis was independently validated using the RNAfold program (ViennaRNA package v2.4.7) with its corresponding DNA energy parameters.
Step 3: Quantification of Thermodynamic Stability Fluctuation (|dΔG|). Breakpoints are hypothesized to occur not just in regions of high or low stability, but in regions where this stability changes sharply. To quantify this local structural volatility, we calculated the thermodynamic stability fluctuation, denoted as |dΔG|. This metric was computed as the absolute difference in folding energy (ΔG) between two points separated by a 30-bp interval:
where ΔGi is the free energy of the 300-bp window starting at position i. A high |dΔG| value thus signifies a rapid transition between regions of differing structural stability, which we propose as a marker for potential genomic fragility.
Step 4: Peak Identification and Association with Breakpoints. Significant peaks in the |dΔG| profile, representing points of maximum structural stress, were identified objectively as extreme outliers using the robust interquartile range (IQR) method. A |dΔG| value was classified as a significant peak if it exceeded the upper threshold of Q3 + 3*IQR, where Q3 is the third quartile. Finally, a predicted thermodynamic stability fluctuation peak was considered to be associated with an experimental breakpoint if it was located within a ±500 bp window of the intron/exon where the breakpoint cluster is located. This window was chosen to account for the fact that the region of maximum structural stress may not be the precise site of breakage but rather predisposes the local chromatin environment to DNA damage. This comprehensive pipeline allowed us to correlate high levels of predicted structural stress with the locations of experimentally observed DNA breaks.
2.5 Statistical analysis
To rigorously assess the spatial association between breakpoint locations and specific genomic features, we employed a permutation testing framework. This non-parametric approach is particularly robust for datasets with a small number of regions and a highly skewed distribution of events (i.e., breakpoints), as it does not rely on assumptions of normality or other theoretical distributions.
The primary null hypothesis (H0) for our permutation tests was that the spatial distribution of the 31 observed breakpoints is independent of the underlying genomic feature being tested.
We performed separate permutation tests for three features: (1) the peak thermodynamic stability fluctuation (max |dΔG|) within each genomic region (exons and introns upstream of exon 7), (2) G-quadruplex motifs density (motifs/kb) within each genomic region (exons and introns upstream of exon 7), and (3) palindromic motifs density (motifs/kb) within each genomic region (exons and introns upstream of exon 7).
For each feature, we defined a test statistic (T) that measures the degree of association between breakpoints and the feature’s value. This was calculated as the sum of the feature values across all regions, weighted by the number of breakpoints in each region:
where Fᵢ is the value of the feature (e.g., max |dΔG|) for region i, and Bᵢ is the number of observed breakpoints in region i. The observed test statistic, T_obs, was calculated using the actual experimental data. A high T_obs value suggests that breakpoints preferentially occur in regions with high feature values. To generate an empirical null distribution, we simulated 10,000 random permutations of the breakpoint locations. In each permutation, the 31 breakpoints were randomly redistributed among the 12 genomic regions (introns and exons from exon 1 to intron 6). Critically, to account for differences in region size, the probability of a breakpoint being assigned to a specific region i was proportional to its length (Lᵢ). This ensures that the null model represents a random distribution based on length alone. For each of the 10,000 permutations, a new test statistic, T_perm, was calculated using the randomly assigned breakpoint distribution. This process generated a null distribution of 10,000 T_perm values, representing the range of association strengths expected purely by chance. The one-sided P-value was calculated as the proportion of permutations where the permutation statistic was greater than or equal to the observed statistic:
A P-value <0.05 was considered statistically significant, leading to the rejection of the null hypothesis and indicating a significant spatial co-localization between breakpoints and the tested genomic feature. All permutation tests were implemented and performed using custom scripts in R (version 4.5.7).
2.6 Validation using public data (COSMIC)
Our analysis of the TFE3 gene revealed a strong association between the breakpoint cluster in intron 5 and a region of high thermodynamic stability fluctuation, quantified as the rate of change in Gibbs free energy (|dΔG|). To determine if this correlation represents a more general mechanism of translocation-mediated mutagenesis rather than a phenomenon unique to TFE3-rRCC, we sought to validate our hypothesis using an independent, large-scale dataset. We posited that if high |dΔG| is a genuine marker of genomic fragility, then recurrent breakpoints in other frequently rearranged cancer-associated genes should also co-localize with peaks of thermodynamic stability fluctuation.
We queried the COSMIC Gene Fusion Curation resource (human somatic variants; COSMIC v102, released 21-MAY-25) and ranked genes by the number of samples in which fusion events were reported. Following the removal of duplicate entries from the same sample, we selected ten genes based on two criteria: harboring the highest number of total breakpoints and exhibiting a highly concentrated breakpoint distribution (defined as a primary hotspot containing >50% of the gene’s total breakpoints). The selected genes were ABL1, ALK, CCDC6, ETV6, KIF5B, NCOA4, PBX1, RET, RUNX1, and TCF3. In addition, due to the extremely high frequency of fusion events, we analyzed three pediatric sarcoma-associated genes: EWSR1 (Ewing sarcoma), NTRK3 (infantile fibrosarcoma, congenital mesoblastic nephroma), and FOXO1 (alveolar rhabdomyosarcoma). Breakpoint coordinates were harmonized to a single reference (GRCh37/hg19). For each gene, we identified the genomic area with the highest frequency of breakpoints (defined as the primary breakpoint hotspot) and calculated its proportion relative to the total number of recorded breakpoints. Subsequently, the identical free energy analysis performed on TFE3 (as described in Section 2.4) was applied to each gene. This entailed calculating local Gibbs free energy changes (ΔG) across their genomic sequences using Mfold software, deriving the corresponding |dΔG| profile, and identifying significant peaks using the interquartile range (IQR) method. Finally, for each gene, we determined whether its primary breakpoint hotspot co-localized with a |dΔG| peak by examining a 500 bp window centered on the hotspot. This window size, consistent with the methodology in Section 2.4, was selected to capture significant local thermodynamic stability fluctuation while accommodating gene-specific variations.
3 Results
3.1 Breakpoints of TFE3 in TFE3-rRCC patients
Analysis of sequencing data from 31 patient cases revealed that RNA sequencing identified fusion breakpoints within specific introns for 25 cases (Table 1), whereas DNA sequencing pinpointed the precise fusion sites in the remaining six cases. Of these 31 fusion sites, 23 (74.19%) were located in intron 5, followed by four in intron 4, two in intron 1, one in exon 4, and one in exon 5. The high prevalence (74.19%) of breakpoints in intron 5 suggests that this region is a breakpoint hotspot.
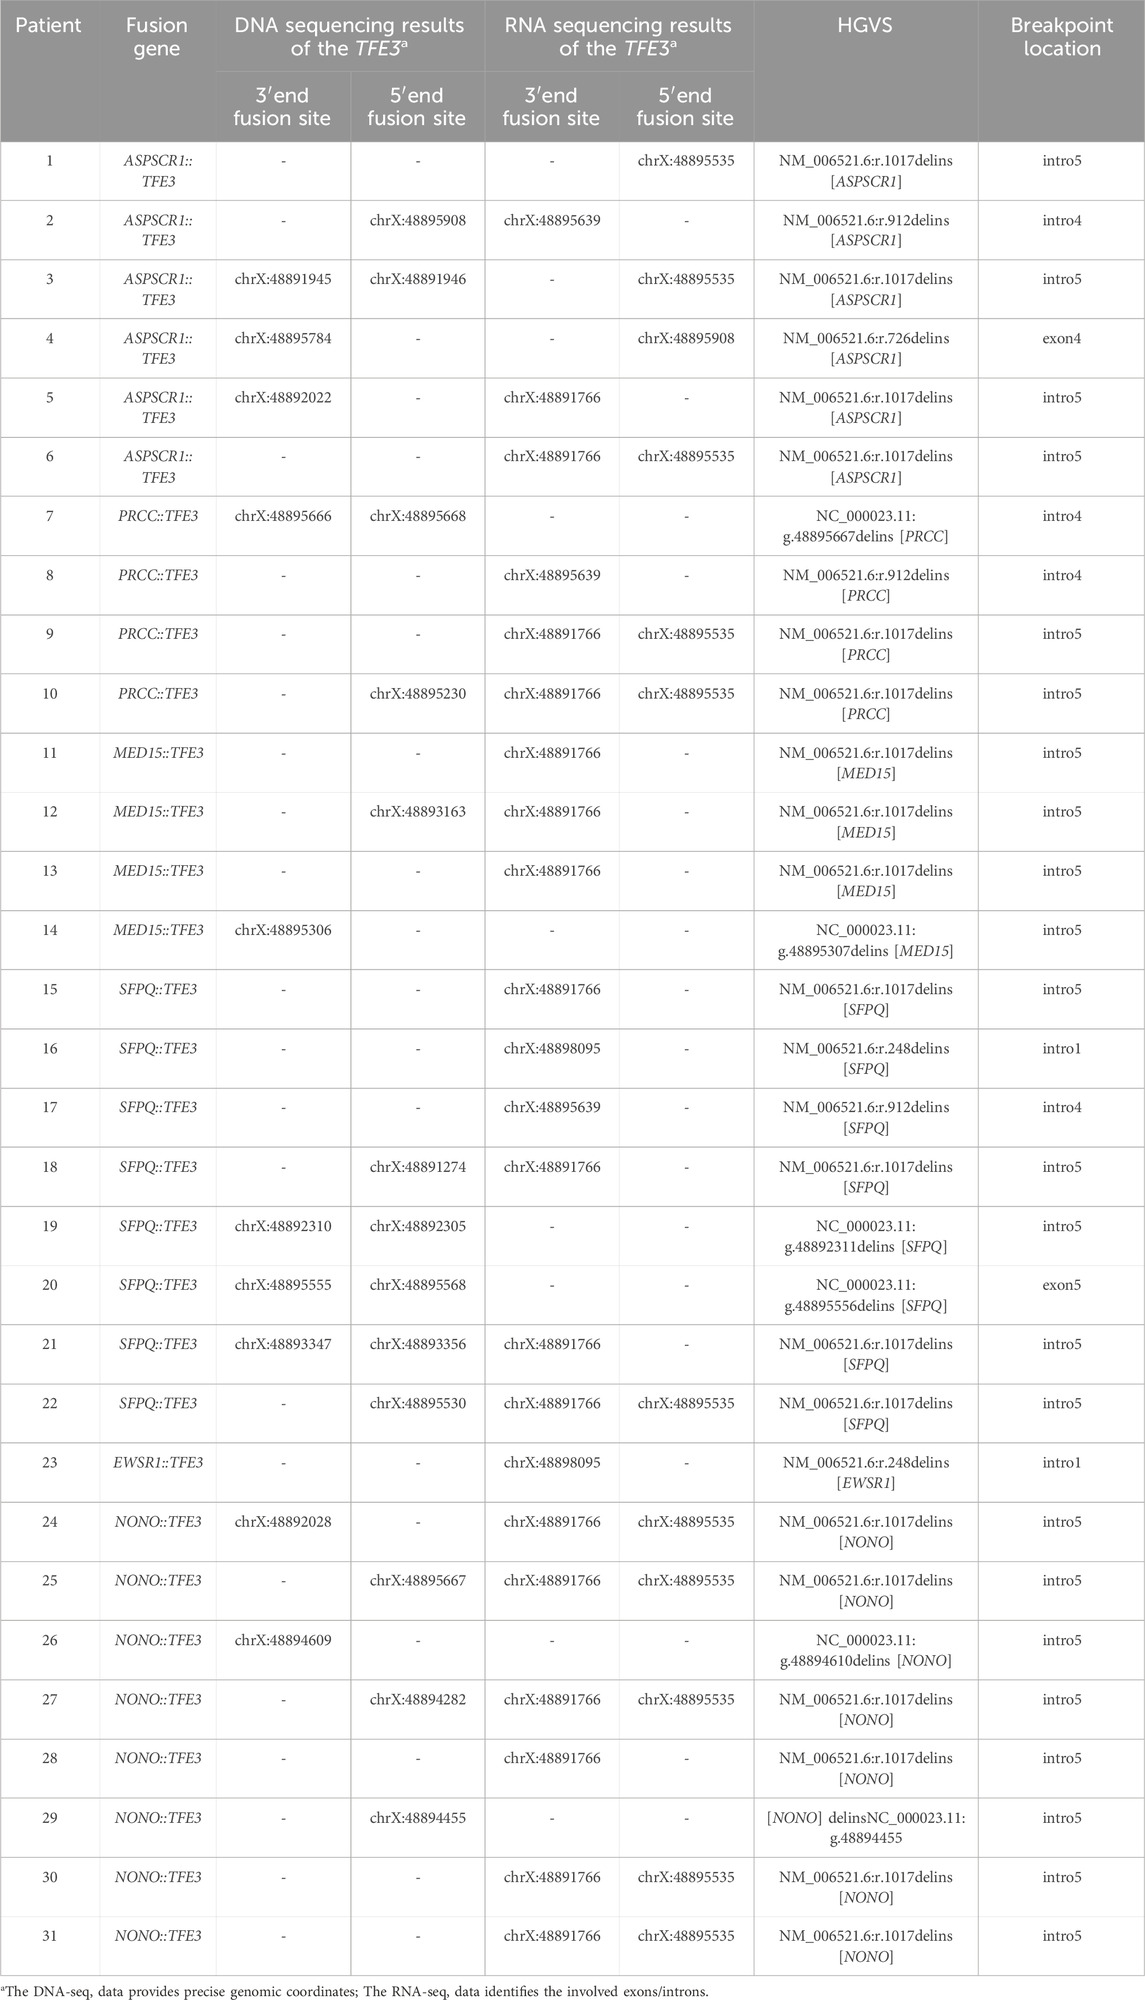
Table 1. Fusion sites and putative breakpoint ranges of the fusion gene in TFE3-rRCC patients.
3.2 Breakpoint enrichment in intron 5 is independent of its length
Our null hypothesis posited that the observed distribution of breakpoints across intron 5 and all other genic regions upstream of exon 7 of TFE3 is proportional to the length of these regions. The significance level was set at 0.05. The chi-square test revealed a highly significant deviation between the observed and expected breakpoint distributions (χ2 (1, N = 31) = 15.80, P < 0.001), leading us to reject the null hypothesis and concluding that intron 5 is a breakpoint hotspot region (Table 2).

Table 2. Breakpoints number of expected and observed of intron 5 with other introns/exons of TFE3.
To further characterize the breakpoint distribution, we calculated the standardized density (breakpoints per kilobase). Notably, this analysis revealed that intron 4 exhibited the highest breakpoint density (48.19/kb), followed by exon 5 (9.62/kb) and intron 5 (6.10/kb). Synthesizing these results, while intron 5 does not have the highest breakpoint density, it harbors the largest absolute number of breakpoints. Therefore, the critical finding is that intron 5 represents a significant hotspot of chromosomal fragility, accumulating a disproportionately high number of breakpoints relative to its size, even though other smaller regions exhibit higher breakpoint densities.
3.3 Breakpoint enrichment in intron 5 is not associated with its GC content
To evaluate GC content as a potential contributing factor to breakpoint distribution, we examined its percentage across all TFE3 exons and introns. Our analysis revealed that breakpoint-rich intron 5 exhibited a GC content of 48.37%, a moderate value that lies within the range observed for other TFE3 introns and exons (43.37%–70.73%; Table 3). No anomalous GC content was identified in intron 5 that would distinguish it from breakpoint-sparse regions of the gene. These findings suggest that local GC content is not a primary determinant of breakpoint susceptibility in TFE3.
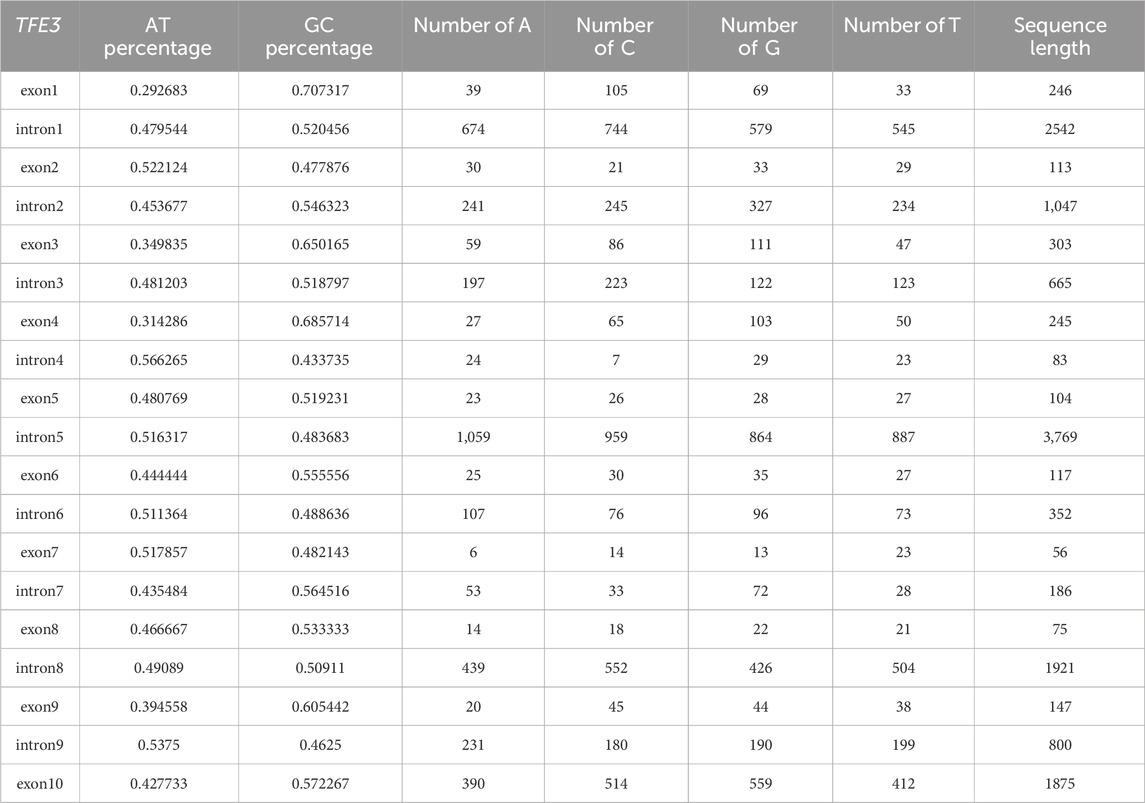
Table 3. The AT/GC content percentage, A/C/G/T content, and fragment length for each intron and exon of the TFE3 gene.
3.4 Distribution of non-canonical DNA structures and their stability
We predicted G-quadruples and palindromes within TFE3. Cross-validate by calculating G-quadruple sequences in TFE3 with QGRS Mapper and G4Hunter, and by calculating palindromic structures in TFE3 with Palindrome analysis and EMBOSS Palindrome. The number of DNA structures at various positions of the TFE3 gene is shown in the figure (Figure 2).
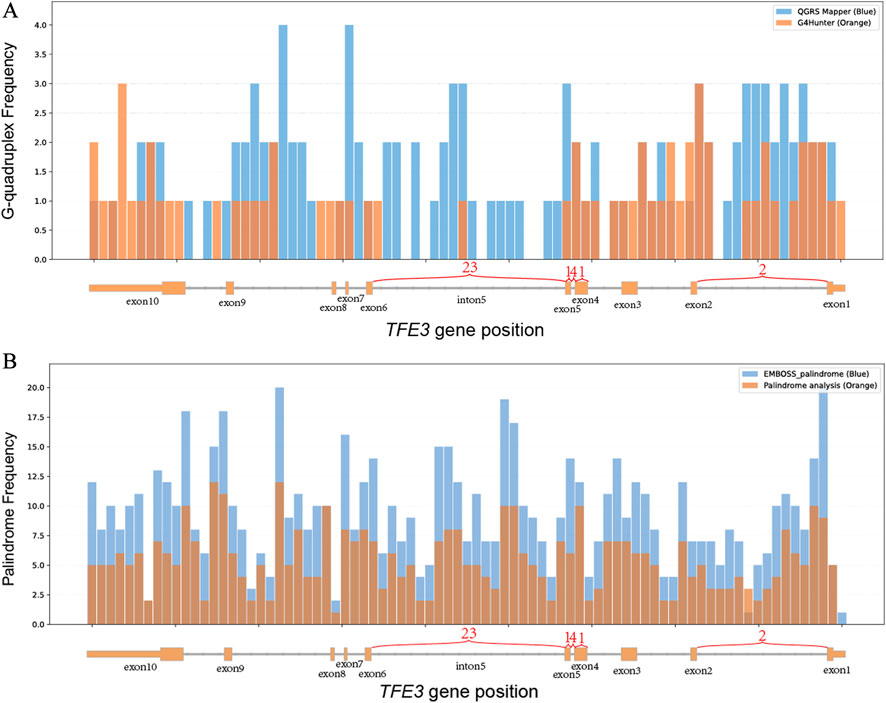
Figure 2. Histogram of the correspondence between the distribution of G-quadruple and palindrome counts on the TFE3 gene and actual TFE3 gene breakpoints. The X-axis represents the TFE3 gene, showing the number of breakpoints across its exons and introns, the Y-axis represents the count (a: G-quadruple; b: palindrome), the histogram bin width is 184 bp; (A) light blue indicates the G-quadruple count distribution calculated using QGRS Mapper, and light orange indicates the G-quadruple count distribution calculated using G4Hunter. (B) light blue indicates the palindrome count distribution calculated using Palindrome analysis, and light orange indicates the palindrome count distribution calculated using EMBOSS Palindrome.
To quantify the thermodynamic stability of potential secondary structures, the free energy of folding (ΔG) was calculated using Mfold. This was performed on the full-length sequence of TFE3 using a 300-nucleotide (nt) sliding window with a 1-nt step size, with the results presented in Figure 3 green line. To assess the thermodynamic stability fluctuation, we calculated the absolute change in ΔG over a 30-base-pair sliding window (|dΔG|). The primary |dΔG| peak was located precisely within intron 5, indicating a region of rapid change in thermodynamic stability. This pronounced thermodynamic stability fluctuation is hypothesized to contribute to the elevated frequency of DNA breakage at this locus.
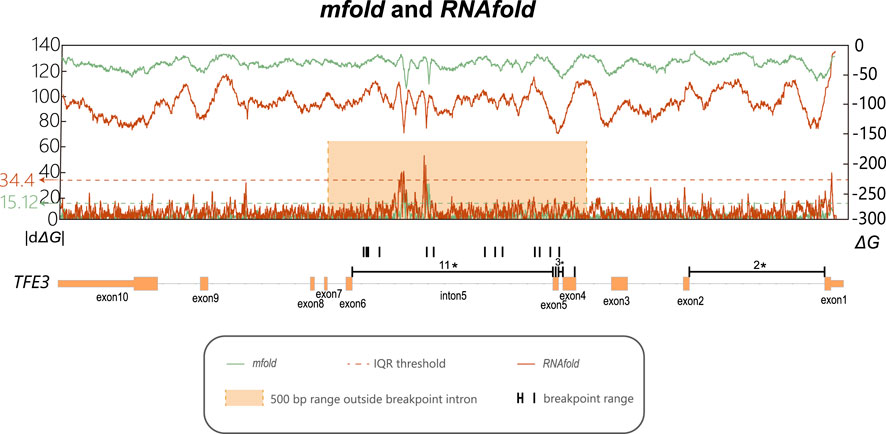
Figure 3. Line charts of ΔG and its rate of change within the TFE3 gene. The x-axis indicates the genomic coordinates of the TFE3 gene, along with the actual breakpoint location in each intron and exon, for or those without precise detection, the annotations indicate approximate locations. The orange box is the range after extending the regions with significant breakpoint enrichment outward by 500bp. The dashed line represents the threshold for peak detection calculated using the IQR method. Values above the blue line represent the |dΔG| peaks, by defining values above Q3 + 3 * IQR as peaks. The upper line represents ΔG (secondary y-axis on the right), calculated using Mfold and RNAfold with a sliding window of 300bp and a step size of 1 bp. The lower line represents the rate of change in ΔG, calculated at various positions within the TFE3 gene as the absolute difference in ΔG values across a fixed 30 bp window (|dΔG|), shown on the primary y-axis on the left. The green line: calculated by Mfold; The red line calculated by RNAfold.
To validate that the pronounced ΔG fluctuation in intron 5 was not an algorithmic artifact, the analysis was replicated using the RNAfold tool. These analyses corroborated our initial findings (Figure 3 orange line). Using the IQR method to identify peaks, defining extended 500 bp outward of intron 5 near the breakpoint. Although the absolute ΔG values varied slightly between the methods, all computational approaches consistently identified intron 5 as the region with the maximal |dΔG| peak.
3.5 Permutation testing reveals a specific association between breakpoint locations and thermodynamic instability fluctuation
All TFE3 fusion genes retain exons 7 to 10; therefore, our analysis focuses only on the genes upstream of exon 7. To formally test the hypothesis that breakpoint hotspots are associated with specific genomic features, we used a permutation-based statistical framework. This approach allowed us to assess whether the observed co-localization of breakpoints with high |dΔG| peaks, or with G-quadruplex and palindromic motifs, was statistically significant or merely due to chance.
The permutation test for the peak thermodynamic stability fluctuation (max |dΔG|) yielded a highly significant result. The observed test statistic (T_obs), which quantifies the weighted sum of |dΔG| values at breakpoint locations, was found to be in the extreme tail of the empirical null distribution generated from 10,000 permutations (P = 0.0002; Figure 4A). This provides robust evidence that breakpoints in TFE3 are non-randomly drawn to areas with the greatest local changes in DNA secondary structure stability.
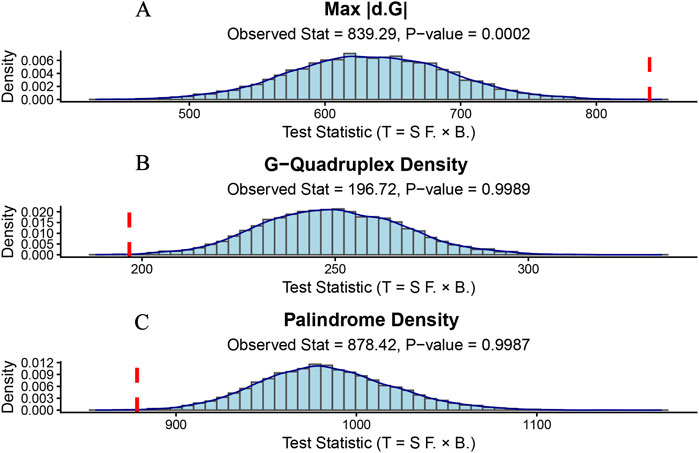
Figure 4. Permutation test for the association between breakpoint locations and genomic features. Histograms show the empirical null distribution of the test statistic (T_perm) from 10,000 permutations for (A) max |dΔG|, (B) G-quadruplex density, and (C) palindrome density. The observed test statistic (T_obs) is indicated by a red vertical line. (A) The observed association between breakpoints and max |dΔG| is significantly greater than expected by chance (P = 0.0002). (B,C) The observed associations for G-quadruplex and palindrome counts are not statistically significant (P = 0.9989 and P = 0.9987, respectively), indicating the correlation is weaker than expected under a random distribution.
In contrast, when we applied the same permutation test to the quantity of non-canonical DNA structure motifs, we found no evidence of a positive association. The analyses for G-quadruplex density (P = 0.9989; Figure 4B) and palindromic structure density (P = 0.9987; Figure 4C) yielded P-values approaching 1.0, indicating that the observed association between breakpoints and these motif counts was even weaker than what would be expected under a random distribution (Table 4).
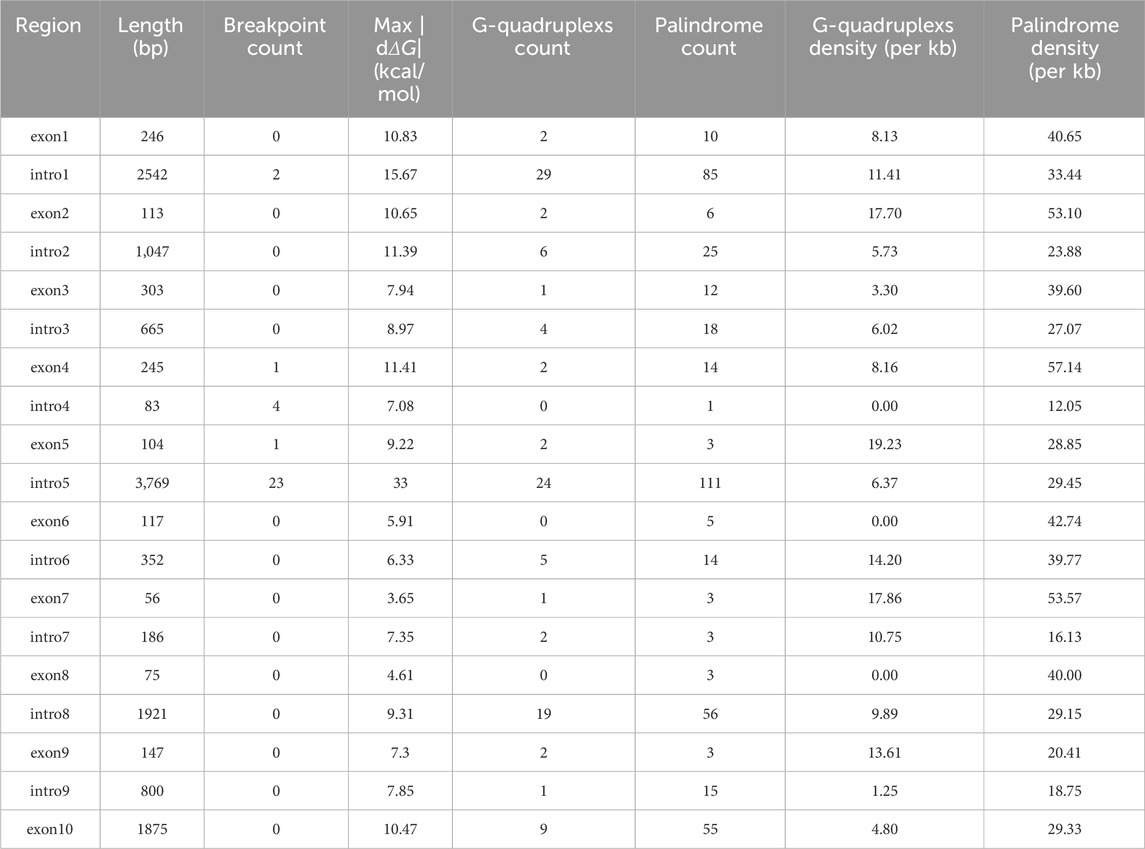
Table 4. Table of G-quadruple density, palindrome density, and maximum rate of change in ΔG for each intron and exon of TFE3.
Taken together, these rigorous statistical tests confirm our primary hypothesis: the breakpoint hotspot in TFE3 intron 5 is significantly associated with a biophysical property—high thermodynamic stability fluctuation—rather than a simple enrichment of G-quadruplex or palindromic sequence motifs.
This finding prompted us to validate this principle in a larger set of cancer-associated genes from the COSMIC database.
3.6 Validation using the COSMIC database
To validate these instability profiles, we correlated them with COSMIC-annotated breakpoint locations (Figure 5). This analysis revealed that for twelve of the thirteen genes investigated (ABL1, ALK, CCDC6, ETV6, KIF5B, NCOA4, PBX1, RET, RUNX1, TCF3, FOXO1, and NTRK3), prominent |dΔG| peaks coincided with regions enriched with breakpoints. In contrast, EWSR1, the sole exception, did not exhibit a distinct |dΔG| peak within its breakpoint-enriched region. This latter observation is consistent with the understanding that breakpoint formation is a multifactorial process, influenced by various factors beyond thermodynamic stability fluctuation.
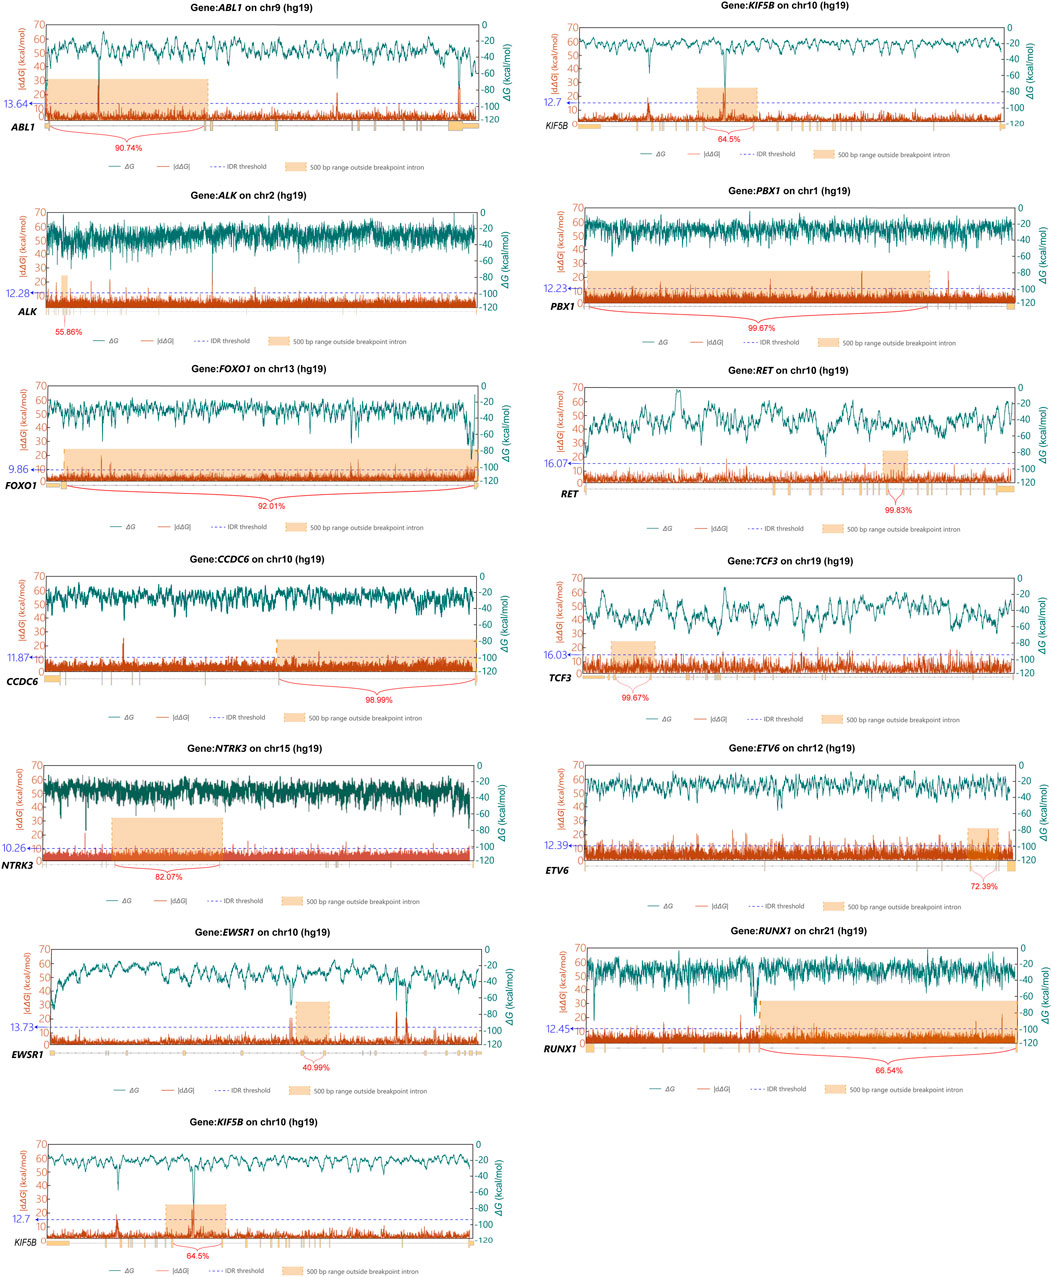
Figure 5. Line charts of ΔG and its rate of change within the twlve genes in the COSMIC database. The x-axis indicates the genomic coordinates of the twlve genes, along with introns enriched with breakpoints and the percentage of their breakpoint sites. The orange box is the range after extending the regions with significant breakpoint enrichment outward by 500bp. Values above the blue line represent the |dΔG| peaks, by defining values above Q3 + 3 * IQR as peaks. The green line represents ΔG, shown on the secondary y-axis on the right, calculated using Mfold with a sliding window of 300bp and a step size of 1 bp. The red line represents the rate of change in ΔG, calculated at various positions within the twlve genes as the absolute difference in ΔG values across a fixed 30 bp window (|dΔG|), shown on the primary y-axis on the left.
4 Discussion
Genomic instability, characterized by an increased rate of mutations and chromosomal rearrangements, is a hallmark of many pathological disorders. However, it also plays a vital role in driving evolution. The propensity for such rearrangements is influenced by two opposing sets of factors. The first category comprises factors that promote genomic stability, such as the replication machinery, DNA repair systems, and S-phase checkpoint regulators. The second comprises factors that predispose the genome to instability, including endogenous sources such as fragile sites and regions of highly transcribed DNA sequences.
In TFE3-rearranged renal cell carcinoma (TFE3-rRCC), chromosomal breakage occurs consistently at the TFE3 gene locus. Fragile sites are inherently vulnerable to chromosomal breakage, and previous studies have mapped TFE3 to the fragile site FRAXG. To more precisely map the breakpoints, we sequenced the TFE3 gene in a cohort of 31 patients diagnosed with TFE3-rRCC. Our analysis revealed that in 23 patients (74.19%), the breakpoints clustered within intron 5 of TFE3. This finding establishes that TFE3 intron 5 is a specific breakpoint hotspot in TFE3-rRCC.
Crucially, this observed clustering is not a statistical artifact. A chi-square analysis statistically confirmed that the predisposition of intron 5 to breakage is an intrinsic feature of this region, rather than a consequence of its large genomic size. This robust statistical evidence allowed us to reject the null hypothesis of random breakage, implicating specific underlying biological mechanisms. Furthermore, we explored other potential sequence-based factors, such as GC content, which has been previously linked to genomic instability. Our analysis revealed that the GC content of intron 5 was moderate and unexceptional compared to other introns within the TFE3 gene. This finding suggests that simple base composition is unlikely to be the primary driver of the observed fragility, prompting a search for more complex structural determinants.
Aphidicolin (APH)-induced common fragile sites are known to contain a higher density of sequences with the potential to form secondary structures compared to non-fragile regions of the genome (Dillon et al., 2013). To investigate this possibility, we first predicted the distribution of G-quadruplex and palindromic motifs. To formally test the association, we employed a rigorous permutation test. This analysis confirmed the lack of a statistically significant positive association between breakpoint locations and the quantity of either G-quadruplexes (P = 0.9989) or palindromic sequences (P = 0.9987). This lack of a strong correlation does not definitively rule out their involvement. The algorithmic prediction of these structures is inherently dependent on specific sequence patterns and scoring thresholds. Therefore, it is plausible that non-canonical or transient structures, not detected by these algorithms, still contribute to instability in this region (Verma and Das, 2018).
This led us to hypothesize that biophysical properties, rather than simple sequence motifs, could be the driving factor. We modeled DNA secondary structure thermodynamic stability across the gene and quantified its local fluctuation as |dΔG|. This analysis revealed a dramatic |dΔG| peak precisely within the intron 5 breakpoint hotspot (Figure 3). To validate whether this striking visual co-localization was statistically meaningful, we utilized our permutation testing framework. The test revealed a highly significant spatial correlation between breakpoint locations and the peaks of thermodynamic stability fluctuation (P = 0.0002). This robust statistical validation supports our central conclusion: the fragility of intron 5 is intrinsically linked to its landscape of thermodynamic stability flutuation, where rapid transitions between structurally stable and unstable states occur.
Using the same approach to analyze oncogenic fusion genes from the COSMIC somatic gene rearrangement database, we found that the consistent co-localization of breakpoints with regions of high thermodynamic stability fluctuation across a diverse set of well-established cancer genes provides powerful, independent support for our central hypothesis. This analysis demonstrates that the principle linking a high thermodynamic stability fluctuation to genomic fragility is not an isolated finding specific to TFE3. Instead, it appears to be a broader phenomenon contributing to non-random breakpoint formation in oncogenesis. This finding serves as a biological validation of the thermodynamic model developed previously, suggesting that fluctuations in the energy landscape of DNA secondary structures are a key influencing factor of genomic instability and a predisposing factor for chromosomal translocations.
The primary strengths of this study are threefold. First, we identified that TFE3 breakpoints in TFE3-rRCC are predominantly concentrated in intron 5, pinpointing a specific hotspot for this rearrangement. Second, whereas previous thermodynamic analyses of fragile sites were typically conducted at the gene level or larger genomic scales, our study provides a high-resolution analysis at the intron/exon level. Third, our findings provide strong support for an energy-based mechanism, linked to thermodynamic stability fluctuation in DNA secondary structure, as a plausible biophysical feature contributing to the propensity for breakage at this fragile site.
This study also has several limitations. First, our reliance on bioinformatics tools means our findings are inherently predictive. Consequently, the identification of G-quadruplexes, palindromic sequences, and stable secondary structures is subject to potential false positives and negatives, and experimental validation remains technically challenging. Second, the use of data from the COSMIC database, which aggregates studies with variable breakpoint resolution and sampling depth, may introduce ascertainment bias. Third, DNA fragility is a multifactorial process influenced by mechanisms beyond stable non-B DNA structures, including replication origin density, R-loop formation, replication timing, and S-phase checkpoint regulation. Our study did not explore the interplay between these factors and our thermodynamic model. Future work should aim to integrate our model with experimental data from DRIP-seq, repli-seq, and other relevant assays to enable a more comprehensive investigation. Moreover, our findings remain correlative, and the precise mechanisms by which ΔG fluctuations might lead to DNA breakage require experimental validation. Future studies using functional genomics assays, such as for revealing DNA secondary structures (e.g., S1-END-seq) or R-loops (e.g., DRIP-seq) in cells under replicative stress, are needed to confirm the formation of these structures in vivo and causally link them to the breakage events that initiate oncogenic translocations (Matos-Rodrigues et al., 2022; Sanz and Chédin, 2019).
Data availability statement
The original contributions presented in the study are included in the article/Supplementary Material, further inquiries can be directed to the corresponding author.
Author contributions
XZ: Writing – original draft. QD: Writing – original draft. XP: Writing – original draft. ZD: Writing – review and editing. YX: Writing – review and editing. WG: Writing – review and editing. HG: Writing – review and editing.
Funding
The authors declare that financial support was received for the research and/or publication of this article. This work was supported by the Medical Research Project of Jiangsu Commission of Health, grant number [ZD2022013].
Acknowledgements
I would like to express my heartfelt gratitude to all those who supported me, who made it possible for me to come this far.
Conflict of interest
The authors declare that the research was conducted in the absence of any commercial or financial relationships that could be construed as a potential conflict of interest.
Generative AI statement
The authors declare that no Generative AI was used in the creation of this manuscript.
Any alternative text (alt text) provided alongside figures in this article has been generated by Frontiers with the support of artificial intelligence and reasonable efforts have been made to ensure accuracy, including review by the authors wherever possible. If you identify any issues, please contact us.
Publisher’s note
All claims expressed in this article are solely those of the authors and do not necessarily represent those of their affiliated organizations, or those of the publisher, the editors and the reviewers. Any product that may be evaluated in this article, or claim that may be made by its manufacturer, is not guaranteed or endorsed by the publisher.
Supplementary material
The Supplementary Material for this article can be found online at: https://www.frontiersin.org/articles/10.3389/fgene.2025.1694739/full#supplementary-material
Abbreviations
TFE3, Transcription Factor Binding to IGHM Enhancer 3; TFE3-rRCC, Transcription Factor Binding to IGHM Enhancer 3 rearranged renal cell carcinoma; ΔG, Gibbs free energy change; IQR, Interquartile Range.
References
Anderson, S., and DePamphilis, M. L. (1979). Metabolism of okazaki fragments during simian virus 40 DNA replication. J. Biol. Chem. 254 (22), 11495–11504. doi:10.1016/s0021-9258(19)86512-2
Bezzi, G., Piga, E. J., Binolfi, A., and Armas, P. (2021). CNBP binds and unfolds in vitro G-Quadruplexes formed in the SARS-CoV-2 positive and negative genome strands. Int. J. Mol. Sci. 22 (5), 2614. doi:10.3390/ijms22052614
Chen, S. F., Zhou, Y. Q., Chen, Y. R., and Gu, J. (2018). Fastp: an ultra-fast all-in-one FASTQ preprocessor. Bioinformatics 34 (17), 884–890. doi:10.1093/bioinformatics/bty560
Dillon, L. W., Pierce, L. C. T., Ng, M. C. Y., and Wang, Y. H. (2013). Role of DNA secondary structures in fragile site breakage along human chromosome 10. Hum. Mol. Genet. 22 (7), 1443–1456. doi:10.1093/hmg/dds561
Duardo, R. C., Guerra, F., Pepe, S., and Capranico, G. (2023). Non-B DNA structures as a booster of genome instability. Biochimie 214, 176–192. doi:10.1016/j.biochi.2023.07.002
Haas, B. J., Dobin, A., Stransky, N., Li, B., Yang, X., Tickle, T., et al. (2017). STAR-Fusion: fast and accurate fusion transcript detection from RNA-seq. bioRxiv preprint.120295
Hay, R. T., and DePamphilis, M. L. (1982). Initiation of SV40 DNA replication in vivo: location and structure of 5' ends of DNA synthesized in the ori region. Cell 28 (4), 767–779. doi:10.1016/0092-8674(82)90056-3
Lerner, L. K., and Sale, J. E. (2019). Replication of G quadruplex DNA. Genes 10 (2), 95. doi:10.3390/genes10020095
Lu, S., Wang, G. L., Bacolla, A., Zhao, J. H., Spitser, S., and Vasquez, K. M. (2015). Short inverted repeats are hotspots for genetic instability: relevance to cancer genomes. Cell Rep. 10 (10), 1674–1680. doi:10.1016/j.celrep.2015.02.039
Matos-Rodrigues, G., van Wietmarschen, N., Wu, W., Tripathi, V., Koussa, N. C., Pavani, R., et al. (2022). S1-END-seq reveals DNA secondary structures in human cells. Mol. Cell 82 (19), 3538–3552.e5. doi:10.1016/j.molcel.2022.08.007
Mirceta, M., Shum, N., Schmidt, M. H. M., and Pearson, C. E. (2022). Fragile sites, chromosomal lesions, tandem repeats, and disease. Front. Genet. 13, 985975. doi:10.3389/fgene.2022.985975
Mrasek, K., Schoder, C., Teichmann, A. C., Behr, K., Franze, B., Wilhelm, K., et al. (2010). Global screening and extended nomenclature for 230 aphidicolin-inducible fragile sites, including 61 yet unreported ones. Int. J. Oncol. 36 (4), 929–940. doi:10.3892/ijo_00000572
Newman, A. M., Bratman, S. V., Stehr, H., Lee, L. J., Liu, C. L., Diehn, M., et al. (2014). FACTERA: a practical method for the discovery of genomic rearrangements at breakpoint resolution. Bioinformatics 30 (23), 3390–3393. doi:10.1093/bioinformatics/btu549
Nie, Y. X., Zhang, Y. H., and Wu, J. (2023). The secondary structure of potato spindle tuber viroid determines its infectivity in Nicotiana benthamiana. Viruses-Basel 15(12), 2307, doi:10.3390/v15122307
Obara, P., Wolski, P., and Panczyk, T. (2024). Insights into the molecular structure, stability, and biological significance of non-canonical DNA forms, with a focus on G-Quadruplexes and i-Motifs. Molecules 29 (19), 4683. doi:10.3390/molecules29194683
Pei, J., Cooper, H., Flieder, D. B., Talarchek, J. N., Al-Saleem, T., Uzzo, R. G., et al. (2019). NEAT1-TFE3 and KAT6A-TFE3 renal cell carcinomas, new members of MiT family translocation renal cell carcinoma. Mod. Pathol. 32 (5), 710–716. doi:10.1038/s41379-018-0191-7
Pinto, K., and Chetty, R. (2020). Gene of the month: TFE 3. J. Clin. Pathol. 73 (11), 691–694. doi:10.1136/jclinpath-2020-206899
Sanz, L. A., and Chédin, F. (2019). High-resolution, strand-specific R-loop mapping via S9.6-based DNA-RNA immunoprecipitation and high-throughput sequencing. Nat. Protoc. 14 (6), 1734–1755. doi:10.1038/s41596-019-0159-1
Sinai, M. I. T., Salamon, A., Stanleigh, N., Goldberg, T., Weiss, A., Wang, Y. H., et al. (2019). AT-dinucleotide rich sequences drive fragile site formation. Nucleic Acids Res. 47 (18), 9685–9695. doi:10.1093/nar/gkz689
Takahashi, S., Tateishi-Karimata, H., and Sugimoto, N. (2022). Stability prediction of canonical and noncanonical structures of nucleic acids. In: N. Sugimoto, editor. Handbook of chemical biology of nucleic acids. Singapore: Springer Nature Singapore. p. 1–44.
Tang, J. L., and Baba, M. (2023). MiT/TFE family renal cell carcinoma. Genes 14 (1), 151. doi:10.3390/genes14010151
Verma, S. P., and Das, P. (2018). G-quadruplex structure at intron 2 of TFE3 and its role in Xp11.2 translocation and splicing. Biochim. Biophys. Acta-Gen Subj. 1862 (3), 630–636. doi:10.1016/j.bbagen.2017.11.011
Wang, G., and Vasquez, K. M. (2023). Dynamic alternative DNA structures in biology and disease. Nat. Rev. Genet. 24 (4), 211–234. doi:10.1038/s41576-022-00539-9
Keywords: TFE3-rearranged renal cell carcinoma, chromosome breakpoint, non-canonical DNA structure, gibbs free energy, genome instability
Citation: Zhang X, Dang Q, Pan X, Deng Z, Xu Y, Gan W and Guo H (2025) Mechanistic study of TFE3 breakage in TFE3-rearranged renal cell carcinoma: the perspective of non-canonical DNA structures and their stability. Front. Genet. 16:1694739. doi: 10.3389/fgene.2025.1694739
Received: 28 August 2025; Accepted: 13 November 2025;
Published: 25 November 2025.
Edited by:
Zhaokai Zhou, Central South University, ChinaReviewed by:
Essak Khan, AlsterrLab, GermanyYinde Huang, Chongqing General Hospital, China
Danial Hashemi Karoii, University of Tehran, Iran
Copyright © 2025 Zhang, Dang, Pan, Deng, Xu, Gan and Guo. This is an open-access article distributed under the terms of the Creative Commons Attribution License (CC BY). The use, distribution or reproduction in other forums is permitted, provided the original author(s) and the copyright owner(s) are credited and that the original publication in this journal is cited, in accordance with accepted academic practice. No use, distribution or reproduction is permitted which does not comply with these terms.
*Correspondence: Weidong Gan, Z3dkQG5qdS5lZHUuY24=