 Madison X. Betts1
 Gokce K. Ustunisik
 Roger L. Nielsen
- 1Department of Geology and Geological Engineering, South Dakota Mines, Rapid City, SD, United States
- 2Department of Earth and Planetary Sciences, American Museum of Natural History, New York, NY, United States
Quantitative modeling is a powerful tool that allows us to develop an understanding of identity and extent of igneous processes on Earth and other planetary bodies. Such models are built upon data from experiments that describe the major and trace element behavior among the phases in a system of interest. Previous work on the analysis of calibration datasets has been done for many of the mafic rock forming minerals such as plagioclase, clinopyroxene, amphibole, olivine, and garnet. What is missing is an evaluation of the sources of uncertainty in the trace element orthopyroxene/melt partitioning experiments. The goal of this investigation is to document the identity and magnitude of a number of sources of uncertainty that were observed in the experimental database for low-Ca pyroxene/melt trace element partitioning. These include multiphase analyses (e.g., mineral and glass analysis in the same analytical volume) as well as uncertainty with regards to the specific structural state of the low-Ca pyroxene in the experiments (e.g., is the mineral reported orthopyroxene or pigeonite?). Our findings confirm earlier work documenting the dependence of the orthopyroxene/melt partition coefficients for the high field strength and rare earth elements on the Ca content of pyroxene. However, the development of predictive expressions for trace element partitioning between orthopyroxene and melt is compromised by a number of database characteristics related to commonly applied analytical methods and phase determinations. Specifically, the average composition of the experimental orthopyroxene and liquids overlap, but is different for each element (e.g., the average composition of all experiments where Sm was determined is different but overlap with those where Zr was determined). Second, the reported analytical uncertainty is significantly higher for experiments where the trace element determinations were done by laser inductively coupled plasma mass spectroscopy compared to secondary ion mass spectroscopy - an observation attributable to the differences in analytical volume between two analytical techniques. Lastly, most experimental studies did not determine the specific low-Ca pyroxene present but rather used the calcium content alone to identify orthopyroxene vs. pigeonite which we showed as unreliable. Taken together, these database characteristics impact any regression analysis and result in an internal bias in the predicted behavior of trace elements. Our ability to “fix” the database is inhibited by the current convention of publishing experimental partitioning data as averages and not publishing individual analyses - making essentially impossible to quantitatively understand the magnitude and sources of error.
1 Introduction
Experimental investigation of the partitioning of trace elements between minerals and melt is motivated by the need to develop quantitative models of igneous processes that drive the evolution of the mantle and crust. The predictive accuracy of such models is dependent on the theoretical framework of partitioning models and the characteristics of the experimental database used to calibrate those models. Modeling the impact of specific petrogenetic processes requires the development of predictive expressions that allow the calculation of partition coefficients (mineral-meltDi), the ratio of the concentration of a trace element in the mineral and the melt from which the mineral formed.
The experimental datasets used to calibrate both major and trace element models include experimental conditions, such as pressure (P), temperature (T), oxygen fugacity (fO2), and the composition (X) of the experimental products. It is important to note that experiments on phase equilibria have significantly different goals and priorities than experiments designed to constrain the partitioning behavior of trace elements (Nielsen et al., 2017). Phase equilibria experiments are generally designed to constrain what phases are present at any set of conditions and for compositions that are relevant to the systems of interest. Phase equilibria experimental results typically include analyzes using one analytical technique and prioritize parameters such as phase proportions. While the overlap of analyses is an issue, it is not a source of systematic bias. The experimental design for trace element partitioning experiments also includes the major element composition of the phases and the phase proportions. However, focus of trace element partitioning experiments is often one mineral phase at a time, often require the analysis by multiple analytical methods, and majority experiments are not analyzed for all trace elements. This is due to the different focus of the studies. For example, only the rare earth elements (REE) may be analyzed if focus of the research is in understanding the role of atomic radius on partitioning for a given charge or only multivalent (e.g., V, Sc, Ti) elements may be analyzed if the focus is on role of oxygen fugacity (fO2) in partitioning of a multivalent element to a specific sites in the crystal structure. Another reason for not analysis of all trace elements is the low detection limits of certain specific trace element and the extent to which the starting material is doped with respect to the elements of interest (Nielsen et al., 2017; Cung et al., 2023). Due to these reasons, the result is that the number of experiments that report the trace element composition for a specific element in a specific phase can vary widely for each mineral and among different minerals. This means that the calibration dataset is different and heterogenous for each element in each phase. Since most predictive models for trace element behavior involve regression analysis of the data, heterogeneity in the calibration datasets will result in different regression parameters. The accuracy of those models is therefore subject to differences in analytical error as well as differences in the compositional dependence of the predictive model. It is important to note here that the major sources of uncertainty in partitioning experiments include heterogeneity of the phases in the experiment (nominally due to failure to achieve equilibrium), analytical sensitivity (count rate, background, detector sensitivity) and the analysis of multiple phases in each phase (e.g., contamination of mineral analyses with glass). The first source of uncertainty is a physical and chemical characteristic of the experimental charge and cannot be corrected. The sensitivity of the analytical instrument may be improved with new technology or adjustments in methodology. Analyses contaminated with glass is an analytical artifact, which can be corrected if we know the characteristics of the contamination.
Recognition of the existence of ultradepleted domains in the mantle (Bizimis et al., 2005; Simon et al., 2008; Salters et al., 2011; Neave et al., 2014; Jackson et al., 2015; Stracke et al., 2019; Liu et al., 2025; Daynes et al., 2025; Stracke and Salters, 2025) has raised the profile of orthopyroxene/melt trace element partitioning experiments. Such domains exhibit evidence of high degrees of partial melting, past the point of exhaustion of clinopyroxene in the mantle protolith. In such cases the trace element budget is controlled by orthopyroxene especially at pressures below the stability of garnet. Therefore, knowledge of the details of orthopyroxene/melt partitioning is required to quantitively describe the impact of compositional changes associated with high degree melts and how those changes can be correlated to the composition. This is of particular importance for elements characterized by low partition coefficients and models that use incompatible trace element ratios (Hofmann and Class, 2025) to describe the magmas present in environments where orthopyroxene is stable.
Our objective in this research is to analyze the characteristics of the existing orthopyroxene/melt trace element partitioning experiments in traceDs database1 to evaluate the accuracy, precision, and distribution of the dataset with respect to temperature, pressure, and composition. The analysis includes: (1) identifying the boundary conditions of the orthopyroxene/melt partitioning dataset covered for each element including average and standard deviation of the experimental conditions (e.g., P, T, X, number of experiments); (2) evaluating the analytical uncertainty based on counting statistics; (3) document the analytical uncertainty derived from melt contamination as a result of the spatial resolution of the analytical tools (e.g., Laser Inductively Coupled Plasma Mass Spectroscopy - LA ICP-MS vs. Secondary Ion Mass Spectroscopy - SIMS) that are used for measuring concentration of trace elements in existing phases; and (4) addressing issues arising from uncertainty related to the identification of the specific low-Ca pyroxene (e.g., enstatite, pigeonite, clinoenstatite) present in the phase assemblages.
The inclusion of multiphase analyses (e.g., cases where two or more phases were present in the analytical volume) has been documented in other recent investigations on plagioclase, clinopyroxene, amphibole and garnet (Cung et al., 2023; Nielsen et al., 2017). These studies documented why overlap/contamination of analytical volumes, particularly with glass, that can result in systematic error and bias in the predictive models as well as the impact of this bias for compatible vs. incompatible elements. Further, contaminated analyses represent a particular challenge due to the tradition of publishing only averages from the experimental analyses. Without access to the individual mineral-melt pair analyses, one may identify possible cases where more than one phase was present in the analytical volume, but one cannot make corrections (see example in Nielsen et al., 2017). Our goal here is to identify the existence of sources of systematic bias in the orthopyroxene/melt partitioning database and make a series of recommendations on how we design and report on future experiments.
2 Low-Ca pyroxene structure
This investigation focuses on the evaluation of published experimental data on trace element partitioning between low-Ca pyroxene and melt with a particular focus on orthopyroxene. The mechanism by which trace elements substitute in a mineral, is controlled by the size of the ion, its valence, and the type of charge balance required by the paired substitution, all of which is in turn controlled by the P-T-X of the system (Irving, 1978; Green, 1994; Blundy and Wood, 2003). Orthopyroxene is a low-Ca pyroxene with an orthorhombic crystal structure. Pigeonite, another low-Ca pyroxene, can overlap in chemical composition with orthopyroxene but has a monoclinic crystal structure. Therefore, it becomes important to understand how the differences in the various crystal structures of low-Ca pyroxene can contribute to the behavior of trace elements.
Pyroxenes are single chain inosilicates with the general formula of XYZ2O6. The single chain structure contains alternating tetrahedral and octahedral layers that extend parallel to the c-axis. The tetrahedral site, represented by ‘Z’ is usually occupied by Si4+ and Al3+. Both the M1 (Y) and M2 (X) octahedral sites have 6-fold coordination and are occupied by Mn2+, Fe2+, Mg2+, Al3+, Cr3+, or Ti4+. Only limited amounts of larger cations, such as Ca2+, can fit into the M2 site without changing the structure. Trace elements are more likely to substitute into the slightly larger M2 site but can also be present in paired substitution with Al3+ (Bédard, 2007; 2025). Therefore, the activity of alumina in the melt (which is a function of alkalinity) and availability/suitability of cation sites in the orthopyroxene and charge balancing/pairing become equally important factors if one needs to understand the controls on the partitioning behavior of high field strength elements (HFSE) or REE between melt and orthopyroxene.
Orthopyroxene is a part of the primitive centrosymmetric space group with only screw axes and glide planes (Pbca space group). To specify orthorhombic Pbca in enstatite (Mg2Si2O6) and ferrosilite (Fe2Si2O6), these minerals are referred to as orthoenstatite and orthoferrosilite, respectively. Enstatite can also have an orthorhombic Pbcn crystal structure (protopyroxene) at temperatures higher than 1,000 °C. Protopyroxene differs from orthopyroxene in that the M1 and M2 sites of Pbcn (as well as C2/c) space groups are on locations in the crystal lattice with 2-fold rotational symmetry rather than in general positions (Lindsley, 1980). Enstatite and ferrosilite can be monoclinic P21/c under high pressure conditions (clinoenstatite and clinoferrosilite, respectively). The Pbca space group is the most common form for orthorhombic pyroxenes, and magnesium-iron pyroxenes with less than 5% Wo content are generally referred to as “orthopyroxene” in the literature. For the purposes of this paper, we will refer to all of the pyroxenes that are reported as “orthopyroxene” in the database to be so, with the caveat that in most cases there were no determinations of the structure of the experimentally produced low-Ca pyroxene in the charges.
Pigeonite is a monoclinic low-Ca pyroxene that is stable in systems with lower Mg# and at pressures below 2 GPa (Huebner, 1980). Pigeonite has a number of similar characteristics as orthopyroxene, including tetrahedrally coordinated Si4+ and Al3+, and its M1 and M2 sites have 6-fold coordination. However, the M2 site is more often occupied by larger cations such as Ca2+. With increasing temperature, pigeonite will undergo a structural shift that transitions its M2 site from 6-fold to distorted 8-fold coordination and have a similar structure to diopside (P21/c-C2/c structural transition). This shift will revert under slow cooling conditions, resulting in orthopyroxene with exsolution lamellae of augite (e.g., inverted pigeonite - Lindsley, 1980).
The phase boundaries for low-Ca pyroxenes are complex, with phase stability regions that are narrow and overlap in composition (Figure 1; Huebner, 1980). The phase boundaries for the simple binary system of Mg2Si2O6 - CaMgSi2O6, at low pressures (1 atm) indicate that the CaO content of low-Ca pyroxene is largely temperature dependent, but pyroxene with different structures can still have the same CaO content (Figure 1a). For more Fe-rich systems, pigeonite becomes more stable over orthopyroxene (Figure 1b). However, we can produce orthopyroxene and pigeonite that have the same wollastonite content (mole % Wo = 100 × Ca/(Ca + Mg + Fe total)). We know that mole % Wo is sensitive to P, T, and Al2O3 content of the system and that an increase in Al2O3 stabilizes orthopyroxene over pigeonite (Huebner, 1980; Lindsley, 1980). These interdependent variables lead to uncertainty in our ability to simply rely on the experimental conditions or the chemical composition of the pyroxene, to distinguish orthopyroxene from pigeonite. In spite of the compositional overlap of orthopyroxene and pigeonite, they are rarely distinguished from one another structurally by previous studies when reporting results on pyroxene/melt partitioning.
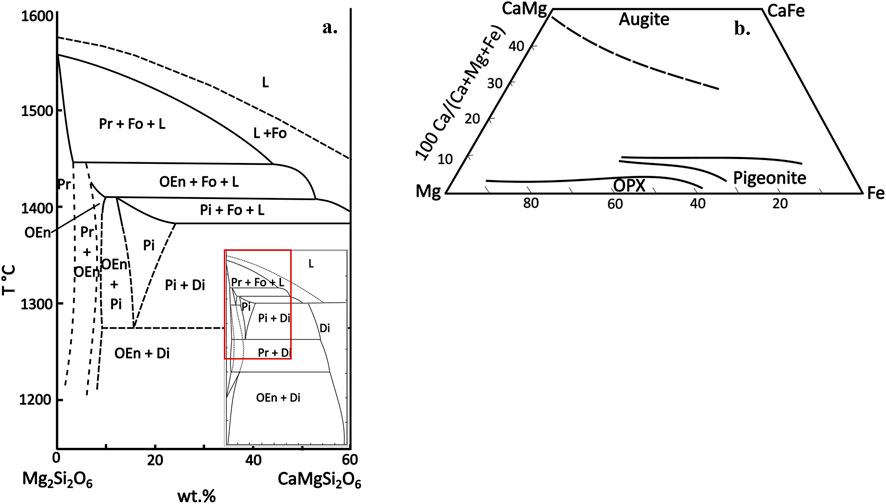
Figure 1. Pyroxene phase diagrams adapted from Huebner, 1980. (a) Temperature (°C) vs. composition (wt%) diagram for the pure Mg2Si2O6 - CaMgSi2O6 system at 1 atm. Solid lines indicate boundaries between stable phases while dashed lines are boundaries of metastable phases. “L” refers to silicate liquid, “Fo” to forsterite, ‘Pr’ to protopyroxene, “OEn” to orthoenstatite, “Pi” to pigeonite, and “Di” to diopside. Note the complexity of the stability fields in the low-Ca portion of this simplified system. In Fe-free systems, Pr and Pi will invert to OEn as the system cools. (b) Pyroxene solidus phase diagram for a system containing Ca, Mg, and Fe end members. Units represent the mole % of components. OPX refers to orthopyroxene. Based on these phase boundaries, which were originally determined based on co-precipitating pyroxenes, we can produce OPX and pigeonite with the same mole % Wo. Addition of Fe stabilizes pigeonite over orthopyroxene.
In general, the pigeonite stability field expands at lower temperature compared to orthopyroxene (Huebner, 1980). Together with the M2 sites in pigeonite being larger than in orthopyroxene, partition coefficients for the REE and HFSE tend to be higher in pigeonite (Nielsen et al., 1992). Therefore, if the partitioning data for pigeonite/melt is included in the calibration dataset of orthopyroxene/melt partitioning, the model overestimate trace element compatibility. To prevent mischaracterization of trace element behaviors in orthopyroxene, studies can distinguish orthopyroxene from pigeonite optically by checking the extinction angles (e.g., symmetrical extinction vs. inclined extinction) or by microstructural characterization using electron back-scattered diffraction (EBSD) rather than relying only on the CaO content of the pyroxene and temperature (Beattie et al., 1991; Bédard, 2007; 2025).
3 Methodology
Predictive models require calibration using experiments conducted at a range of P-T-X conditions (e.g., Nielsen et al., 1988; Bédard, 2007; 2025; Yao et al., 2012). To model any system, we need to develop expressions that describe the behavior of every element of interest in all phases in the system of interest. For example, if we wish to model the extent of mantle melting at mid-ocean ridges (MOR), we need to know the compositions and proportions of phases that are contributing to or crystallizing from the system over the P-T range being simulated. This is required for most systems due to the different degrees of dependence of trace element partitioning on P, T, X. The partition coefficients for many elements vary by orders of magnitude of the range of natural compositions and conditions. Therefore, the partition coefficients that one uses for the purposes of quantitatively modeling a magmatic system need to change in response to changes in the P-T-X and the compositions and proportions of phases.
Most trace elements used to monitor degrees of melting or fractionation at MOR are more compatible in clinopyroxene than plagioclase, orthopyroxene, spinel, or olivine (Johnson et al., 1990; Blundy and Wood, 2003; Cung et al., 2023). However, at high degrees of partial melting (>20%), the mantle becomes exhausted with respect to clinopyroxene (Johnson et al., 1990; Warren, 2016; Walter and Cottrell, 2025) after which the trace element budget will be controlled by orthopyroxene at pressures below the garnet stability. Most mineral-melt partition coefficients for orthopyroxene are higher than for olivine, plagioclase, or spinel. Therefore to model the melting of the upwelling mantle under a MOR for high degrees of partial melting (Simon et al., 2008; Neave et al., 2014; Jackson et al., 2015; Daynes et al., 2025), one needs to understand trace element behavior in orthopyroxene and determine where the orthopyroxene/pigeonite phase boundary lies in P-T-X space that is representative of the range of natural conditions and compositions. This understanding requires an investigation of the characteristics, landscape, and uncertainty of the experimental data used for calibration of predictive models for partitioning behavior prior to design and conduct new experiments. For example, the higher calcium content of pigeonite results in a monoclinic structure, with a larger, more distorted M2 site which favors large ions like light rare earth elements (LREE) when compared to the orthorombic structure of enstatite. Larger and distorted M2 site that is correlated with Wo content in pigeonite and higher partition coefficients for light rare earth elements (LREE) than enstatite which also manifests steep LREE features in spider diagrams compared to heavy rare earth elements (HREE) enriched chondrite-normalized pattern in enstatite. Ideally, evaluation of the significance of the differences between the partitioning behavior in pigeonite versus orthopyroxene could be done by comparing the existing experimental values. However, that is not possible if one does not know the actual structural identity of the pyroxenes in the charges.
Bédard (2025) developed a series of predictive models for orthopyroxene/melt partitioning which prioritized a more complete coverage of P-T-X conditions over reducing the sources of uncertainty. Their calibration dataset included all experiments where pyroxenes with <5.5 mol % Wo coexisted with silicate melt in experimental systems that ranged in bulk composition from carbonatite to rhyolite. In addition, they included data from natural phenocryst-matrix mineral-melt inclusion pairs and phase equilibria experiments where only major elements were analyzed. This choice was made to provide a simplified collection of regressions rather than accounting for changes in partitioning behaviors as a function of P-T-X (Bédard, 2025). The inclusion of phenocryst-matrix data from natural systems is problematic because there are few constraints on the pressure and temperature of formation and attainment of equilibrium is not established.
The dataset selected for this study included peer-reviewed/published trace element experimental data of orthopyroxene and coexisting melt (Table 1) and includes all the metadata, i.e., the citation of the source of the data from the literature; laboratory where experiments were performed and samples were analyzed; unique name for each experiment; run conditions of P, T, fO2, and duration; device and capsule information; major and trace element content for phases; and cited analytical uncertainty (typically 1σ on the average of multiple analyses). Further, the database includes the number of experimental determinations for each trace element in each phase (melt and orthopyroxene) (Table 2). More importantly, we only included experiments which melt compositions had <10% H2O and >35% SiO2. Our analysis excluded the data from natural phenocryst-matrix mineral-melt inclusion pairs. The full dataset used is available as Supplementary Material S1 and through the Experimental Petrology community site for traceDs under EarthChem1.
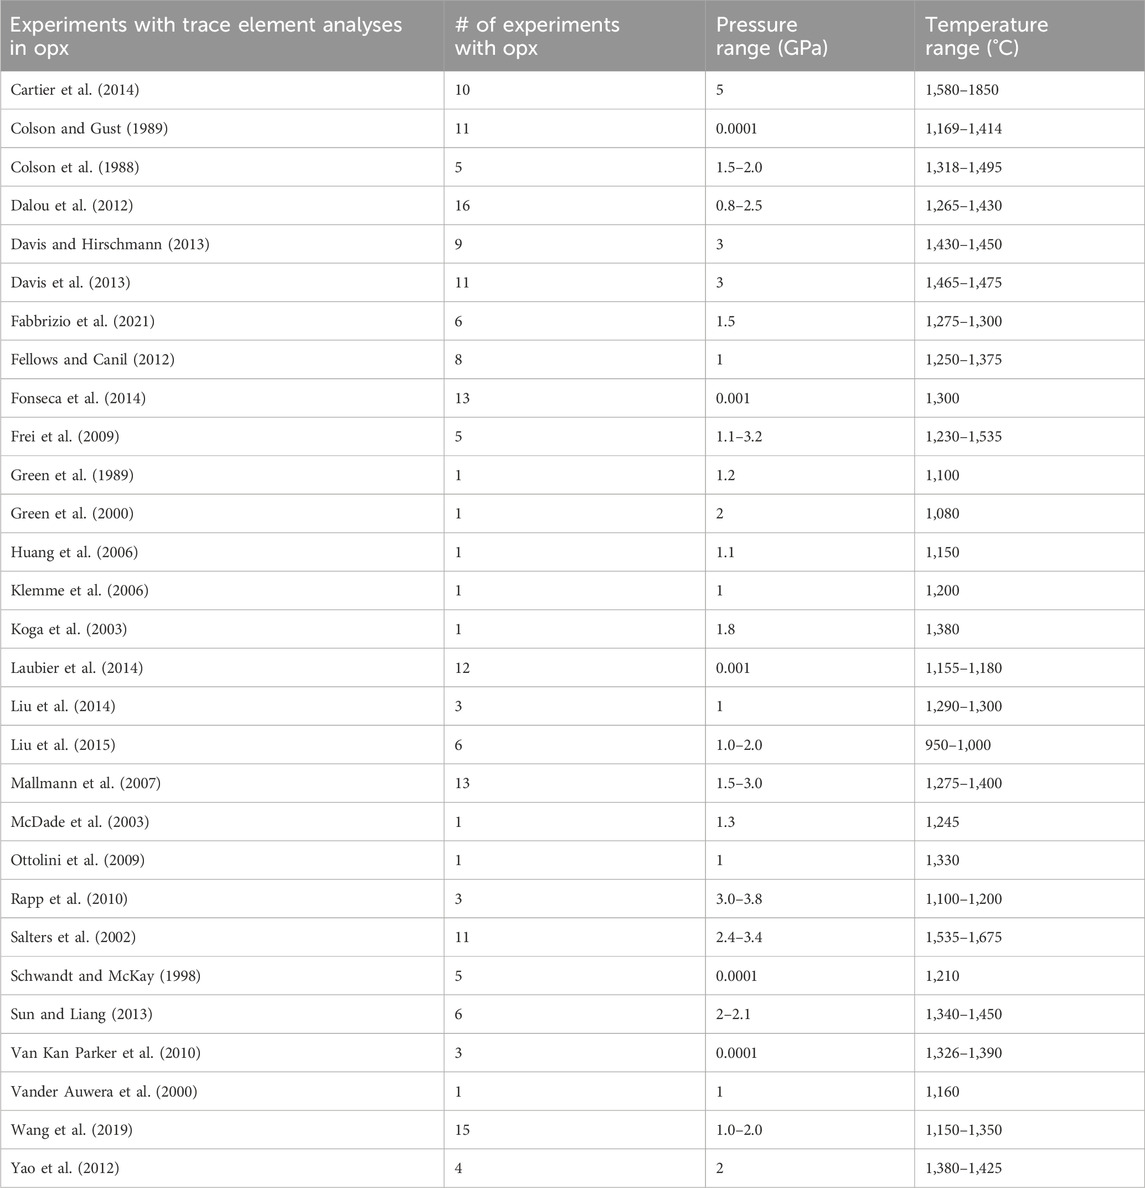
Table 1. Characteristics of the orthopyroxene trace element database.
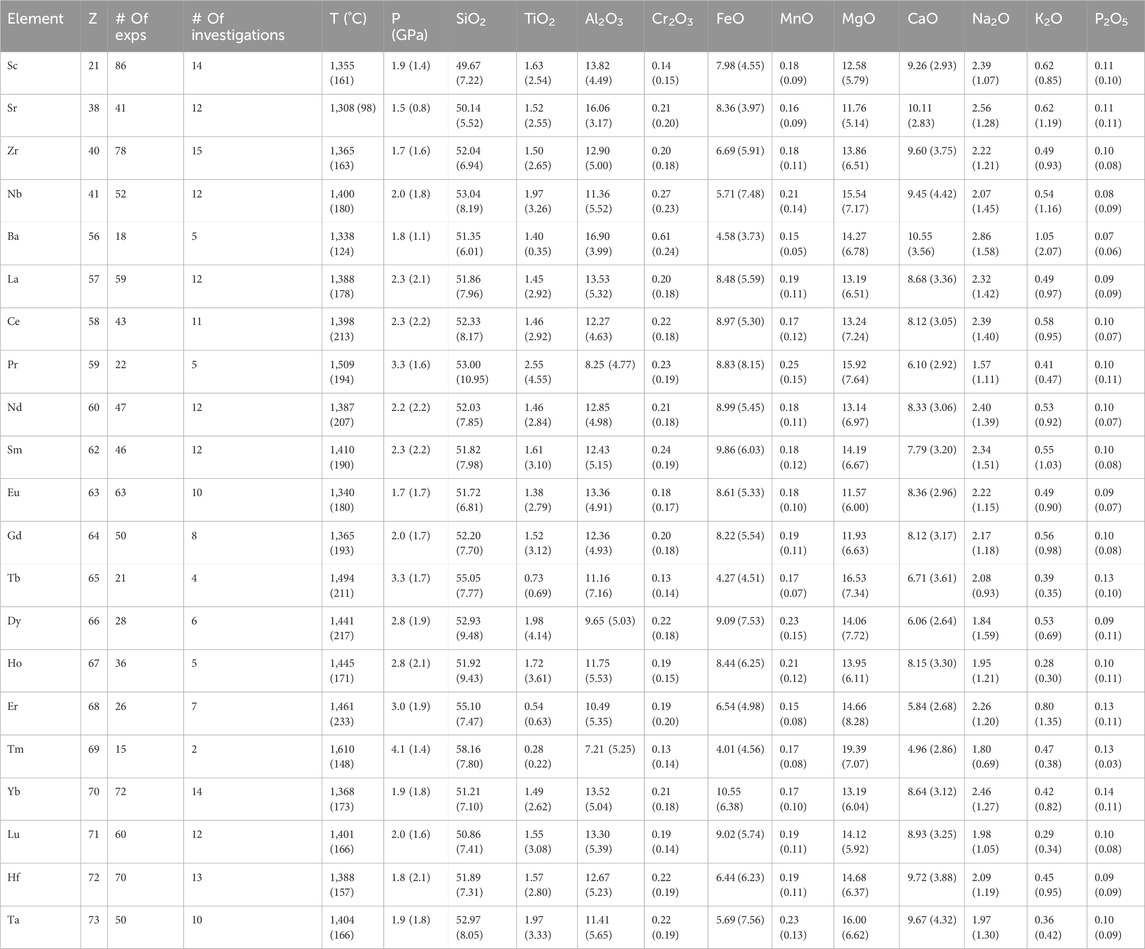
Table 2. Characteristics of the orthopyroxene trace element database containing the average temperature (T), pressure (P), and composition of experimental liquid products by trace element (e.g., the average liquid major element compositions for all experiments where a specific element was determined in both orthopyroxene and co-existing melt). Elements are listed in increasing atomic number (Z). Numbers in parentheses are 1σ standard deviations of the averages.
4 Results
4.1 Distribution of experiments as a function of pressure, temperature, and composition
We evaluated the data for calibrating predictive models by examining the range of P-T-X of the experiments in the orthopyroxene database. From range of conditions represented in the orthopyroxene database, it is clear that the characteristics of the population of experiments for each element are different (Figure 2; Table 2). For example, for Sr, the average experimental P-T conditions (Figure 2) are ∼1.5 GPa and 1,300 °C. In contrast, the average P-T conditions for experiments where Tm was determined are ∼4 GPa and 1,600 °C. The average experimental liquid composition (Figure 3, total alkali (Na2O + K2O) vs. SiO2) for experiments where a specific element was measured in both orthopyroxene and melt are also significantly different for each element (Table 2). The average total alkali and silica for experiments where Ba was measured are 3.9 and 51 wt% and the average for Tm are 2.2 and 58 wt%, respectively (Figure 3) indicating that the majority of orthopyroxene-melt partitioning experiments are conducted in basalt to basaltic andesite liquids. Further, the number of partitioning experiments for a specific trace element was measured in orthopyroxene and melt range from 15 for Tm to 86 for Sc (Table 2). In all cases, the experimental results were reported as averages of multiple analyses within an experimental charge. In no case were the individual analyses on mineral-melt pairs reported, therefore limiting our ability to determine the instances where the average included contaminated analyses.
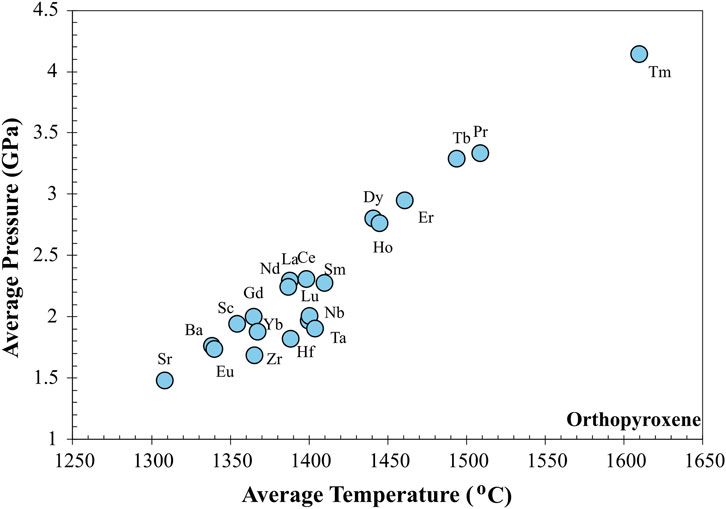
Figure 2. Average temperature (°C) vs. pressure (GPa) for mineral/melt trace element partitioning experiments where trace elements were measured in orthopyroxene and coexisting melt. Each symbol represents the average P/T condition of all experiments where that specific element was measured in both orthopyroxene and coexisting melt (traceDs database - Tables 1, 2). Note the linear distribution of pressure and temperature across the trace elements in the database.
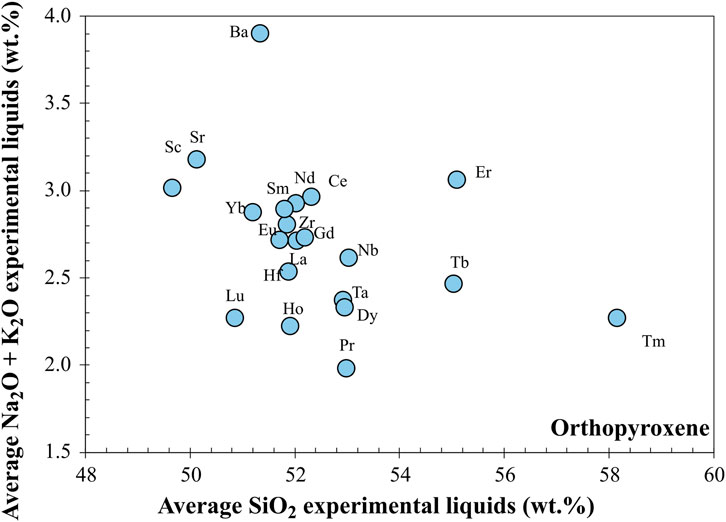
Figure 3. Average silica (wt%) vs. total alkali (wt%) content of melt from mineral/melt trace element partitioning experiments where trace elements were measured in orthopyroxene and coexisting melt. Each symbol represents the average liquid composition specific to a particular element as determined from the traceDs database. For example, the average liquid composition for all experiments where Zr was measured in orthopyroxene and co-existing melt is 52 wt% SiO2 and 2.7 wt% Na2O + K2O. These values are reported in Table 2 along with the 1sigma (σ) standard deviation on the average. The majority of the average alkali-silica liquids for trace element experiments range from basalt to basaltic andesite in composition.
4.2 Structure of the Low-Ca pyroxene in existing experiments
For most of the results present in the orthopyroxene/melt experimental database, distinction between the low-Ca pyroxene species were made using major element composition, where the wollastonite content of pyroxene vs. temperature was used to define the boundary between orthopyroxene and pigeonite (Beattie et al., 1991; Bédard, 2007) (Figure 4). The cutoff of 5.2 wt% Wo (Wo = 100 × (Ca/Ca + Mg + Fetotal) applied by Bédard (2007) includes most of the published orthopyroxene database. However, some of the low-Ca pyroxene that was petrographically identified by inclined vs. parallel extinction as pigeonite (Nielsen et al., 1992) would also be grouped with orthopyroxene if one only applies Wo% as a boundary condition. Beattie et al. (1991) calculated a boundary between pigeonite and orthopyroxene (Figure 4) based on mole fraction of CaO and temperature (XCaOPx= (1850-T(K))/12,500). This boundary excludes much of what is categorized as orthopyroxene in the experimental database and includes the majority of the pigeonite analyses from Nielsen et al. (1992) compared to the application of a single variable divide. At present, for most of the experiments reporting orthopyroxene, we do not know what the pyroxene was, nor do we know what the impact of knowing what low-Ca pyroxene is present. Given that the structural determination of the specific mineral species could be checked with EBSD when sample preparation for optical characterization is more complicated, we recommend that future experiments on low-Ca pyroxene include the structural determination of orthopyroxenes species.
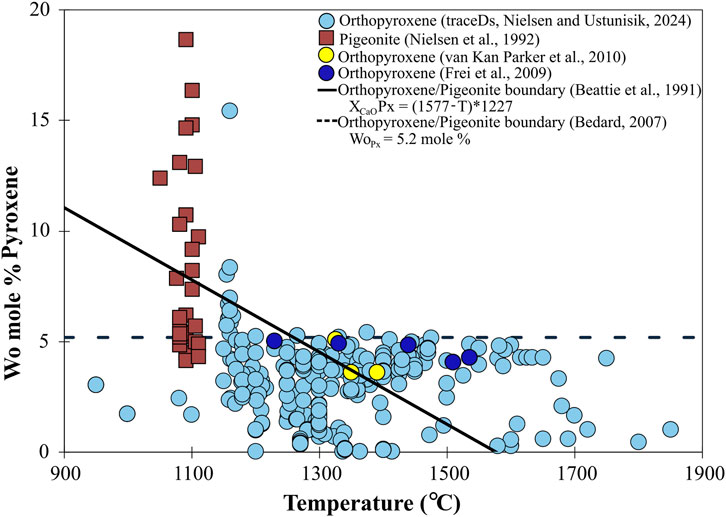
Figure 4. Temperature (°C) vs. wollastonite (Wo) mole % of pyroxene. Pigeonite compositions in green determined petrographically (Nielsen et al., 1992) and undesignated pyroxene data light in blue are from the traceDs database (Nielsen and Ustunisik, 2024). Dark blue (Frei et al., 2009) and yellow (van Kan Parker et al., 2010) data indicate experiments where the structural state of orthopyroxene was determined. The orthopyroxene/pigeonite phase boundaries are from Beattie et al. (1991) and Bédard (2007). Beattie et al. (1991) developed an expression as a function of mole fraction of CaO in the pyroxene and temperature. Bédard (2007) phase boundary is based on the 5.2 mole % Wo component in the pyroxene. Both classifications include pyroxenes confirmed to be pigeonite (Nielsen et al., 1992).
4.3 Differences in calibration databases for phase equilibria and trace elements experiments
Simulation of the liquid line of descent (LLD) of an evolving system requires models that includes major element composition and proportions of coexisting phases as to predict trace element behavior. Both the phase equilibria and the trace element partitioning models are dependent on the character of the databases used to calibrate each model. Most such models are based on regression analysis of a calibration database such as the experimental partitioning dataset. In general, due to the dependence of partition coefficients on T, P and X, the calibration dataset for each element in each phase must be sufficiently similar that they are calibrated over the same range of P-T-X space (Nielsen et al., 2017; Cung et al., 2023). The calibration dataset for many major element models (such as the MELTS family of algorithms) is the Library of Experimental Phase Relations (LEPR) database (Hirschmann et al., 2008). If we compare the LEPR database with the trace element partitioning experiments in traceDs database1, the traceDs database contains fewer experiments, and the range of both major and minor elements such as Na and Ti, were measured in orthopyroxene and coexisting melt is more restricted. In addition, the traceDs database includes fewer experiments that are conducted at low temperatures (800–1,000 °C) (Figure 5). This is mostly due to the absence of orthopyroxene in experiments containing significant water - a fact that may compromise any effort to calculate LLD for subduction related magmas (in addition MELTS having difficulty simulating amphibole stability).
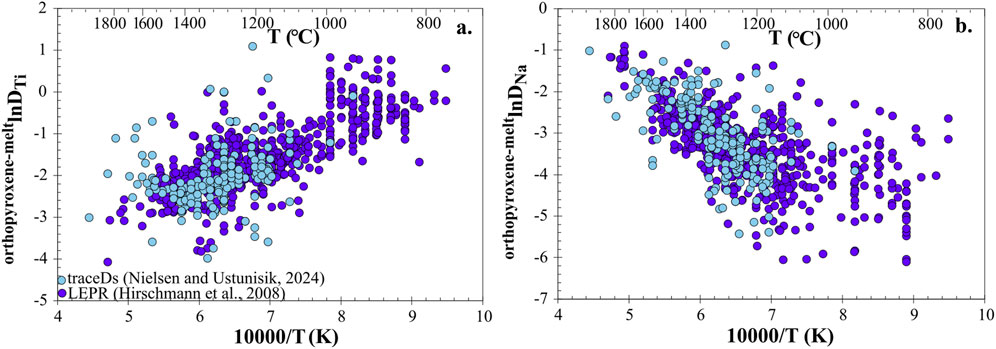
Figure 5. Correlation of reciprocal temperature and natural log of the orthopyroxene/melt (a) Ti and (b) Na partition coefficient from experiments in the Library of Experimental Phase Relations - LEPR (purple) (Hirschmann et al., 2008) and traceDs (blue) (Ustunisik and Nielsen, 2024) databases. Each symbol represents a single experiment. Note the wider distribution of temperature of experiments in the LEPR database and alignment of Na partitioning at high temperature between two databases.
Equally important, the partitioning behavior of Ti and Na in the trace element and phase equilibria databases overlap, particularly at high temperature. This is significant because many trace elements have behaviors (Cung et al., 2023) that are similar to or correlated to Ti (and to a lesser extent Na). However, if the goal is to develop a model that incorporates both the major and trace element systematics, we must be aware of the lack of experimental constraints at temperature <1100oC for water-bearing systems.
4.4 Comparison of the reported uncertainty for different analytical techniques
Most of the commonly measured trace elements such as REE, HFSE, and light ion lithophile elements (LILE) are incompatible in orthopyroxene (Di<1). Consequently, the concentration of trace elements in the mineral tend to be low. To evaluate the influence of analytical error related to low concentration (and low detector count rate) vs. the analytical error related to analysis of multiple phases in the analytical volume, here we used the reported 1σ uncertainty as a ratio of the reported average value in orthopyroxene. In addition, we cited uncertainty related to differences in two commonly used analytical techniques (LA ICP-MS and SIMS) for each experiment (Figures 6–8). These elements were selected as examples because there are a significant number of experiments in which they have been measured and they represent trace elements with different partitioning behavior (opx-meltDSc3+ > opx-meltDYb3+> opx-meltDZr4+).

Figure 6. Uncertainty (1σ uncertainty/reported Sc value) vs. Sc in orthopyroxene measured by (a) LA ICP-MS and (b) SIMS from all orthopyroxene-melt partitioning experiments where Sc was measured (traceDs database). Pink cross represents repeat measurement of NIST-612 standard by LA ICP-MS. Uncertainty for LA ICP-MS measurements exceeds uncertainty for SIMS measurements in Sc. The high levels of uncertainty for LA ICP-MS measurements at higher Sc concentrations in orthopyroxene cannot solely be attributed to analytical error related to counting statistics.
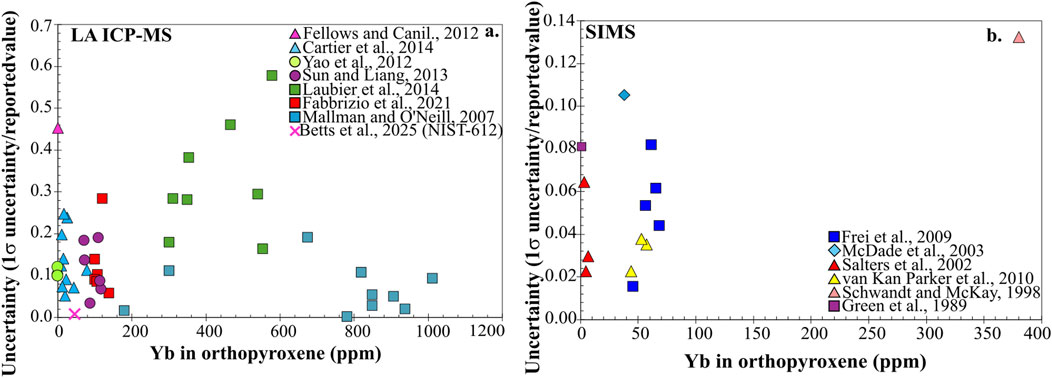
Figure 7. Uncertainty (1σ uncertainty/reported Yb value) vs. Yb in orthopyroxene measured by (a) LA ICP-MS and (b) SIMS from all orthopyroxene-melt partitioning experiments where Yb was measured (traceDs database). Pink cross represents repeat measurement of NIST-612 standard by LA ICP-MS. Uncertainty for LA ICP-MS measurements exceeds uncertainty for SIMS measurements in Yb. The high levels of uncertainty for LA ICP-MS measurements at higher Yb concentrations in orthopyroxene cannot be solely attributed to analytical error related to counting statistics.
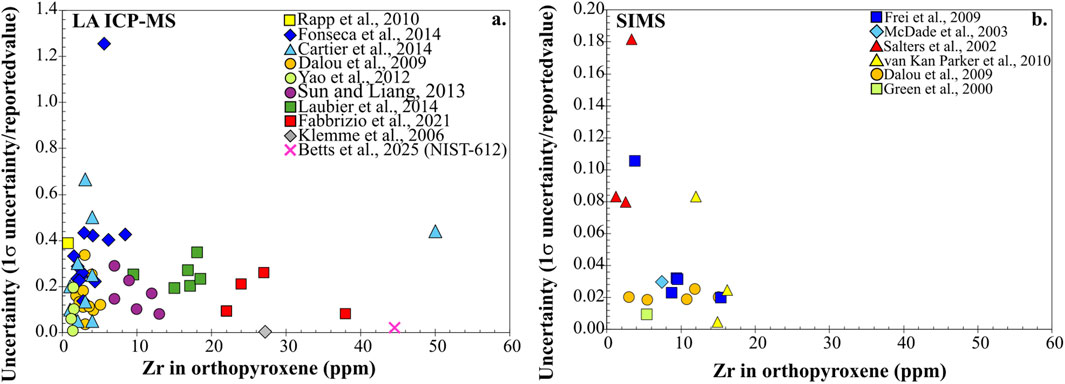
Figure 8. Uncertainty (1σ uncertainty/reported Zr value) vs. Zr in orthopyroxene measured by (a) LA ICP-MS and (b) SIMS from all orthopyroxene-melt partitioning experiments where Zr was measured (traceDs database). Pink cross represents repeat measurement of NIST-612 (Betts et al., 2025) standard by LA ICP-MS. Uncertainty for LA ICP-MS and SIMS measurements are similar.
Note that the range of values for the ratio of reported uncertainty to the reported value for the trace element in the orthopyroxene are greater for experiments where the trace element concentrations were determined by LA ICP-MS compared to those where the trace element concentrations were determined by SIMS. This is also seen in the different extent of scatter and range of opx-meltDi (opx-meltDSc3+ > opx-meltDSm3+ = opx-meltDGd3+> opx-meltDLa3+) vs. reciprocal temperature values for experiments where Sc, Sm, Gd, and La were determined in pigeonite and orthopyroxene (Figure 9). All of the data for pigeonite are at relatively low temperature, consistent with the general observations on orthopyroxene and pigeonite phase stability (Figure 1). The data for DSc (most compatible in opx) exhibits the smallest range of opx-meltDi values at any given temperature while DLa (least compatible in opx) exhibits the greatest. The data obtained by SIMS are not systematically offset from experiments analyzed by LA ICP-MS or electron microprobe (EMP). However, the small number of determinations and the low temperature pigeonite data is at the low temperature end of the data makes the source of uncertainty difficult to determine. This means that, at present, it is difficult to quantify the degree to which partitioning behavior is due to differences in structure (orthopyroxene versus pigeonite) or to temperature dependence.
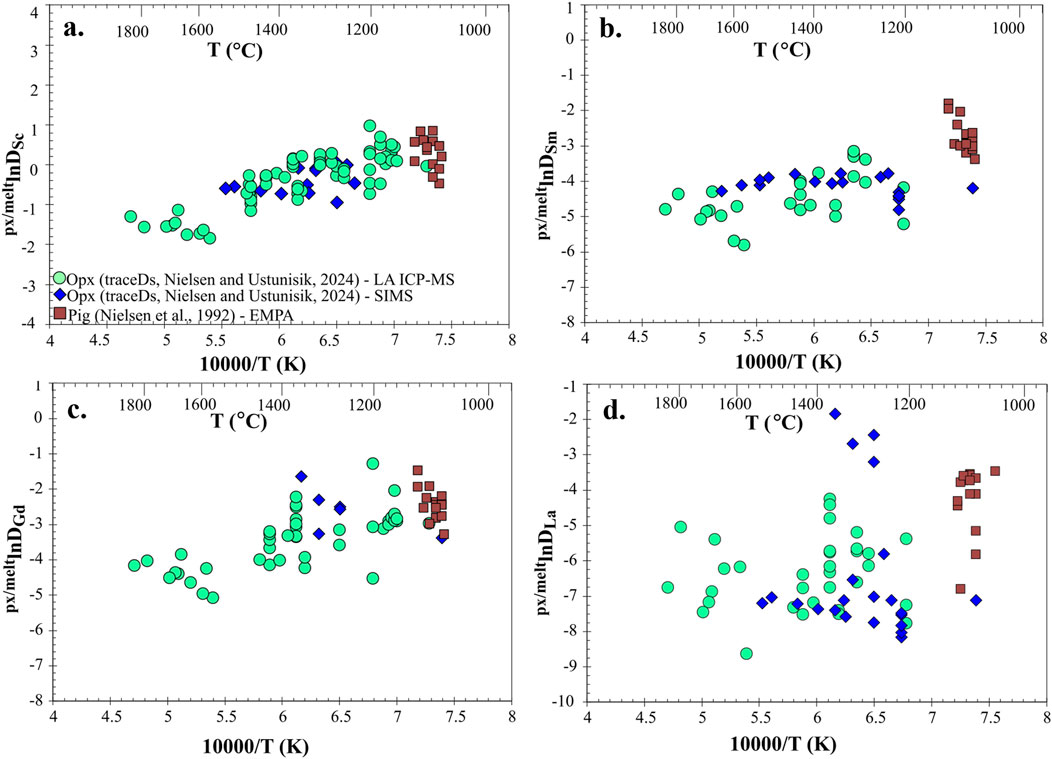
Figure 9. Comparison of pigeonite and traceDs orthopyroxene partition coefficients as a function of reciprocal temperature. lnDSc (a), lnDSm (b), lnDGd (c), and lnDLa (d), vs. 10000/T (K) for low-Ca pyroxene/melt of measurements in the TraceDs database measured via LA ICP-MS (light green circles) and SIMS (blue diamonds). Pigeonite data via EMPA (red squares; Nielsen et al., 1992) overlaps with the lowest temperature “orthopyroxene” measurements from the traceDs database.
4.5 The impact of multiphase analyses
In the absence of individual analyses of the phases (mineral-melt pair individual analyses rather than averages of multiple mineral and melt compositions) or structural determination of orthopyroxene from pigeonite, it is not possible to confirm whether the higher values of partition coefficients are true values, or they are anomalous due to inclusion of glass in the spot analysis of pyroxene or not determining the pyroxene structure. Among the experiments that measured Zr in orthopyroxene, only two identified the pyroxene as orthopyroxene or pigeonite via petrographically (e.g., inclined extinction for pigeonite or parallel extinction for orthopyroxene) (Frei et al., 2009; Nielsen et al., 2017) or X-ray diffraction (van Kan Parker et al., 2010). Trace elements are typically more compatible in pigeonite than in orthopyroxene due to the larger M2 site in monoclinic pyroxenes (Nielsen et al., 1992) and the lower temperature at which pigeonite is stable (Figure 10). If trace element behaviors in orthopyroxene were similar to pigeonite, we could assume that the structural differences of low-Ca pyroxenes are negligible or correlated to temperature (Figure 10). Without verification of the structural state of the orthopyroxenes in the existing experimental database, it is difficult to determine the extent to which behavioral and compositional overlap between orthopyroxene and pigeonite is caused by not identification of the specific low-Ca pyroxene despite their structural differences.
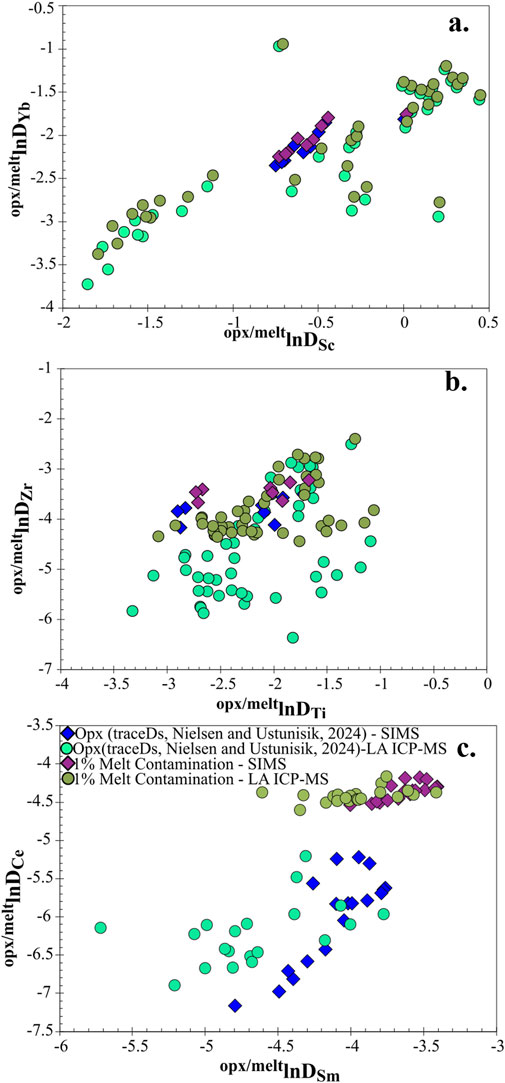
Figure 10. Depiction of the effect of low amounts of melt contamination on partition coefficients in orthopyroxene. lnDZr vs. lnDTi (a), lnDCe vs. lnDSm (b), and lnDYb vs. lnDSc (c) for low-Ca pyroxene/melt of Zr measurements in the database measured via LA ICP-MS (light green circles) and SIMS (blue diamonds). Dark green circles and purple diamonds represent 1% contamination of the paired melt value to the LA ICP-MS and SIMS experiments respectively. As compatibility of a trace element in orthopyroxene decreases, the effect of melt contamination increases.
5 Discussion
5.1 The limitations on modeling related to how data is reported
Existing limitations on our ability to develop predictive models for orthopyroxene/melt trace element partitioning are due to two reasons: (1) most previous studies report the composition of phases from trace element partitioning experiments as averages of multiple mineral or melt analyses and (2) the majority of papers did not identify the structural state of the low-Ca pyroxenes in experiments, instead opting to use major element compositions to distinguish orthopyroxene from pigeonite. Publication of phase composition as averages limits our ability to evaluate the impact of two-phase analyses where the concentration of the trace element of the mineral is contaminated by the inclusion of melt composition (Nielsen et al., 2017). If we were to have the individual analyses that comprise the average, we can directly assess the degree to which the orthopyroxene average may be driven by contamination with glass. An example as to how to make that assessment is described in Nielsen et al. (2017) where the analysis of trace elements on plagioclase-melt pairs are reported in some of the existing experiments.
5.2 Impact of the differences in data distribution
Publication of all of the individual analyses alone will not address all of the potential sources of bias. Specifically, if we consider how basic regression analysis would be impacted by the diversity of the dataset as documented (Figures 2, 3; Table 2), any expression that described the partitioning behavior of an element will be influenced by the average values of the dataset. In groups of elements such as the REE, where the partitioning behavior of the elements is correlated to ionic radius, calibration of any expression that includes temperature, pressure and a term to accommodate mineral or melt composition or structure would be influenced by the “center of gravity” of the calibration dataset. For example, the average temperature and pressure for the experiments where Tm was measured is 240 °C and 2.5 GPa higher than the average for experiments for which Yb was measured. In addition, the average liquid composition for Tm is 7 wt% SiO2 higher and 1 wt% alkalis lower than for experiments where Yb was measured. Further, the number of experiments for Yb is almost 5 times as high as the number of experiments for Tm. The differences in the average composition, T and P would result in a range of regression constants for the influence of those parameters–and when used to predict behavior, would predict an irregular REE pattern.
Equally important, the distribution of experimental data for other mineral systems is different. One could argue that we only need ∼ four REE elements to define the temperature, pressure and compositional dependence for orthopyroxene, and one could use four elements whose average temperature, pressure and composition were similar (e.g., La, Sm, Gd and Yb averages are ∼2.5 wt% alkalis, 52 wt% SiO2, 2.5 GPa and 1,400 °C Figures 2, 3). However, consider the experimental partitioning data for clinopyroxene. The average temperature, pressure and composition for those same elements are 4.5 wt% alkalis, 49 wt% SiO2, 1.5 GPA and 1,250 °C (Figure 1 of Cung et al., 2023). Therefore, if one attempts to calculate predictive models for conditions appropriate for systems where both orthopyroxene and clinopyroxene are present, those models will be calibrated to datasets characterized by distinctly different set of conditions and compositions. This has implications for models that use a strictly empirical approach (e.g., Bédard, 2007) as well as those that apply models for melt component activity (Cung et al., 2023) or elastic strain (Bédard, 2025).
Another approach is to calibrate expressions that cover a restricted range of conditions (e.g., Bédard, 2007 and others) or to use constraints that put those dependencies into a broader framework such as the lattice strain model (Blundy and Wood, 2003; Bédard, 2025). Models that are calibrated for a limited range of conditions are difficult to apply over a range of magmas (e.g., progressive fractionation or differential partial melting) and can result in artificial discontinuities in the calculated LLD. In addition, as described above, the presence and impact of contaminated analyses is dependent on the partition coefficient of that element (e.g., compatible vs. incompatible) in a specific phase. For example, as the average temperature of the calibration dataset increases, partition coefficients decrease (e.g., Figure 9) and the potential impact of contaminated analyses of the mineral increases. This would create a series of expressions with incrementally different levels of uncertainty, that is dependent on the average temperature of the experiments in the calibration dataset. It is important to re-iterate here that compositional heterogeneity of the phases in an experimental charge is a physical and chemical characteristic of that experiment and cannot be corrected. For example, as opposed to phase equilibria experiments, most trace element partitioning experiments reach local equilibrium within the charge due to the slow diffusion characteristics of certain trace elements as well as compositional zoning in phases. Because of this, as one analyzes the trace element experiments, partition coefficients are calculated using the mineral/melt pairs that are spatially closest to one another. This should not be confused with the multiphase analysis. Multiphase/contaminated determinations are an analytical artifact and can be corrected if all the component analyses are known.
5.3 Comparative analytical uncertainty
Ultimately, our ability to predict the partitioning behavior of trace elements is dependent on the uncertainty related to the experimental database with which we calibrate our models. Predictive power of the models is limited to the degree to which the experiments achieve equilibrium and sensitivity of the analytical tools applied in addition to the degree to which multiphase analyses are included in the reported data. Therefore, we can use measures of the instrument precision, whether in the form of counting statistics or multiple analysis of a standard, as a metric against which we can judge the predictive power of the model. Specifically, our predictive models should produce results as close to instrumental precision as possible.
Despite the fact we cannot access the individual analyses of mineral-melt pairs that were averaged to make the reported concentrations, we can indirectly assess the uncertainty of trace element measurements by comparing the concentration to reported relative 1σ standard deviation of the average. If we make the initial assumption that the source of error of the measurements is related to counting statistics, reported concentrations of trace elements would be expected to result in relatively high uncertainty at low concentrations (mineral-meltDi<1) and less uncertainty at higher concentrations (mineral-meltDi>1). Given the differences in the sensitivity of different instruments, one can only generalize regarding the source of uncertainty. When we examine the uncertainty (1σ as a fraction of the reported value) vs. concentration in orthopyroxene for Sc, Yb, and Zr (Figures 6–8), even at relatively higher concentrations (e.g., Sc > 1,000 ppm, Yb > 200 ppm, Zr > 20 ppm) the uncertainty of the LA ICP-MS analyses is on the order of 10%–20%. This variability is not observed in measurements of standard NIST-612 from three separate LA ICP-MS runs (Betts et al., 2025) that all have less than 0.02 uncertainty (reported 1σ deviation/average value) in the values of the trace elements in the pyroxene in an experiment. This indicates that the range of uncertainty, particularly for LA ICP-MS measurements, cannot solely be attributed to analytical error related to counting statistics. Overall, the experimental results report analytical uncertainty at least an order of magnitude higher than what can be attributed to instrument related uncertainty.
The impact on the reported values for partition coefficients that can be related to differences in analytical approach has not been addressed in previous orthopyroxene-melt partitioning models (Bédard, 2025). However, we know that the analytical volume of laser LA ICP-MS (50 µm) and SIMS (5 µm) are important factors in the determination of the probability of contamination. In addition, inclusion of glass in the analyses are more likely to occur in minerals with skeletal or acicular crystal habits that are the common form of orthopyroxenes in partitioning and phase equilibria experiments or inclusions of melt or other minerals in orthopyroxene. The larger uncertainty related to microanalytical results of experimental charges compared to homogeneous standards is consistent with a greater degree of heterogeneity at lower spatial resolution and resultant contamination of analyses associated with the larger analytical volume for LA ICP-MS compared to SIMS. The impact of melt contamination is dependent on the relative concentration of a given trace element in the mineral vs. the melt. In general, the impact of multiple phases in the analytical volume will depend on the partition coefficient for that element and is a function of the analytical volume (Nielsen et al., 2017), the lower the partition coefficient, the greater the impact of contamination. For example, for an element with a partition coefficient of 0.1, 1% contamination will cause the apparent partition coefficient to increase by 9%. If the partition coefficient is 0.001, 1% contamination will cause the apparent partition coefficient to increase by an order of magnitude (Table 5 of Nielsen et al., 2017).
5.4 Quantifying the impact of multiphase analyses
The impact of melt contamination can be assessed by considering the case of adding 1% contamination by weight of the melt paired with each measurement, the impact is small for lnDYb and lnDSc (Figure 10a), which are both more compatible than most other REE and HFSE in orthopyroxene (opx-meltDSc3+>opx-meltDYb3+>opx-meltDTi4+>opx-meltDZr4+>opx-meltDCe4+>opx-meltDCe3+). However, measurements with the lowest lnDZr (Figure 10b) behaves as if it was more compatible by two log units, even after only 1 wt% contamination. This effect is even more striking between elements such as Ce and Yb with lower partition coefficients than Zr, Ti, Sc and Yb (Figure 10c). Even with small amounts of melt contamination, the resulting “contaminated” partition coefficients for incompatible elements will increase significantly. Equally important, the effect of contamination results in less scatter of partition coefficients in more compatible elements (e.g., Sc, Figure 10a) than less compatible elements (e.g., Sm, Figure 10c). There is about one log unit of scatter in lnDSc via LA ICP-MS vs. two in the values of lnDSm obtained via LA ICP-MS. It is important to note here that all highly incompatible elements will be impacted by the inclusion of multiphase analyses and this impact will be more pronounced when their values are used in the denominator of a metric we use for evaluating degree of melting or the composition of a reservoir (e.g., CO2/Nb).
Glass contamination can be identified prior to publication if one compares EMP and LA ICP-MS values of individual analyses from a single experiment. Specifically, we can compare the relationship between an element that has a relatively low concentration that is measurable by both EMP and LA ICP-MS with the concentrations of the trace element evaluated. For example, Nielsen et al. (2017) used the LA ICP-MS measurement of Mg in plagioclase to exclude analyses that contained Mg concentrations outside of 1,600 ± 200 ppm based on the clustering of Mg concentrations in that experiment. For each mineral, a different minor element component for that phase should be used (e.g., Si for oxides, Al for olivine, Ca or Ti for orthopyroxene). This data filtration process could be standardized to ensure internally consistent partition coefficients for modeling.
5.5 Compositional dependence of Ti and Zr in pyroxene/melt partitioning
The relationship between DZr and DTi between melt and mafic minerals has commonly been used to estimate extent of partial melting (Johnson et al., 1990; Warren, 2016). In the case of melting of a lherzolite protolith, clinopyroxene is the dominant phase controlling the trace element budget. Additionally, Ti and Zr are both analyzable (concentrations significantly above the detection limits) in mid-ocean ridge basalt (MORB) lavas. Partition coefficients for Ti and Zr are much lower in orthopyroxene than clinopyroxene. Therefore, understanding the behaviors of Ti and Zr in both clinopyroxene and orthopyroxene is critical for our ability to quantify the impact of high percents of melting in the lower crust and upper mantle.
If we compare lnDZr vs. lnDTi for clinopyroxene and orthopyroxene, the orthopyroxene/melt partitioning results exhibit no consistent correlation and tend to either cluster or trend only within experiments from the same investigations (Figure 11a). This is not the case for clinopyroxene (Figure 11B) which shows a tighter correlation between lnDZr and lnDTi. This correlation in lnDZr and lnDTi for clinopyroxene is in spite of the wider range of composition where clinopyroxene is stable (Cung et al., 2023) and the larger number of experiments, both of which could contribute to increased scatter. The narrower range of prx-meltDi values may be attributed to Zr and Ti having higher compatibilities in clinopyroxene than orthopyroxene (Supplementary S1), and therefore less likely to be impacted by contamination. The lack of a coherent trend for orthopyroxene/melt between lnDZr and lnDTi (Figure 11a) could arguably be related to contamination with glass or to uncertainty with respect to the structure state of the mineral (e.g., are they really orthopyroxene?).
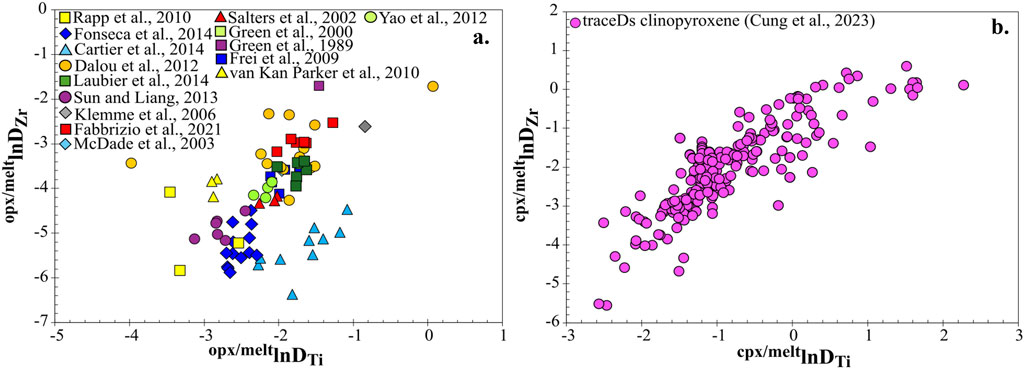
Figure 11. Differences between orthopyroxene and clinopyroxene partition coefficient correlation. lnDZr vs. lnDTi pyroxene/melt of Zr measurements in the database for each experiment for orthopyroxene (a) and clinopyroxene (b). Orthopyroxene data is divided based on experiment publication to highlight clustering. lnDZr vs. lnDTi shows a stronger correlation in clinopyroxene than in orthopyroxene.
We also observe decoupling of the DTi and DZr values as a function of wt% CaO in orthopyroxene and clinopyroxene (Figure 12). For both orthopyroxene and clinopyroxene, the majority of experiments have a DTi/DZr at or below 10. Nevertheless, the ratio increases at different rates as wt% CaO in pyroxene decreases. In clinopyroxene, the ratio of DTi/DZr is relatively constant above 9 wt% CaO, while DTi/DZr gradually increases as CaO wt% decreases. This behavior is even more striking in orthopyroxene, with consistent DTi/DZr between 2-4 wt% CaO and a larger rate of change in DTi/DZr as CaO wt% in orthopyroxene decreases compared to the ratio for clinopyroxene. Understanding why DTi/DZr is similar between clinopyroxene above 9 wt% CaO and orthopyroxene above 2 wt% CaO, as well as what influences the differences in the magnitude of change in DTi/DZr is fundamental to understanding the trace element signatures of the mantle as the degree of melting increases and clinopyroxene is exhausted.
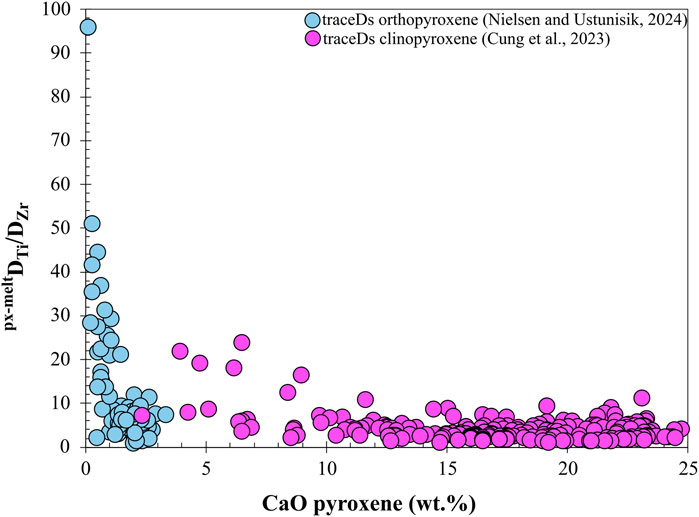
Figure 12. Changes in the ratio of Ti to Zr partitioning as a function of CaO content in orthopyroxene and clinopyroxene. DTi/DZr vs. wt% CaO for orthopyroxene (light blue) and clinopyroxene (pink) from the traceDs database. For CaO values below 10 wt% CaO, DTi/DZr in clinopyroxene and orthopyroxene increases when CaO values are below 10 wt% and 2 wt%, respectively.
5.6 Impact of multiphase analyses on the elastic strain model
The susceptibility of trace element measurements to contamination, and the dependence of the impact of contamination on the partition coefficients will impact the determination of elastic strain parameters (Young’s modulus) by broadening the base of the mineral-meltDi vs. ionic radius parabola (Onuma curve) and result in systematic bias in any predictive model based on such data (e.g., values for elements furthest from the ideal radius will be most prone to error). Since the inclusion of glass in the analytical volume will impact the apparent partition coefficient for the most incompatible elements, the result will be the broadening of the Onuma curve and the assumed rigidity of the structure (Figure 13). Note that the impact of contamination will move the points vertically on plots of mineral-meltDi vs. ionic radius. The degree to which the results from each experiment will be impacted will be a complex combination of the crystal size in the experiment, the analytical volume and the actual (uncontaminated) value of the partition coefficient. All three of these parameters are mutually independent.
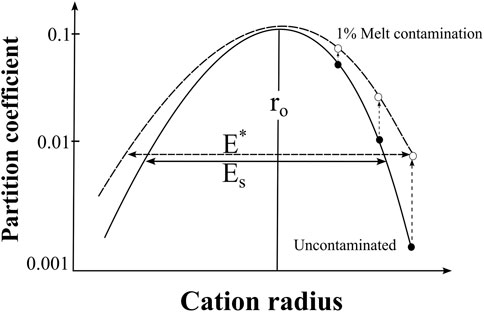
Figure 13. Sketch of Onuma diagram showing the impact of 1% contamination on the mineral-meltDi vs. ionic radius curve from which the Young’s modulus is calculated (Wood and Blundy, 2003). The magnitude of the offset is based on the model calculations described in Nielsen et al. (2017).
As documented above, examination of the orthopyroxene/melt database has yielded a significant amount of circumstantial evidence indicating that the database contains a level of contamination that makes even first order estimates of uncertainty difficult. In the absence of individual mineral/melt pair analyses in the published literature for orthopyroxene/melt partitioning experiments, we can still examine the methods one may use to interpret such data if we were to have access. Towards that end, we developed a “synthetic” dataset the includes assumed levels of uncertainty, and applied the approach documented in Nielsen et al. (2017). Note that individual analyses for plagioclase/melt experiments were available to work with in that investigation. If there were published data on orthopyroxene/melt partitioning, it would be possible to use that data to make this case without making a synthetic dataset.
The synthetic data we created was based on a set of assumed concentrations for the orthopyroxene and glass (9 and 1,500 ppm Zr; 1.5 and 12.5 wt% CaO) and randomized analytical error (Figure 14). Modeled contamination was calculated assuming a randomized maximum of 4% contamination (resulting in a maximum level of 2% contamination). In addition, the model assumed that we could determine the average and standard deviation of the CaO content of the pyroxene and glass by EMP separately from independent model microanalysis by LA ICP-MS. The projected uncontaminated orthopyroxene can then be calculated as the intercept of the trend of modeled contaminated data and the CaO content as assumed to be derived by EMP. In this example (Figure 14), the projected value for uncontaminated orthopyroxene is 10 ppm. It is not exactly the model value due to the impact of the modeled analytical uncertainty–but is within the uncertainty of the randomized Zr values (green field).
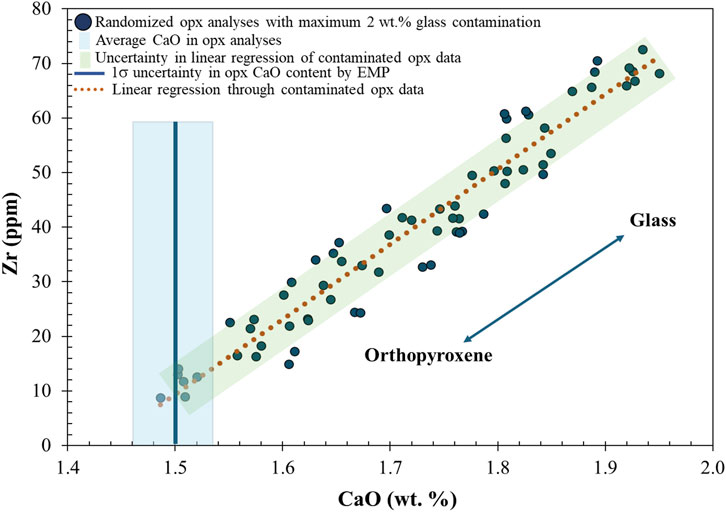
Figure 14. Model results for the interpretation of a series of analyses subject to both analytical error and two component (orthopyroxene and melt) mixing. The assumed composition of orthopyroxene is 9 ppm Zr and 1.5 wt% CaO. The composition of the glass is 1,500 ppm Zr and 12.5 wt% CaO. The model data was assumed to have a randomized 4% uncertainty for CaO in orthopyroxene, a 1% randomized uncertainty in CaO in glass, a 10% randomized uncertainty in Zr in orthopyroxene and a 5% randomized uncertainty in Zr in the glass. Different sets of randomized numbers were used for the model EMP CaO than used for the model LA ICP-MS data. The model partition coefficient for Zr was therefore 9 ppm/1,500 ppm or 0.006 (consistent with the range of values within the traceDs database). The set of model orthopyroxene/melt mixed analyses were calculated assuming a randomized 4% maximum contamination. The uncontaminated orthopyroxene composition (10 ppm Zr, 1.5 wt% CaO) is represented by the intercept of the trendline through the calculated mixed analyses and the value of model EMP CaO. The average value for the model mixed analyses is 40 ppm Zr, 1.72 wt% CaO. If we were to have only that average, the value of the Zr partition coefficient would be 0.027, over 4 times the actual value. The average % contamination is 2% and would be difficult to detect unless we had access to all the data used to calculate the average. Note that the range of values and uncertainty are similar to that seen in the plagioclase/melt experimental results described in Nielsen et al. (2017).
If we were to have only the average and standard deviation of the mixed analysis (40 ± 18 ppm Zr, 1.72 ± 0.13 wt% CaO), we would not have a means of detecting the level of contamination, and the model Zr partition coefficient would be 0.027, over 4 times the actual value assumed in the model. In addition, technically it is possible to project from the glass composition through the average of the (contaminated) mineral analyses to the intercept with the CaO derived from EMP. However, projection of the uncertainty represented by the 1σ of the average (±18 ppm) includes negative values of Zr in orthopyroxene, and therefore there is a significant probability withing the 1σ uncertainty of negative values for the partition coefficient (e.g., the uncertainty on the intercept is greater than the value of the intercept). It is important to note here that the slope of the mixing line (dashed line on Figure 14) is a function of the partition coefficient. For lower values of the partition coefficient, the intercept between the mixing line and the independently determined mineral composition will be closer to 0, magnifying the impact of the analytical uncertainty of the trace element values (documented in detail for Zr in plagioclase in Nielsen et al., 2017). The technique described above for estimating the partition coefficient is only possible if one has access to the individual analyses and can calculate the uncertainty on the regression (green field in Figure 14) which is significantly less than the 1σ on the average. The difference in the calculated uncertainty is due to the fact that regression analysis includes the associated uncertainty of two measured parameters.
6 Conclusion and recommendations
Constraining the behavior of trace elements in systems in which orthopyroxene is stable is important for developing quantitative models of igneous processes, especially during high degrees of partial melting. However, the level of uncertainty in the existing database of the orthopyroxene trace element partitioning experiments is such that it compromises our ability to develop predictive models for trace element behavior. The unique aspect of the low-Ca pyroxene partitioning database is the issue of the structural state of the specific low-Ca pyroxene, specifically distinguishing orthopyroxene from pigeonite. This has generally been based solely on Ca content of the pyroxene (Figure 4). The experiments where structure was determined (Frei et al., 2009; van Kan Parker et al., 2010) are all relatively close to the 5.2 Wo% divide. The uncertainty with respect to the identity of the low-Ca pyroxene has led to complications in determining the significance of such differences in understanding the low-Ca pyroxene/melt partitioning behavior.
The major sources of uncertainty in the experimental determination of trace element partitioning are a) precision related to count rates and background determination for specific trace elements, b) heterogeneity of the phases (failure to achieve equilibrium) in the experiments and c) multiphase analyses where the analytical volume includes more than one phase. Count rates and background can be adjusted to improve precision can be achieved by re-analysis with different analytical parameters or improved detector sensitivity. Heterogeneity of the phases in the experiment is a physical and chemical characteristic of the specific experiment and cannot be corrected for, and can only be addressed by conducting additional experiments using different run time, capsules, etc. Contamination in the individual analyses can be identified by examination of all analyses for a specific element in an experimental charge. That distribution may be used to determine the magnitude of and make corrections for contamination. Such a determination cannot be performed using only the average and standard deviation of the analysis.
Incompatible elements are most sensitive to the analysis of glass in the analytical volume (Nielsen et al., 2017). This can be seen in the form of increased scatter in the reported composition and uncertainty (Figures 6–8) for more incompatible elements. For incompatible elements, inclusion of glass in the analytical volume of the mineral will lead to overestimation of compatibility of certain trace elements (Figure 9). The possibility of such a bias has been known for decades (McKay, 1989; Westrenen et al., 2001). It is important to note that the identification and correction of two-phase analyses cannot be achieved without the individual analyses on mineral-melt pairs.
LA ICP-MS measurements are more susceptible to glass contamination due to the large analytical volume (compared to SIMS and EMP). The impact of such analysis may be mitigated by filtering the individual analyses for contamination (Nielsen et al., 2017). Identifying the threshold of exclusion of multi-phase analyses can be accomplished by examining the individual analyses that were used to calculate the averages reported for each experiment. Additionally, these factors will impact the determination of elastic strain parameters (Young’s modulus) by broadening the base of the mineral-meltDi vs. ionic radius parabola (Onuma curve) and result in systematic bias in any predictive model based on such data (Figure 13).
The current state of the experimental partitioning database has internal inconsistencies that can create bias in developing predictive models for trace element partitioning behavior. In the past, we have not been able to report experimental details because of the limitations placed on authors by the journals. To address the issues related to the publication of experimental data, we recommend an upgrade in our best practices. Towards that end, we should require publication of.
1. Individual analyses together with the average and standard deviation of the analyses.
2. The detection limits for the elements of interests at the appropriate/relevant set of conditions.
3. Repeat analyses of a secondary standard as an indicator of the instrument uncertainty (due to reduced influence of heterogeneity and absence of multiple phases).
4. The results of the application of a projection technique (as described in Nielsen et al., 2017) to evaluate the degree to which analyses represent more than one phase.
5. Images of the experimental charges with the analysis spots located on them.
Arguably, the single most important observation in this investigation is the difference (a factor of ∼10 or more) between the cited uncertainty for any specific trace element and the uncertainty represented by multiple analyses of a standard (Figures 6–8). If we can improve our publication protocol, we can narrow that gap and until we do that, we cannot fully understand how much we can improve the predictive power of our trace element models.
Data availability statement
The datasets presented in this study can be found in online repositories. The names of the repository/repositories and accession number(s) can be found in the article/Supplementary Material.
Author contributions
MB: Writing – original draft, Methodology, Data curation, Investigation, Formal Analysis. GU: Funding acquisition, Resources, Project administration, Validation, Formal Analysis, Writing – review and editing, Investigation, Supervision, Data curation, Visualization, Methodology, Conceptualization. RN: Funding acquisition, Conceptualization, Writing – review and editing, Methodology, Validation, Investigation.
Funding
The author(s) declare that financial support was received for the research and/or publication of this article. Funding for this work was provided by the National Science Foundation OCE-2135828 and EAR/Geoinformatics-2148990 grants to GU and RN.
Acknowledgements
Authors would also like to acknowledge the scientific input from two reviewers, which substantially improved the clarity of the manuscript.
Conflict of interest
The authors declare that the research was conducted in the absence of any commercial or financial relationships that could be construed as a potential conflict of interest.
Generative AI statement
The author(s) declare that no Generative AI was used in the creation of this manuscript.
Any alternative text (alt text) provided alongside figures in this article has been generated by Frontiers with the support of artificial intelligence and reasonable efforts have been made to ensure accuracy, including review by the authors wherever possible. If you identify any issues, please contact us.
Publisher’s note
All claims expressed in this article are solely those of the authors and do not necessarily represent those of their affiliated organizations, or those of the publisher, the editors and the reviewers. Any product that may be evaluated in this article, or claim that may be made by its manufacturer, is not guaranteed or endorsed by the publisher.
Supplementary material
The Supplementary Material for this article can be found online at: https://www.frontiersin.org/articles/10.3389/fgeoc.2025.1660826/full#supplementary-material
References
Beattie, P., Ford, C., and Russell, D. (1991). Partition coefficients for olivine-melt and orthopyroxene-melt systems. Contributions Mineralogy Petrology 109, 212–224. doi:10.1007/BF00306480
Bédard, J. H. (2007). Trace element partitioning coefficients between silicate melts and orthopyroxene: parameterizations of D variations. Chem. Geol. 244, 263–303. doi:10.1016/j.chemgeo.2007.06.019
Bédard, J. H. (2025). Trace element partitioning coefficients between orthopyroxene and melt: parameterizations of D variations and an improved lattice Strain Model for rare Earth elements. Chem. Geol. 681, 122710. doi:10.1016/j.chemgeo.2025.122710
Betts, M. X., Ustunisik, G. K., Nielsen, R. L., and Daynes, O. G. (2025). Boundary conditions for the petrogenesis of plagioclase ultraphyric basalts (PUB) from the Northeast (NE) Pacific ridge system: constraints from plagioclase-hosted melt inclusions. Lithos 516-517, 108232. doi:10.1016/j.lithos.2025.108232
Bizimis, M., Sen, G., Salters, V. J., and Keshav, S. (2005). Hf-Nd-Sr isotope systematics of garnet pyroxenites from Salt Lake Crater, Oahu, Hawaii: evidence for a depleted component in Hawaiian volcanism. Geochimica Cosmochimica Acta 69 (10), 2629–2646. doi:10.1016/j.gca.2005.01.005
Blundy, J., and Wood, B. (2003). Partitioning of trace elements between crystals and melts. Earth Planet. Sci. Lett. 210, 383–397. doi:10.1016/S0012-821X(03)00129-8
Cartier, C., Hammouda, T., Doucelance, R., Boyet, M., Devidal, J.-L., and Moine, B. (2014). Experimental study of trace element partitioning between enstatite and melt in enstatite chondrites at low oxygen fugacities and 5GPa. Geochimica Cosmochimica Acta 130, 167–187. doi:10.1016/j.gca.2014.01.002
Colson, R. O., and Gust, D. A. (1989). Effects of pressure on partitioning of trace elements between low-Ca pyroxene and melt. Am. Mineralogist 74, 31–36.
Colson, R. O., McKay, G. A., and Taylor, L. A. (1988). Temperature and composition dependencies of trace element partitioning: olivine/melt and low-Ca pyroxene/melt. Geochimica Cosmochimica Acta 52, 539–553. doi:10.1016/0016-7037(88)90109-3
Cung, E. W., Ustunisik, G. K., Wolf, A. S., and Nielsen, R. L. (2023). The influence of database characteristics on the internal consistency of predictive models of trace element partitioning for clinopyroxene, garnet, and amphibole. Geochem. Geophys. Geosystems 24, e2023GC010876. doi:10.1029/2023GC010876
Dalou, C., Koga, K. T., Shimizu, N., Boulon, J., and Devidal, J.-L. (2012). Experimental determination of F and Cl partitioning between lherzolite and basaltic melt. Contributions Mineralogy Petrology 163, 591–609. doi:10.1007/s00410-011-0688-2
Davis, F. A., and Hirschmann, M. M. (2013). The effects of K2O on the compositions of near-solidus melts of garnet peridotite at 3 GPa and the origin of basalts from enriched mantle. Contributions Mineralogy Petrology 166, 1029–1046. doi:10.1007/s00410-013-0907-0
Davis, F. A., Humayun, M., Hirschmann, M. M., and Cooper, R. S. (2013). Experimentally determined mineral/melt partitioning of first-row transition elements (FRTE) during partial melting of peridotite at 3GPa. Geochimica Cosmochimica Acta 104, 232–260. doi:10.1016/j.gca.2012.11.009
Daynes, O. G., Ustunisik, G. K., Nielsen, R. L., and Gaetani, G. A. (2025). Vapor undersaturated ultradepleted MORB liquids in plagioclase-hosted melt inclusions from Garrett Fracture Zone lavas. Earth Planet. Sci. Lett. 667, 119518. doi:10.1016/j.epsl.2025.119518
Fabbrizio, A., Schmidt, M. W., and Petrelli, M. (2021). Effect of fO2 on Eu partitioning between clinopyroxene, orthopyroxene and basaltic melt: development of a Eu3+/Eu2+ oxybarometer. Chem. Geol. 559, 119967. doi:10.1016/j.chemgeo.2020.119967
Fellows, S. A., and Canil, D. (2012). Experimental study of the partitioning of Cu during partial melting of Earth’s mantle. Earth Planet. Sci. Lett. 337–338, 133–143. doi:10.1016/j.epsl.2012.05.039
Fonseca, R. O. C., Mallmann, G., Sprung, P., Sommer, J. E., Heuser, A., Speelmanns, I. M., et al. (2014). Redox controls on tungsten and uranium crystal/silicate melt partitioning and implications for the U/W and Th/W ratio of the lunar mantle. Earth Planet. Sci. Lett. 404, 1–13. doi:10.1016/j.epsl.2014.07.015
Frei, D., Liebscher, A., Franz, G., Wunder, B., Klemme, S., and Blundy, J. (2009). Trace element partitioning between orthopyroxene and anhydrous silicate melt on the lherzolite solidus from 1.1 to 3.2 GPa and 1,230 to 1,535°C in the model system Na2O–CaO–MgO–Al2O3–SiO2. Contributions Mineralogy Petrology 157, 473–490. doi:10.1007/s00410-008-0346-5
Green, T. H. (1994). Experimental studies of trace-element partitioning applicable to igneous petrogenesis - sedona 16 years later. Chem. Geol. 117, 1–36. doi:10.1016/0009-2541(94)90119-8
Green, T. H., Sie, S. H., Ryan, C. G., and Cousens, D. R. (1989). Proton microprobe-determined partitioning of Nb, Ta, Zr, Sr and Y between garnet, clinopyroxene and basaltic magma at high pressure and temperature. Chem. Geol. 74, 201–216. doi:10.1016/0009-2541(89)90032-6
Green, T. H., Blundy, J. D., Adam, J., and Yaxley, G. M. (2000). SIMS determination of trace element partition coefficients between garnet, clinopyroxene and hydrous basaltic liquids at 2–7.5 GPa and 1080–1200°C. Lithos 53, 165–187. doi:10.1016/S0024-4937(00)00023-2
Hirschmann, M. M., Ghiorso, M. S., Davis, F. A., Gordon, S. M., Mukherjee, S., Grove, T. L., et al. (2008). Library of Experimental Phase Relations (LEPR): a database and web portal for experimental magmatic phase equilibria data. Geochem. Geophys. Geosystems 9, 2007GC001894. doi:10.1029/2007GC001894
Hofmann, A. W., and Class, C. (2025). “Canonical trace element ratios in oceanic basalts,” in Treatise On Geochemistry. 3rd ed. (Elsevier), 565–589.
Huang, F., Lundstrom, C. C., and McDonough, W. F. (2006). Effect of melt structure on trace-element partitioning between clinopyroxene and silicic, alkaline, aluminous melts. Am. Mineralogist 91, 1385–1400. doi:10.2138/am.2006.1909
Huebner, J. S. (1980). Chapter 5. Pyroxene phase equilibria at low pressure. Chantilly, VA: Mineralogical Society of America (MSA). 213–288. doi:10.1515/9781501508257-009
Irving, A. J. (1978). A review of experimental studies of crystal/liquid trace element partitioning. Geochimica Cosmochimica Acta 42, 743–770. doi:10.1016/0016-7037(78)90091-1
Jackson, M. G., Cabral, R. A., Rose-Koga, E. F., Koga, K. T., Price, A., Hauri, E. H., et al. (2015). Ultra-depleted melts in olivine-hosted melt inclusions from the Ontong Java Plateau. Chem. Geol. 414, 124–137. doi:10.1016/j.chemgeo.2015.08.014
Johnson, K. T. M., Dick, H. J. B., and Shimizu, N. (1990). Melting in the oceanic upper mantle: an ion microprobe study of diopsides in abyssal peridotites. J. Geophys. Res. Solid Earth 95, 2661–2678. doi:10.1029/JB095iB03p02661
Klemme, S., Günther, D., Hametner, K., Prowatke, S., and Zack, T. (2006). The partitioning of trace elements between ilmenite, ulvospinel, armalcolite and silicate melts with implications for the early differentiation of the moon. Chem. Geol. 234, 251–263. doi:10.1016/j.chemgeo.2006.05.005
Koga, K., Hauri, E., Hirschmann, M., and Bell, D. (2003). Hydrogen concentration analyses using SIMS and FTIR: comparison and calibration for nominally anhydrous minerals. Geochem. Geophys. Geosystems 4, 2002GC000378. doi:10.1029/2002GC000378
Laubier, M., Grove, T. L., and Langmuir, C. H. (2014). Trace element mineral/melt partitioning for basaltic and basaltic andesitic melts: an experimental and laser ICP-MS study with application to the oxidation state of mantle source regions. Earth Planet. Sci. Lett. 392, 265–278. doi:10.1016/j.epsl.2014.01.053
Lindsley, D. H. (1980). Chapter 6. Phase equilibria of pyroxenes at pressures >1 atmosphere Chantilly, VA: Mineralogical Society of America (MSA). 289–308. doi:10.1515/9781501508257-010
Liu, X., Xiong, X., Audétat, A., Li, Y., Song, M., Li, L., et al. (2014). Partitioning of copper between olivine, orthopyroxene, clinopyroxene, spinel, garnet and silicate melts at upper mantle conditions. Geochimica Cosmochimica Acta 125, 1–22. doi:10.1016/j.gca.2013.09.039
Liu, X., Xiong, X., Audétat, A., and Li, Y. (2015). Partitioning of Cu between mafic minerals, Fe–Ti oxides and intermediate to felsic melts. Geochimica Cosmochimica Acta 151, 86–102. doi:10.1016/j.gca.2014.12.010
Liu, X., Klaver, M., Hin, R. C., Coath, C. D., Bizimis, M., Ionov, D. A., et al. (2025). Si isotope composition of Earth's mantle and oceanic basalts. Geochimica Cosmochimica Acta 404, 223–233. doi:10.1016/j.gca.2025.07.025
Mallmann, G., O’Neill, H. S. C., Mallmann, E. to G., and O’Neill, C. (2007). The effect of oxygen fugacity on the partitioning of re between crystals and silicate melt during mantle melting. Geochimica Cosmochimica Acta 71, 2837–2857. doi:10.1016/j.gca.2007.03.028
McDade, P., Blundy, J. D., and Wood, B. J. (2003). Trace element partitioning between mantle wedge peridotite and hydrous MgO-rich melt. Am. Mineralogist 88, 1825–1831. doi:10.2138/am-2003-11-1225
McKay, G. A. (1989). Partitioning of rare earth elements between major silicate minerals and basaltic melts. Rev. Mineralogy Geochem. 21 (1), 45–77.
Neave, D. A., Maclennan, J., Edmonds, M., and Thordarson, T. (2014). Melt mixing causes negative correlation of trace element enrichment and CO2 content prior to an Icelandic eruption. Earth Planet. Sci. Lett. 400, 272–283. doi:10.1016/j.epsl.2014.05.050
Nielsen, R., and Ustunisik, G. (2024). Low-Ca pyroxene/melt partition coefficient experiments v.2. doi:10.60520/IEDA/113262
Nielsen, R. L., Davidson, P. M., and Grove, T. L. (1988). Pyroxene-melt equilibria: an updated model. Contributions Mineralogy Petrology 100, 361–373. doi:10.1007/BF00379745
Nielsen, R. L., Gallahan, W. E., and Newberger, F. (1992). Experimentally determined mineral-melt partition coefficients for Sc, Y and REE for olivine, orthopyroxene, pigeonite, magnetite and ilmenite. Contributions Mineralogy Petrology 110, 488–499. doi:10.1007/BF00344083
Nielsen, R. L., Ustunisik, G., Weinsteiger, A. B., Tepley, F. J., Johnston, A. D., and Kent, A. J. R. (2017). Trace element partitioning between plagioclase and melt: an investigation of the impact of experimental and analytical procedures. Geochem. Geophys. Geosystems 18, 3359–3384. doi:10.1002/2017GC007080
Ottolini, L., Laporte, D., Raffone, N., Devidal, J.-L., and Le Fèvre, B. (2009). New experimental determination of Li and B partition coefficients during upper mantle partial melting. Contributions Mineralogy Petrology 157, 313–325. doi:10.1007/s00410-008-0336-7
Rapp, R. P., Norman, M. D., Laporte, D., Yaxley, G. M., Martin, H., and Foley, S. F. (2010). Continent Formation in the Archean and chemical evolution of the cratonic lithosphere: Melt-rock reaction experiments at 3-4 GPa and petrogenesis of Archean Mg-Diorites (Sanukitoids). J. Petrology 51, 1237–1266. doi:10.1093/petrology/egq017
Salters, V. J. M., Longhi, J. E., and Bizimis, M. (2002). Near mantle solidus trace element partitioning at pressures up to 3.4 GPa. Geochem Geophys Geosyst 3, 1–23. doi:10.1029/2001GC000148
Salters, V. J. M., Mallick, S., Hart, S. R., Langmuir, C. E., and Stracke, A. (2011). Domains of depleted mantle: new evidence from hafnium and neodymium isotopes. Geochem. Geophys. Geosystems 12, n/a. doi:10.1029/2011GC003617
Schwandt, C. S., and McKay, G. A. (1998). Rare earth element partition coefficients from enstatite/melt synthesis experiments. Geochimica Cosmochimica Acta 62, 2845–2848. doi:10.1016/S0016-7037(98)00233-6
Simon, N. S. C., Neumann, E.-R., Bonadiman, C., Coltorti, M., Delpech, G., Grégoire, M., et al. (2008). Ultra-refractory domains in the Oceanic mantle lithosphere sampled as mantle xenoliths at Ocean Islands. J. Petrology 49, 1223–1251. doi:10.1093/petrology/egn023
Stracke, A., and Salters, V. J. (2025). The role of peridotite for oceanic volcanism. Geochem. Geophys. Geosystems 26 (8), e2025GC012463. doi:10.1029/2025gc012463
Stracke, A., Genske, F., Berndt, J., and Koornneef, J. M. (2019). Ubiquitous ultra-depleted domains in Earth’s mantle. Nat. Geosci. 12, 851–855. doi:10.1038/s41561-019-0446-z
Sun, C., and Liang, Y. (2013). Distribution of REE and HFSE between low-Ca pyroxene and lunar picritic melts around multiple saturation points. Geochimica Cosmochimica Acta 119, 340–358. doi:10.1016/j.gca.2013.05.036
Van Kan Parker, M., Liebscher, A., Frei, D., Van Sijl, J., Van Westrenen, W., Blundy, J., et al. (2010). Experimental and computational study of trace element distribution between orthopyroxene and anhydrous silicate melt: substitution mechanisms and the effect of iron. Contributions Mineralogy Petrology 159, 459–473. doi:10.1007/s00410-009-0435-0
Vander Auwera, J., Longhi, J., and Duchesne, J. C. (2000). The effect of pressure on DSr (plag/melt) and DCr (opx/melt): implications for anorthosite petrogenesis. Earth Planet. Sci. Lett. 178, 303–314. doi:10.1016/S0012-821X(00)00086-8
Walter, M., and Cottrell, E. (2025). “Equilibrium constraints on partial melting in the upper mantle,” in Treatise On Geochemistry. 3rd ed. (Elsevier), 231–273. doi:10.1016/B978-0-323-99762-1.00126-1
Wang, J., Xiong, X., Takahashi, E., Zhang, L., Li, L., and Liu, X. (2019). Oxidation state of arc mantle revealed by partitioning of V, Sc, and Ti between mantle minerals and basaltic melts. JGR Solid Earth 124, 4617–4638. doi:10.1029/2018JB016731
Warren, J. M. (2016). Global variations in abyssal peridotite compositions. Lithos 248–251, 193–219. doi:10.1016/j.lithos.2015.12.023
Westrenen, W., Wood, B. J., and Blundy, J. D. (2001). A predictive thermodynamic model of garnet–melt trace element partitioning. Contributions Mineralogy Petrology 142 (2), 219–234. doi:10.1007/s004100100285
Yao, L., Sun, C., and Liang, Y. (2012). A parameterized model for REE distribution between low-Ca pyroxene and basaltic melts with applications to REE partitioning in low-Ca pyroxene along a mantle adiabat and during pyroxenite-derived melt and peridotite interaction. Contributions Mineralogy Petrology 164, 261–280. doi:10.1007/s00410-012-0737-5
Keywords: trace element modeling, MELTS, depletion, partitioning, orthopyroxene
Citation: Betts MX, Ustunisik GK and Nielsen RL (2025) The landscape of the experimental orthopyroxene/melt partitioning database. Front. Geochem. 3:1660826. doi: 10.3389/fgeoc.2025.1660826
Received: 07 July 2025; Accepted: 22 October 2025;
Published: 07 November 2025.
Edited by:
Vincent Salters, Florida State University, United StatesReviewed by:
Igor Victorovich Ashchepkov, V. S. Sobolev Institute of Geology and Mineralogy (RAS), RussiaMichael Bizimis, University of South Carolina, United States
Copyright © 2025 Betts, Ustunisik and Nielsen. This is an open-access article distributed under the terms of the Creative Commons Attribution License (CC BY). The use, distribution or reproduction in other forums is permitted, provided the original author(s) and the copyright owner(s) are credited and that the original publication in this journal is cited, in accordance with accepted academic practice. No use, distribution or reproduction is permitted which does not comply with these terms.
*Correspondence: Gokce K. Ustunisik, Z29rY2UudXN0dW5pc2lrQHNkc210LmVkdQ==