 Gilvan Guedes1*
 Lara de Melo Barbosa Andrade2Cláudio Moises Santos e Silva2Kenya Valéria Micaela de Souza Noronha3Daniele Rodrigues4Albert Smith Feitosa Suassuna Martins1
- 1Department of Demography, Center for Development and Regional Planning, Universidade Federal de Minas Gerais, Belo Horizonte, Minas Gerais, Brazil
- 2Department of Atmospheric and Climate Sciences, Universidade Federal do Rio Grande do Norte (UFRN), Natal, Rio Grande do Norte, Brazil
- 3Department of Economics, Center for Development and Regional Planning, Universidade Federal de Minas Gerais, Belo Horizonte, Minas Gerais, Brazil
- 4Department of Statistics, Universidade Federal do Piauí, Teresina, Piauí, Brazil
Introduction: Data indicate an increase in the number of natural disasters in Brazil, with a large share of these events occurring in the state of Minas Gerais. This study examines precipitation-related natural disasters recorded between 1991 and 2016 in Minas Gerais by identifying municipality profiles (encompassing the number of droughts, flash floods, and flooding events), their sensitivity to geophysical and extreme climatic exposure, and their relation to sociodemographic and infrastructure characteristics.
Methods: We combine climate data on seven extreme rainfall indices with elevation data for each municipal seat. We obtained data on droughts, flash floods, and floods from the Center for Engineering and Civil Defense Research and Studies. Population and socio-sanitary characteristics were obtained from the 2010 Brazilian Demographic Census. First, we modeled the climatic-geo-socio-sanitary data using latent class analysis as a pure latent cluster model (LCM) without covariates on seven extreme precipitation indices coupled with altitude data. Subsequently, the LCM was used to identify precipitation-related disaster clusters, including clusters from the 1S-LCM as an active covariate (2S-LCM). Finally, we utilized sociodemographic and infrastructure variables simultaneously with the clusters from the 2S-LCM on an LCM without active covariates (3S-LCM).
Results: Our results show an increase in precipitation-related disasters in Minas Gerais, with municipalities located in the northern part of the state being particularly affected. The state registered 5,553 natural disasters in this period, with precipitation-related disasters representing 94.5% of all natural disasters. The 1S-LCM identified four homoclimatic zones, encompassing a low-altitude dry zone, a relatively low-altitude intermediately wet zone, a relatively high-altitude intermediately wet zone, and a high-altitude wet zone. The 2S-LCM produced four precipitation-related disaster classes, denominated low risk, high risk of excess precipitation, intermediate risk of precipitation deficit and excess, and high risk of precipitation deficit.
Discussion: Cities with better infrastructure and sociodemographic profiles in semi-arid regions are more resilient to droughts. In richer areas, floods are still a concern where incomplete urbanization transitions may undermine resilience to these events as they increase in intensity with the advance of climate change.
1. Introduction
Global climate change and its consequences currently rank as the most relevant topic of international debate, both in the scientific community and among decision makers. Debates surrounding climate change gained increasing prominence after the sequence of reports produced by the highly prestigious Intergovernmental Panel on Climate Change (IPCC) (IPCC, 2021). In the face of the adverse unfolding effects of weather and climate, scientists, civil society, and many governments around the world have increased efforts to understand the nature of these changes to allow policy makers and other stakeholders involved in climate policy to develop more effective adaptation and mitigation interventions against climate-induced damage (Magrin et al., 2014).
Climate change concerns anthropogenic changes in climatic characteristics over time, which are closely associated with changes in land use and occupation (IPCC, 2021). Global warming is currently the most consequential feature of global climate change, and it has been observed to increase the frequency and intensity of extreme weather events (Marengo and Bernasconi, 2015; Donat et al., 2016; Lyra et al., 2017; Fernandes and Rodrigues, 2018; Costa et al., 2021). Empirical evidence demonstrates the relationship between climate change and climate extremes, englobing a variety of temporal and spatial patterns regarding rainfall and temperature trends and intensity across various regions of the world. Changes in temperature and extreme precipitation are well-documented in China (Zheng et al., 2019; Guan et al., 2022), Mexico (Ruiz-Alvarez et al., 2020), the United States (Lesinger and Tian, 2022), and Iran (Fathian et al., 2022). While some regions have demonstrated an increase in rainfall intensity, such as the Chinese province of Xinjian (Du et al., 2019, 2022; Guan et al., 2022), others, such as the semi-arid region of northeastern Brazil (the Sertão), have been facing increasing water shortages (Marengo and Bernasconi, 2015; Lyra et al., 2017; Costa et al., 2021).
Although extreme weather events are natural phenomena, their transformation into disasters depends on a society's risk exposure, resilience, and adaptive capacity, the combination of which defines its degree of vulnerability (Tominaga, 2015; Andrade L. et al., 2021). For example, similar extreme weather events observed in New Zealand, Japan, and the Netherlands have caused fewer human losses than those in Thailand, the Philippines, and the United States. National differences in extreme weather event impacts are mediated by their intensity and a country's socioeconomic context (Marengo et al., 2010; Brondízio et al., 2016; Bunker et al., 2016; Menezes et al., 2018; Rodrigues et al., 2020). As highlighted by Sharma and Ravindranath (2019), assessing vulnerability based on the classifications outlined by the (IPCC, 2021) framework is more appropriate for tackling current deficiencies and improving climate-robust adaptation measures. Given that stakeholders (including governments) act differently across countries to fight the consequences of climate-induced disasters, the authors' approach based on the concepts of selecting hazard-relevant vulnerability indicators and assessing hazard-specific vulnerability is likely to yield improved local interventions. Consequently, we contend that the selective dimensionality of vulnerability is an essential component in highlighting differing degrees of vulnerability intensity in certain contexts or for specific purposes.
In the Americas, the United States and Brazil are subject to the largest number of extreme weather events, although the type of events differ between the two countries. While the US experiences recurrent tornadoes and hurricanes, the most common events in Brazil are floods and dry spells/droughts. Brazil is also more economically unequal and less prepared to face these types of events than the U.S. due to fewer investments in climate-robust infrastructure in recent years (Marengo et al., 2008; Cutter and Finch, 2018). Spatially, the occurrence of climate-induced disasters is more frequently observed in areas of greater social vulnerability, therefore posing a serious problem to governments, non-governmental agents, and local communities (Marengo et al., 2011; Nobre and Marengo, 2017; Andrade L. et al., 2021).
Many studies have identified a gradual increase in temperature and changes in rainfall patterns across multiple Brazilian regions, accompanied by an increase in the frequency and intensity of extreme weather events (Marengo and Bernasconi, 2015; Ávila et al., 2016; Lyra et al., 2017; Oliveira et al., 2017; Zilli et al., 2017; Fernandes and Rodrigues, 2018; Bezerra et al., 2019; Da Silva et al., 2019; Avila-Diaz et al., 2020; Dunn et al., 2020; Rodrigues et al., 2020, 2021; Costa et al., 2021). Moreover, most climate-induced disasters in Brazil are associated with extreme rainfall events (CEPED, 2013c; Rodrigues et al., 2020; Ribeiro et al., 2021; Palharini et al., 2022), and the consequences of these events are highly dependent on the vulnerability and response capacity of affected areas.
The growth of Brazilian cities has been characterized by unplanned urbanization, driven initially by rural-urban migration flows, followed by urban-urban migration from smaller to major cities. Incoming migrants have been pushed to the outskirts of Brazilian megacities in search of cheaper land prices. In major cities, such as Rio de Janeiro, São Paulo, and Belo Horizonte, these marginalized settlements are often located in hilly areas at risk of landslides, especially during the rainy season (Stevaux et al., 2009). In 2011, an atypically heavy rainfall event caused landslides in Rio de Janeiro, which affected around 300,000 individuals and resulted in more than 900 deaths (Barcellos and Cataldi, 2020). The Itajaí River fluvial basin, located in the South Region of Brazil, is another example of a hotspot for rainfall-related disasters. The main cities in the basin (Blumenau, Itajaí, Rio do Sul, and Brusque) rapidly expanded throughout the lower valley, which is the area with the highest risk of flooding. In Blumenau, the largest and most economically important municipality in the Itajaí River fluvial basin, 7.6% of its population was affected by a flash flood event in 2008 (corresponding to 22,800 residents), claiming the lives of 24 people (Stevaux et al., 2009).
In addition to excessive rainfall, droughts are common across Brazil, especially in semi-arid regions. However, recently, novel areas have been experiencing water shortages due to climate change. Prolonged periods of low precipitation are more worrying in areas not accustomed to water scarcity, which typically possess a lower mitigation capacity and limited or absent endogenous adaptive processes. For example, the subtropical/tropical Southeast Region of Brazil has been increasingly exposed to extreme rainfall events resulting in both precipitation excesses and deficits. From 2013 to 2015, the São Paulo Metropolitan Area (SPMA) faced an unprecedented drought due to anomalously low water supply inflows into the Cantareira reservoir system. As a result, reservoir storage declined to critical operational levels (de Freitas, 2020). Despite being the largest and most economically important metropolitan area in the country, the emergency measures taken did not prevent negative impacts on industries, commercial establishments, and other public facilities (Marengo and Bernasconi, 2015).
The southeastern state of Minas Gerais is a particularly interesting case study within the Brazilian context due to its diverse geomorphological characteristics, including a high spatial climate/environmental gradient across the state, as well as its social and economic asymmetries. This interplay between physical and social attributes accentuates the damage caused by extreme weather events, resulting in differential increases in its population's vulnerability. Minas Gerais is frequently affected by rainfall-related disasters, specifically dry spells, floods, and droughts. Following observed trends for Brazil as a whole, their occurrence has intensified in recent years (Nunes et al., 2018). The state is characterized by wide regional imbalances in terms of demographics and economic development (Cutter, 1996; IBGE, 2010). Minas Gerais' economic activity matrix, predominantly based on agriculture, livestock, the metallurgical industry, and tourism, also contributes to accentuating the state's vulnerability to disasters, as its primary industries are highly dependent on water inputs (Alcántara-Ayala, 2002; Mata-Lima et al., 2013; Trinh et al., 2021).
In recent years, concerns regarding the social and economic losses arising from rainfall-related disasters have grown in conjunction with an increasing number of rainfall-related disasters in Brazil (Dunn et al., 2020). This finding is accentuated by the fact that the majority of these events in the Southeast Region have occurred in Minas Gerais and because these events have become increasingly more common in densely populated areas (Perez et al., 2020). In this context, this study examines precipitation-related disasters recorded between 1991 and 2016 in the state of Minas Gerais, Brazil, by constructing municipality profiles regarding the number of droughts, flash floods, and flooding events, their sensitivity to geophysical and climatic exposure, and their relation to sociodemographic and infrastructure attributes.
2. Data and methods
2.1. Study area
The state of Minas Gerais is located in the Southeast Region of Brazil, between latitudes 14°13′57″ and 22°55′47″ and longitudes 39°51′24″ and 51°02′56″. As of 2021, it consisted of 853 municipalities, and possessed an area of 583,513.983 km2, equivalent to more than half of the size of the Southeast Region of Brazil (Figure 1). According to the Brazilian Institute of Geography and Statistics (IBGE), the estimated population of Minas Gerais was 21,411,923 in 2021, making it the second most populous state in Brazil, behind only the state of São Paulo. Minas Gerais encompasses three different biomes, comprised of the Caatinga in the northern parts of the state, the Cerrado in the northwest, parts of the center, and the far western reaches of the state (the Triângulo Mineiro), and Atlantic Forest, which stretches from the Northeastern to the Southern parts of Minas Gerais along the state's eastern border. Most of the state is located at mid-to-high altitudes, with an average elevation of 763.86 meters above sea level. Its highest point reaches 2,731 meters along the border with the state of Rio de Janeiro.
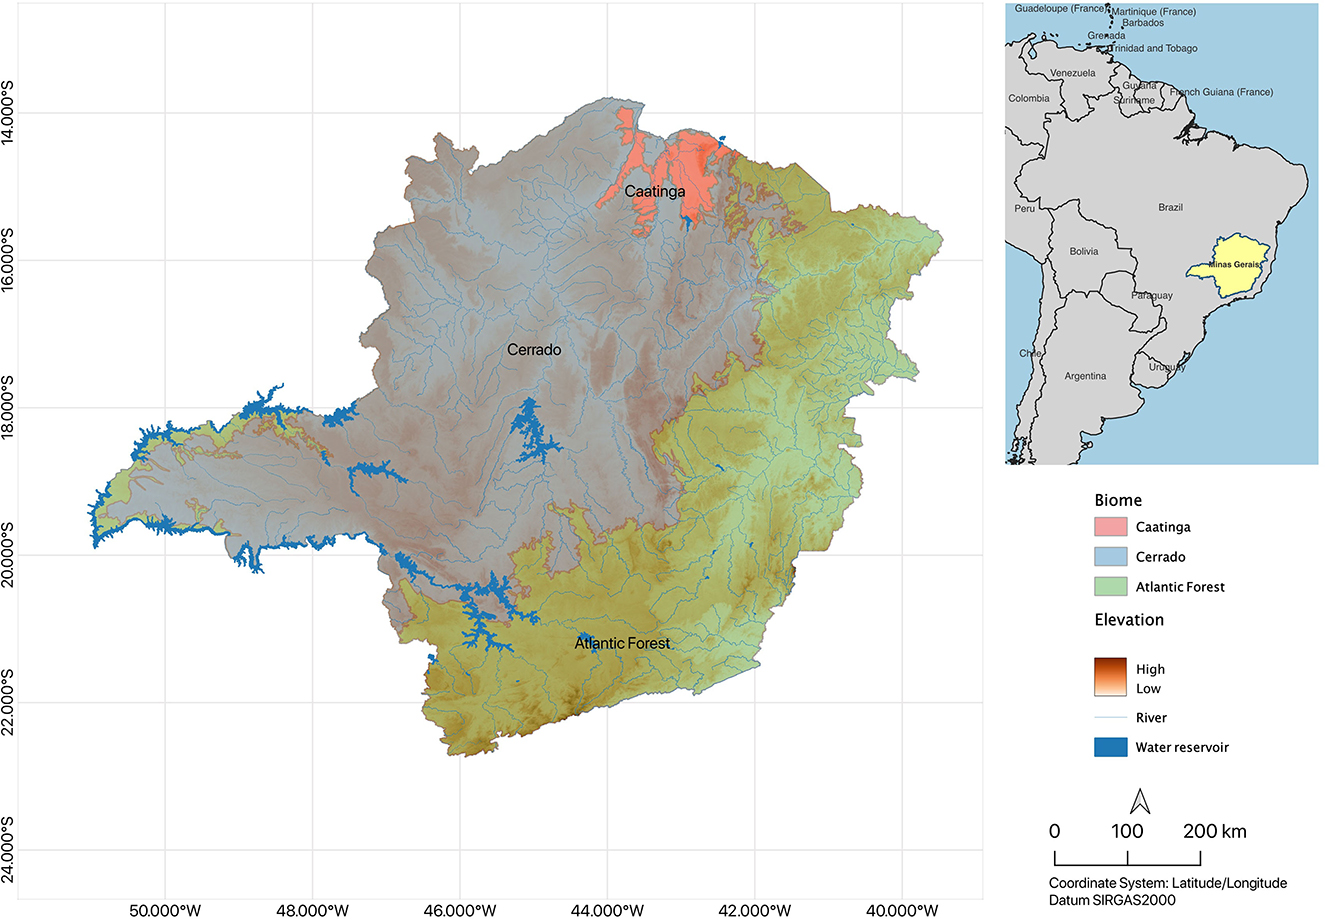
Figure 1. Study area—Minas Gerais, Brazil—Biomes, elevation, and main drainage networks. Source: Instituto Brasileiro de Geografia e Estatística – IBGE (2020).
According to the Köppen climate classification (Alvares et al., 2013; Reboita et al., 2015) the main climate types identified in Minas Gerais are Aw, tropical with a dry winter, which is characteristic of the northern, western, and eastern portions of the state, and Cwa and Cwb, humid subtropical zones, typical of the central and southern parts of the state. Average annual accumulated precipitation in Minas Gerais presents an intense gradient, registering values below 700 mm in the extreme north of the state, while the southern part of Minas Gerais records an average annual precipitation around 2,000 mm. In the north, there are meteorological and climatic aspects typical of semi-arid climates in Brazil, where severe droughts and heat waves have been identified (de Medeiros et al., 2020; Geirinhas et al., 2021) and have been associated with the interannual variability of the El Niño Southern Oscillation (ENSO) (Vásquez et al., 2018). In the southern portion of Minas Gerais, in addition to ENSO variability, there is also intraseasonal influence modulated by the South American Monsoon System (Coelho et al., 2022).
The Southeast Region of Brazil periodically suffers from severe droughts, often causing water shortages (Coelho et al., 2016). Simultaneously, this is a region where extreme precipitation events frequently occur, with mid-latitude transient systems (cyclones and cold fronts) and South Atlantic Convergence Zone (SACZ) events being the two principal large-scale meteorological systems associated with extreme rainfall events (Lima and Satyamurty, 2010), which have caused billions of US Dollars in damage in Minas Gerais and that are likely associated with the effects of climate change (Dalagnol et al., 2022).
2.2. Data
We obtained data from a variety of sources, combining demographic, socioeconomic, geophysical, and climate data. The climate data was developed by a partnership project between the University of Texas (United States) and the Federal University of Espírito Santo (Brazil) and is available at utexas.box.com/Xavier-etal-IJOCDATA, via the method described by (Xavier et al., 2015). This database provides information about rainfall, wind, minimum and maximum temperatures, relative humidity, and evapotranspiration variables, arranged in a regular 0.25° × 0.25° grid covering the entirety of Brazil. The original data from Xavier et al. (2015) are based on 11,473 pluviometers and 1,256 meteorological stations. For Minas Gerais, the data utilized 2,377 pluviometers and 68 meteorological stations. We selected one grid point for the precipitation variables from each one of the 853 municipal seats that comprise the state based on the LAT-LONG of the centroid of each municipal seat. Subsequently, we utilized the climate information from that location to represent the entire municipality's microclimate. The logic behind using municipal seats as sampling grid points is that they typically have the highest population density and congregate most facilities and services within them. Therefore, they are more likely to capture the impacts of disasters due to extreme rainfall events, which are more likely to result in greater damage and losses in more densely populated areas.
Precipitation indices were calculated using the RClimdex software, developed by Zhang and Yang (2004), and the method proposed by Zhang et al. (2005a,b) and Haylock et al. (2006) applied to local studies. We originally selected all 14 extreme rainfall indices available from the Climdex project, encompassing: the annual total wet-day precipitation; the mean wet-day precipitation; days with ≥1 mm of rainfall; the monthly 1-day precipitation maximum; the monthly 5-day precipitation maximum; the simple precipitation intensity index; the annual number of days with ≥10 mm of rainfall; the annual number of days with ≥20 mm of rainfall; the annual number of days when rainfall ≥ a user-defined threshold in millimeters; annual rainfall exceeding the 95th percentile; the contribution of very wet days to total precipitation; the contribution of extremely wet days to total precipitation; annual rainfall exceeding the 99th percentile; the maximum number of consecutive days with < 1 mm of rainfall; and, the maximum number of consecutive days with >1 mm of rainfall. However, a careful trend and multivariate correlation pattern analysis indicates that the annual total wet-day precipitation, the annual total precipitation divided by the number of wet days in a year, the mean precipitation on wet days, the number of days with ≥1 mm of rainfall, the monthly 1-day precipitation maximum, annual rainfall exceeding the 99th percentile, the annual number of days with ≥20 mm of rainfall, the maximum number of consecutive days with < 1 mm of rainfall, and the maximum number of consecutive days with >1 mm of rainfall are conditionally sufficient for the purpose of clustering municipalities based on extreme rainfall event patterns. Elevation data are available at http://iede.fjp.mg.gov.br/downloads.html and display the elevation of each municipal seat in meters above sea level (Alvares et al., 2013).
The data recorded concerning the occurrence of precipitation-related disasters were derived from two different sources. From 1991 to 2002, these data were provided by the Brazilian Atlas of Natural Disasters (BAND). BAND is a data project produced by the Center for the Study of Natural Disaster Research (CEPED) at the Federal University of Santa Catarina (UFSC), which makes this information available to Brazilian states (CEPED, 2013b). From 2003 to 2016 we used data from the time series produced by the Integrated Disaster Information System (S2iD). This data series contains information regarding records related to state of emergency (SE) and state of public calamity (ECP) declarations and is publicly available at https://s2id.mi.gov.br/paginas/series/. Furthermore, this data series was captured at the municipal level, encompassing the most frequent disasters from 1991 to 2016. In this paper we consider droughts, flash floods, and floods, as these are the types of disasters that are most sensitive to extreme precipitation events.
To identify potential social factors behind municipal resilience to precipitation-related disasters, we examined population and socio-sanitary characteristics obtained from the 2010 Brazilian Demographic Census, which was the last census conducted by the Brazilian Institute of Geography and Statistics (CEPED, 2013b) containing available data at the municipal level. For the purposes of our analysis, we selected a range of indicators, encompassing the municipal Human Development Index, the urban population percentage, the percentage of households lacking adequate access to clean water or basic sanitation, the percentage of households lacking adequate access to garbage collection and disposal, and the percentage of households with walls built using poor-quality materials. These indicators were selected as they are highly sensitive to extreme events and reflective of a municipality's degree of resilience (Menezes et al., 2018; Andrade L. et al., 2021). Here, we seek to highlight two of the (IPCC, 2014)'s central vulnerability dimensions, specifically, exposure and resilience, as adaptive capacity requires a more demanding analysis in terms of empirical indicators and appropriate longitudinal information.
The data used in this study are shown in Table 1.
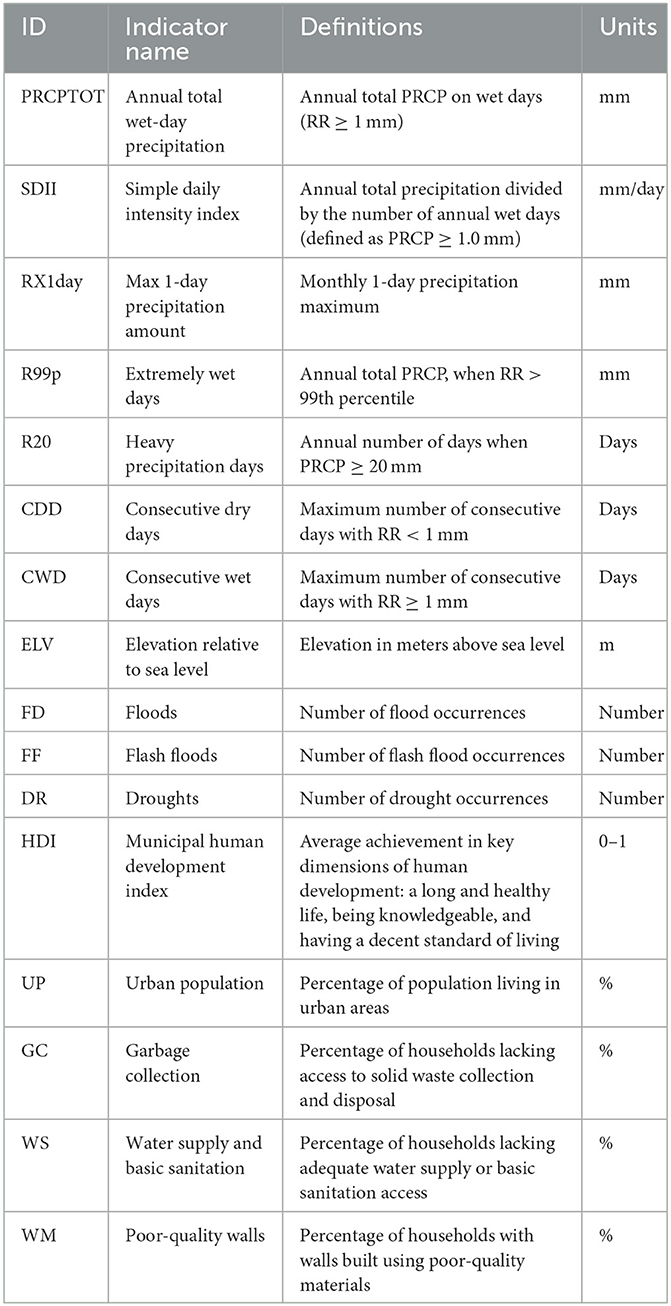
Table 1. Classes and descriptions of the study variables, comprising disaster type, climaticrmat, social, and sanitary variables.
2.3. Methods
2.3.1. The latent class model for clusters
The latent classes model for clusters (LCC) is a model-based cluster technique (Vermunt and Magidson, 2002) that assumes a multinomial latent variable x, with each category representing a specific pattern or profile. In the model specification, there are T indicators yit for each i sample element and R covariates , responsible for conditioning the occurrence of x. Indicators yit and covariates can take on any distribution (continuous, nominal, ordinal or counting). The probabilistic structure of the LCC model1 can include (or not) covariates.
In the case of a LCC without covariates, the yi density can be described as:
Where P(x) corresponds to the unconditional probability of observing the latent variable (or each of its categories). Class-specific conditional distributions, f(yi|x), can take distinct exact shapes depending on the scale of the variables. The identification of each class probabilities of occurrence is given by:
In the case of a LCC with covariates, the yi density can be described as:
Where corresponds to the probability of observing the latent variable (or each of its categories), conditioned on the levels of the covariates. Class-specific conditional distributions, , can take distinct exact shapes depending on the scale of the variables. The identification of each class probabilities of occurrence is given by:
Where , in which γ represents the effects of each covariate on the linear transformation of the probability of occurrence of each cluster. The model parameters are obtained by maximum likelihood.
To find the ideal number of profiles, we used a bootstrap p-values, pboot. The statistic −2LL(difference) estimated by bootstrap is suggested for models with continuous indicators, as in our case where all extreme rainfall indices are continuous in nature. The statistic compares a model with K clusters (under H0) with a model with K+1 clusters (under H1). The pboot is estimated as the proportion of bootstrap statistics larger than the 2LLdifference in the original sample. Confidence interval for the pboot is generated by the standard error , where B represents the number of replications. Values of pboot > 0.05 suggest a model with fewer profiles. We chose B = 5, 000 replications in this study.
In addition to the pboot criterion, we resorted on the Bayesian information criterion (BIC) and the classification error for models with K = 1, 2, … 10. If the decrease in BIC is followed by a significant increase in the error classification after including an additional cluster, the most parsimonious model is chosen.
2.3.2. Modeling strategy
We modeled the climatic-geo-socio-sanitary data using latent class analysis, applied sequentially in this study. First, we applied latent class analysis as a pure LCC model without covariates on seven extreme precipitation indices (the annual total wet-day precipitation, the mean wet-day precipitation, days with ≥1 mm of rainfall, the monthly 1-day precipitation maximum, annual rainfall exceeding the 99th percentile, the annual number of days with ≥20 mm of rainfall, the maximum number of consecutive days with < 1 mm of rainfall, and the maximum number of consecutive days with > 1 mm of rainfall), coupled with elevation data (Alvares et al., 2013). The first stage model (1S-LCC) identified extreme precipitation typologies used to classify municipalities. Second, the LCC model was used to identify clusters of precipitation-related disasters (flash floods, floods, and droughts). Subsequently, its specification was expanded to include the multinomial variable describing the extreme precipitation typologies from the 1S-LCC as an active covariate (2S-LCC). As with the 1S-LCC model, this 2S-LCC typology was used to create a classificatory multinomial variable at the municipal level. Finally, the sociodemographic and infrastructure variables (municipal HDI, the urban population percentage, the percentage of households with walls built using poor quality materials, and the percentage of households lacking adequate access to clean water, basic sanitation, or garbage collection and disposal, respectively) were simultaneously used alongside the multinomial variable representing the typology of geophysical and precipitation risk-adjusted disasters to municipality clusters based on risk exposure, hazards, and resilience attributes during a period characterized by increasingly frequent precipitation-related disasters in Minas Gerais. The final model was adjusted as a pure LCC model without active covariates (3S-LCC), but, because this disaster typology is derived from the 2S-LCC, all previous adjustments (altitude and extreme precipitation risk) are considered in the final model specification.3 All estimates were made using Latent Gold 5.1.
3. Results
Our three LCC models have indicators (and covariates, when applicable) with highly significant results for cluster identification, as measured through a Wald test for linear predictors (Table 2). For the model 1S-LCC, PRCPTOT, R20, and R99p are the three indicators whose variability is most explained by the four identified clusters (86.1, 81.4, and 75.2%, respectively). Despite its significance, the relatively low discrimination power of CDD is explained by the high clusterization of dry days in the northern and northeastern parts of Minas Gerais (Figure 2). For the 2S-LCC model, DR stands out as a variable that is almost completely explained by the four identified clusters (93.1%), while the FF and FD variables have an R2 below 30%. This result is not surprising as droughts tend to be more continuous and spatially defined events, while flooding events often vary in time and space. For the 3S-LCC model, the discrimination power of clusters for indicators is more evenly distributed across variables, which indicates the stable spatial heterogeneity of sociodemographic attributes in the state. Our three models have conditional bivariate residuals below 5, which prevents the use of direct effects in the final estimation and reinforces the quality of the models' adjustment to the data, as suggested by Vermunt and Magidson (2002).
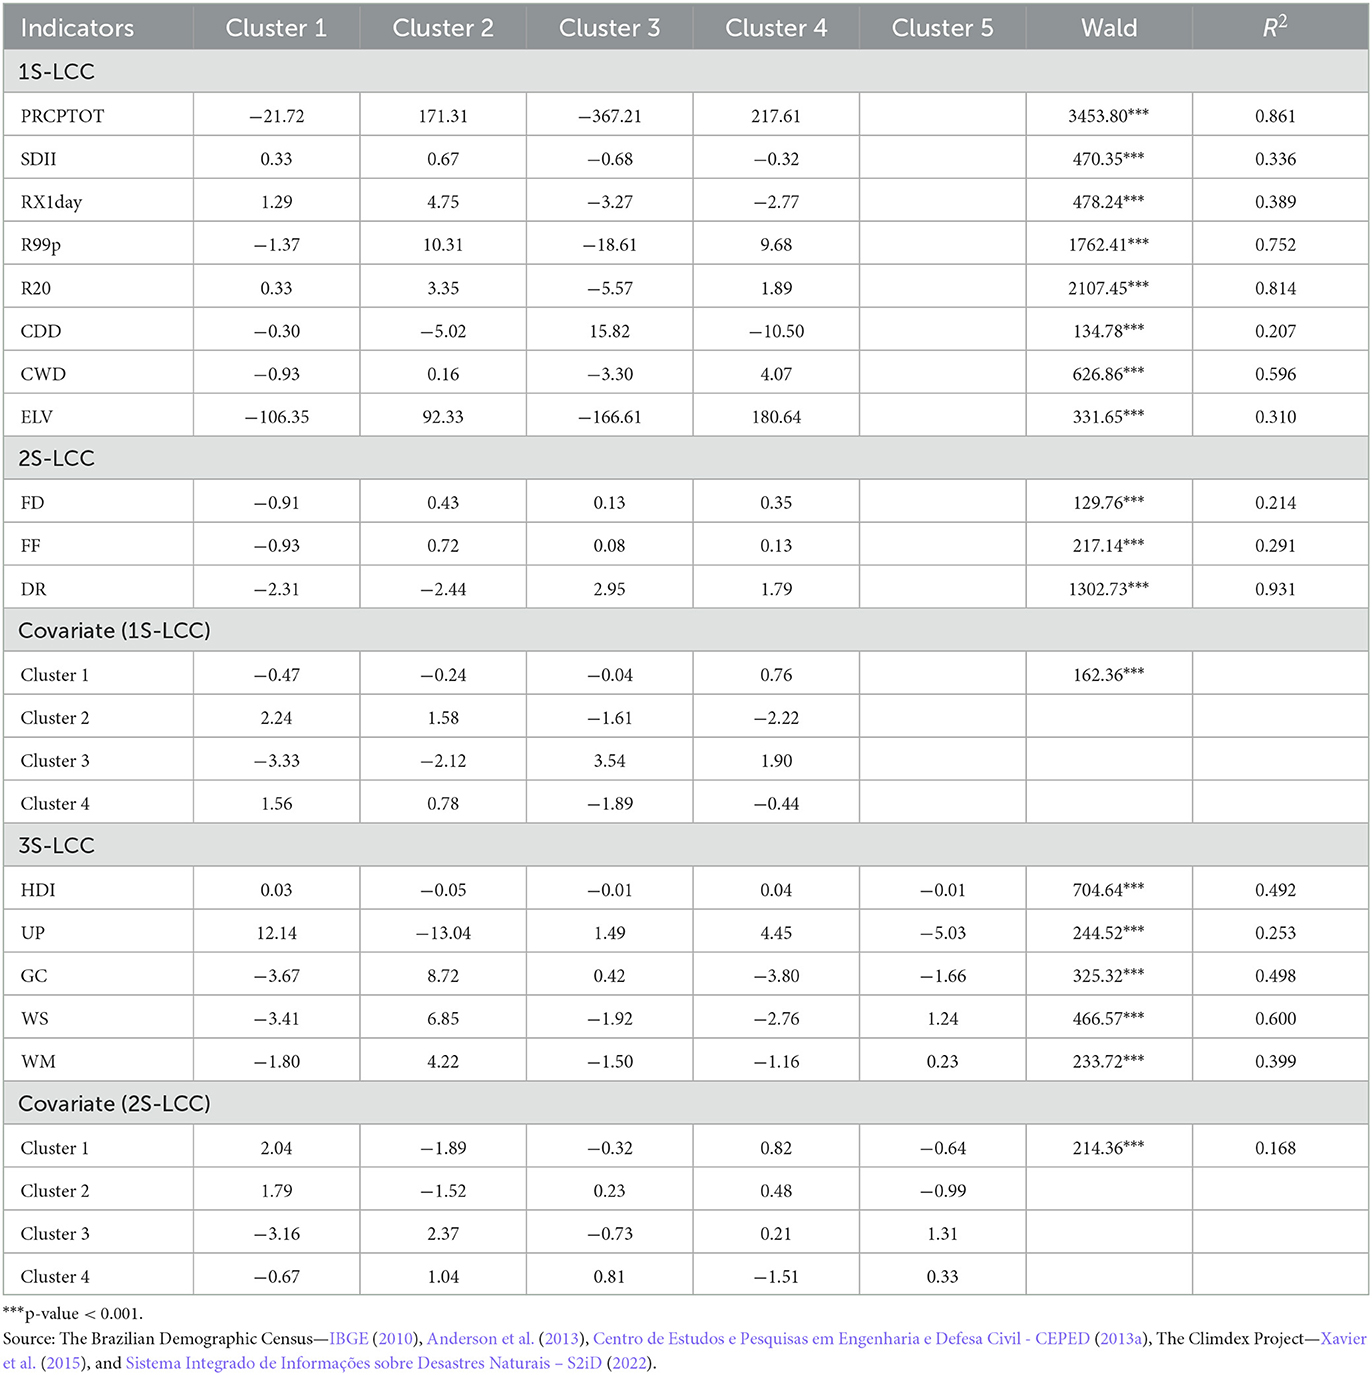
Table 2. Linear projection parameter estimates regarding the latent class profiles of extreme rainfall events, rainfall-related disasters, and sociodemographic attributes in Minas Gerais, Brazil.
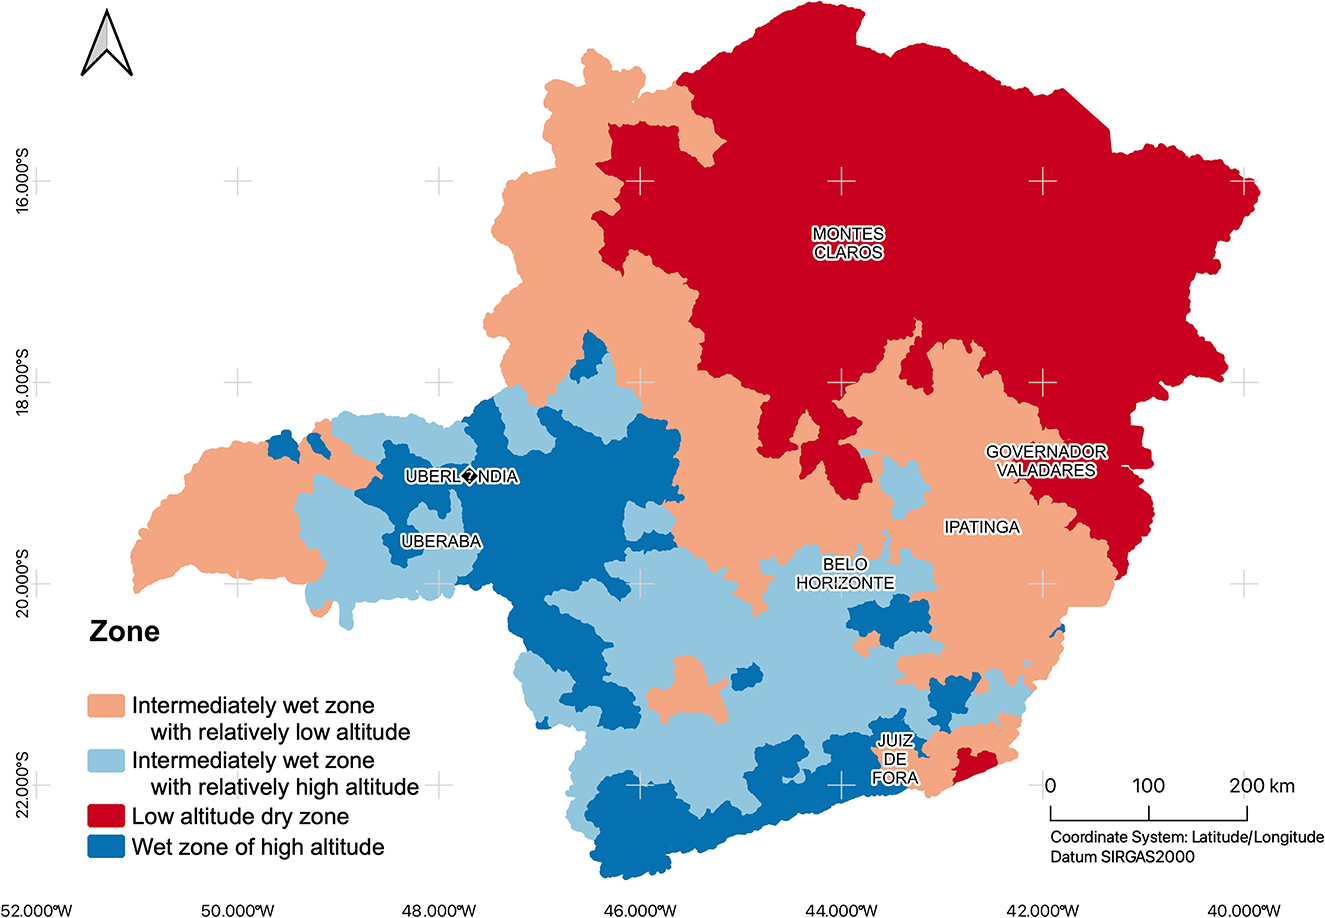
Figure 2. Altitude-adjusted homoclimatic zones for extreme precipitation events in Minas Gerais, Brazil. Source: Anderson et al. (2013), Instituto Brasileiro de Geografia e Estatística – IBGE (2020), and The Climdex Project—Xavier et al. (2015).
Based on our 1S-LCC model, we defined four types of altitude-adjusted homoclimatic zones for extreme precipitation events (Table 3—Panel 1S-LCC), comprised of: (1) a low-altitude dry zone—Cluster 3, representing 24% of municipalities; (2) a relatively low-altitude intermediately wet zone—Cluster 1, encompassing 31% of municipalities; (3) a relatively high-altitude intermediately wet zone—Cluster 2, containing 27% of municipalities, and (4) a high-altitude wet zone—Cluster 4, comprising the remaining 18% of municipalities in the state. The low-altitude dry zone, the largest cluster, possesses an average of only 13.94 consecutive wet days and the largest number of consecutive dry days across clusters (71.67 days, on average). Similarly, daily precipitation intensity was the lowest among the four clusters at 9.76 mm/day, in addition to registering only 13.23 days with more than 20 mm of precipitation. Cluster 1's municipalities are located in low altitude areas at an average of 612.99 meters above sea level and possess an average cumulative annual precipitation as low as 952.38 mm. In sharp contrast, the high-altitude wet zone is the smallest cluster, comprising 154 municipalities, and is characterized by an average of 21.31 consecutive wet days and the smallest number of consecutive dry days across all clusters (45.34 days, on average). Cluster 4's municipalities possess an average cumulative annual precipitation as high as 1,537.19 mm and are located in areas 960.25 meters above sea level, on average.
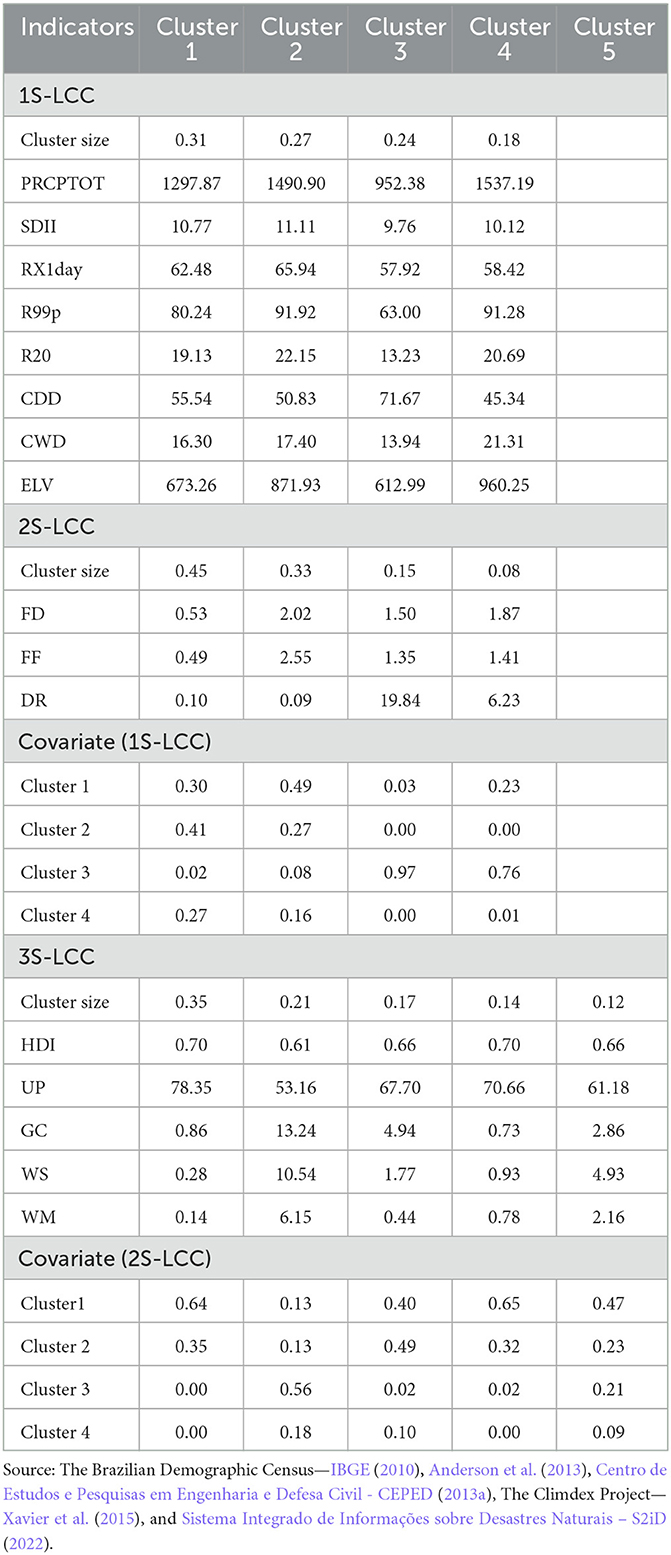
Table 3. Estimates of conditional averages for indicators and covariates regarding the latent class profiles of extreme rainfall events, rainfall-related disasters, and sociodemographic attributes in Minas Gerais, Brazil.
Interestingly, our 1S-LCC model identified two transition zones. The relatively low-altitude intermediately wet zone combines the attributes of the wet zone cluster, in terms of precipitation frequency and intensity, but is located in areas as low as 673.26 meters above sea level. It is also the largest cluster, encompassing 264 municipalities scattered diagonally across Minas Gerais from northwest to southeast, in addition to including the far western part of the Triângulo Mineiro. It is a typical transition zone, dividing the state into wet (south and southeast) and dry (north and northeast) areas. The second transition zone, called the relatively high-altitude intermediately wet zone, encompasses 230 municipalities located mainly in the southern and central-western reaches of the state. It is scattered between the high-altitude wet zone, with an average altitude of 871.93 meters above sea level. It displays slightly lower precipitation levels, but possesses a precipitation intensity that is greater than that of the wet zone. Figure 2 represents the spatial distribution of the four zones estimated using our 1S-LCC model.
The 2S-LCC model was fitted using the classification results from the 1S-LCC. Before describing the estimated results, it is important to understand temporal trends in disasters across Minas Gerais. Our results show an overall increase in the occurrence of precipitation-related disasters in the state, with municipalities located in the northern region of the state being particularly affected. Minas Gerais registered 5,553 natural disasters from 1991 to 2016, including 3,006 (54.1%) dry spells or droughts, 1,166 flash foods (21.0%), and 1,078 (19.43%) floods. Therefore, precipitation-related disasters represent 94.5% of all natural disasters registered during this period. These events are also distributed in a spatially uneven manner. While floods are more common in the eastern parts of Minas Gerais (especially in low-lying municipalities or those located in valleys), flash floods are more concentrated in highly urbanized areas, where the excess use of asphalt limits water drainage, particularly in the Belo Horizonte Metropolitan Area, located in the center of the state. On the other hand, droughts are entirely clustered in the northern portion of Minas Gerais, which belongs to the Brazilian semi-arid region. These disasters are not only more spatially defined, but also are more severe in intensity, frequency, and duration.
These disaster events combined with the homoclimatic zones for extreme precipitation produced four areas (zones) of precipitation-related disasters (Table 3—Panel 2S-LCC), encompassing: (1) low risk—Cluster 1, representing 45% of municipalities; (2) high risk of excess precipitation—Cluster 2, encompassing 33% of municipalities; (3) intermediate risk of precipitation deficit and excess—Cluster 4, containing 8% of municipalities; and, (4) high risk of precipitation deficit—Cluster 3, comprising the remaining 15% of municipalities in the state. On average, the low-risk zone displayed less than one extreme rainfall event of each type between 1991 and 2016 and is predominantly located in the western and southwestern parts of Minas Gerais. Across clusters, its municipalities possess the highest relative probability of being located in the high-altitude wet zone (0.27). The high risk of excess precipitation zone is the second largest and has registered an average of slightly more than two flood and flash flood events, but virtually no drought episodes, from 1991 to 2016. These municipalities, mostly located in the state's southern and eastern reaches, have the highest probability of belonging to the relatively low-altitude intermediately wet zone. The high risk of precipitation deficit zone is not only smaller in size, but is spatially clustered in the state's semi-arid regions, composed of parts of northern and northwestern Minas Gerais. Clusters pertaining to this zone have registered an alarming average of almost 20 droughts across the dataset period, in addition to having experienced more than two flooding episodes. Finally, the intermediate risk of precipitation deficit and excess zone, the smallest in area, has experienced an average of almost seven droughts and more than three flooding events during the 25-year period encompassed by the study data. It possesses the highest probability of belonging to the low-altitude dry zone, encompassing municipalities along the fringes of the dry zone. Figure 3 represents the spatial distribution of the four zones estimated using our 2S-LCC model.
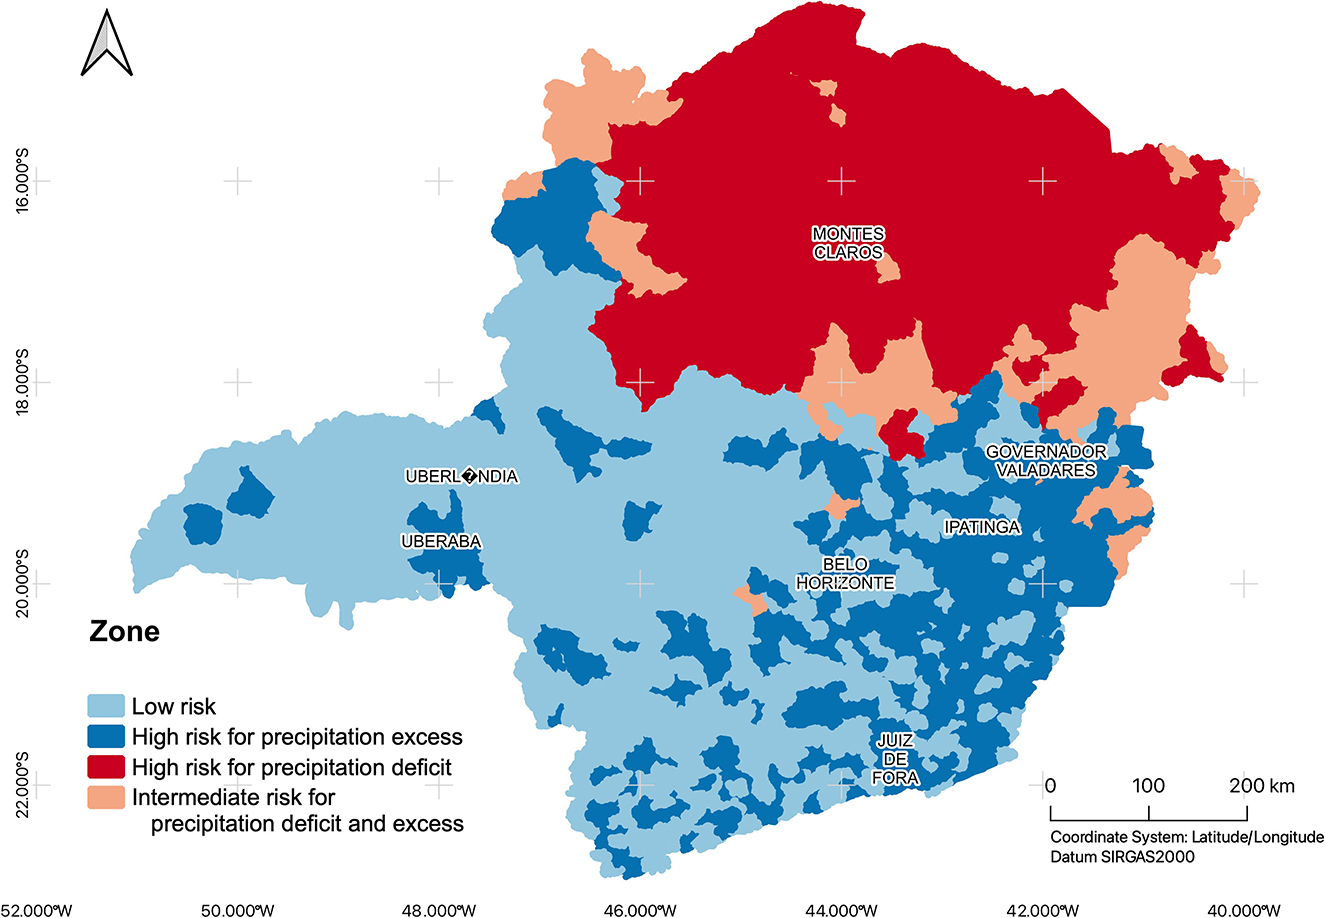
Figure 3. Precipitation-related disaster zones in Minas Gerais, Brazil. Source: Anderson et al. (2013), Instituto Brasileiro de Geografia e Estatística – IBGE (2020), and The Climdex Project—Xavier et al. (2015).
The 3S-LCC model combines results from the 2S-LCC with municipalities' sociodemographic and infrastructure attributes in order to construct sociodemographic and climate adjusted-disaster vulnerability profiles. The model identified five distinct profiles (Table 3—Panel 3S-LCC and Figure 4), comprised of: (1) low sociodemographic and climate/disaster vulnerability—Cluster 1, representing 35% of municipalities; (2) high sociodemographic and rainfall deficit vulnerability—Cluster 2, encompassing 21% of municipalities; (3) low sociodemographic and intermediate excess rainfall vulnerability—Cluster 3, containing 17% of municipalities; (4) low sociodemographic and high excess rainfall vulnerability—Cluster 4, englobing 14% of municipalities; and, (5) intermediate sociodemographic and mid-to-low rainfall deficit vulnerability—Cluster 5, comprising the remaining 12% of municipalities in the state.
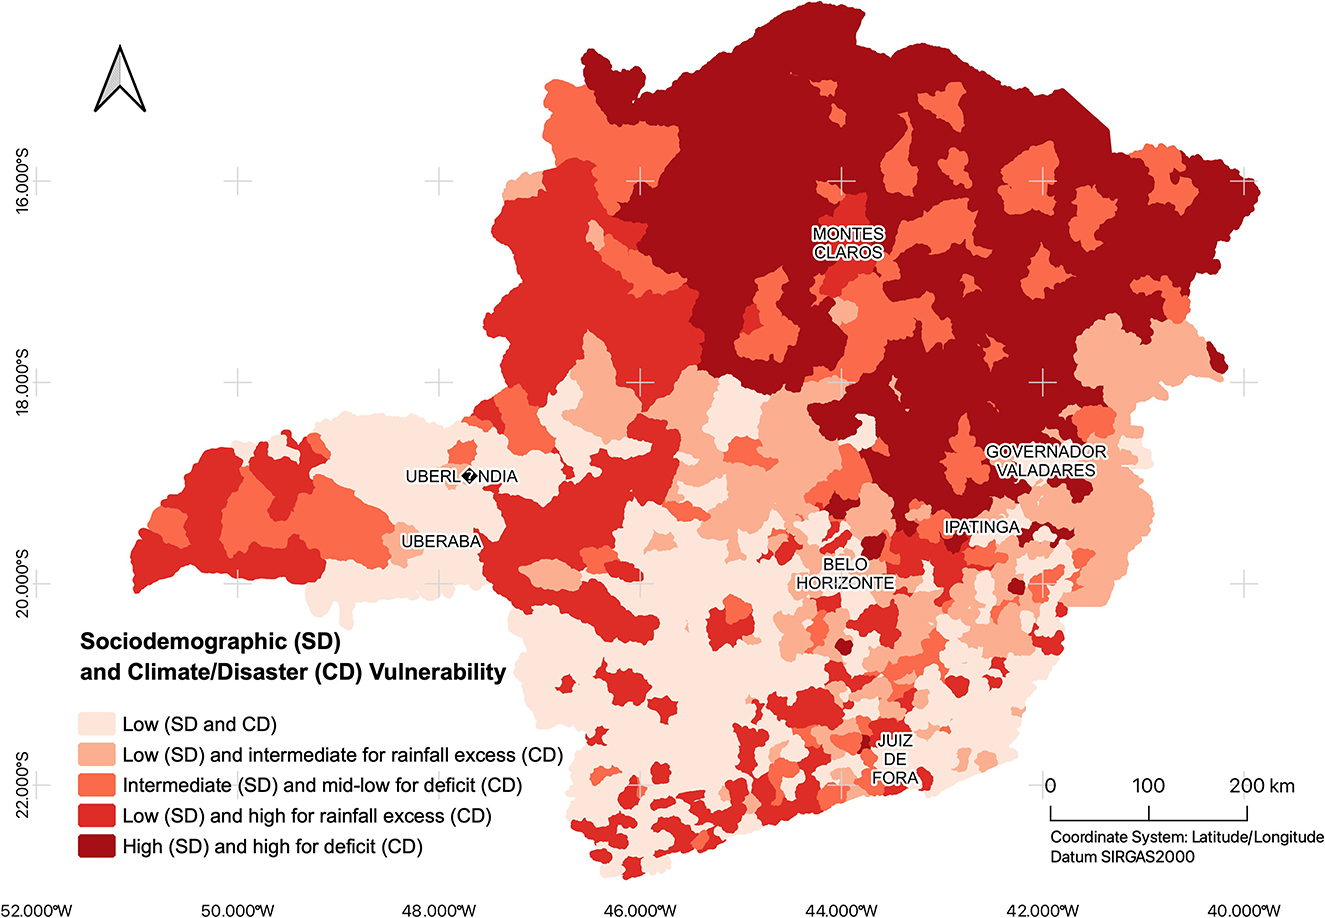
Figure 4. Sociodemographic and climate-adjusted disaster vulnerability zoning in Minas Gerais, Brazil. Source: Anderson et al. (2013), Instituto Brasileiro de Geografia e Estatística – IBGE (2020), and The Climdex Project— Xavier et al. (2015).
The low sociodemographic and climate/disaster vulnerability profile comprised the largest cluster, with an average of 78.4% of its population living in urban areas and almost universal basic sanitation and garbage collection and disposal coverage. Not surprisingly, 64% of its municipalities belong to the low-risk disaster area, while the remaining 35% pertain to the area at high risk of excess precipitation. No municipality belonging to this profile is located in areas of precipitation deficit. This profile is predominant in the southern and southwestern parts of Minas Gerais, as well as in the Triângulo Mineiro. The high sociodemographic and rainfall deficit vulnerability profile, the second largest, contains municipalities displaying the worst sociodemographic and infrastructure characteristics. It is predominantly located in areas at high risk of precipitation deficit (56% of its municipalities), and it is mostly clustered in low-altitude areas in the northern and northeastern parts of the state. The 3S-LCC model showed that although semi-arid parts of Minas Gerais appear to be relatively homogenous concerning the occurrence of extreme weather events and disasters (Figures 2, 3), they are somewhat diverse in terms of their vulnerability. In Figure 4, municipalities with intermediate levels of sociodemographic vulnerability and mid-to-low levels of rainfall deficit vulnerability are scattered throughout the semi-arid parts of the state, with a near majority of these municipalities (49%) located in the high risk of excess precipitation zone. In summary, the 3S-LCC model's results suggest that within the semi-arid areas of Minas Gerais (including the Caatinga biome), cities with better infrastructure and sociodemographic profiles are more resilient to droughts. In the richer parts of the state, floods are still a concern in areas where incomplete urbanization transitions may threaten resilience to extreme precipitation events as they increase in intensity in conjunction with the advance of climate change.
4. Discussion
Disaster research has historically used the term “natural disaster” to refer to “a serious disruption of the functioning of a community or a society at any scale due to hazardous events interacting with conditions of exposure, vulnerability, and capacity, leading to one or more of the following: human, material, economic, and environmental losses and impacts” (UNISDR, 2016). The use of “natural” to refer to the occurrence of events as diverse as earthquakes, volcanic eruptions, floods, droughts, and landslides disguises a human dimension that links hazards with risk production, management, and reduction. On the one hand, humans can produce risks that result in disruptive events, which could otherwise be viewed as hazards (or latent disasters). These risks are typically called technological disasters, such as dam failures, atomic reactor leaks, and water pollution due to industrial discharge (Andrade L. et al., 2021). Other “produced” risks include anthropogenic changes in climatic conditions, which can ultimately lead to the increased occurrence and intensification of disasters, such as floods, droughts, and landslides (Quintão et al., 2017; Avila-Diaz et al., 2022).
On the other hand, vulnerability research emerges as an area of scientific and political interest regarding the degree to which disaster risks are addressed via management and reduction strategies. In the above definition provided by the UNISDR (2016), hazards transform into risks because of omission or commission, highlighting the role of socioeconomic and infrastructure attributes, as well as that of public policies (Chmutina and von Meding, 2019). In this regard, areas that are socioeconomically advantaged may be better equipped to face the consequences of disasters with higher degrees of resilience (IPCC, 2014; Andrade L. et al., 2021). A not so commonly emphasized dimension of disasters is the intricate connection between climatic systems, extreme weather events, and disasters in human populations. Given that contemporary climate change is increasingly the result of human activities, risk production derived from these activities intensifies the link between extreme weather events and the temporal/spatial occurrence of climate-sensitive disasters (Lyra et al., 2017; Fernandes and Rodrigues, 2018; Costa et al., 2021). In turn, this results in differing levels of impacts depending on the degree of socioeconomic development. Although it sounds circular, the climate-disaster-vulnerability connection emphasizes the importance of separating disaster research from its “natural” dimension. In this regard, Chmutina and von Meding (2019)'s suggestion to opt for the singular term “disaster” when analyzing what are commonly labeled as “natural disasters” proves to be appropriate in most contexts. In the case of climate-induced disasters, we argue that the terms “climate” or “extreme events” help qualify disaster research and reinforce the role of human agency in producing risks and being affected by events induced by changes in extreme climatic conditions.
There are three major axes within the climate-disaster-vulnerability research agenda. The first axis seeks to conceptualize how climate and social attributes are mediated by how hazards morph into disasters. Some examples are Cutter (1996), Adger and Kelly (1999), Adger (2006), Brooks et al. (2006), Eakin and Luers (2006), Füssel (2010); Wolf et al. (2013), Chmutina and von Meding (2019), Melchior et al. (2020), and UNDRR (2020). Most of these studies date to the 2000s, when definitions and mechanisms were being discussed in the wake of waves of general concern regarding global environmental change in the 1980s and 1990s, especially related to climate change (Pebley, 1998). Concerning Brazil, Engle and Lemos (2010), Barbieri (2022), and Barbieri and Pan (2022) have made important contributions to this theoretical discussion. In contrast with earlier conceptual efforts, these more recent studies have advanced climate-disaster-vulnerability research by explicitly incorporating a demographic analysis into the concepts of vulnerability as a central mechanism linking climate change, hazards, risks, and disasters within human populations.
A second axis comprises studies that propose indices encompassing the multiple dimensions of the climate-disaster-vulnerability agenda. Based on a wide range of techniques and dimensionality, these efforts to summarize complex relationships into a single measure appropriate for diagnostics and monitoring represent genuine and constructive results of data availability and theoretical advancement. Sullivan and Meigh (2005), Füssel (2010); Sena et al. (2017), and Stennett-Brown et al. (2019) are examples of the value of this type of research, as they have developed very broad and comprehensive reviews of indicators and their potential uses. In Brazil, there is a growing, yet well-founded, literature regarding multidimensional indices related to climate change, disasters, and social vulnerability (Hull and Guedes, 2013; Barbieri and de Souza, 2015; Debortoli et al., 2017; Quintão et al., 2017; Menezes et al., 2018; Andrade L. et al., 2021). These recent studies apply differing techniques, such as the Grade of Membership method (Hull and Guedes, 2013; Andrade L. et al., 2021), the Alkire-Foster approach (Barbieri and de Souza, 2015; Andrade L. et al., 2021), and utilizing the weighted averages of normalized sub-indices (Debortoli et al., 2017; Quintão et al., 2017; Menezes et al., 2018).
A third axis encompasses studies that link climate data (usually measured in a continuous resolution, based on raster data) with disaster and population data (mostly discrete in their measurement and availability). The major challenge facing these studies is how to link climate data, which follow an Earth systems logic, with population data that are captured and measured in artificial administrative units (Avila-Diaz et al., 2022). Two major challenges manifest themselves in the form of spatial resolution (raster vs. polygonal/point discrete data) and temporal resolution (how long the data must be monitored to detect changes). Most population data reference a limited time frame, while climatic changes are intrinsically measured in long periods, known as climatological normals (Marengo et al., 2021). Some studies in Brazil have made creative use of statistical and spatial techniques to couple these different data sources when analyzing the impact of climate change or climate extremes on population-level vulnerability, both multidimensionally (Barbieri and de Souza, 2015; Menezes et al., 2018) or with a dimensional focus, such as on health indicators (Menezes et al., 2018; Andrade L. et al., 2021). For example, Andrade L. et al. (2021) sampled climate data points from the Climdex Project, available in a 0.25° × 0.25° resolution, to discretize information on climate extremes at the mesoregional level. These discretized data points, encompassing a time series of 27 extreme weather indices, were modeled with the Grade of Membership method to identify extreme homoclimatic zones, a strategy previously implemented by Silveira Marinho et al. (2020) to identify climate zones in Brazil based on meteorological data series.
The interaction between homogenous climatic zones and socioeconomic contexts helps identify climate vulnerability hotspots (Menezes et al., 2018; Avila-Diaz et al., 2022). Vulnerability reduction depends on the ability of each society to improve protective mechanisms (adaptive capacity), which include private insurance (contractual insurance policies, self-protection, information seeking, home improvement) and public technologies (such as extreme weather alerts from official climate agencies). A key motivation for improving protective behaviors is related to the level of information concerning the occurrence and likely damage of climatic events. Theoretical findings from Raad et al. (2019) show that the demand for insurance against climate-induced disasters declines due to climate uncertainty. Building on a previous study, Guedes et al. (2019) used time series data obtained from meteorological stations, coupled with Digital Elevation Models (DEM), data on flooding events, and primary survey data on local perceptions of meteorological changes to understand the extent of welfare losses due to degree of perception errors concerning disaster occurrence. The dissonance between the perception of and the actual occurrence of disasters led to a major decline in insurance acquisition, causing an aggregate welfare loss. Araújo et al. (2020) built upon this analysis by including the likelihood of adopting protective measures against flooding hazards using a Bayesian approach. Their results suggest that agents favor insurance transfers over insurance premiums, which has direct implications on taxation flexibility and efficiency. Greater efforts to enhance and expand scientific communication regarding climate change and its consequences may help reduce the uncertainty surrounding climate-induced events. This could lead to the more efficient adoption of preventive measures, preventing unnecessary losses in agents' wellbeing due to incomplete information (Guedes et al., 2019).
Our study contributes to this third axis in four distinct ways by: (1) linking climate and population data with a grid point sampling strategy, as previously implemented by Silveira Marinho et al. (2020) and Andrade L. et al. (2021); (2) focusing on extreme climate indices instead of meteorological data, which more appropriately report climate-sensitive disasters; (3) using zoning instead of relying exclusively on a multidimensional index; and, (4) utilizing latent class analysis instead of a simpler multivariate technique, such as grade of membership or principal component analysis. In this regard, latent class analysis is model-based and fully probabilistic, allowing the researcher to have more control over model fitting and increasing result replicability. Furthermore, the sequential empirical strategy used in this study allowed us to validate results from each model step using external data and previous studies on climate zoning (Santos et al., 2015, 2016; Oliveira et al., 2017; Rodrigues et al., 2019; Silveira Marinho et al., 2020), in addition to the spatial distribution of disasters in Brazil (CEPED, 2013b; de Freitas et al., 2014) and Minas Gerais, in particular (Sardinha et al., 2016; Quintão et al., 2017).
There are very few studies on climate zoning and vulnerability to climate-induced disasters concerning the state of Minas Gerais, although there are some studies that examine Brazil as a whole. For example, Torres et al. (2012) estimated socio-climatic hotspots in Brazil based on extreme climate indices and socioeconomic data (particularly, the Human Development Index and population density). Their so-called Regional Climate Change Index (RCCI) revealed northwestern Minas Gerais to be a climate change hotspot. When combined with socioeconomic data, they found that Belo Horizonte, the capital of Minas Gerais, emerged as a national hotspot among state capitals concerning climate change vulnerability. When comparing data regarding monthly precipitation and surface air temperature averages for 1961–1990 and 2071–2100, Torres et al. (2012)'s results differ from ours because their focus on future climate change sensitivity hides the ability to fully discern the heterogeneity of current climate vulnerability. Furthermore, their results were not able to spatially map climate-induced disasters—events that are more readily translated into welfare losses (Guedes et al., 2019; Araújo et al., 2020). Our results show that cities with better developed infrastructure and more advantaged sociodemographic profiles located in semi-arid regions of Minas Gerais are more resilient to droughts. We also found that areas in the very dry northern parts of the state are highly susceptible to flooding due to a combination of complex topography and disadvantaged socioeconomic conditions. In richer areas, floods are still a concern where incomplete urbanization transitions may diminish resilience to these events as they increase in intensity alongside the advance of climate change. From a policy perspective, interventions should prioritize areas with a low ability to respond to disasters, rather than focus exclusively on event occurrence likelihoods. Minas Gerais possesses disaster hotspots scattered across municipalities with varying response capabilities, requiring a birds-eye approach to any intervention.
A more recent study from Debortoli et al. (2017) includes data on flooding vulnerability, in addition to other environmental and socioeconomic variables. Utilizing a multidimensional index approach as an average of normalized sub-indices, their results produce a scenario of heterogeneity very similar to what was found by our study for the state of Minas Gerais. Any divergences can mainly be explained by how disaster data differ between both studies. While Debortoli et al. (2017) use the predefined Flooding Vulnerability Index obtained from the Brazilian National Water Agency, we use data on disaster event occurrences. This is a subtle, but important, difference, as our findings examine real-life disasters as opposed to analyzing potential disaster areas. Moreover, by applying latent class analysis, we have more control over model fit and predictive ability, while avoiding averaging indices that may otherwise reduce the potential to identify local heterogeneities (Quintão et al., 2017).
Despite enhancing the literature on climate-induced disaster vulnerability, our findings have some limitations. First, the use of grid data for extreme climate indices on a 0.25° × 0.25° resolution limits the level of detail concerning local climatic conditions, which other studies have attempted to address by comparing Earth system models with finer resolutions (Avila-Diaz et al., 2020, 2022). Second, the procedure for sampling grid point data for climate indices was based on a single point per grid, with this point coinciding with the centroid of each municipal seat. Sampling multiple points with different weights may improve extreme climate measures to better represent the entire municipality and reduce urban bias. Third, because the latent class model we use is not longitudinal, we accounted for the cumulative number of each disaster event (droughts/dry spells, floods, and flash floods). In this regard, any bias would be related to the timing of the events, which could occur over different years, rendering a longitudinal cluster approach more appropriate. However, the study's sociodemographic data are only available on a cross-sectional basis, impeding the use of a fully Markovian approach. Fourth, data on socioeconomic and infrastructure characteristics are based on the 2010 Brazilian Demographic Census, which is already 12 years old. However, this is the sole and most recent socioeconomic data source available at the municipal level, as data collection for the current 2022 Census was delayed by the COVID-19 pandemic and was still underway as of the publication of this study. Finally, our climate zoning was based solely on extreme precipitation indices, as our analysis exclusively focused on hydrometeorological disasters. In this regard, our study excluded climate-sensitive disasters that are more dependent on temperature and wind conditions, signifying that the zoning presented in this study may not serve as a general guide to any type of climate-induced disaster.
Quintão et al. (2017) is the only study specific to Minas Gerais that is readily comparable to ours. Despite differences in indicators and methods, their results bear close resemblance to our findings. Their proposed exposure index (including natural vegetation coverage and the number of weather-induced disasters) shows higher levels of exposure along the state's northeastern and eastern borders. This spatial pattern contrasts with Figure 3 from our study because we condition disaster zoning on extreme rainfall indices. In addition to border areas, we found that areas in the north of Minas Gerais and some cities scattered throughout the southern and western parts of the state were also disaster hotspots. Our approach allows for a more heterogeneous characterization of hotspot areas, as we differentiate high-risk areas of both precipitation deficit and excess. This is important as disasters related to water deficits and excess not only possess varying durations, but also occur at divergent spatial locations, with disasters resulting from excess precipitation predominantly occurring in more socioeconomically advantaged areas.
In contrast with Quintão et al. (2017) and Avila-Diaz et al. (2020, 2022), which based their climate data on meteorological station averages and projections from regionalized Earth system models, we utilized climate data developed by Xavier et al. (2015), which obtained raw data from the National Institute of Meteorology (INMET), together with data from other public institutions (such as the Brazilian National Water Agency's São Francisco River Basin data). Our approach also avoids analyses based on multidimensional indices, instead making use of probabilistic models. As these models are also classification devices, we can allocate units (municipalities, regions, etc.) into vulnerability classes or use the estimated probabilities of each latent class as sub-indices adept for creating a model-based multidimensional index. However, we avoided utilizing the aforementioned strategy, as the zoning technique we adopted better facilitates comparisons with mapping from the prior literature.
5. Conclusion
Minas Gerais is frequently subject to climate-induced disasters. Data indicate that Minas Gerais suffered from more disasters than any other Brazilian state over the previous 25 years, which were characterized by an increasing number of disasters in both Minas Gerais and Brazil, as a whole. We found an increase in precipitation-related disasters, with municipalities located in northern Minas Gerais being particularly affected. We identified four homoclimatic zones, encompassing a low-altitude dry zone, a relatively low-altitude intermediately wet zone, a relatively high-altitude intermediately wet zone, and a high-altitude wet zone that are distributed across regions possessing varying risk levels for precipitation-related disasters (low risk, high risk of excess precipitation, intermediate risk of precipitation deficit and excess, and high risk of precipitation deficit). When these areas were examined in conjunction with sociodemographic and infrastructure attributes, we were able to identify higher levels of heterogeneity in areas of Minas Gerais that are traditionally treated as homogeneous zones from a climatic (semi-arid regions) or socioeconomic (the richer southern part of the state) standpoint.
Due to its geophysical configuration and high dependence on mining, the state of Minas Gerais is also highly vulnerable to technological disasters. In the last decade, two major dam collapses have resulted in catastrophic environmental, socioeconomic, cultural, and human impacts (Andrade M. V. et al., 2021; Dias and Verona, 2021). The Mariana and Brumadinho dam failures are considered to be the two largest socioenvironmental disasters in Brazilian history (Rotta et al., 2020; Andrade M. V. et al., 2021). In recent decades, the state has experienced an increasing number of hydrometeorological disasters on top of these tragic technological dam failures. These recent disaster trends in Minas Gerais highlight the importance of studies concerning disaster vulnerability due to its high levels of regional heterogeneity, wide range of climatic, topographical, and environmental systems, and the importance of tourism, mining, and agriculture to the state's economy (Barbieri and de Souza, 2015). Correctly addressing these challenges is key to maximizing municipalities' resilience to threats posed by the future evolution of climatic conditions and recurrent climate-induced disasters.
Data availability statement
The original contributions presented in the study are included in the article/supplementary material, further inquiries can be directed to the corresponding author.
Author contributions
All authors listed have made a substantial, direct, and intellectual contribution to the work and approved it for publication.
Acknowledgments
We thank Shane Landry for the very careful English proofreading of the revised manuscript.
Conflict of interest
The authors declare that the research was conducted in the absence of any commercial or financial relationships that could be construed as a potential conflict of interest.
Publisher's note
All claims expressed in this article are solely those of the authors and do not necessarily represent those of their affiliated organizations, or those of the publisher, the editors and the reviewers. Any product that may be evaluated in this article, or claim that may be made by its manufacturer, is not guaranteed or endorsed by the publisher.
Footnotes
1. ^Direct effects, which model residual covariance between indicators and between indicators and covariates, even if conditioned in x, can be used. According to Vermunt and Magidson (2002), bivariate residuals that are large (above 5, for instance), suggests that the conditional covariance between indicators or indicators and covariates are not explained by the latent variable, x. Thus, these covariances must be modeledcase of a LCC without covariates explicitly. In our case, our models specifications did not require the use of direct effects, as residuals were very low.
2. ^To incorporate direct effects, the T indicators are divided in H groups. Thus, the yi density becomes: . Thus, indicators belonging to the same H set remain correlated after the conditionality in x, but those belonging to distinct H will be conditionally independent.
3. ^There are two principal strategies used to link precipitation-related disaster zones to socioeconomic attributes. The first strategy is to perform a latent class analysis of socioeconomic indicators as an LC model without covariates. Once the model is fit, posterior probabilities of class membership are used against the multinomial variable created from the 2S-LCC using an ANOVA or a multinomial regression. Although commonly used, Bolck et al. (2004) demonstrated that this strategy underestimates the association between external variables and class membership. In this vein, Vermunt (2010) proposed an adjustment based on maximum likelihood estimation. This study implemented both BCH and ML adjustments utilizing the Latent Gold 5.1 software. The second strategy involves modeling both socioeconomic indicators and the multinomial variable created from the 2S-LCC as a single LC model without covariates and with robust standard errors. As the model uses a multivariate distribution of indicators (encompassing the socioeconomic variables and the multinomial variable from 2S-LCC), the result is a joint, rather than conditioned, membership to both dimensions (precipitation-related disasters and socioeconomic variables). Since the multinomial variable for the 2S-LCC was created from a model with covariates, and the covariate is a multinomial model from the 1S-LCC, there is no need to include extreme precipitation variables in the 3S-LCC, once the multinomial variable from the 2S-LCC has been included as an indicator.
References
Adger, W. N. (2006). Vulnerability. Glob. Environ. Change 16, 268–281. doi: 10.1016/j.gloenvcha.2006.02.006
Adger, W. N., and Kelly, P. M. (1999). Social vulnerability to climate change and the architecture of entitlements. Mitig. Adapt. Strat. Glob. Change 4, 253–266. doi: 10.1023/A:1009601904210
Alcántara-Ayala, I. (2002). Geomorphology, natural hazards, vulnerability and prevention of natural disasters in developing countries. Geomorphology 47, 107–124. doi: 10.1016/S0169-555X(02)00083-1
Alvares, C. A., Stape, J. L., Sentelhas, P. S., de Moraes Gonçalves, J. L., and Sparovek, G. (2013). Köppen's climate classification map for Brazil. Meteorologische Zeitschrift 22, 711–728. doi: 10.1127/0941-2948/2013/0507
Anderson, G. B., Bell, M. L., and Peng, R. D. (2013). Methods to calculate the heat index as an exposure metric in environmental health research. Environ. Health Perspect. 121, 1111–1119. doi: 10.1289/ehp.1206273
Andrade, L., Guedes, G. R., Noronha, K. V. M. S., Santos e Silva, C M., Andrade, J.P., and Martins, A. S. F. S. (2021). Health-related vulnerability to climate extremes in homoclimatic zones of Amazonia and Northeast region of Brazil. PLoS ONE 16, e0259780. doi: 10.1371/journal.pone.0259780
Andrade, M. V., de Souza Noronha, K. V. M., Santos, A. S., de Souza, A., Guedes, G. R., Campolina, B., et al. (2021). Estimation of health-related quality of life losses owing to a technological disaster in Brazil using EQ-5D-3L: a cross-sectional study. Value Health Reg. Issues 26, 66–74. doi: 10.1016/j.vhri.2021.02.003
Araújo, P., Guedes, G., and Loschi, R. (2020). “A bayesian modeling approach to private preparedness behavior against flood hazards,” in Demography of Population Health, Aging and Health Expenditures, eds C. H. Skiadas and C. Skiadas (Springer). doi: 10.1007/978-3-030-44695-6_26
Ávila, A., Justino, F., Wilson, A., Bromwich, D., and Amorim, M. (2016). Recent precipitation trends, flash floods and landslides in southern Brazil. Environ. Res. Lett. 11, 114029. doi: 10.1088/1748-9326/11/11/114029
Avila-Diaz, A., Benezoli, V., Justino, F., Torres, R., and Wilson, A. (2020). Assessing current and future trends of climate extremes across Brazil based on reanalyses and earth system model projections. Clim. Dyn. 55, 1403–1426. doi: 10.1007/s00382-020-05333-z
Avila-Diaz, A., Torres, R. R., Zuluaga, C. F., Cerón, W. L., Oliveira, L., Benezoli, V., et al. (2022). Current and Future Climate Extremes Over Latin America and Caribbean: Assessing Earth System Models from High Resolution Model Intercomparison Project (HighResMIP), Earth Systems and Environment. Springer International Publishing. doi: 10.1007/s41748-022-00337-7
Barbieri, A. F. (2022). Contribuições teóricas para uma demografia dos desastres no Brasil, 1–29. doi: 10.20947/S0102-3098a0227
Barbieri, A. F., and de Souza, K. (2015). Population transitions and temperature change in Minas Gerais, Brazil: a multidimensional approach. Rev. Bras. Estud. Popul. 32, 461–488. doi: 10.1590/S0102-3098201500000028
Barbieri, A. F., and Pan, W. K. (2022). Population Dynamics and the Environment: The Demo-climatic Transition, International Handbooks of Population (Springer). doi: 10.1007/978-3-031-02040-7_6
Barcellos, P. C. L., and Cataldi, M. (2020). Flash flood and extreme rainfall forecast through one-way coupling of WRF-SMAP models: Natural hazards in Rio de Janeiro State. Atmosphere 11, 834. doi: 10.3390/atmos11080834
Bezerra, B. G., Silva, L. L., Santos e Silva, C. M., and Gomes de Carvalho, G. (2019). Changes of precipitation extremes indices in São Francisco River Basin, Brazil from 1947 to 2012. Theor. Appl. Climatol. 135, 565–576. doi: 10.1007/s00704-018-2396-6
Bolck, A., Croon, M. A., and Hagenaars, J. A. (2004). Estimating latent structure models with categorical variables: one-step vs. three-step estimators. Polit. Anal. 12, 3–27. doi: 10.1093/pan/mph001
Brondízio, E. S., de Lima, A. C. B., Schramski, S., and Adams, C. (2016). Social and health dimensions of climate change in the Amazon. Ann. Hum. Biol. 43, 405–414. doi: 10.1080/03014460.2016.1193222
Brooks, N., Adger, W. N., and Kelly, P. M. (2006). The determinants of vulnerability and adaptive capacity at the national level and the implications for adaptation. Glob. Environ. Change 15, 151–163. doi: 10.1016/j.gloenvcha.2004.12.006
Bunker, A., Wildenhain, J., Vandenbergh, A., Henschke, N., Rocklöv, J., Hajat, S., et al. (2016). Effects of air temperature on climate-sensitive mortality and morbidity outcomes in the elderly; a systematic review and meta-analysis of epidemiological evidence. EBioMedicine 6, 258–268. doi: 10.1016/j.ebiom.2016.02.034
Centro de Estudos e Pesquisas em Engenharia e Defesa Civil - CEPED. (2013a). Atlas dos Desastres Naturais – Brasil – 1991 a 2012. CEPED; UFSC.
Centro Universitário De Estudos E Pesquisas Sobre Desastres (CEPED). (2013b). Atlas brasileiro de desastres naturais 1991 a 2010: volume Brasil, 2nd Edn. Florianpolis: Universidade Federal de Santa Catarina; Centro Universitrio De Estudos E Pesquisas Sobre Desastr. Available online at: https://s2id.mi.gov.br/paginas/atlas/ (accessed December 01, 2022).
CEPED (2013c). desastres_BRASIL, Centro de Estudos e Pesquisas em Engenharia e Defesa Civil - CEPED. Florianópolis. Available online at: https://www.ceped.ufsc.br/atlas-brasileiro-de-desastres-naturais-1991-a-2012/
Chmutina, K., and von Meding, J. (2019). A dilemma of language: “natural disasters” in academic literature. Int. J. Disaster Risk Sci. 10, 283–292. doi: 10.1007/s13753-019-00232-2
Coelho, C. A. S., de Souza, D. C., Kubota, P. Y., Cavalcanti, I. F. A., Baker, J. C. A., Figueroa, S. N., et al. (2022). Assessing the representation of South American monsoon features in Brazil and U.K. climate model simulations. Clim. Resil. Sust. 1, 1–23. doi: 10.1002/cli2.27
Coelho, C. A. S., Prestrelo de Oliveira, C., Ambrizzi, T., Reboita, M. S., Carpenedo, C. B., et al. (2016). The 2014 southeast Brazil austral summer drought: regional scale mechanisms and teleconnections. Clim. Dyn. 46, 3737–3752. doi: 10.1007/s00382-015-2800-1
Costa, M. D. S., Oliveira-Júnior, J. F. D., Santos, P. J. D., Correia Filho, W. L. F., Gois, G. D., Blanco, C. J. C., et al. (2021). Rainfall extremes and drought in Northeast Brazil and its relationship with El Niño–Southern Oscillation. Int. J. Climatol. 41, E2111–E2135. doi: 10.1002/joc.6835
Cutter, S. L. (1996). Vulnerability to hazards. Prog. Hum. Geogr. 20, 529–539. doi: 10.1177/030913259602000407
Cutter, S. L., and Finch, C. (2018). Temporal and spatial changes in social vulnerability to natural hazards. Plann. Clim. Change 105, 129–137. doi: 10.4324/9781351201117-16
Da Silva, P. E., Santos e Silva, C. M., Spyrides, M. H. C, and Andrade, L. M. B. (2019). Precipitation and air temperature extremes in the Amazon and northeast Brazil. Int. J. Climatol. 39, 579–595. doi: 10.1002/joc.5829
Dalagnol, R., Gramcianinov, C. B., Crespo, N. M., Luiz, R., Chiquetto, J. B., Marques, M. T. A., et al. (2022). Extreme rainfall and its impacts in the Brazilian Minas Gerais state in January 2020: can we blame climate change? Clim. Resil. Sust. 1, 1–15. doi: 10.1002/cli2.15
de Freitas, C. M., Silva, D. R. X., de Sena, A. R. M., Silva, E. L., Sales, L. B. F., de Carvalho, M. L., et al. (2014). Desastres naturais e saúde: Uma análise da situação do Brasil. Ciencia Saude Coletiva 19, 3645–3656. doi: 10.1590/1413-81232014199.00732014
de Freitas, G. N. (2020). São Paulo drought: Trends in streamflow and their relationship to climate and human-induced change in Cantareira watershed, Southeast Brazil. Hydrol. Res. 51, 750–767. doi: 10.2166/nh.2020.161
de Medeiros, F. J., de Oliveira, C. P., and Torres, R. R. (2020). Climatic aspects and vertical structure circulation associated with the severe drought in Northeast Brazil (2012–2016). Clim. Dyn. 55, 2327–2341. doi: 10.1007/s00382-020-05385-1
Debortoli, N. S., Camarinha, P. I. M., Marengo, J. A., and Rodrigues, R. R. (2017). An index of Brazil's vulnerability to expected increases in natural flash flooding and landslide disasters in the context of climate change. Nat. Hazards 86, 557–582. doi: 10.1007/s11069-016-2705-2
Dias, C. S. Jr., and Verona, A. P. (2021). Desastres naturais e regime reprodutivo: possíveis impactos no número de nascidos vivos em Mariana, Minas Gerais, Brasil, após o rompimento da Barragem de Fundão Natural disasters and reproductive regime : possible impacts on the number of born lives. Rev. Espinhaço 10. doi: 10.5281/zenodo.5092763
Donat, M. G., Lowry, A. L., Alexander, L. V., O'Gorman, P. A., and Maher, N. (2016). More extreme precipitation in the worldâ €TM s dry and wet regions. Nat. Clim. Change 6, 508–513. doi: 10.1038/nclimate2941
Du, H., Alexander, L. V., Donat, M. G., Lippmann, T., Srivastava, A., Salinger, J., et al. (2019). Precipitation from persistent extremes is increasing in most regions and globally. Geophys. Res. Lett. 46, 6041–6049. doi: 10.1029/2019GL081898
Du, H., Donat, M. G., Zong, S., Alexander, L. V., Manzanas, R., Kruger, A., et al. (2022). Extreme precipitation on consecutive days occurs more often in a warming climate. Bull. Am. Meteorol. Soc. 103, E1130–E1145. doi: 10.1175/BAMS-D-21-0140.1
Dunn, R. J. H., Alexander, L. V., Donat, M. G., Zhang, X., Bador, M., Herold, N., et al. (2020). Development of an updated global land in situ-based data set of temperature and precipitation extremes: HadEX3. J. Geophys. Res. Atmos. 125, 1–37. doi: 10.1029/2019JD032263
Eakin, H., and Luers, A. L. (2006). Assessing the vulnerability of social-environmental systems. Annu. Rev. Environ. Resour. 31, 365–394. doi: 10.1146/annurev.energy.30.050504.144352
Engle, N. L., and Lemos, M. C. (2010). Unpacking governance: Building adaptive capacity to climate change of river basins in Brazil. Glob. Environ. Change 20, 4–13. doi: 10.1016/j.gloenvcha.2009.07.001
Fathian, F., Ghadami, M., and Dehghan, Z. (2022). Observed and projected changes in temperature and precipitation extremes based on CORDEX data over Iran. Theor. Appl. Climatol. 149, 569–592. doi: 10.1007/s00704-022-04066-9
Fernandes, L. G., and Rodrigues, R. R. (2018). Changes in the patterns of extreme rainfall events in southern Brazil. Int. J. Climatol. 38, 1337–1352. doi: 10.1002/joc.5248
Füssel, H.-M. (2010). Review and Quantitative Analysis of Indices of Climate Change Exposure, Adaptive Capacity, Sensitivity, and Impacts. World Development Report, p. 34. Available online at: http://siteresources.worldbank.org/INTWDR2010/Resources/5287678-1255547194560/WDR2010_BG_Note_Fussel.pdf (accessed October 30, 2022).
Geirinhas, J. L., Russo, A., Libonati, R., Sousa, P. M., Miralles, D. G., and Trigo, R. M. (2021). Recent increasing frequency of compound summer drought and heatwaves in Southeast Brazil. Environ. Res. Lett. 16. doi: 10.1088/1748-9326/abe0eb
Guan, J., Yao, J., Li, M., Li, D., and Zheng, J. (2022). Historical changes and projected trends of extreme climate events in Xinjiang, China. Clim. Dyn. 59, 1753–1774. doi: 10.1007/s00382-021-06067-2
Guedes, G., Raad, R., and Raad, L. (2019). Welfare consequences of persistent climate prediction errors on insurance markets against natural hazards. Estud. Econ. 49, 235–264. doi: 10.1590/0101-41614922grl
Haylock, M. R., Peterson, T. C., Alves, L. M., Ambrizzi, T., Anunciação, Y. M. T., Baez, J., et al. (2006). Trends in total and extreme South American rainfall in 1960-2000 and links with sea surface temperature. J. Clim. 19, 1490–1512. doi: 10.1175/JCLI3695.1
Hull, J. R., and Guedes, G. (2013). Rebuilding Babel: finding common development solutions using cross-contextual comparisons of multidimensional well-being. Rev. Brasil. Estudos Popul. 30, 271–297. doi: 10.1590/S0102-30982013000100013
IBGE (2010). Censo Demográfico Brasileiro (microdados). Instituto Brasileiro de Geografia e Estatística (IBGE). Available online at: https://www.ibge.gov.br/estatisticas/downloads-estatisticas.html (accessed December 01, 2022).
Instituto Brasileiro de Geografia e Estatística – IBGE. (2020). Geoci?ncias – Estudos Ambientais – Biomas. Rio de Janeiro. Available online at: Ibge.gov.br/downloads/geociencias/informacoes_ambientais/estudos_ambientais/biomas/vetores/
IPCC (2014). Part A: Global and Sectoral Aspects. (Contribution of Working Group II to the Fifth Assessment Report of the Intergovernmental Panel on Climate Change). Climate Change 2014: Impacts, Adaptation, and Vulnerability, 1132. Available online at: https://www.ipcc.ch/pdf/assessment-report/ar5/wg2/WGIIAR5-FrontMatterA_FINAL.pdf (accessed October 30, 2022).
IPCC (2021). Climate Change 2021: The Physical Science Basis WGI. Bulletin of the Chinese Academy of Sciences (Cambridge, UK: Cambridge University Press).
Lesinger, K., and Tian, D. (2022). Trends, variability, and drivers of flash droughts in the contiguous United States. Water Resour. Res. 58, e2022WR032186. doi: 10.1029/2022WR032186
Lima, K. C., and Satyamurty, P. (2010). Post-summer heavy rainfall events in southeast Brazil associated with south Atlantic convergence zone. Atmos. Sci. Lett. 11, 13–20. doi: 10.1002/asl.246
Lyra, G. B., Oliveira-Júnior, J. F., Gois, G., Cunha-Zeri, G., and Zeri, M. (2017). Rainfall variability over Alagoas under the influences of SST anomalies. Meteorol. Atmos. Phys. 129, 157–171. doi: 10.1007/s00703-016-0461-1
Magrin, G. O., Marengo, J., Boulanger, J., Buckeridge, M. S., Castellano, E., and Poveda, G. (2014). Central and South America Coordinating Lead Authors : Lead Authors : Contributing Authors : Review Editors :, Climate Change 2014: Impacts, Adaptation, and Vulnerability. Part B: Regional Aspects. Contribution of Working Group II to the Fifth Assessment Report of the Intergovernmental Panel on Climate Change [Barros, V.R., C.B. Field, D.J. Dokken, M.D. Mastrandre.
Marengo, J. A., Alves, L. M., Beserra, E. A., and Lacerda, F. F. (2011). Recursos hídricos em regiões áridas e semiáridas, Recursos hídricos em regiões áridas e semiáridas. Available online at: http://plutao.sid.inpe.br/col/dpi.inpe.br/plutao/2011/06.11.02.16/doc/Marengo_Variabilidade.pdf?languagebutton=en (accessed October 30, 2022).
Marengo, J. A., and Bernasconi, M. (2015). Regional differences in aridity/drought conditions over Northeast Brazil: present state and future projections. Clim. Change 129, 103–115. doi: 10.1007/s10584-014-1310-1
Marengo, J. A., Camarinha, P. I., Alves, L. M., Diniz, F., and Betts, R. A. (2021). Extreme rainfall and hydro-geo-meteorological disaster risk in 1.5, 2.0, and 4.0°C Global warming scenarios: an analysis for Brazil. Front. Clim. 3, 1–17. doi: 10.3389/fclim.2021.610433
Marengo, J. A., Nobre, C. A., Tomasella, J., Cardoso, M. F., and Oyama, M. D. (2008). The drought of Amazonia in 2005. J. Clim. 21, 495–516. doi: 10.1175/2007JCLI1600.1
Marengo, J. A., Rusticucci, M., Penalba, O., and Renom, M. (2010). An intercomparison of observed and simulated extreme rainfall and temperature events during the last half of the twentieth century: part 2: historical trends. Clim. Change 98, 509–529. doi: 10.1007/s10584-009-9743-7
Mata-Lima, H., Alvino-Borba, A, Pinheiro, A., Mata-Lima, A., and Almeida, J. A. (2013). Impacts of natural disasters on environmental and socio-economic systems: what makes the difference? Ambiente Soc. 16, 45–64. doi: 10.1590/S1414-753X2013000300004
Melchior, L. A. K., Brilhante, A. F., and Chiaravalloti-Neto, F. (2020). Climate profiles in Brazilian microregions. Atmosphere 11, 1–14. doi: 10.3390/atmos11111217
Menezes, J. A., Confalonieri, U., Madureira, A. P., de Brito Duv, I., Barbosa dos Santos, R., Margonari, C., et al. (2018). Mapping human vulnerability to climate change in the Brazilian Amazon: the construction of a municipal vulnerability index. PLoS ONE 13, e0190808. doi: 10.1371/journal.pone.0190808
Nunes, A., de, A., Pinto, E. J., de, A., and Baptista, M. B. (2018). Detection of trends for extreme events of precipitation in the Metropolitan Region of Belo Horizonte through statistical methods. Rev. Brasil. Recur. Hidricos 23. doi: 10.1590/2318-0331.0318170134
Oliveira, P. T., Santos e Silva, C. M., and Lima, K. C. (2017). Climatology and trend analysis of extreme precipitation in subregions of Northeast Brazil. Theor. Appl. Climatol. 130, 77–90. doi: 10.1007/s00704-016-1865-z
Palharini, R., Vila, D., Rodrigues, D., Palharini, R., Mattos, E., and Undurraga, E. (2022). Analysis of Extreme rainfall and natural disasters events using satellite precipitation products in different regions of Brazil. Atmosphere 13, 1–24. doi: 10.3390/atmos13101680
Perez, L. P., Rodrigues-Filho, S., Marengo, J. A., Santos, D. V., and Mikosz, L. (2020). Climate change and disasters: analysis of the Brazilian regional inequality. Sustain. Debate 11, 260–296. doi: 10.18472/SustDeb.v11n3.2020.33813
Quintão, A. F., Brito, I., Oliveira, F., Madureira, A. P., and Confalonieri, U. (2017). Social, environmental, and health vulnerability to climate change: the case of the municipalities of Minas Gerais, Brazil. J. Environ. Public Health 2017, 2821343. doi: 10.1155/2017/2821343
Raad, R. J., Guedes, G., and Vaz, L. (2019). Insurance contracts under beliefs contamination. Econ. Bull. 39, 2890–2903.
Reboita, M. S., Rodrigues, M. G., Silva, L. F., and Alves, M. A. (2015). Aspectos climáticos do estado de Minas Gerais. Rev. Brasil. Climatol. 17, 206–226. doi: 10.5380/abclima.v17i0.41493
Ribeiro, M. S. M., Andrade, L. M. B., Spyrides, M. H. C., Lima, K. C., Evangelista da Silva, P., Batista, D. T., et al. (2021). Environmental disasters in Northeast Brazil: Hydrometeorological, social, and sanitary factors. Weather Clim. Soc. 13, 541–554. doi: 10.1175/WCAS-D-20-0132.1
Rodrigues, D. T., Gonçalves, W. A., Spyrides, M. H. C., Andrade, L. M. B., Oliveira de Souza, D., Alves de Araujo, P. A., et al. (2021). Probability of occurrence of extreme precipitation events and natural disasters in the city of Natal, Brazil. Urban Clim. 35, 1–13. doi: 10.1016/j.uclim.2020.100753
Rodrigues, D. T., Gonçalves, W. A., Spyrides, M. H. C., and Santos e Silva, C. M. (2019). Spatial and temporal assessment of the extreme and daily precipitation of the Tropical Rainfall Measuring Mission satellite in Northeast Brazil. Int. J. Remote Sens. 41, 549–571. doi: 10.1080/01431161.2019.1643940
Rodrigues, D. T. D. T., Gonçalves, W. A., Spyrides, M. H. C., Santos e Silva, C. M., and de Souza, D. O. (2020). Spatial distribution of the level of return of extreme precipitation events in Northeast Brazil. Int. J. Climatol. 40, 5098–5113. doi: 10.1002/joc.6507
Rotta, L. H., Alcântara, E., Park, E., Negri, R. G., Lin, Y. N., and Bernardo, N. (2020). The 2019 Brumadinho tailings dam collapse: Possible cause and impacts of the worst human and environmental disaster in Brazil. Int. J. Appl. Earth Observ. Geoinform. 90. doi: 10.1016/j.jag.2020.102119
Ruiz-Alvarez, O., Singh, V. P., Enciso-Medina, J., Ontiveros-Capurata, R. E., and Costa dos Santos, C. A. (2020). Observed trends in daily temperature extreme indices in Aguascalientes, Mexico. Theor. Appl. Climatol. 142, 1425–1445. doi: 10.1007/s00704-020-03391-1
Santos, E. B., Lucio, P. S., and Santos e Silva, C. M. (2015). Seasonal analysis of return periods for maximum daily precipitation in the Brazilian Amazon. J. Hydrometeorol. 16, 973–984. doi: 10.1175/JHM-D-14-0201.1
Santos, E. B., Lucio, P. S., and Santos e Silva, C. M. (2016). Estimating return periods for daily precipitation extreme events over the Brazilian Amazon. Theor. Appl. Climatol. 126, 585–595. doi: 10.1007/s00704-015-1605-9
Sardinha, D. S., Pena, Y. T. L., Tiezzi, R. O., and Jacinto de Almeida, M. C. (2016). Base de dados de desastres naturais no município de Poços de Caldas/MG: ferramenta para o planejamento e a gestão territorial. Rev. Brasil. Gestão Urbana 8, 318–331. doi: 10.1590/2175-3369.008.003.AO03
Sena, A., Ebi, K. L., Freitas, C., Corvalan, C., and Barcellos, C. (2017). Indicators to measure risk of disaster associated with drought: implications for the health sector. PLoS ONE 12, e0181394. doi: 10.1371/journal.pone.0181394
Sharma, J., and Ravindranath, N. H. (2019). Applying IPCC 2014 framework for hazard-specific vulnerability assessment under climate change. Environ. Res. Commun. 1, 051004. doi: 10.1088/2515-7620/ab24ed
Silveira Marinho, K. F., Barbosa Andrade, L. D. M., Constantino Spyrides, M. H., Santos e Silva, C. M., de Oliveira, C. P., Guedes Bezerra, B., et al. (2020). Climate profiles in Brazilian microregions. Atmosphere. 11, 1217. Available online at: https://www.mdpi.com/2073-4433/11/11/1217
Sistema Integrado de Informações sobre Desastres Naturais – S2iD. (2022). Ministério da Integração e do Desenvolvimento Regional, Brasília, Brasil. Available online at: https://s2id.mi.gov.br
Stennett-Brown, R. K., Stephenson, T. S., and Taylor, M. A. (2019). Caribbean climate change vulnerability: lessons from an aggregate index approach. PLoS ONE 14, e0219250. doi: 10.1371/journal.pone.0219250
Stevaux, J. C., Latrubesse, E. M., Hermann, M. L. P., and Aquina, S. (2009). Floods in urban areas of Brazil. Dev. Earth Surf. Process. 13, 245–266. doi: 10.1016/S0928-2025(08)10013-X
Sullivan, C., and Meigh, J. (2005). Targeting attention on local vulnerabilities using an integrated index approach: The example of the climate vulnerability index. Water Sci. Technol. 51, 69–78. doi: 10.2166/wst.2005.0111
Tominaga, L. K. J. S. R. A. (2015). Capítulo 10 Gerenciamento de Desastres Naturais, DESASTRES NATURAIS Conhecer para prevenir.
Torres, R. R., Lapola, D. M., Marengo, J. A., and Lombardo, M. A. (2012). Socio-climatic hotspots in Brazil. Clim. Change 115, 597–609. doi: 10.1007/s10584-012-0461-1
Trinh, T.-A., Simon, F., and Alberto, P. (2021). The impact of natural disasters and climate change on agriculture: findings from Vietnam. Econ. Effects Nat. Disast. 2021, 261–280. doi: 10.1016/B978-0-12-817465-4.00017-0
UNDRR (2020). United Nations Office for Disaster Risk Reduction: 2020 Annual Report. Available online at: https://www.unisdr.org/files/64454_unisdrannualreport2018eversionlight.pdf (accessed October 30, 2022).
UNISDR (2016). Report of the Open-Ended Intergovernmental Expert Working Group on Indicators and Terminology Relating to Disaster Risk Reduction, TERMINOLOGY. Available online at: https://www.undrr.org/terminology (accessed October 30, 2022).
Vásquez, I. L., Nascimento de Araujo, L. M., Molion, L. C. B., Abdalad, M. A., Moreira, D. M., Sanchez, A., et al. (2018). Historical analysis of interannual rainfall variability and trends in southeastern Brazil based on observational and remotely sensed data. Clim. Dyn. 50, 801–824. doi: 10.1007/s00382-017-3642-9
Vermunt, J. K. (2010). Latent class modeling with covariates: Two improved three-step approaches. Polit. Anal. 18, 450–469. doi: 10.1093/pan/mpq025
Vermunt, J. K., and Magidson, J. (2002). Latent Class Cluster Analysis Jeroen, Applied Latent Class Analysis Applied, 11th Edn (Cambridge, UK: Cambridge University Press). doi: 10.1017/CBO9780511499531.004
Wolf, S., Hinkel, J., Hallier, M., Bisaro, A., Lincke, D., Ionescu, C., et al. (2013). Clarifying vulnerability definitions and assessments using formalisation. Int. J. Clim. Change Strat. Manag. 5, 54–70. doi: 10.1108/17568691311299363
Xavier, A. C., King, C. W., and Scanlon, B. R. (2015). Daily gridded meteorological variables in Brazil (1980–2013). Int. J. Climatol. 36, 2644–2659. doi: 10.1002/joc.4518
Zhang, X., Aguilar, E., Aguilar, E., Sensoy, S., Melkonyan, H., Tagiyeva, U., et al. (2005a). Trends in Middle East climate extreme indices from 1950 to 2003. J. Geophys. Res. Atmos. 110, 1–12. doi: 10.1029/2005JD006181
Zhang, X., Hegerl, G., Zwiers, F. W., and Kenyon, J. (2005b). Avoiding inhomogeneity in percentile-based indices of temperature extremes. J. Clim. 18, 1641–1651. doi: 10.1175/JCLI3366.1
Zhang, X., and Yang, F. (2004). RClimDex (1.0) User Manual (Downsview, ON: Climate Research Branch Environment Canada), 1–23.
Zheng, J., Fan, J., and Zhang, F. (2019). Spatiotemporal trends of temperature and precipitation extremes across contrasting climatic zones of China during 1956–2015. Theor. Appl. Climatol. 138, 1877–1897. doi: 10.1007/s00704-019-02942-5
Keywords: climate changes, extreme climatic events, climatic impacts, vulnerability, resilience
Citation: Guedes G, Andrade LdMB, Silva CMSe, Noronha KVMdS, Rodrigues D and Martins ASFS (2023) Profiling sociodemographic attributes and extreme precipitation events as mediators of climate-induced disasters in municipalities in the state of Minas Gerais, Brazil. Front. Hum. Dyn. 5:1138277. doi: 10.3389/fhumd.2023.1138277
Received: 05 January 2023; Accepted: 20 February 2023;
Published: 17 March 2023.
Edited by:
Shah Md Atiqul Haq, Shahjalal University of Science and Technology, BangladeshReviewed by:
José Francisco Oliveira Júnior, Federal University of Alagoas, BrazilDaniel Andres Rodriguez, Federal University of Rio de Janeiro, Brazil
Mercy J. Borbor-Cordova, ESPOL Polytechnic University, Ecuador
Copyright © 2023 Guedes, Andrade, Silva, Noronha, Rodrigues and Martins. This is an open-access article distributed under the terms of the Creative Commons Attribution License (CC BY). The use, distribution or reproduction in other forums is permitted, provided the original author(s) and the copyright owner(s) are credited and that the original publication in this journal is cited, in accordance with accepted academic practice. No use, distribution or reproduction is permitted which does not comply with these terms.
*Correspondence: Gilvan Guedes, Z2lsdmFuQGVwb3BlYS5jb20uYnI=