 John Roper
 David Casagrande
- Center for Catastrophe Modeling and Resilience, Lehigh University, Bethlehem, PA, United States
Background: The Social Vulnerability Index (SVI) is one of the most widely used tools for determining how vulnerable populations are to disasters in the United States. We tested the ability of the SVI published by the Centers for Disease Control to predict population recovery within New Orleans census tracts after Hurricane Katrina in 2005. We contextualize our results within the distributive, recognition, and procedural disaster justice framework.
Methods: We hypothesized that populations in census tracts with more vulnerability (higher SVI scores) would be slower to return after the disaster (less resilient). Changes in population before and after the 2005 disaster were calculated using census data from 2000 and 2010. We ran a series of linear multivariate regression models to test for relationships between SVI, flood damage, the change in population, and gentrification.
Results: SVI and flood damage successfully predicted whether population in census tracts recovered [ANOVA: F(2, 289) = 36.3, p < 0.001]. Although the model was statistically significant, it explained only 20.1% (R2 = 0.201) of the variation, indicating significant unexplained variance. Another regression model using SVI and flood damage successfully predicted whether census tracts would gentrify after the disaster [ANOVA: F(2, 284) = 15.69, p < 0.001], although variation around this linear relationship was also very high (R2 = 0.10). A subset of census variables used in SVI and gentrification indices predicted population recovery better than the SVI or Gentrification indices alone [ANOVA: F(5, 292) = 257.5, p < 0.001; R2 = 0.82], with home ownership being the most important variable. Changes in SVI and gentrification between 2000 and 2010 were inversely correlated suggesting that vulnerability was replaced with gentrification after the disaster.
Conclusion: The SVI is useful for documenting distributive injustice when operationalized as reduced resilience. In the case of New Orleans after Hurricane Katrina, SVI did not account for historical processes like impacts of redlining on home ownership. Lower SVI values can be misleading if they result from gentrification and not improved resiliency of vulnerable populations. Correcting inequitable vulnerability requires procedural justice to overcome negative effects of historical processes like redlining or to avoid displacement of vulnerable populations by gentrification when attempting to promote resilience.
Introduction
As climate change progresses, the frequency and severity of floods are increasing, but the impacts of floods are not felt equally (Wing et al., 2022). Socially vulnerable populations–communities whose socioeconomic and demographic factors impact their resilience–face a greater risk of displacement and financial hardship from natural disasters while also having longer recovery times, less access to disaster preparedness resources, and use a significant proportion of their household income to recover (Verchick, 2012; Hallegatte et al., 2017; Flanagan et al., 2018; Dugan et al., 2023). This vulnerability is an example of distributive injustice and is typically identified using Social Vulnerability Indices (SVIs) that use a range of census variables to identify such populations. While SVIs were created to aid in disaster management, validating whether or not the indices can be used to predict disaster outcomes for vulnerable populations has remained underexplored. Critical studies on the construct validity of SVIs have noted that when applied to disaster scenarios, the indices do not always align with the observed impacts (Bakkensen et al., 2016; Rufat et al., 2019; Painter et al., 2024). Several studies have indicated that these indices fail to recognize underlying systemic causes that can contribute to elevated risks seen in socially vulnerable populations and that the models perform better at predicting disaster outcomes when these factors are included (Rufat et al., 2019; West, 2023; Painter et al., 2024). Verchick’s coining of the term ‘Disaster Justice’ in 2012 highlighted that the magnification of social vulnerability by natural hazards is caused by issues of governance structures that perpetuate vulnerabilities, inequalities, and injustices (Verchick, 2012; Lukasiewicz, 2020).
The growing relevance and use of SVIs in the field of disaster management combined with the increasing pressure of climate change shows a need for continued testing of the indices and a wider reflection on what they truly indicate: injustice within our systems of governance (Lukasiewicz, 2020; West, 2023). Following Painter’s findings in her systematic scoping review of SVIs as applied to natural hazards, which reviewed 246 papers across 20 distinct hazard and disaster contexts in 91 countries, we argue that SVIs currently lack place-based rigor, reflect proxies of risk, and that their application needs to be for long-term social vulnerability reduction (Painter et al., 2024). We also argue that the widespread application of ‘resilience’ as a goal for communities pushes recovery efforts towards a return to their status quo condition, often without consideration of whether or not that initial state was unjust and socially vulnerable (Cretney, 2014). Additionally, we argue that prioritizing resilience as a disaster recovery paradigm obscures existing injustices by creating and reproducing disaster risk (Fainstein, 2015).
Long-term vulnerability reduction through the bolstering of adaptive capacity and government commitment to building back better is critical to the equitable reduction of social vulnerability and the disproportionate risk that frontline communities face. The manifestation of disaster justice requires the inclusion of distributive justice as equity in the distribution of environmental risk, procedural justice as participation in the political processes that create and manage disaster policy, and recognition justice as the recognition of the diversity of the participants and experiences in affected communities (Schlosberg, 2004). Disaster justice stems from the environmental justice movement and is an extension of the discourse on disparate impacts in vulnerable communities.
The three main types of justice within environmental justice (distributive, procedural, and recognition) are interlinked, with recognition justice being a prerequisite for both the fair distribution of benefits in society and fair decision-making processes (Schlosberg, 2004; Wang and Lo, 2021). We argue that SVIs are a valuable tool in the pursuit of justice because they document distributive injustice and provide a roadmap for policymakers and researchers to identify where recognition and procedural justice processes need to be targeted. Despite widespread use of the SVI in disaster management, there has been a lack of validation across studies published on the SVI, with 76% of SVI application studies lacking any validation processes (Painter et al., 2024). SVI validation has been particularly sparse in disaster-justice contexts because it has been used primarily as a reactionary post-hazard instrument and presents proxies of risk rather than underlying systemic factors contributing to unjust outcomes (Painter et al., 2024). Validating the SVI for disaster justice requires the inclusion of variables linked to systemic causes of vulnerability and unjust outcomes, such as redlining and gentrification, that are not typically captured in vulnerability indices.
This paper serves as an attempt to validate the application of the CDC’s SVI to natural hazards to identify what it does and does not capture to better understand its potential contribution to disaster justice and resilience studies. We conducted validation by comparing SVI scores before and after Hurricane Katrina in Jefferson, Orleans, and St. Bernard parishes in Louisiana (Figure 1) to patterns of population loss (Table 1) at the tract level in ArcGIS Pro and analyzing correlations with the Statistical Package for Social Sciences program (SPSS). For reference, census tracts describe geographic subdivisions of counties with populations of 4,000 residents. Hurricane Katrina was not only one of the worst storms to hit the United States in terms of damage and fatalities but also highlighted existing disparities in New Orleans.
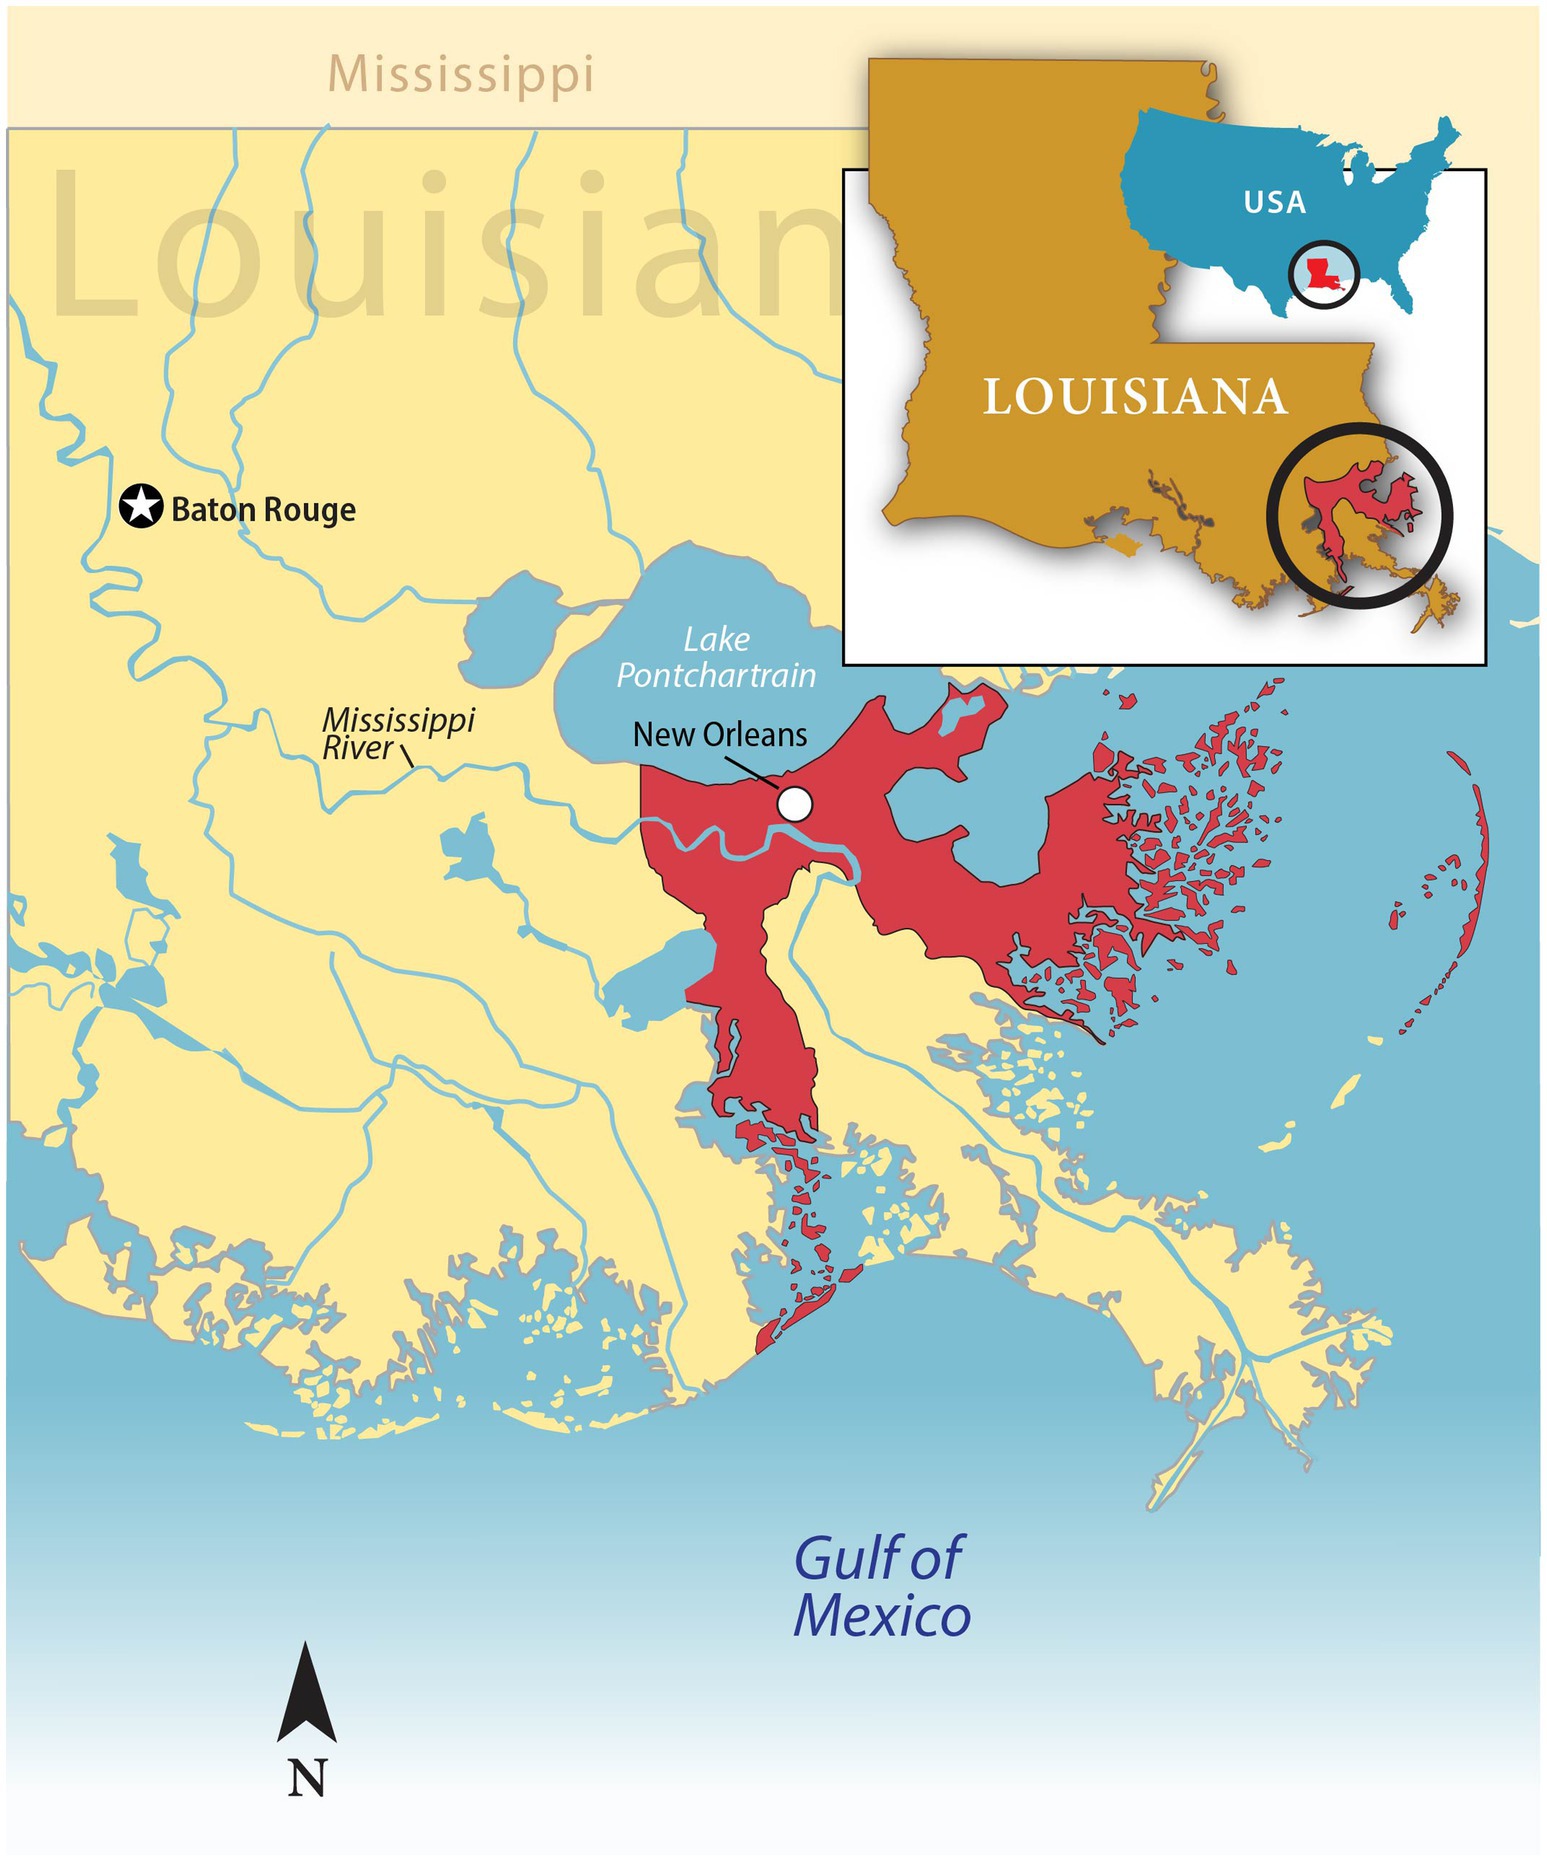
Figure 1. Study area designated in red includes three parishes in greater New Orleans (Jefferson, Orleans, St. Bernard) significantly impacted by hurricane Katrina in 2005 with a cumulative population of 1,007,368 in 2000 that recovered to only 812,282 by 2010, representing a net loss of 195,086.
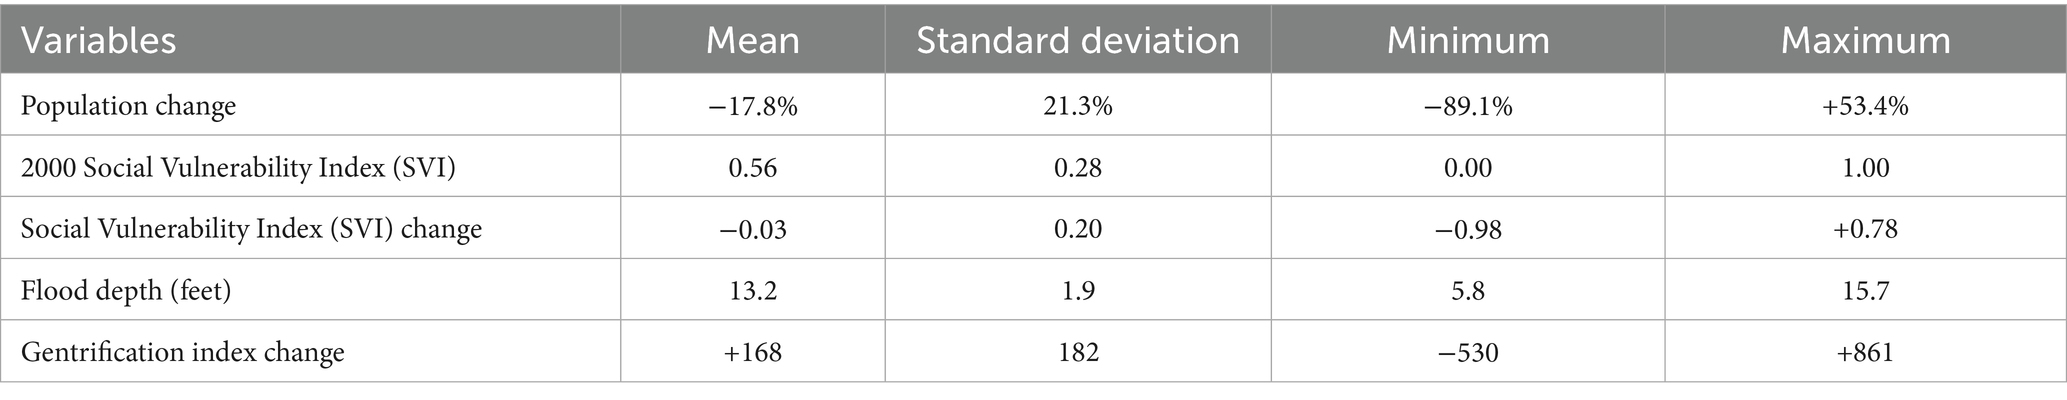
Table 1. Descriptive statistics of the primary variables of analysis for the 293 census tracts within the greater New Orleans study area including changes between 2000 and 2010 that estimate effects before and after Hurricane Katrina in 2005.
The floodwater from Katrina breached levees and 80% of the city flooded (NASA, 2005). New Orleans had a population of 484,674 before the storm in 2000 that still has not fully recovered as of 2023 with a population of 364,136 (United States Census Bureau, 2025). A disproportionately high number of minorities and people living in poverty were severely impacted and faced uncoordinated evacuation efforts, longer recovery times, and higher rates of pollution from exposure to nearby waste sites (Harden et al., 2007; Sovacool et al., 2018). Additionally, New Orleans was historically redlined, which was a discriminatory practice of denying mortgages and services to residents based on race used by the Homeowners Loan Corporation (HOLC) throughout the 1930s (Aaronson et al., 2021). The combination of high levels of social and natural vulnerability mixed with issues in disaster management exacerbated negative outcomes faced by many in the Orleans, St. Bernard, and Jefferson parishes resulting in high levels of outmigration (Myers et al., 2008). Many of the tracts that lost population have been gentrified in the decade following the disaster (Van Holm and Wyczalkowski, 2018).
We argue that gentrification, as defined by the 2005 Freeman framework, serves to hide existing socially vulnerable populations within census tracts by averaging the conditions used to identify such groups across the tract (Freeman, 2005). This results in socially vulnerable tracts appearing more resilient and less vulnerable, regardless of whether or not the socially vulnerable population is truly more resilient. We tested the Center for Disease Control’s Social Vulnerability Index, which is widely used and has been tested by others (Flanagan et al., 2011; Bakkensen et al., 2016; Rufat et al., 2019; West, 2023; Blackwood and Cutter, 2023; Painter et al., 2024). The CDC defines social vulnerability as “the resilience of communities (the ability to survive and thrive) when confronted with external stresses on human health, such as natural or human-caused disasters, or disease outbreaks” (Centers for Disease Control and Prevention, 2024).
This definition guides our framing of social vulnerability within the concepts of resilience, recovery, and disasters. Social vulnerability is captured in the SVI score calculated with fifteen census variables across four thematic areas, including socioeconomic status, household characteristics, racial and ethnic minority status, and housing type and transportation. We use our results to argue that researchers need to go beyond the surviving aspect of resilience and identify strategies that promote thriving through disaster justice. To promote disaster justice in governance policies and practices, we integrate Social Vulnerability Index refinement and equitable adaptation policy with distributive, procedural, and recognition justice.
While other indices measuring social vulnerability exist, the SVI is the most widely tested and applied in the literature (Painter et al., 2024; Cutter, 2024). The applicability of other indices to predicting disaster outcomes, such as the U.S. Climate Vulnerability Index, should be tested by future researchers and compared against more mature indices such as the CDC’s SVI (Tee Lewis et al., 2023). Additionally, it is important to recognize that indices like the SVI provide an idea of what data needs to be collected in order to identify and track social vulnerability. Not all countries have the data foundation or resources necessary to measure and address social vulnerability, let alone systemic causes of social vulnerability. We hope our study provides insight into what variables best identify social vulnerability and how to include systemic factors in the U.S. in a way that is applicable for a larger global context as researchers explore how to measure and define social vulnerability.
In summary, our study seeks to extend understandings of vulnerability and resilience by incorporating the impact of systemic drivers of vulnerability like redlining, identifying the interaction between social vulnerability and gentrification, and reframing the SVI as a tool for accomplishing disaster justice. This study has three primary research objectives: (1) test whether the CDC’s SVI can predict population change following Hurricane Katrina; (2) establish which vulnerability variables best explain population change; and (3) identify if and how gentrification can mask vulnerability as measured by the SVI. We hypothesize that while the 2000 SVI may correlate with greater population loss, the inclusion of historically relevant measures of vulnerability will greatly improve explanatory power. We use regression models to test predictions derived from this hypothesis.
Methods
Our goal was to statistically analyze the relationships between social vulnerability, flood damage, gentrification, and resilience as measured by population recovery 5 years after Hurricane Katrina. This included testing how well the CDC (Centers for Disease Control) Social Vulnerability Index (SVI) from the year 2000 predicted population loss within census tracts in New Orleans as a result of Hurricane Katrina. Hurricane Katrina occurred in 2005, which enabled us to use the difference between census tract populations in 2000 and 2010 as a before-and-after measure of the effects of the hurricane. This is based on the observation that no large-scale event other than the hurricane had a major impact on population change and that most out-migration from these parishes during the study time frame was a result of Hurricane Katrina (Myers et al., 2008). We also modeled flood damage and other socio-economic variables, including those used to measure gentrification, in combination with SVI variables to identify the best set of variables for predicting population change. We tested whether a gentrification index could explain population change. To determine if vulnerability could be misrepresented by trends in SVI, we tested whether gentrification and population change could predict changes in the SVI. All regression models were created using SPSS.
We used the CDC SVI for the three parishes that comprise the greater New Orleans area: St. Bernard, Orleans, and Jefferson (Figure 1). The CDC’s SVI was developed by Flanagan et al. (2011) to evaluate disaster outcomes for the most vulnerable populations in the US following Hurricane Katrina. Flanagan reviewed literature on which census variables representing social vulnerability most contribute to adverse disaster outcomes and compiled them into an index for disaster management. The goal of the index is to aid decision-makers in identifying the most socially vulnerable populations and preventing the disparate outcomes they often face (Cutter et al., 2003; Flanagan et al., 2011). We utilized Logan’s Longitudinal Database tool (LTBD), which has been used in other SVI validation studies, to interpolate the 2000 SVI scores to 2010 census tract boundaries for 320 tracts (Logan et al., 2020). There were several issues when using the LTDB to interpolate the data from 2000 to the 2010 census boundaries. Some tracts that did not exist in 2000 had null data when joined to 2010 boundaries. These tracts and others that when combined had SVI values above the maximum of 1.0 were removed from analyses. This reduced the number of tracts from 320 to 293. The remaining 293 tracts have an SVI value ranging from 0 to 1, a flood depth that varies with elevation, and data for variables representing social vulnerability, population, and gentrification (Table 1).
We used flood depth as a surrogate measure of damage because detailed damage estimates were not available at the tract level. The flood depth chosen for the study was the lower end of the maximum range of 16–20 ft. that occurred within New Orleans during the height of the storm (City of New Orleans, 2019). The flood depth analysis was conducted in ArcGIS Pro by leveraging flood analysis functions alongside digital elevation models (DEMs) for the study region. The interpolated 2000 SVI scores were joined to a 2010 census tract layer that contained the flood depths by FIPS code. We joined 2010 census data to this layer to conduct percent change calculations for the population, as well as several variables used to indicate gentrification. We followed the methodology outlined in Van Holm and Wyczalkowski (2018), which identified which tracts within Orleans Parish had gentrified as of 2015 according to the Freeman (2005) gentrification framework. This framework leverages percent changes in the white population, homeownership rate, median rent, college education rate, poverty rate, and median household income in addition to proximity to the downtown region of the city to determine if gentrification occurred. We decided to ignore the proximity requirement to focus on how changes in demographic characteristics indicative of gentrification aligned with the initial SVI scores. Van Holm and Wyczalkowski indicated which tracts were gentrified. We tested whether the CDC’s SVI can effectively predict areas that are likely to gentrify after a disaster.
We created a series of linear regression models to test for relationships among variables. We report standardized coefficients (β) and p-values to indicate the significance of independent variables. Our first goal was to test whether tracts with greater vulnerability, as measured using the 2000 SVI, were more likely to have lost population because of Hurricane Katrina. Some tracts may have lost population because they received greater physical damage regardless of vulnerability, so we controlled for the amount of damage. Model A tested the ability of SVI and flood depth (two independent variables) to predict population loss (dependent variable) at the census tract level. We also wanted to determine whether vulnerability and amount of damage may have contributed to gentrification. Model B is a multivariate linear regression model using the 2000 SVI scores and flood depth as independent variables to predict gentrification. The Gentrification Index includes six variables utilized in Freeman’s (2005) framework, which are summed to produce an index value. Although a main concern was to determine if social vulnerability made tracts less resilient as measured by population loss, we also considered it possible that tracts may have recovered population because they gentrified. Model C is a linear regression model using the gentrification index and flood depth as independent variables to predict population change as the dependent variable. Model D is a stepwise multivariate linear model that included the change between 2000 and 2010 in all variables that comprise both the SVI and Freeman Gentrification Index as independent variables with population change as the dependent variable. The stepwise process in SPSS models different combinations of variables to identify the least number of variables that best predict the dependent variable. This model was created to understand what subset of variables from both the SVI and Gentrification Index best explain population changes in the specific case of New Orleans and Hurricane Katrina. We also hypothesized that census tracts may have lower SVI scores and therefore appear more resilient because of gentrification after Hurricane Katrina. Model E uses the gentrification index and population change to predict changes in SVI values between 2000 and 2010.
Results
Model A
How well did SVI and flood depth predict population recovery? Model A indicated that 20.1% of the observed variance in population changes can be explained by the independent variables SVI and flood depth (R2 = 0.201). The ANOVA analysis indicated that the ability of the model to predict population change was statistically significant [F(2, 289) = 36.3, p < 0.001]. The effect of SVI was statistically significant within the model (β = −0.45, p < 0.001, 95% CI ± 0.08), but flood depth was not (p = 0.62). We were concerned that socially vulnerable tracts may also have been physically vulnerable (i.e., lower elevations), which would violate a key rule of regression analysis that independent variables cannot be collinear. Preliminary correlation tests showed there was no significant correlation between SVI scores and flood depth [r (292) = 0.08, p = 0.17]. Variance Inflation Factor (VIF) values produced by the regression model were well below 10, indicating there is no collinearity.
Model A produced the following equation:
The equation predicts that an increase of the SVI value from 0 to 1 results in a 35.9% decrease in the population between 2000 and 2010 (Figure 2). Each additional foot of flood depth would only account for a 0.3% decrease in population, but flood depth was not statistically significant.
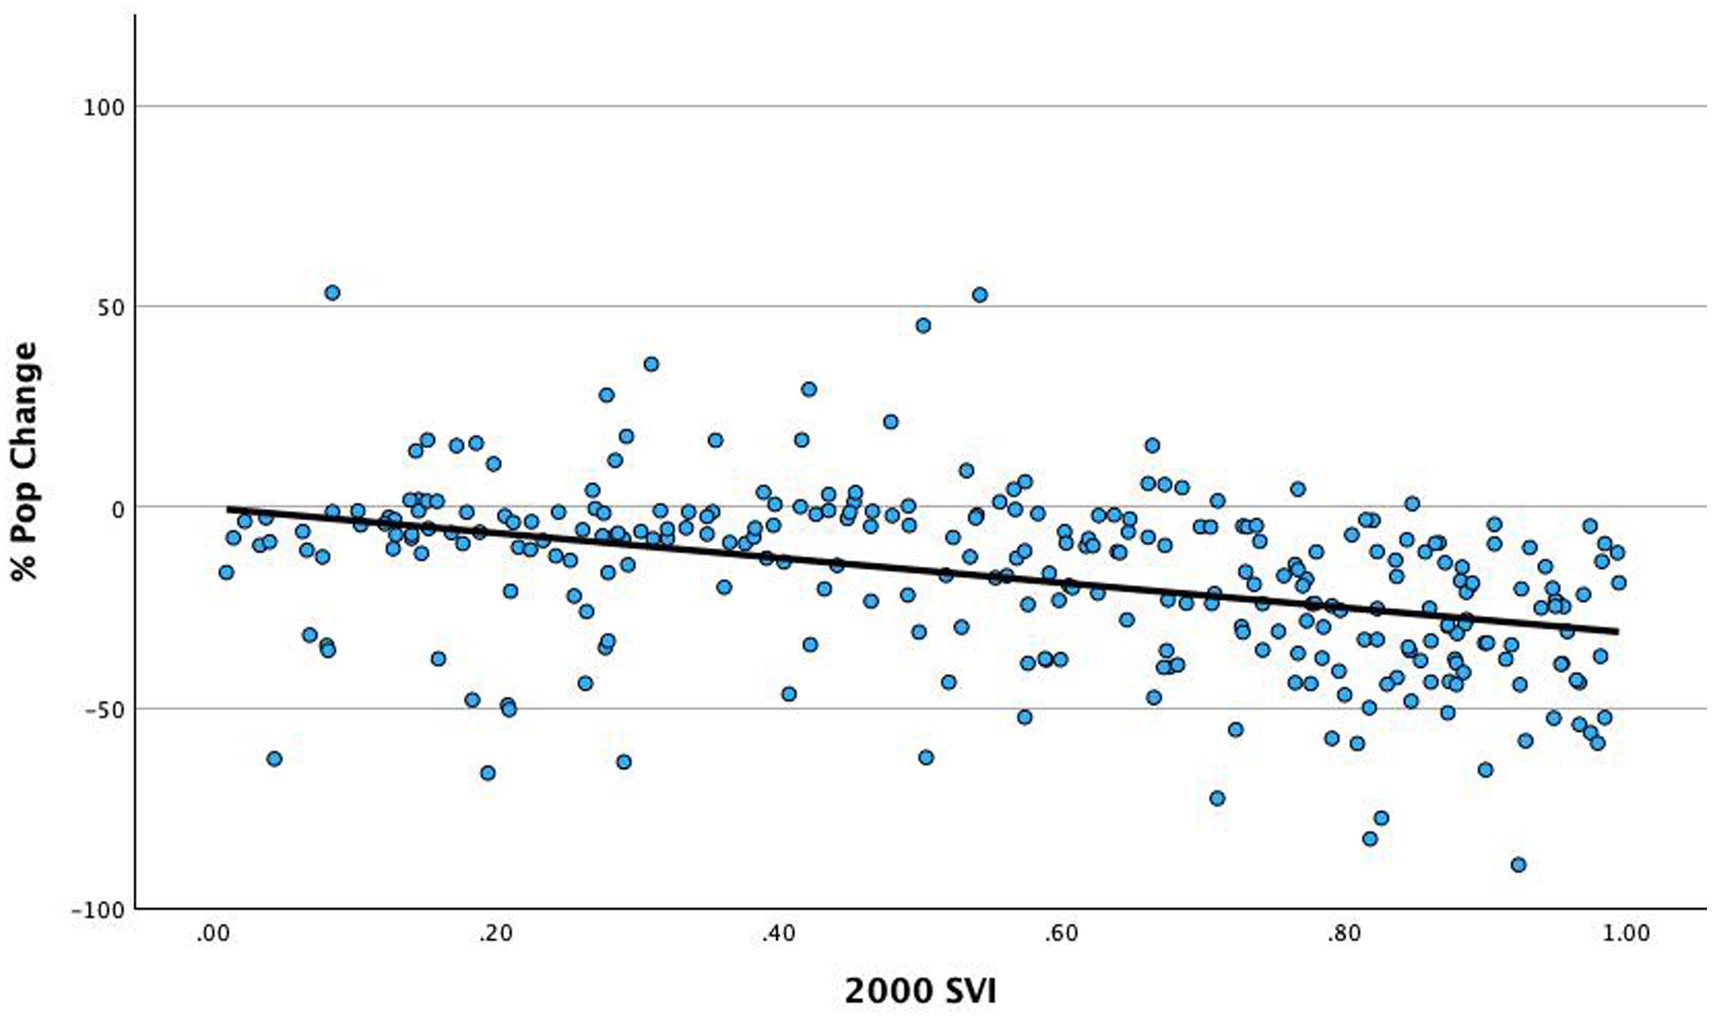
Figure 2. Linear regression plot illustrating a valid relationship between SVI and population change [ANOVA: F(2, 289) = 36.3, p < 0.001] but high residuals (R2 = 0.201) because of high variation in predicted population change values across census tracts. Population was less likely to recover by 2010 in census tracts with high social vulnerability in 2000, which indicates a lack of resilience.
Model B
How well did SVI in 2000 and flood depth predict future gentrification? Our dependent variable was the change in the Gentrification Index between 2000 and 2010 for each census tract. Preliminary correlation analysis indicated that the 2000 SVI is positively correlated with change in gentrification [r (292) = 0.287, p < 0.001]. Regression Model B indicated that only 10.6% of the observed variance in the change in gentrification can be explained by the independent variables SVI and Flood Depth (R2 = 0.11). The ANOVA analysis indicated that the ability of the independent variables to predict gentrification was statistically significant [F(2, 284) = 15.69, p < 0.001]. Both SVI (β = 0.31, p < 0.001, 95% CI ± 0.11) and flood depth (β = −0.15, p = 0.01, 95% CI ± 0.12) were statistically significant. The standardized coefficient for SVI was positive, indicating higher vulnerability in 2000 was associated with an increase in gentrification after Hurricane Katrina. The standardized coefficient for flood depth was negative; i.e., areas that are more prone to flooding were less likely to gentrify in New Orleans after Hurricane Katrina. Our results suggest that we can be more than 99% confident that a higher SVI score will be associated with gentrification, but the variation around the trend is very high, which indicates other factors are also influencing gentrification.
Model C
How well did the change in the Gentrification Index and Flood Depth predict population change? Regression Model C indicated that these independent variables failed to predict population change observed following Hurricane Katrina [ANOVA: F(2, 282) = 0.397, p = 0.63]. In other words, whether census tract populations increased or decreased was not likely a result of gentrification.
Model D
Which variables best explain resilience measured as population recovery? Regression Model D is a stepwise multivariate linear model that included the change between 2000 and 2010 in all variables that comprise both the SVI and Gentrification Index as independent variables and Population Change as the dependent variable. The stepwise regression produced in SPSS yielded five models with various combinations of variables with the final model having the best fit [ANOVA: F(5, 292) = 257.5, p < 0.001]. The final independent variables (Table 2) explain 82% of the variation observed in the dependent variable Population Change (R2 = 0.82). All five final variables included in Model D were statistically significant (Table 2). The model coefficients indicate that changes in home ownership and the population under age 17 had the strongest effects on population recovery.
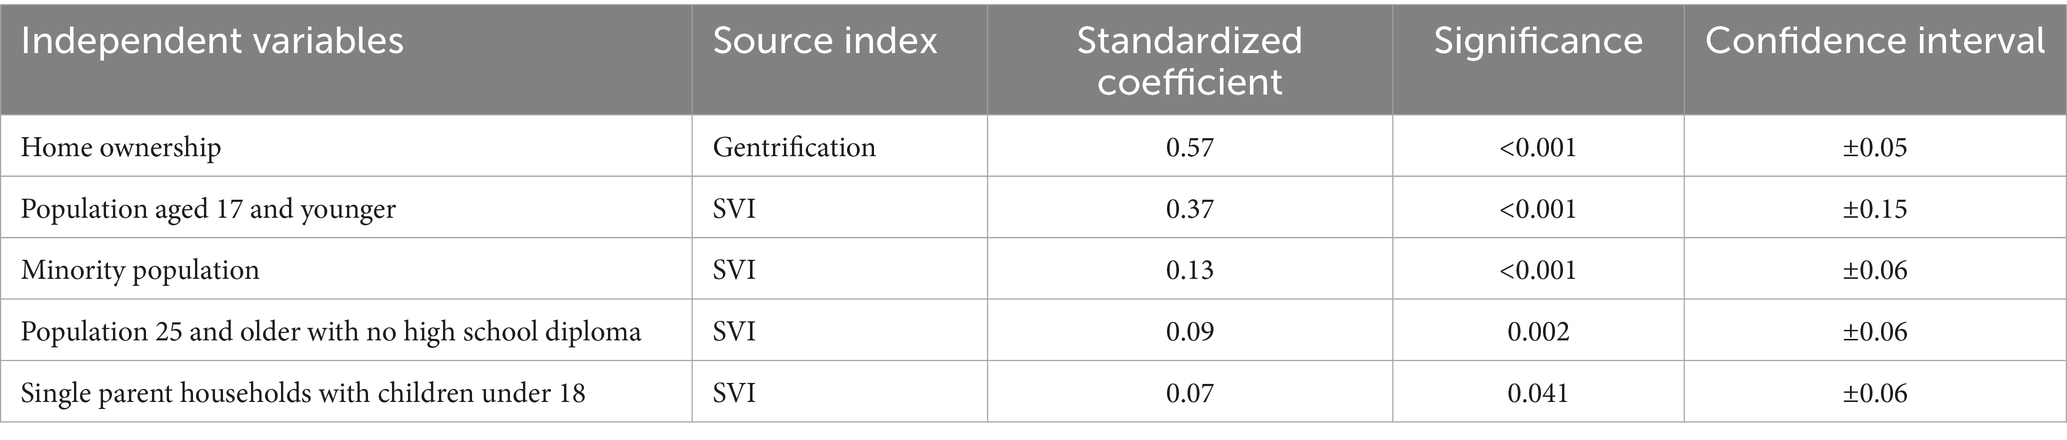
Table 2. Independent variables that best predict resilience measured as population recovery using stepwise linear regression (Model D) after Hurricane Katrina for all New Orleans census tracts.
Model E
Some census tracts may appear more resilient after Hurricane Katrina because vulnerable parts of the population did not return or because of gentrification. Preliminary correlation analysis showed that change in SVI and gentrification between 2000 and 2010 were negatively correlated [r (293) = −0.36, p < 0.001]. How well did changes in gentrification and population between 2000 and 2010 predict the change in SVI? Model E indicated that 13.5% of the observed variance in SVI change can be explained by the independent variables of Gentrification and Population Change (R2 = 0.135). The ANOVA analysis indicated that the ability of the independent variables to predict SVI change was statistically significant [F(2, 292) = 22.6, p < 0.001]. Gentrification was statistically significant (β = −0.36, p < 0.001, 95% CI ± 0.08) but Population Change was not (β = 0.09, p = 0.09, 95% CI ± 0.01).
Discussion
Social vulnerability and displacement: documenting distributive injustice
While Social Vulnerability Indices have seen a wide range of applications in disaster management, continued efforts to validate these indices will prove crucial to understanding the effects of disasters on the most vulnerable populations. Our study was designed to answer several questions. We were interested in understanding whether or not the CDC’s Social Vulnerability Index could predict population displacement following Hurricane Katrina, and if the SVI could not, what other individual variables, such as flood depth, best explained the observed trends. Additionally, we sought to identify what changes in the SVI and the population could tell us about resilience and recovery. Our results from Model A demonstrate that the 2000 SVI score, an index comprised of 15 variables, was able to explain population loss, but high variability makes it difficult to predict with more than 20% probability whether it contributed to population loss within any given tract. This shows that socially vulnerable populations in New Orleans were less likely to recover (i.e., were less resilient). Our results suggest that vulnerable populations in New Orleans were not necessarily likely to experience more flooding, but were less able to recover. It is important to note that many of the most socially vulnerable tracts within New Orleans are located in areas that were historically redlined (Figure 3).
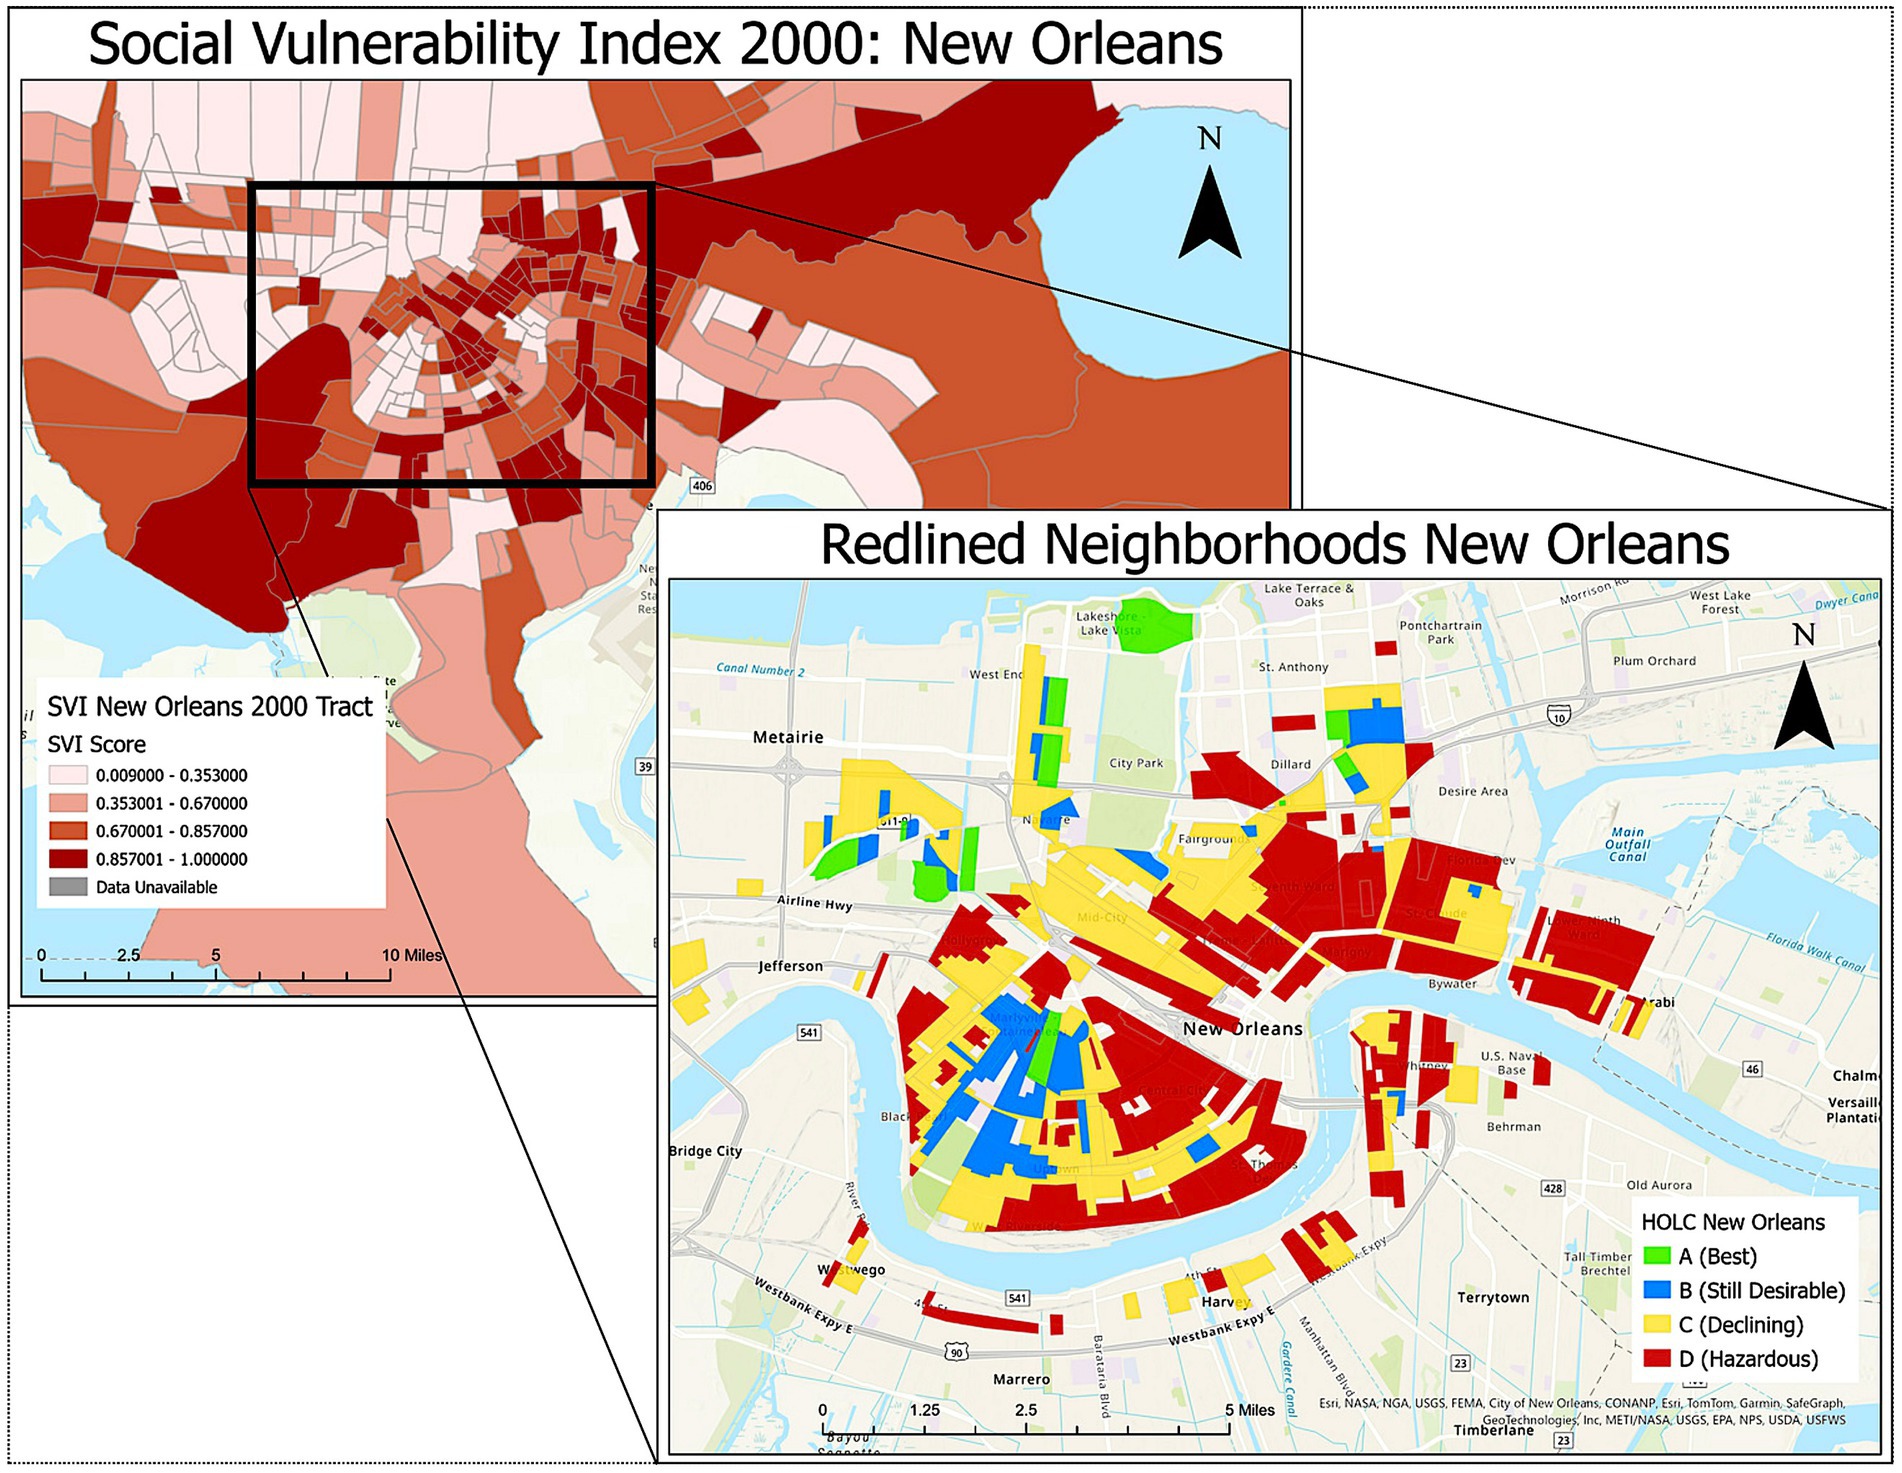
Figure 3. Center for Disease Control’s Social Vulnerability Index for the year 2000 in Orleans, Jefferson, and St. Bernard Parishes (Centers for Disease Control and Prevention, 2000) indicating distributive injustice with a nested view of Home Owners Loan Corporation (HOLC) neighborhood redlining designations showing overlap between vulnerable populations and redlining resulting from past procedural injustice.
Redlining was a form of distributive and procedural injustice that was practiced throughout the 20th century and resulted in widespread disinvestment and disenfranchisement in predominantly minority communities and neighborhoods (Aaronson et al., 2021). The Homeowners Loan Corporation (HOLC) designated neighborhoods on a scale from A-D, with A representing generally homogenous, white neighborhoods and rankings of D representing minority neighborhoods. The long-lasting impacts of redlining have resulted in distributive injustice in the form of concentrated social vulnerability, lack of access to recovery resources, and in some cases, higher natural hazard exposure (Aaronson et al., 2021; Katz, 2021). We note that using the SVI as an independent variable to predict resilience does not account for historical redlining, which is likely contributing to the large variability in model A. In terms of distributive injustice, redlining is noted as one of the key contributing factors to the racial homeownership gap and the devaluation of homes in majority-black neighborhoods in the United States (Ray et al., 2021). Redlining represents a form of procedural injustice that cemented distributive injustices in the form of access to loans necessary for owning property.
For reference, Black Americans have a homeownership rate of 46.4% compared to 75.8% of white families as of 2019 (Ray et al., 2021). Additionally, homes in black neighborhoods are valued $48,000 less than in predominantly white neighborhoods which is equivalent to a $156 billion cumulative loss in equity (Ray et al., 2021). Redlining concentrated conditions that resulted in lower homeownership rates, less valuable home equity, and fewer opportunities for building wealth while also limiting investments that would have alleviated these impacts. Studies have also found that historically redlined communities have 25% higher flood exposure than those who were not redlined, equating to $157 billion in property values with higher risk (Katz, 2021). Historically redlined neighborhoods, which are predominantly home to minority populations, face disparate disaster outcomes resulting from elevated social vulnerability.
While we did not find higher flood exposure in socially vulnerable tracts, the significant correlation between pre-Katrina SVI scores and population loss validates that SVI documents distributive injustice by highlighting communities facing disproportionate obstacles to recovery. Our results indicated that flood depth was not a statistically significant predictor of population change, but social vulnerability was. This suggests that social factors played a larger role in determining who returned than physical damage which is supported by other studies conducted shortly after Katrina documenting how residents in less vulnerable neighborhoods returned to the city and had their communities rebuilt more quickly (Finch et al., 2010; Van Holm and Wyczalkowski, 2018). While the results of Model A establish that the CDC’s SVI could predict population loss following Katrina, analyzing the individual variables that comprise the SVI score provides greater insight into what social factors contribute to disparate disaster outcomes and recovery.
The results of Model A are comparable to other SVI validation studies, although there is significant variation in the independent variables chosen to represent hazard and damage (Bakkensen et al., 2016; West, 2023; Painter et al., 2024). While we cannot conduct a direct comparison because of these differences, initial validation tests of the SVI as a composite produce similar trends where the composite score explains less than the individual variables (Rufat et al., 2019). For example, Bakkensen et al. (2016) used property damages as an independent variable to validate the SVI and produced a statistically significant model with a pseudo-R2 of 0.083. West (2023) is the most similar study to ours. West initially used wind speed from Hurricane Maria and SVI as independent variables to predict population change in Puerto Rico and produced a statistically significant model with a pseudo-R2 of 0.053. The R2 improved to 0.055 after reducing the number of SVI variables from fifteen to ten (West, 2023). Our Model A, using SVI and flood depth to predict population loss, was statistically significant with an R2 = 0.21. Model D included a reduced set of SVI variables in combination with additional variables to predict population loss and produced an R2 = 0.82. This was the most predictive model from our analysis (Table 3). This suggests that vulnerability index components may need to be altered and combined with other variables to achieve predictability in any given location.
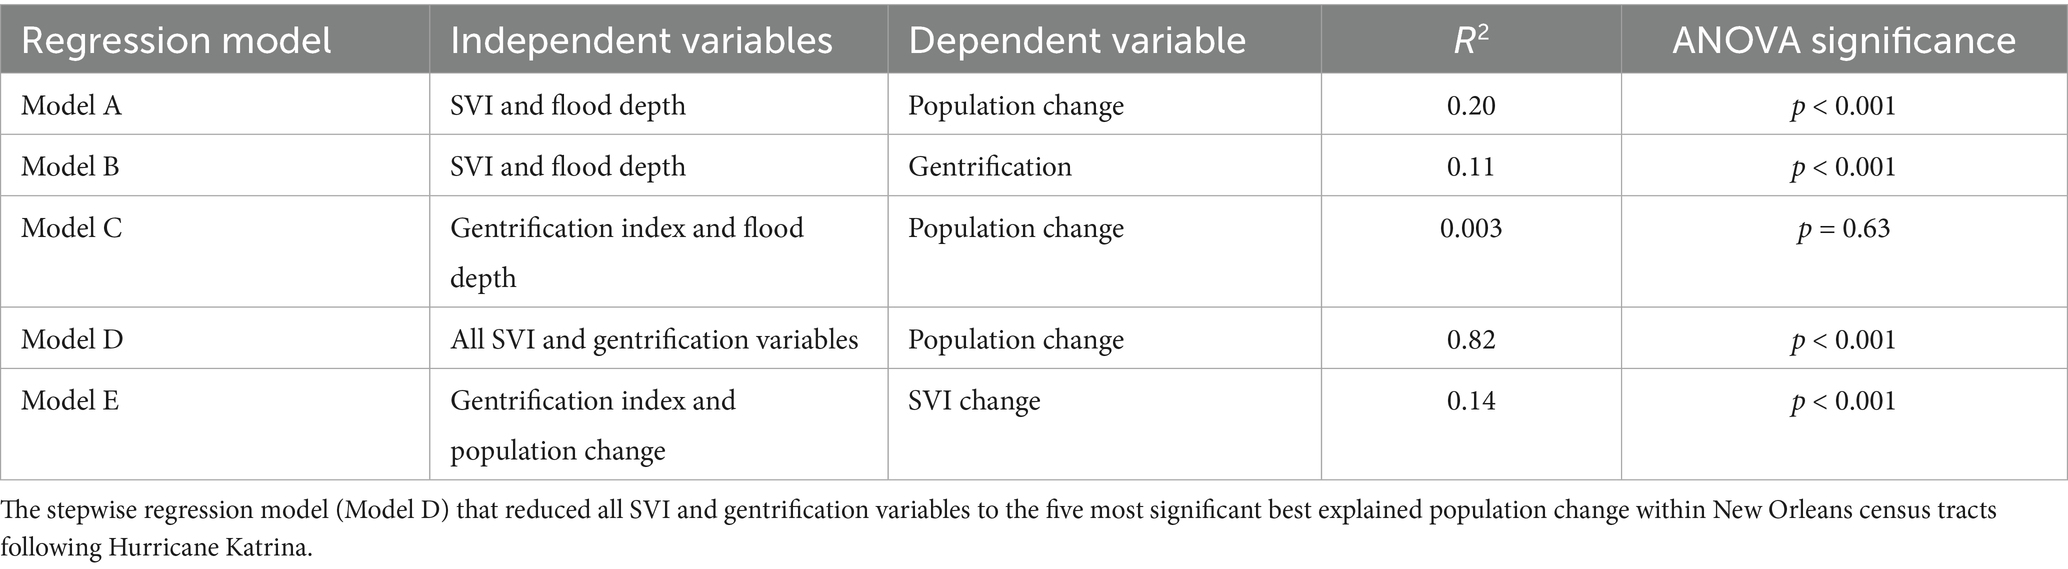
Table 3. Summary results of all regression models.
Model A demonstrates a link between the SVI and population change as a disaster outcome, but the SVI score itself provides more value as a snapshot of distributive injustice highlighting the potential for negative outcomes resulting from underlying vulnerability. By analyzing the relationship between variables that are used to calculate the SVI score and population loss alongside other observed changes, we can begin to contextualize resilience within other processes interacting with preexisting social vulnerability.
Gentrification, redlining, and the illusion of resilience
In their analysis of gentrification and population change in New Orleans after Katrina, Van Holm and Wyczalkowski (2018) found a positive association between the physical damage from Hurricane Katrina and the likelihood of a tract gentrifying in the decade after the storm. Van Holm and Wyczalkowski (2018) specified baseline conditions necessary to designate whether or not a census tract in New Orleans was eligible to gentrify as defined by the Freeman framework. In their study, eligibility was defined as any tract located in the central city of a metropolitan area, with a median income lower than the 40th percentile at the beginning of the study period, a proportion of housing built within the past 30 years lower than the 40th percentile, an increase in the percentage of university graduates greater than the median increase in university graduates for the area between periods, and an increase in real housing prices (Freeman, 2005; Van Holm and Wyczalkowski, 2018).
While we did not follow the same methodology employed in their study, we utilized the same variables from Freeman’s (2005) Gentrification Framework with a focus on changes in socioeconomic status (SES) rather than eligibility plus change. Regarding eligibility, they found that it did not predict where damage was the most substantial, but that physical damage increases the probability of gentrifying with a decreasing rate as damage rises (Van Holm and Wyczalkowski, 2018). We found similar results. The purpose of Model B was to identify how well the 2000 SVI and flood depth predicted future gentrification measured as an aggregate of changes in socioeconomic status. The results of Model B showed that areas with higher pre-Katrina social vulnerability were more likely to gentrify after the disaster, but with significant variation. Additionally, we found that flood depth was negatively correlated with gentrification, meaning that areas more prone to severe flooding were less likely to gentrify. The high variation (low R2) in our results suggests that there are other factors responsible for gentrification in our study area that were not accounted for.
Model E attempted to further delineate the relationship between social vulnerability, population change, and gentrification. The model produced a negative correlation between gentrification and change in the SVI. Decreases in social vulnerability that suggest increased resilience following Katrina could result from processes like gentrification and demographic shifts rather than an equitable increase in resilience for the vulnerable population. In the case of Katrina and New Orleans, tracts appear more resilient in 2010 not because vulnerable residents became more resilient, but because they were either replaced or displaced. We argue that resilience as a recovery paradigm can harm the most vulnerable populations in two ways informed by our results.
First, changes in resilience can be created by replacing vulnerable populations with less vulnerable populations post-disaster. This leaves tracts appearing more resilient because the vulnerable population has been replaced. In some cases, this is intentional. The policy goal of New York City’s Build it Back program after Superstorm Sandy was to buy out vulnerable home-owners and resell their property to developers who could build flood-resilient structures with significantly higher economic value (Koslov, 2012). In an interview with Casagrande, a former mayor of a flood-prone town in Illinois expressed pride in having made his town more resilient by using FEMA buyouts to remove a trailer-home park. Loughran and Elliott (2019) found that most homeowners who accepted buyouts in Houston moved to equally hazardous areas. These examples illustrate how resilience can be increased by intentionally removing or replacing vulnerable populations. However, the vulnerable populations themselves are not becoming more resilient.
Second, the results of Model E suggest that census tracts may appear less vulnerable because of changes in overall demographic composition rather than improvements in resilience for remaining vulnerable populations. Kaswan (2020: p. 29–30) notes the importance of scale for justice studies and states that “the ‘right’ scale will depend on the nature of the harm being analyzed and purpose for which information is being gathered.” At the broadest scale of analysis, it would appear that vulnerability in New Orleans was not significantly affected by Hurricane Katrina when averaging across all census tracts (Table 1), but there is large variation among tracts. We show that reductions in social vulnerability can be explained at least partially by increased gentrification within tracts. Likewise, there were clear increases in post-disaster gentrification noted by Van Holm and Wyczalkowski (2018) (Table 1).
Measuring vulnerability by averaging census data at the tract level may obscure the vulnerability of populations that remain in tracts as the overall pattern shifts towards a wealthier, less vulnerable population through processes like gentrification occurring after a disaster. In this way, resilience as a recovery metric serves to obscure existing vulnerable populations that can remain after a disaster. We argue that resilience as a metric for recovery must go further than a return to status quo conditions or population replacement and address factors contributing to disparate outcomes for vulnerable populations. To achieve disaster justice and just resilience outcomes, we must ask ourselves resilience at what scale, for whom, and to what? (Cutter, 2016; Kaswan, 2020).
Resilience as a concept has seen a wide array of applications and definitions across different fields, but it typically involves the return to a previously functional, undisturbed state with a focus on adaptation (Fainstein, 2015). Our argument follows the ‘recovery machine’ hypothesis proposed by Pais and Elliot (2008), which states that pre-disaster status governs post-disaster access to resources and recovery, with wealthy communities being less affected and recovering faster from disaster than those with high social vulnerability before an event. Our results suggest that social vulnerability could be used to anticipate which populations face the greatest threat of displacement during and after a disaster, whether displacement occurs immediately because of underlying social conditions or in the long term because of the pressures of gentrification. When considering the impacts of a disaster, it is crucial to recognize that patterns of harm are directly influenced by the deliberate choices of policymakers, meaning that “there’s no such thing as a natural disaster” (Smith, 2006: p. 1).
Our results show that displacement and a lack of recovery were directly related to the underlying social vulnerability of populations across the three parishes in our study area. The most socially vulnerable residents were also the most likely to get displaced and the least likely to recover and their vulnerability partially resulted from conditions concentrated by the practice of redlining. Unjust policy decisions based almost entirely on race from nearly a century ago impact who does or does not recover following a disaster. If resilience is to be understood as a positive goal and the return to a previously undisturbed state, then the previous state being returned to must be a just one, or recovery can perpetuate inequity and recreate harm (Cutter, 2016).
Model D was created to understand which variables from the SVI and Freeman’s Gentrification Framework best explain resilience measured as population recovery. The stepwise regression model found that population change was best explained by a combination of vulnerability and gentrification indicators with Model D explaining 82% of the overall variation (Table 3). Our results show that the gentrification variable of Home Ownership was the single greatest predictor of population change following Katrina. The remaining four indicators in the model all came from the 2000 SVI with Population Aged 17 and Younger being the second most significant variable. Interestingly, we found that neither poverty nor income were significant predictors of population change. Homeownership explains over 50% of the variation in population change.
This is significant for several reasons. First, homeownership was not included in the 2000 SVI, highlighting that a key indicator of vulnerability to displacement post-disaster was not included in the model meant to aid in identifying populations most at risk of disparate disaster outcomes. This finding supports prior critiques that the SVI’s construct validity is misaligned with theory depending on where you test it (Rufat et al., 2019; West, 2023; Painter et al., 2024). Second, low levels of homeownership can be linked to patterns of vulnerability that reflect historical redlining. This suggests that the single greatest determinant of whether or not a population recovered in New Orleans following Katrina wasn’t a matter of physical damage, but rather policy decisions made decades ago that concentrated a key form of vulnerability in minority neighborhoods through redlining. The consequences of unjust and prejudicial procedures cemented distributive inequities in the form of access to homeownership and contributed to disparate outcomes in population post-disaster recovery.
Reimagining resilience through disaster justice and policy implications
Differential disaster outcomes between socially vulnerable and resilient populations are often the result of the underlying social conditions rather than the severity of the event (Thomas et al., 2018). Dugan et al. (2023) conducted a study on the links between disasters, disparate outcomes, and redlining and found that historically redlined communities are likely to have higher social, preparedness, and evacuation vulnerabilities compared to non-redlined communities in the United States. Our findings validate that previously redlined neighborhoods in New Orleans had higher levels of social vulnerability than areas that were not subjected to redlining. The goal of disaster justice is to ensure more equitable outcomes and fewer disparities among populations across all stages of disaster management (Verchick, 2012; Lukasiewicz, 2020). The CDC’s Social Vulnerability Index is intended to aid disaster management professionals through all phases of disaster response from mitigation and preparedness to response and recovery. As such, the index serves as a valuable tool for achieving the ideals of disaster justice.
When Verchick coined the term Disaster Justice in 2012, he highlighted that the magnification of social vulnerability by natural disasters results from governance structures and policy decisions that perpetuate vulnerabilities, inequalities, and injustices (Verchick, 2012). Through our Hurricane Katrina case study, we sought to uncover factors contributing to differential outcomes faced by socially vulnerable populations after Katrina. Additionally, we highlighted the impact of historical procedural injustice in the form of redlining and its contemporary manifestation in lower homeownership rates and a resulting lack of recovery for vulnerable populations. Addressing these disparate outcomes requires governments and policymakers to adopt three concepts of justice critical to reducing the worst outcomes faced by socially vulnerable populations and going beyond returning to the status quo or displacing the vulnerable in pursuit of resilience.
Recognition justice is necessary to aid practitioners in identifying that socially vulnerable communities may have underlying conditions that inhibit their ability to recover effectively after a disaster and that their experiences may differ from less vulnerable populations. Recognizing that past harms contributed to present conditions that produce disparate outcomes is critical to the pursuit of better processes and the distribution of resources for recovery. Socially vulnerable populations in historically redlined areas must be included in disaster preparation and evacuation training activities to remedy the past disenfranchisement from decision-making and development processes regarding their homes and neighborhoods.
Fair processes for the inclusion of vulnerable populations that are centered around ideals of deliberation and recognition can help foster inclusion in the disaster management process while increasing their adaptive capacity. Recognizing the prior unjust state of development policies that concentrated vulnerabilities, creating fair processes to enfranchise previously excluded groups, and ensuring the just distribution of resources from preparation to recovery will help achieve disaster justice by reducing the conditions that contribute to disparate outcomes among vulnerable and resilient communities.
We argue that Social Vulnerability Indices like the CDC’s SVI are valuable tools for identifying where recognition, procedural, and distributive justice processes need to be targeted to achieve disaster justice and reduce inequitable outcomes for vulnerable populations. Our results indicate that practitioners need to consider the scale, population, and hazard being measured in addition to systemic indicators of vulnerability to better understand what makes communities more vulnerable than others to displacement from disasters. Policymakers in particular should incorporate dimensions of justice into mitigation and adaptation planning, with a focus on long-term vulnerability reduction rather than short-term recovery metrics like resilience. Resilience is a positive goal, but it too needs to be infused with the ideals of justice so that its application does not perpetuate or recreate injustices.
Following similar calls from Van Holm and Wyczalkowski, Painter, Rufat, and West, we suggest that researchers continue testing the construct validity of the CDC’s Social Vulnerability Index as well as other indices at smaller scales with the inclusion of systemic contributions to vulnerability. The SVI provides a powerful roadmap for addressing procedural, distributive, and recognitional injustice in the disaster management field. As climate change progresses, tools like the SVI will prove increasingly useful for understanding differences in disaster outcomes, but they need to be improved. Future development and validation of SVIs should include variables that can capture systemic causes of vulnerability and track processes that contribute to displacement like gentrification to prevent masking of continued injustice. Disaster management practices should prioritize community empowerment and inclusion in decision-making with a particular focus on communities historically subject to distributive and procedural injustice like redlining. Additionally, we call for further research on the linkages between social vulnerability and the likelihood of gentrifying after a disaster.
Policy recommendations
Several actionable recommendations for guarding against gentrification-driven “false resilience” interpretations can be made from our findings. First, our results demonstrate that vulnerability indices like the SVI can be more helpful for achieving disaster justice if combined with other socio-economic metrics like gentrification. Second, vulnerability indices are more useful when used for before-and-after comparisons rather than snapshots in time. Third, the predictive capabilities of the SVI are significantly improved when disaggregated and tested as individual variables in combination with variables not included in the SVI. Specifically, identifying procedurally unjust policy impacts from redlining in the form of homeownership gaps allowed us to include a systemic indicator of vulnerability. Practitioners should look backwards to understand what factors and policies reproduce present vulnerabilities.
If used without context, vulnerability indices tend to define resilience in terms of places rather than people. The potential for SVI to document distributive injustice can serve as a starting point for correcting past injustices by guiding procedural justice that includes inclusive planning and disaster recovery. This requires moving beyond data about census tracts and attending to the experiences of individual people. Understanding displacement processes is important for learning how to facilitate procedural justice and avoid reproducing distributional injustice after disasters.
We identified that lack of homeownership was a key vulnerability contributing to displacement following Katrina. Identifying how historic disinvestment in infrastructure and housing can be alleviated by current resilience investments through public-private partnership structures such as resilience bonds will be essential to achieving and financing disaster justice in marginalized communities (Roper et al., 2025). However, these results could be unique to New Orleans and Hurricane Katrina, which highlights the need to understand unique place-based historical roots of vulnerability.
Methodological limitations and future research
There are several limitations to our study. The most important is that these results only apply to the specific context of New Orleans and the flood effects of Hurricane Katrina. Our assessment of the SVI is limited to the version from 2000. The findings in this paper should not be understood as indicative of trends across the entire United States for every type of event, but may be useful for identifying if these patterns apply to other cities following different events. Using Logan’s Longitudinal Database to interpolate data across years also led to some errors which resulted in some tracts being excluded from the study. As such, there may be additional uncertainty within our models.
Our analysis does not include the mid-decade population shifts, short-term return migrations, or policy interventions that occurred immediately after Katrina because of our reliance on decennial census counts. We were interested in longer-term recovery patterns and the decennial census counts provided stable estimates for comparison while also corresponding to decadal SVIs. While we supplemented analyzing short-term recovery patterns by reviewing sources such as Flanagan et al. (2011), the omission of such data in our analysis represents a significant limitation in identifying what conditions residents returned under. Future SVI validation studies using Katrina could include comparisons of 2005 American Community Survey (ACS) data alongside decennial census counts.
Additionally, our study period of 2000–2010 only captured half of the decade in which gentrification occurred in New Orleans. It is important to note that our models were run with the first half of the gentrification process (2005–2010) in New Orleans compared to the full decade (2005–2015) studied in Van Holm and Wyczalkowski (2018). Lastly, our reliance on a stationary flood depth as a proxy for damage because of the lack of detailed damage estimates for all the parishes in our study may have biased our models to underestimate the effect of flood damage. Ignoring variation in building types, mitigation efforts, and infrastructure resilience may have resulted in an over- or underestimation of actual damage in specific tracts. This limits the ability of our study to consider how non-flood factors may have played a larger role in displacement. Future studies should integrate multiple damage data sources such as parcel-level insurance claims or FEMA damage assessments to capture physical damage. We wanted to avoid using monetary value to assess damages because of the differences in property values among wealthy and socially vulnerable populations. Additionally, FEMA damage estimates were not available at the tract level for our entire study region. Further studies should be conducted to verify our conclusions.
Conclusion
The CDC’s Social Vulnerability Index is useful for documenting distributive injustice and differential disaster outcomes among populations when operationalized as reduced resilience. We found that in the case of Hurricane Katrina in New Orleans, the SVI can be applied to predict which populations may be displaced and face obstacles to recovery. Further studies on different disaster scenarios and vulnerabilities are needed to confirm whether these trends hold elsewhere. Our results support findings that the SVI is an effective tool for understanding disaster impacts on vulnerable populations, but that additional variables are necessary to refine its explanatory power (Tellman et al., 2020; Wood et al., 2021; West, 2023).
We found that the SVI did not account for the effects of disaster-induced gentrification or historical processes like the impacts of redlining on homeownership. We echo the critiques of Painter et al. that the SVI lacks place-based rigor and that there is a pressing need for smaller-scale studies that identify systemic variables that explain why underlying vulnerabilities exist in the first place (Rufat et al., 2019; West, 2023; Painter et al., 2024). Understanding the cause of social vulnerability is critical to achieving disaster justice, but relying solely on the SVI and resilience as a metric for recovery should be done with caution. We found that lower SVI values from year to year can be misleading if they result from processes like gentrification or demographic shifts and not the improved resilience of vulnerable populations. Addressing this issue will require smaller-scale studies on the populations in socially vulnerable tracts and their experiences throughout the disaster management process. The environmental justice concepts of distributive, procedural, and recognition justice provide a framework for practitioners to analyze their policies and procedures.
Justice is imperative to recovery and injustice can be perpetuated by disaster impacts and responses. Resilience provides a valuable metric for recovery, but there is a need to think more critically about what baseline condition communities are expected to return to or whether improved resilience is a result of gentrification. If the initial condition was unjust, then the application of resilience as recovery must include justice considerations. Future research on the factors contributing to differential vulnerability and resilience must leverage the ideals of disaster justice to avoid creating new victims. Evans and Reid (2013) describe the life and death of the resilient subject and states that “the resilient subject is a subject which must permanently struggle to accommodate itself to the world, and not a subject which can conceive of changing the world, its structure, and conditions of possibility” (Evans and Reid, 2013). The concept of disaster justice provides the framework necessary to ensure vulnerable populations do not become victims of resilience and emerge as resilient participants in guiding change.
Data availability statement
Publicly available datasets were analyzed in this study. This data can be found at: https://www.census.gov/, https://dsl.richmond.edu/panorama/redlining/.
Author contributions
JR: Writing – original draft, Methodology, Writing – review & editing. DC: Writing – review & editing, Methodology, Writing – original draft.
Funding
The author(s) declare that financial support was received for the research and/or publication of this article. This research was made possible through a Research Futures Grant awarded to the Center for Catastrophe Modeling and Resilience by Lehigh University’s Provost’s Office.
Acknowledgments
The authors thank the Lehigh University Provost’s Office for supporting this research through a Research Futures grant awarded to the Center for Catastrophe Modeling and Resilience and the center’s members who provided insights and inspiration.
Conflict of interest
The authors declare that the research was conducted in the absence of any commercial or financial relationships that could be construed as a potential conflict of interest.
Generative AI statement
The authors declare that Gen AI was used in the creation of this manuscript. The use of Anthropic’s AI model Claude 3.7 was strictly used to assist in finding sources and suggestions for organizing the discussion section. Claude provided separate lists of sources for literature on resilience, environmental justice, and gentrification. These lists were used to identify additional sources deemed foundational to the literature review on each concept. All suggested sources were read and checked by the authors for accuracy and relevance before inclusion in the paper. Before the discussion section was completed, a draft of the paper was uploaded to Claude alongside a list of the four main points of our paper. Claude provided a general outline for the four distinct points based on the rest of the paper and we used the outline alongside our own to guide the flow of the discussion section. No portions of the paper were directly written by Claude or any other AI model.
Any alternative text (alt text) provided alongside figures in this article has been generated by Frontiers with the support of artificial intelligence and reasonable efforts have been made to ensure accuracy, including review by the authors wherever possible. If you identify any issues, please contact us.
Publisher’s note
All claims expressed in this article are solely those of the authors and do not necessarily represent those of their affiliated organizations, or those of the publisher, the editors and the reviewers. Any product that may be evaluated in this article, or claim that may be made by its manufacturer, is not guaranteed or endorsed by the publisher.
References
Aaronson, D., Faber, J., Hartley, D., Mazumder, B., and Sharkey, P. (2021). The long-run effects of the 1930s HOLC ‘redlining’ maps on place-based measures of economic opportunity and socioeconomic success. Reg. Sci. Urban Econ. 86:103622. doi: 10.1016/j.regsciurbeco.2020.103622
Bakkensen, L. A., Fox-Lent, C., Read, L. K., and Linkov, I. (2016). Validating resilience and vulnerability indices in the context of natural disasters. Risk Anal. 37, 982–1004. doi: 10.1111/risa.12677
Blackwood, L., and Cutter, S. L. (2023). The application of the social vulnerability index (SoVI) for geo-targeting of post-disaster recovery resources. Int. J. Disaster Risk Reduct. 92:103722. doi: 10.1016/j.ijdrr.2023.103722
Centers for Disease Control and Prevention (2024). Social vulnerability index. place and health—geospatial research, analysis, and services program (GRASP). Available online at: https://www.atsdr.cdc.gov/place-health/php/svi/index.html.
City of New Orleans (2019). Storm surge—NOLA Ready. Nola.gov. Available online at: https://ready.nola.gov/hazard-mitigation/hazards/storm-surge-and-coastal-flooding/.
Cretney, R. (2014). Resilience for whom? Emerging critical geographies of socio-ecological resilience. Geogr. Compass 8, 627–640. doi: 10.1111/gec3.12154
Centers for Disease Control and Prevention (2000). ArcGIS. [online] Arcgis.com. Available online at: https://www.arcgis.com/home/item.html?id=a1ccf99ffac9476faeb9986effca4024. (Accessed October 25, 2025).
Cutter, S. L. (2016). Resilience to what? Resilience for whom? Geogr. J. 182, 110–113. doi: 10.1111/geoj.12174
Cutter, S. L. (2024). The origin and diffusion of the social vulnerability index (SoVI). Int. J. Disaster Risk Reduct. 109:104576. doi: 10.1016/j.ijdrr.2024.104576
Cutter, S. L., Boruff, B. J., and Shirley, W. L. (2003). Social vulnerability to environmental hazards. Soc. Sci. Q. 84, 242–261. doi: 10.1111/1540-6237.8402002
Dugan, J., Byles, D., and Mohagheghi, S. (2023). Social vulnerability to long-duration power outages. Int. J. Disaster Risk Reduct. 85:103501. doi: 10.1016/j.ijdrr.2022.103501
Evans, B., and Reid, J. (2013). Dangerously exposed: the life and death of the resilient subject. Resilience 1, 83–98. doi: 10.1080/21693293.2013.770703
Fainstein, S. (2015). Resilience and justice. Int. J. Urban Reg. Res. 39, 157–167. doi: 10.1111/1468-2427.12186
Finch, C., Emrich, C. T., and Cutter, S. L. (2010). Disaster disparities and differential recovery in New Orleans. Popul. Environ. 31, 179–202. doi: 10.1007/s11111-009-0099-8
Flanagan, B. E., Gregory, E. W., Hallisey, E. J., Heitgerd, J. L., and Lewis, B. (2011). A social vulnerability index for disaster management. J. Homel. Secur. Emerg. Manag. 8. doi: 10.2202/1547-7355.1792
Flanagan, B. E., Hallisey, E. J., Adams, E., and Lavery, A. (2018). Measuring community vulnerability to natural and anthropogenic hazards: the centers for disease control and prevention’s social vulnerability index. J. Environ. Health, 80:34. Available online at: https://pmc.ncbi.nlm.nih.gov/articles/PMC7179070/
Freeman, L. (2005). Displacement or succession? Urban Aff. Rev. 40, 463–491. doi: 10.1177/1078087404273341
Hallegatte, S., Vogt-Shilb, A., Bangalore, M., and Rozenberg, J. (2017). Unbreakable: building the resilience of the poor in the face of natural disasters. Available online at: https://documents1.worldbank.org/curated/en/512241480487839624/pdf/110618-PUB-Box396333B-PUBLIC-PUBDATE-11-24-16-UNIT-ITSKI.pdf.
Harden, M., Walker, N., and Akuno, K. (2007). Racial discrimination and ethnic cleansing in the United States in the aftermath of hurricane Katrina: a report to the United Nations’ Committee for the Elimination of racial discrimination. Geneva, Switzerland: Office of the United Nations High Commissioner for Human Rights (OHCHR).
Kaswan, A. (2020). “Distributive environmental justice” in ed. Brendan C. Environmental justice. (London: Routledge), 21–36.
Katz, L. (2021). A racist past, a flooded future: formerly redlined areas have $107 billion worth of homes facing high flood risk—25% more than non-redlined areas. Redfin real estate news. Available online at: https://www.redfin.com/news/redlining-flood-risk/.
Koslov, L. (2012). Fighting for retreat after Sandy: the ocean breeze buyout tent on Staten Island. Metropolitics.
Logan, J., Xu, Z., and Stults, B. (2020). Diversity and disparities. Brown.edu. Available online at: https://s4.ad.brown.edu/Projects/Diversity/researcher/ltbddload/datalist.aspx.
Loughran, K., and Elliott, J. R. (2019). Residential buyouts as environmental mobility: examining where homeowners move to illuminate social inequities in climate adaptation. Popul. Environ. 41, 52–70. doi: 10.2307/45216986
Lukasiewicz, A. (2020). “The emerging imperative of disaster justice” in eds. Lukasiewicz, A and Baldwin, C. Natural hazards and disaster justice, (Singapore: Springer Singapore) 3–23.
Myers, C. A., Slack, T., and Singelmann, J. (2008). Social vulnerability and migration in the wake of disaster: the case of hurricanes Katrina and Rita. Popul. Environ. 29, 271–291. doi: 10.1007/s11111-008-0072-y
NASA (2005). Hurricane Katrina Floods New Orleans. earthobservatory.nasa.gov. Available online at: https://earthobservatory.nasa.gov/images/15445/hurricane-katrina-floods-new-orleans.
Painter, M., Shah, S. H., Damestoit, G. C., Khalid, F., Prudencio, W., Chisty, M., et al. (2024). A systematic scoping review of the social vulnerability index as applied to natural hazards. Nat. Hazards 120, 7265–7356. doi: 10.1007/s11069-023-06378-z
Pais, J. F., and Elliott, J. R. (2008). Places as recovery machines: vulnerability and neighborhood change after major hurricanes. Soc. Forces 86, 1415–1453. doi: 10.1353/sof.0.0047
Ray, R., Perry, A. M., Harshbarger, D., Elizondo, S., and Gibbons, A. (2021). Homeownership, racial segregation, and policy solutions to racial wealth equity. Brookings. Available online at: https://www.brookings.edu/articles/homeownership-racial-segregation-and-policies-for-racial-wealth-equity/.
Roper, J. A., Casagrande, D. G., and Bocchini, P. (2025). Climate change and insurance: embracing resilience for private market survival. Sustain. Dev. doi: 10.1002/sd.70106
Rufat, S., Tate, E., Emrich, C. T., and Antolini, F. (2019). How valid are social vulnerability models? Ann. Am. Assoc. Geogr. 109, 1131–1153. doi: 10.1080/24694452.2018.1535887
Schlosberg, D. (2004). Reconceiving environmental justice: global movements and political theories. Environ. Polit. 13, 517–540. doi: 10.1080/0964401042000229025
Smith, N. (2006). There’s no such thing as a natural disaster. Social Science Research Council. Available online at: https://items.ssrc.org/understanding-katrina/theres-no-such-thing-as-a-natural-disaster/. (Accessed April 21, 2025).
Sovacool, B. K., Tan-Mullins, M., and Abrahamse, W. (2018). Bloated bodies and broken bricks: power, ecology, and inequality in the political economy of natural disaster recovery. World Dev. 110, 243–255. doi: 10.1016/j.worlddev.2018.05.028
Tee Lewis, P. G., Chiu, W. A., Nasser, E., Proville, J., Barone, A., Danforth, C., et al. (2023). Characterizing vulnerabilities to climate change across the United States. Environ. Int. 172:107772. doi: 10.1016/j.envint.2023.107772
Tellman, B., Schank, C., Schwarz, B., Howe, P. D., and de Sherbinin, A. (2020). Using disaster outcomes to validate components of social vulnerability to floods: flood deaths and property damage across the USA. Sustainability 12:6006. doi: 10.3390/su12156006
Thomas, K., Hardy, R. D., Lazrus, H., Mendez, M., Orlove, B., Rivera-Collazo, I., et al. (2018). Explaining differential vulnerability to climate change: a social science review. WIREs Clim. Change 10, 1–18. doi: 10.1002/wcc.565
United States Census Bureau (2025). Explore census data. United States Census Bureau. Available online at: https://data.census.gov/.
Van Holm, E. J., and Wyczalkowski, C. K. (2018). Gentrification in the wake of a hurricane: New Orleans after Katrina. Urban Stud. 56, 2763–2778. doi: 10.1177/0042098018800445
Verchick, R. Disaster justice: the geography of human capability. Duke Environ. Law Policy Forum, 23 23–71 (2012). Available online at: https://scholarship.law.duke.edu/delpf/vol23/iss1/2
Wang, X., and Lo, K. (2021). Just transition: a conceptual review. Energy Res. Soc. Sci. 82:102291. doi: 10.1016/j.erss.2021.102291
West, J. (2023). Social vulnerability and population loss in Puerto Rico after Hurricane Maria. Popul. Environ. 45:8. doi: 10.1007/s11111-023-00418-3
Wing, O. E. J., Lehman, W., Bates, P. D., Sampson, C. C., Quinn, N., Smith, A. M., et al. (2022). Inequitable patterns of US flood risk in the Anthropocene. Nat. Clim. Chang. 12, 156–162. doi: 10.1038/s41558-021-01265-6
Keywords: resilience, social vulnerability, gentrification, hurricane, climate change, redlining, distributive justice, procedural justice
Citation: Roper J and Casagrande D (2025) Victims of resilience: an evaluation of social vulnerability’s applicability to disaster justice. Front. Hum. Dyn. 7:1615833. doi: 10.3389/fhumd.2025.1615833
Edited by:
Olasunkanmi Habeeb Okunola, Institute for Environment and Human Security (UNU), GermanyReviewed by:
Thecla Akukwe, University of Nigeria, Nsukka, NigeriaRegina Obilie Amoako-Sakyi, University of Cape Coast, Ghana
Copyright © 2025 Roper and Casagrande. This is an open-access article distributed under the terms of the Creative Commons Attribution License (CC BY). The use, distribution or reproduction in other forums is permitted, provided the original author(s) and the copyright owner(s) are credited and that the original publication in this journal is cited, in accordance with accepted academic practice. No use, distribution or reproduction is permitted which does not comply with these terms.
*Correspondence: David Casagrande, ZGFjNTExQGxlaGlnaC5lZHU=