 Lav R. Varshney
- Coordinated Science Laboratory, Department of Electrical and Computer Engineering, University of Illinois at Urbana-Champaign, Urbana, IL, USA
In the Big Data era, informational systems involving humans and machines are being deployed in multifarious societal settings. Many use data analytics as subcomponents for descriptive, predictive, and prescriptive tasks, often trained using machine learning. Yet when analytics components are placed in large-scale sociotechnical systems, it is often difficult to characterize how well the systems will act, measured with criteria relevant in the world. Here, we propose a system modeling technique that treats data analytics components as “noisy black boxes” or stochastic kernels, which together with elementary stochastic analysis provides insight into fundamental performance limits. An example application is helping prioritize people’s limited attention, where learning algorithms rank tasks using noisy features and people sequentially select from the ranked list. This paper demonstrates the general technique by developing a stochastic model of analytics-enabled sequential selection, derives fundamental limits using concomitants of order statistics, and assesses limits in terms of system-wide performance metrics, such as screening cost and value of objects selected. Connections to sample complexity for bipartite ranking are also made.
1. Introduction
There is an emerging ubiquity to data analytics that have multifarious machine learning and data mining algorithm subcomponents and that are embedded in sociotechnical systems, such as firms and cities. When these systems are deployed in society, they bring together humans and machines in increasingly complex configurations, despite algorithms often being hidden from view. They particularly allow people to thrive in the era of large-scale data rather than being overwhelmed by the cacophonous din of information overload.
Data analytics have emerged as a key driver of value in business operations and allow firms to differentiate themselves in competitive markets (Apte et al., 2003; Davenport and Harris, 2007; Varshney and Mojsilović, 2011). This use of data, statistical and quantitative analyses, explanatory and predictive models, and fact-based management has been driving decisions and actions both for the internal processes of firms, such as human resource management (Cao et al., 2011), and for customer-facing processes.
Data can not only bring insight into urban phenomena, such as pollution (Jain et al., 2014) or provide the basis for establishing a science of cities (Bettencourt, 2013), but also can in fact be incorporated into city analytics systems that improve quality of life through real-time monitoring and control (Kitchin, 2014; Townsend, 2014) or by providing policy insights to human actors (Appel et al., 2014).
Although data analytics is becoming a key part of sociotechnical systems, the academic literature in the machine learning and data mining field does not typically focus on the system-level impact of data analytics. Consequently typical measures of performance that are optimized and reported – accuracy, recall, and precision – do not always align with domain experts’ assessment of performance (Wagstaff, 2012; Rudin and Wagstaff, 2014). Indeed, when data analytics are used in real applications, success is often not due to detailed differences in performance between individual algorithms (according to typical measures) but by how well the solution fits the unique aspects of the domain and its evaluation measures (Rudin and Wagstaff, 2014). At the same time, there is now a zoo of algorithmic possibilities, each with a life of its own.1
Given this state of affairs, it is important to develop an approach to sociotechnical system modeling and analysis that abstracts away from the specifics of particular algorithms and obtains systems-level understanding. The approach should handle the complex interconnections of data analytics components that interact with each other and with people (de Weck et al., 2011). The approach should provide insight into how algorithmic improvements translate into gains that “matter to the world outside of machine learning research, … [in terms of] dollars saved, lives preserved, time conserved, effort reduced, quality of living increased, and so on” (Wagstaff, 2012). Indeed in business, one of the long-standing questions has been to characterize the return on investment in data systems (Spira, 2002), likewise for voter data in elections (Parsons and Hennessey, 2012) and a multitude of other societal settings. Hence, the approach should also yield fundamental limits that demarcate what is possible from what is impossible in data analytics systems (Varshney, 2014b), no matter how much effort engineers exert in improving algorithms.
Here, we describe an approach to encapsulate machine learning and data mining algorithms as stochastic kernels with specified probabilistic input–output relationships, “noisy black boxes” as it were. The transition probability assignment can be related to traditional machine learning performance metrics, if desired. As far as we know, this is a novel approach to studying analytics systems, cf. Kuncheva (2004). When several algorithms are linked together, perhaps also with people, we would have a stochastic network – representable as a block diagram – which can be studied using methods from stochastic analysis.
The easy theoretical approach is meant to yield insights for consumption by potential users of data systems, such as business executives or city government officials. Such users are interested in understanding the basic trade-offs present in these systems under metrics they care about, knowing how much value an algorithm deployment effort can provide, and determining whether it is worthwhile spending time/energy in developing specific advanced algorithms. They are typically not interested in detailed evaluation of specific algorithm performance, which has been the main focus in published research in machine learning and data mining.
This method of encapsulation has strong analogies with the way communication channels are cast as stochastic kernels in information theory or observers are cast as stochastic kernels in estimation and control theory. In fact, block diagrams as cognitive tools have been of utmost importance in the historical development of information theory and communication system design, from Claude Shannon onward (Varshney, 2014a). As has been noted, “Shannon came up with a unifying, general theory of communication. It did not matter whether you transmitted signals using copper wire, an optical fiber, or a parabolic dish. It did not matter if you were transmitting text, voice, or images. Shannon envisioned communication in abstract, mathematical terms” (Guizzo, 2003). This unified the zoo of communication technologies into a single framework and allowed the determination of fundamental limits, just as we aim to do for data analytics systems here.
In addition to the ability to characterize sociotechnical system performance, encapsulation creates strong abstraction boundaries that lead to modular software engineering and easily modified/maintained systems, cf. Mozafari et al. (2014). Otherwise, a large amount of hidden technical debt may be incurred in using machine learning components in larger systems due to unintended system-level couplings (Sculley et al., 2014). Moreover, factoring data analytics systems into smaller blocks can even improve performance. Breaking a learning problem into two subproblems and pretraining each model separately led (Gülçehre and Bengio, 2013) to a solution of a task that seemed impossible otherwise.
One common criticism of black box components is that they are not interpretable by system users, but this is a statement about algorithms that are not understandable. Here, the “noisy black boxes” actually reduce the cognitive load for the large-scale sociotechnical system designer, who understands exactly what is happening at a suitably abstract level.
In the remainder of this paper, we demonstrate the approach of treating machine learning components as stochastic kernels in analyzing the performance of sociotechnical systems, through an example of sequential selection. The best theories are said to be practical. Hence, to evaluate the proposed stochastic approach, we see whether users are able to use it to gain useful insight. We describe how the approach was in fact successfully used by human resource executives in a large multinational corporation and by government officials in a medium-sized American city.
2. Data Analytics to Prioritize Human Attention
When there is an overload of data and information (Spira, 2011; Anderson and de Palma, 2012), it causes a scarcity of human attention and energy (Simon, 1971; Davenport and Beck, 2001). Data analytics systems can prioritize people’s limited attention by ranking items. Some typical examples of sociotechnical import from my own work, beyond simple information retrieval, include the following.
• Large companies in high-growth markets receive tens of thousands of job applications per month, and this overloads human screeners and interviewers. As such, it is useful to develop algorithms trained on historical data that automatically rank candidates according to quality, likelihood of accepting an offer if made one, and likelihood of staying with the company for an extended period (Mehta et al., 2013).
• In Syracuse, NY, USA, about 5% of houses have been abandoned and lie vacant, causing drug crime, arson risk, and loss of civic pride. Some of these vacancies cause neighboring properties to become vacant, bringing down whole neighborhoods. Since the city government has limited attention and resources, a system to predict future vacancies or identify vacant parcels with all the features of occupancy (especially those on neighborhood tipping points) can be used to prioritize actions (Appel et al., 2014).
• Just as with urban renewal, governments have limited attention and resources for child protective services. By building a predictor for the severity of a reported child abuse case, and further using queuing-theoretic ideas when classification is noisy, we can prioritize cases to be investigated, e.g., in the Capital Region of New York (Williams et al., 2012).
As we will see, all of these problems fall under the framework of Figure 1A. Let us use human resource analytics to concretely describe basic system design; mapping to other problems should be clear. One way of providing decision support to screeners would be to automatically rank candidates according to quality, using analytics built on resume features. The screeners could then proceed sequentially through the ranked list until they reach their quota of candidates meeting a certain cutoff level. A data-driven prioritization scheme could provide value in two ways:
• first, it could reduce the evaluation cost required for screening and
• second, it could increase the quality of candidates that pass screening.
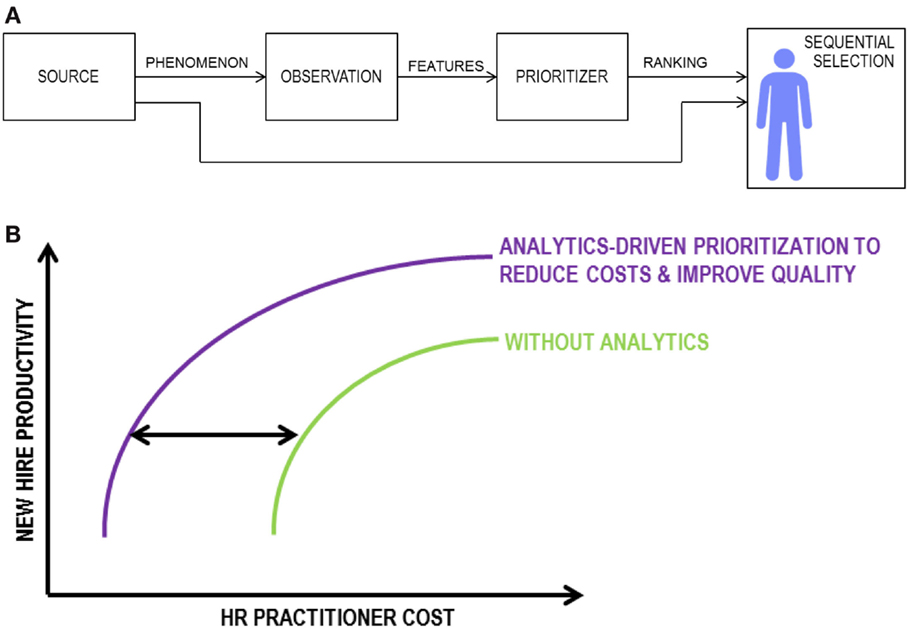
Figure 1. General sociotechnical sequential selection system. (A) Block diagram and (B) schematic trade-off between cost and quality, as parameterized by selection threshold. The use of data analytics can yield performance gains by shifting the performance curve to the left.
Indeed, the cutoff level in the sequential selection process would trade-off between these two gains. This basic trade-off is depicted in Figure 1B, demonstrating the value of analytics algorithms. If analytics operated without error, performance analysis would be simple. Unfortunately, there are inherent uncertainties in judging candidates from resumes. Even Bayes-optimal ranking functions incur some error, and algorithms trained on finite training sets incur even more error (Agarwal et al., 2005; Clémençon and Vayatis, 2009; Kotłowski et al., 2011).
By developing a model for noisy prioritization, we will be able to characterize this trade-off and thereby quantify the sociotechnical value of analytics-based ranking as decision support for sequential selection. Analysis will draw on the theory of concomitants of order statistics (Yeo and David, 1984; David and Nagaraja, 1998).
3. A Model of Sociotechnical Sequential Selection Systems
The basic structure of general sociotechnical sequential selection systems is drawn in Figure 1A. The data-driven ranking algorithm is depicted as “Prioritizer,” whereas the final human decision maker is depicted as “Sequential Selection.” The diagram corresponds to the abstract formalism that follows; for concreteness of terms, we again use human resource analytics as the example.
Consider a sequence of random variables X1, X2, …, Xn, drawn i.i.d. from a parent random variable X ∈ χ ⊆ ℝ according to cumulative distribution function FX(x). This sequence of random variables represents the underlying quality of the n candidates who are applying for a given job requisition. We assume realizations of these random variables are observable to human screeners, but with some cost.
Now, consider the second sequence of random variables Y1, Y2, …, Yn that are also i.i.d. and are jointly distributed with the underlying quality variables according to FX,Y(x,y) with corresponding marginal distribution function FY(y) from alphabet 𝒴 ⊆ ℝ. These indicator variables should be thought of as noisy versions of the underlying quality variables produced by an analytics algorithm used to perform prioritization.
To generate a prioritized list, the candidates 1, …, n are sorted according to their Y-values. This yields the order statistics Y(1) ≤ Y(2) ≤ … ≤ Y( n). It also induces a new ordering on the X-values, called the concomitants of the order statistics and denoted X[1] ≤ X[2] ≤ … ≤ X[ n].
Rather than batch processing (Feinberg and Huber, 1996), we consider sequential selection as follows. There is a fixed cutoff level θ ∈ χ and a quota that is to be met m, θn < m < n. The screener proceeds down the prioritized list in order (ordered according to the indicator variables) and selects a candidate if its concomitant value x[ i] is below the threshold θ and rejects the candidate otherwise. This proceeds sequentially until m candidates are selected. The index number of this last-selected candidate is denoted by random variable J.
To study the sociotechnical value of prioritization, we define two performance criteria. The first is the expected evaluation cost c and is simply the expected value of the stopping time J: c = EX,Y [J], smaller is better. The second performance criterion is the expected quality of candidates that are selected, q, given by
where u(⋅) is a monotonically increasing utility function, which we will take to be the identity function. Contrary to Figure 1B, smaller quality values q are better in this formalism.
To quantify the sociotechnical gains prioritization algorithms provide, we may compare to operating with no prioritization. It is easy to argue that without prioritization, the cost is distributed as a negative binomial distribution that has expected value c° given by
Due to the random ordering and the picking principle, selected candidates will have expected quality q° that is just the mean conditional on being less than the cutoff level:
Thus, we may alternatively define the value of a ranking algorithm in terms of the gain over operations without prioritization via non-negative variables Δc and Δq:
We determine lower bounds on (c, q) by considering a perfect ranking algorithm, such that X and Y are almost surely equal, via the theory of order statistics (David and Nagaraja, 2003). Let F( r)(x) be the distribution function of the rth order statistic. Then the probability that the rth entry in the list will be below θ is simply F( r)(θ). In general, this finite-sample computation is complicated and so one can consider asymptotic expressions when n → ∞ with m/n as a fixed constant, i.e., in the central order statistic regime. In this case, the distribution functions converge so that independent of the threshold θ, the cost is c• = m and the quality is .
That is, there are bounds:
where the lower bounds are expressed as asymptotic inequalities ≾. For any given intermediate value of accuracy of the ranking algorithm, we would use the distribution function of the concomitant of the order statistics.
Note that changing the value of θ induces a trade-off between c and q, and that the better the analytics algorithm (or equivalently the more strongly correlated X and Y), the more sociotechnical value.
4. Analysis of Analytics-Based Prioritization
To demonstrate that elementary stochastic analysis gives performance insight, let us assert a particular form of stochastic kernel to describe the ranking algorithm. Let FX,Y be governed by a copula model (Nelsen, 2006), such as a Clayton copula, where the strength of coupling is denoted by α:
This has uniform marginals for X and Y. Here, we use a copula-based stochastic kernel, but it is also possible to empirically learn the joint distribution for given classes of algorithms and data sets. For prioritization, a typical data set is of binary quality labels, which are used to train bipartite ranking algorithms (Agarwal et al., 2005).
The key to determining fundamental trade-offs among cost, quality, and algorithm quality (c, q, α) is to statistically characterize the stopping point of the selection procedure J. For convenience, we define a new sequence of indicator random variables:
whose distribution can be derived directly from the concomitant distribution . Then the mass function, Pr[J = j], of when the quota m is fulfilled is simply
Once we have this distribution, the expected value quantities c and q follow directly, as functions of selection threshold θ and algorithm quality α.
Theorem 1: If FX,Y is from a family of distributions parameterized by coupling variable α, it is possible to analytically compute fundamental trade-offs between cost, quality, and algorithm quality:
where the trade-off curve is parameterized by threshold θ of the selection procedure.
Proof: To obtain Pr[J = j], use distributional theory of concomitants of order statistics, in terms of the cumulative distribution function of the rth concomitant F[ r: n]:
where φr: n is the density function of the rth order statistic from an i.i.d. sample from the uniform distribution on the unit interval:
Then, by computing c(J) and q(J), the desired result follows.
In forthcoming work beyond this short perspective paper, analytical characterizations for various examples are determined. To indicate the nature of the fundamental trade-off, Figure 2A shows a simulation result for a Clayton copula model. In particular, consider FX,Y(x,y) given by a Clayton copula with parameter α = 1, n = 10000, m = 1000, and varying θ. Then, Figure 2A shows the simulation performance trade-offs for the case when the prioritization is ignored (colors) and the case when prioritization is used (grayscale). The curve gets better and shifts to the left as the α parameter increases. Recall that smaller quality is better.
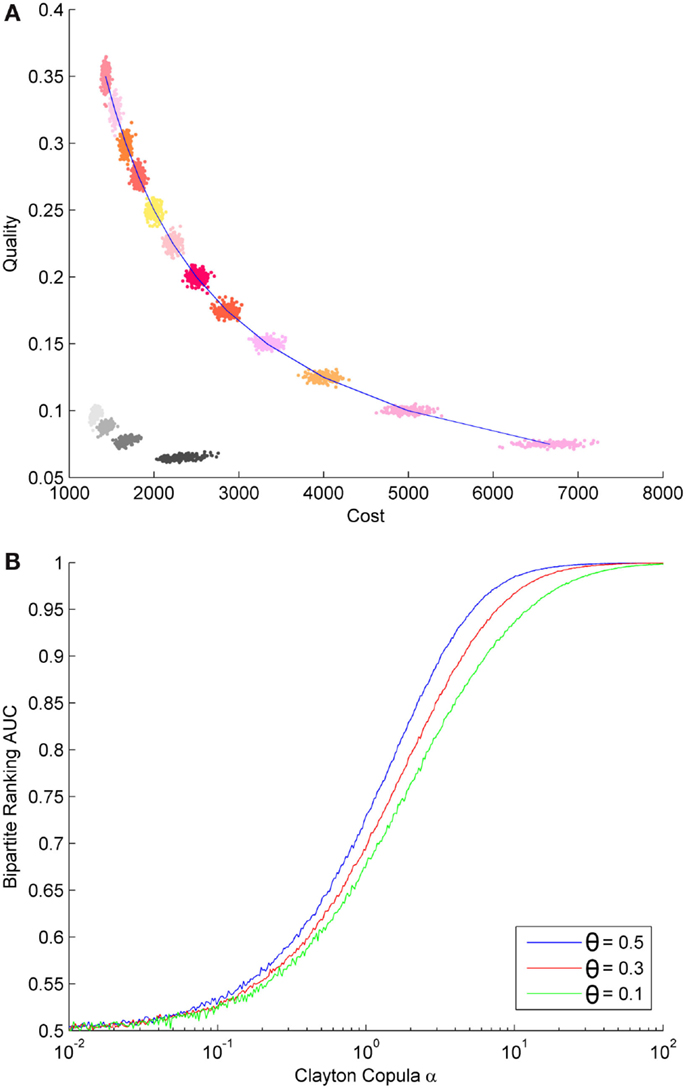
Figure 2. A Clayton copula-based model of sequential selection. (A) Cost-quality trade-off (c, q) for a system using prioritization (grayscale) and one not using prioritization (color); note that smaller quality is better. (B) Bipartite ranking AUC.
This performance characterization via the stochastic kernel model can be linked to traditional results in machine learning, e.g., on sample complexity (Kotłowski et al., 2011).
Corollary 1: In general, α can be linked to traditional machine learning sample complexity results to determine system-level value of training data.
The corollary indicates it is possible to answer the question, “How Big is Big?” in Big Data for algorithm training, not just in terms of error probability but in system-level terms of social importance.
To demonstrate, consider the bipartite ranking problem, where certain training samples are labeled as meeting the standard and other samples as not. The goal is to learn a scoring function such that when ranking samples according to the score, the probability that a positive sample is ranked below a negative sample is minimized. A traditional performance measure in bipartite ranking is the Area under the Curve (AUC) (Agarwal et al., 2005; Kotłowski et al., 2011). The AUC can be numerically related to the coupling parameter α of a Clayton copula model, as shown in Figure 2B for different selection thresholds θ; we denote the non-linear function plotted there as γ(α, θ). Forthcoming work determines γ(⋅) analytically for such examples.
Thus, we see that elementary techniques in probability theory allow us to understand basic trade-offs in sociotechnical sequential selection systems. Moreover, the noise level of the stochastic kernel can be directly related to the amount of training data that are available, via extant sample complexity results, e.g., Agarwal et al. (2005) and Kotłowski et al. (2011).
5. Practical Evaluation and Conclusion
In this perspective paper, we have put forth an approach to analyze large-scale data analytics in complex sociotechnical systems through a simple yet insightful method of black box abstraction and stochastic analysis. The main purpose of the piece has been to discuss the possibility of this line of inquiry, but is it useful?
The best theories are said to be practical. Hence, an appropriate method to evaluate the proposed stochastic approach to understanding data analytics is in seeing whether users gain useful insight into the basic trade-offs present in these systems under metrics they care about and into whether it is worthwhile spending time/energy in developing specific advanced algorithms. The users we have in mind are business executives or government officials.
We used the approach exactly in this way to help human resource executives in a large multinational corporation decide to pursue developing and deploying a recruitment analytics system (Mehta et al., 2013); this system is now widely used. Our personal experience in interacting with executives through these formalisms lends credence to efficacy. Similarly, we used the stochastic approach to help City of Syracuse, NY, USA, officials in deciding to proceed with an analytics-based system for urban housing policy (Appel et al., 2014). The system that was created led to New York State’s first land banks, enabling the city to reclaim nearly 4000 vacant properties and repurpose them in ways that revitalize neighborhoods and restore the tax base by as much as $11 million over 8 years. Again, our personal experience in interacting with city officials by showing them the basic trade-offs that can be achieved through analytics, without having to actually develop the analytics, was quite powerful. Thus, at least for these real-world cases within the sequential selection setting, the approach can be evaluated as successful.
The stochastic approach was demonstrated mathematically by characterizing ultimate performance limits of a general sociotechnical sequential selection system, under metrics relevant in industrial and governmental applications. The general procedure should be evident from the example, which can straightforwardly be extended to consider human screeners that are noisy in deciding whether x[ i] θ, where this unreliability may increase due to fatigue from screening more candidates.
The fact that analysis uses elementary probability rather than complicated concentration bounds is a strength to the approach, as it directly gives system designers an understanding of the design space in terms that are relevant to the social placement of the system. It allows the system designer to thrive in the era of complex data, rather than being overwhelmed by its cacophonous din.
Author Contributions
The author confirms being the sole contributor of this work and approved it for publication.
Conflict of Interest Statement
The author declares that the research was conducted in the absence of any commercial or financial relationships that could be construed as a potential conflict of interest.
Acknowledgments
Discussions with Kaiqing Zhang (Tsinghua University) and Aditya Vempaty (Syracuse University) are greatly appreciated; detailed derivations and closed-form expressions as per Section 4 obtained in collaboration with them are in preparation. Discussions with attendees at the 2013 Information Theory and Applications Workshop and at the National Academy of Engineering’s 2014 Indo-American Frontiers of Engineering Symposium, where these ideas were first presented, are also greatly appreciated.
Footnote
- ^See any textbook on machine learning, e.g., Marsland (2014), but also the no free lunch theorems (Wolpert, 1996).
References
Agarwal, S., Graepel, T., Herbrich, R., Har-Peled, S., and Roth, D. (2005). Generalization bounds for the area under the ROC curve. J. Mach. Learn. Res. 6, 393–425.
Anderson, S. P., and de Palma, A. (2012). Competition for attention in the information (overload) age. Rand J. Econ. 43, 1–25. doi: 10.1111/j.1756-2171.2011.00155.x
Appel, S. U., Botti, D., Jamison, J., Plant, L., Shyr, J. Y., and Varshney, L. R. (2014). Predictive analytics can facilitate proactive property vacancy policies for cities. Technol. Forecast. Soc. Change 89, 161–173. doi:10.1016/j.techfore.2013.08.028
Apte, C. V., Hong, S. J., Natarajan, R., Pednault, E. P. D., Tipu, F. A., and Weiss, S. M. (2003). Data-intensive analytics for predictive modeling. IBM J. Res. Dev. 47, 17–23. doi:10.1147/rd.471.0017
Bettencourt, L. M. A. (2013). The origins of scaling in cities. Science 340, 1438–1441. doi:10.1126/science.1235823
Cao, H., Hu, J., Jiang, C., Kumar, T., Li, T.-H., Liu, Y., et al. (2011). OnTheMark: integrated stochastic resource planning of human capital supply chains. Interfaces 41, 414–435. doi:10.1287/inte.1110.0596
Clémençon, S., and Vayatis, N. (2009). Tree-based ranking methods. IEEE Trans. Inf. Theory 55, 4316–4336. doi:10.1109/TIT.2009.2025558
Davenport, T. H., and Beck, J. C. (2001). The Attention Economy: Understanding the New Currency of Business. Boston: Harvard Business School Press.
Davenport, T. H., and Harris, J. G. (2007). Competing on Analytics: The New Science of Winning. Boston: Harvard Business School Press.
David, H. A., and Nagaraja, H. N. (1998). “Concomitants of order statistics,” in Handbook of Statistics 16: Order Statistics Theory and Methods, eds N. Balakrishnan and C. R. Rao (Amsterdam: Elsevier), 487–513.
David, H. A., and Nagaraja, H. N. (2003). Order Statistics, 3rd Edn. Hoboken, NJ: Wiley-Interscience.
de Weck, O. L., Roos, D., and Magee, C. L. (2011). Engineering Systems: Meeting Human Need in a Complex Technological World. Cambridge, MA: MIT Press.
Feinberg, F. M., and Huber, J. (1996). A theory of cutoff formation under imperfect information. Manag. Sci. 42, 65–84. doi:10.1287/mnsc.42.1.65
Guizzo, E. M. (2003). The Essential Message: Claude Shannon and the Making of Information Theory. Master’s thesis, Massachusetts Institute of Technology.
Gülçehre, Ç., and Bengio, Y. (2013). Knowledge Matters: Importance of Prior Information for Optimization. arXiv:1301.4083v6 [cs.LG].
Jain, R. K., Moura, J. M. F., and Kontokosta, C. E. (2014). Big data + big cities: graph signals of urban air pollution. IEEE Signal Process. Mag. 31, 130–136. doi:10.1109/MSP.2014.2330357
Kitchin, R. (2014). The real-time city? Big data and smart urbanism. GeoJournal 79, 1–14. doi:10.1007/s10708-013-9516-8
Kotłowski, W., Dembczyński, K., and Hüllermeier, E. (2011). “Bipartite ranking through minimization of univariate loss,” in Proceedings of the 28th International Conference on Machine Learning (ICML 2011), 1113–1120.
Kuncheva, L. I. (2004). Combining Pattern Classifiers: Methods and Algorithms. Hoboken, NJ: Wiley-Interscience.
Marsland, S. (2014). Machine Learning: An Algorithmic Perspective, 2nd Edn. Boca Raton, FL: CRC Press.
Mehta, S., Pimplikar, R., Singh, A., Varshney, L. R., and Visweswariah, K. (2013). “Efficient multifaceted screening of job applicants,” in Proceedings of the 16th International Conference on Extending Database Technology (EDBT), 661–671.
Mozafari, B., Sarkar, P., Franklin, M., Jordan, M., and Madden, S. (2014). Scaling up crowd-sourcing to very large datasets: a case for active learning. Proc. VLDB Endowment 8, 125–136. doi:10.14778/2735471.2735474
Parsons, C., and Hennessey, K. (2012). Obama campaign’s investment in data crunching paid off. Los Angeles Times.
Rudin, C., and Wagstaff, K. L. (2014). Machine learning for science and society. Mach. Learn. 95, 1–9. doi:10.1007/s10994-013-5425-9
Sculley, D., Holt, G., Golovin, D., Davydov, E., Phillips, T., Ebner, D., et al. (2014). “Machine learning: the high interest credit card of technical debt,” in NIPS 2014 Workshop on Software Engineering for Machine Learning (SE4ML).
Simon, H. A. (1971). “Designing organizations for an information-rich world,” in Computers, Communication, and the Public Interest, ed. M. Greenberger (Baltimore: The Johns Hopkins Press), 37–72.
Spira, J. B. (2011). Overload! How Too Much Information Is Hazardous to Your Organization. Hoboken, NJ: John Wiley & Sons.
Townsend, A. M. (2014). Smart Cities: Big Data, Civic Hackers, and the Quest for a New Utopia. New York: W. W. Norton & Company.
Varshney, K. R., and Mojsilović, A. (2011). Business analytics based on financial time series. IEEE Signal Process. Mag. 28, 83–93. doi:10.1109/MSP.2011.941554
Varshney, L. R. (2014a). “Block diagrams in information theory: drawing things closed,” in SHOT Special Interest Group on Computers, Information, and Society Workshop 2014.
Varshney, L. R. (2014b). “Engineering for problems of excess,” in Proceedings of the 2014 IEEE International Symposium on Ethics Engineering Science Technology.
Wagstaff, K. L. (2012). “Machine learning that matters,” in Proceedings of the 29th International Conference on Machine Learning (ICML 2012), 529–536.
Williams, R., Gifford, W. M., and Varshney, L. R. (2012). “Using statistical algorithms to predict abuse against children and prioritize cases,” in 18th National Conference on Child Abuse and Neglect.
Wolpert, D. H. (1996). The lack of a priori distinctions between learning algorithms. Neural Comput. 8, 1341–1390. doi:10.1162/neco.1996.8.7.1341
Keywords: concomitants of order statistics, data analytics, fundamental limits, sequential selection, sociotechnical systems, stochastic kernels
Citation: Varshney LR (2016) Fundamental Limits of Data Analytics in Sociotechnical Systems. Front. ICT 3:2. doi: 10.3389/fict.2016.00002
Received: 15 June 2015; Accepted: 03 February 2016;
Published: 18 February 2016
Edited by:
David Wolfe Corne, Heriot-Watt University, UKReviewed by:
Sebastian Ahnert, University of Cambridge, UKLaetitia Jourdan, University of Lille 1, France
Copyright: © 2016 Varshney. This is an open-access article distributed under the terms of the Creative Commons Attribution License (CC BY). The use, distribution or reproduction in other forums is permitted, provided the original author(s) or licensor are credited and that the original publication in this journal is cited, in accordance with accepted academic practice. No use, distribution or reproduction is permitted which does not comply with these terms.
*Correspondence: Lav R. Varshney, dmFyc2huZXlAaWxsaW5vaXMuZWR1