 Samiul Hasan
 Satish V. Ukkusuri2
 Xianyuan Zhan
- 1Liveable, Sustainable and Resilient Cities Program, Land and Water Flagship, CSIRO, Melbourne, VIC, Australia
- 2Lyles School of Civil Engineering, Purdue University, West Lafayette, IN, USA
Social media check-in services have enabled people to share their activity-related choices, providing a new source of human activity and social networks data. Geolocation data from these services offer us information, in new ways, to understand social influence on individual choices. In this paper, we investigate the extent of social influence on individual activity and lifestyle choices from social media check-in data. We first collect user check-ins and their social network information by linking two social media systems (Twitter and Foursquare) and analyze the structure of the underlying social network. We next infer user check-in and geo lifestyle patterns using topic models. We analyze the correlation between the social relationships and individual-level patterns. We investigate whether or not two individuals have similar activity choice and geo lifestyle patterns, if they are socially connected. We find that the similarity between two users, in their check-in behavior and lifestyle patterns, increases with the increase of the friendship probability.
1. Introduction
Smartphone-based social media applications have recently introduced a new service, known as check-in services, which allow people to share their activity-related choices in their online social networks, such as Facebook Places, Foursquare, Twitter, etc. These check-in services record an unprecedented amount of user-generated data of where and when an individual participates in an activity. This vast amount of geolocation data offer us, in new ways, people’s preferences and interests through their activity location choices for a large number of users over multiple months/years unimaginable before. In addition to location and timing information, these data reveal an individual’s social connections and their influence on his/her activity and lifestyle choices. From this new information, we can understand human mobility and activity behavior in a better way. As such, there are many opportunities to gain fundamental knowledge about user behavior analyzing these data at various levels of spatiotemporal resolution. Researchers are realizing the potential to harness the rich information provided by the location-based data, which have already enabled many novel applications, such as recommendation system for physical locations (or activity) (Zheng et al., 2010; Chang and Sun, 2011; Bao et al., 2012), recommending potential customers or friend (Zheng, 2011; Saez-Trumper et al., 2012), determining popular travel routes in a city (Wei et al., 2012), discovering mobility and activity choice behavior (Cheng et al., 2011; Noulas et al., 2012; Hasan et al., 2013; Pianese et al., 2013), activity recognition and classification (Lian and Xie, 2011; Hasan and Ukkusuri, 2014), estimating urban travel demand and traffic flow (Hasan, 2013; Liu et al., 2014; Wu et al., 2014), and modeling the influence of friendship on mobility patterns (Cho et al., 2011; Wang et al., 2011). In this paper, we analyze a dataset from a social media check-in service to understand the extent of social influence on individual activity behavior.
Characterizing social influence is pertinent and plays a vital component to analyze activity-travel behavior. The performance and efficiency of a transportation system heavily depend on its inherent dynamics. There exist complex relationships between a demand side manifested by the heterogeneity of human activity and mobility choices and a supply side manifested by the significant variations in network characteristics. A small change in travel behavior can significantly impact the performance of the underlying transportation network. Although time–space interactions and travel needs play the most important role in our activity-travel choices, social component also plays a significant role. However, because of the lack of empirical evidence, social influence is rarely considered in activity-travel behavior analysis (Bhat and Lawton, 1999).
So far, studying the influence of social relationships on activity-travel behavior has mainly focused on modeling travels for social activities (Hackney, 2005; Carrasco and Miller, 2006, 2009; Arentze and Timmermans, 2008). However, there is a broader impact of social interactions on activity-travel behavior; individual’s activity-travel decisions can be influenced by his/her social network members. Such influences have not been captured in activity-travel behavior analysis before. Another important drawback of these studies that the underlying social network data have is a limited size, restricting their usefulness for large-scale applications. Using large-scale mobile phone data, a recent study (Toole et al., 2015) avoided these limitations and found that individuals’ mobility patterns are more similar to their social contacts than strangers. Online social media data can also offer valuable information in this regard. Each user in social media is associated with a number of friends who help to build the overall social network. Such social network information becomes very useful to observe how an individual’s activity-travel choices are influenced by his/her friends’ choices.
The goal of this work is to understand the role of social relationships in activity location choices and geo lifestyle patterns using the data collected from check-in services of location-based social networks. In our previous work, we investigated how individual activity participation (Hasan and Ukkusuri, 2014) and lifestyle choices (Hasan and Ukkusuri, 2015) have structural patterns. These patterns may depend on individual choices subjected to individual needs and geographic constraints. Patterns may also be governed by social relationships as individuals are more likely to visit the places where their friends have visited in the past. From another perspective, people similar to each other in terms of their mobility and lifestyle patterns are more likely to be socially connected.
There is no general consensus on a definition of lifestyle based on individual activity participation behavior (Hasan and Ukkusuri, 2015). It can be defined from two broader perspectives: (a) lifestyle as behavioral patterns, such as activity and time use choices and (b) lifestyle as a behavioral orientation. The first approach views lifestyle as changing as an individual adjusts to his or her surrounding contexts and constraints, while the second approach views lifestyle as an orientation, which the individual wants to maintain by changing his or her actions (Kitamura, 2009). Previous studies found the linkages between individual lifestyle choices and activity-travel behavior including short-term choices, such as activity types, travel distances, and mode of travel (Vredin Johansson et al., 2006; Vij et al., 2011), and more long-term choices, such as the locations of housing and workplace (Krizek and Waddell, 2002) and car types (Choo and Mokhtarian, 2004).
In this paper, we analyze a dataset containing user check-in information given in Foursquare via Twitter. In addition, we collect their social network information from Foursquare using a snowball sampling method (Frank, 1979). After collecting the data on social relationships of the users, we analyze the structure of the underlying social network. We infer activity location choices and geo lifestyle patterns (Hasan and Ukkusuri, 2015) of the users whose social network information is available. We then analyze the correlation between the social relationships and individual-level patterns. We investigate whether or not two individuals have similar activity choice and geo lifestyle patterns if they are socially connected.
Measuring the correlation between the social connections and mobility and activity patterns can provide an important piece of information to activity-travel analysis. Such information regarding the social influence on individual activity behavior will help us to develop a more realistic activity-travel simulation model. In this paper, we investigate the extent of similarity among individual activity decisions with respect to the level of social relationships. We focus on the non-recurrent travel decisions, such as location choice for discretionary activities. This is possible as the social media check-in data have an underlying social network by which we can learn about an individual’s friends and their activity location choices. We investigate whether or not an individual’s decisions are correlated with his or her peer’s decisions. If social influence is present, then an individual’s activity location choices will be correlated with his friends’ choices as well. This paper has the following contributions:
• We collect the social network information of the individuals whose check-in observations are available by linking users from two different social media systems (Twitter and Foursquare).
• We analyze the structure of a large-scale location-based social network and determine its structural properties.
• We investigate if social relationships influence individual activity location choices and geo lifestyle patterns.
2. Data Collection
2.1. Collecting Check-in Data
We use check-in information posted via Twitter, which allows its users to post their statuses from third-party check-in services (e.g., Foursquare). When Foursquare users check-in to a place, this status can be posted to their Twitter pages. We use a large-scale check-in dataset available from Cheng et al. (2011). The dataset contains check-ins from February 25, 2010 to January 20, 2011. After collecting the tweets, we preprocess the data, where each data point is stored as a tuple with the following information: tweet(tweetID) = {userID, screen name, tweetID, date, location, text}.
An example of a tweet with a check-in looks like (we replace the tweetID, userID, screen name, and check-in ID with # so that the user cannot be identified): tweet(#) = {#, #, #, Fri Jun 10 10:27:34 + 0000 2011, 40.7529422,-73.9780177, “I’m at Central Cafe & Deli (16 Vanderbilt Ave., New York) http://4sq.com/#’’}.
After collecting the original dataset, we select a subset of all the observations within New York City. We create a boundary region for New York City and keep all the check-in observations within that region (number of users = 20,606). Descriptive statistics on the number of check-in activities include average = 33.03; min = 1; max = 1010; and SD = 77.82. Figure 1 shows the cumulative distribution of the check-in activities. We identify the geo-active users having more than 50 check-ins. Basic information about the dataset collected in this step are given in Table 1.
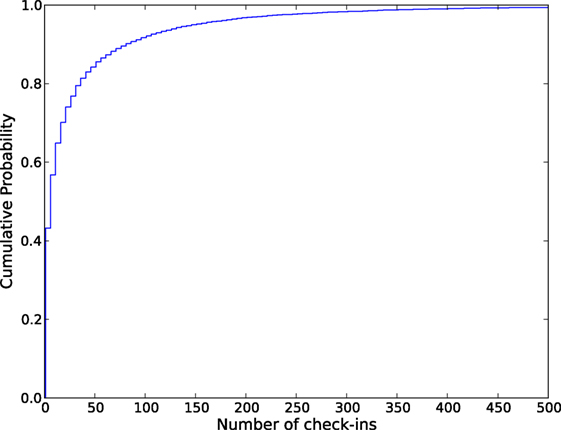
Figure 1. Cumulative distribution of the number of check-in activities.
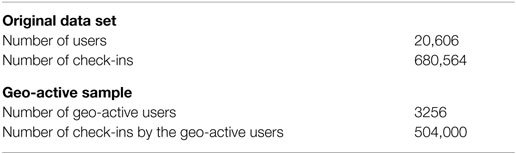
Table 1. Check-in dataset details.
2.2. Collecting the Social Network Information from Check-in Data
Collecting the social network and check-in information is a challenging task, as we need to ask queries about the same set of individuals in two different social media systems, Twitter and Foursquare. Users originally post their check-ins in Foursquare, which does not allow anyone to collect user private check-ins for protecting user privacy. So we collected the Foursquare check-ins from Twitter, which allows others to collect user tweets/posts. Since the check-ins are originally posted in Foursquare, it is reasonable to collect their social network information from Foursquare. For all the users, we collected their social connections from Foursquare. However, many users that we find based on their connections in Foursquare either do not use Twitter or do not share their check-ins in Twitter. Therefore, it is not possible for us to know the complete network of the Foursquare users and their check-ins at the same time. Instead, we have a sparse sample of check-ins and a social network with a reasonable size (in the order of 100,000).
In this study, we use a snowball sampling method (Frank, 1979) to collect the social network information. We select a random sample of 600 users from the geo-active users (see Table 1). From these initial frequent users, we collect their friend lists available through an open API in Foursquare. At the end of this step, analyzing their friend lists, we find a set of unique users. Similar to the previous step, friend lists of these new users are collected using Foursquare API. At the end of step two, 2,544,574 unique Foursquare users having 11,966,066 edges among themselves are found.
We restrict our analysis to only the users from New York City. At first, a list of users is created using a query selecting all the users who declare their home city as “New York,” “NYC,” “New York City,” or “New York, NY.” Total number of users found through this step is 553,976, and the number of directed edges is 1,663,531. At this stage, we collect the check-ins from Twitter for the users who linked their Foursquare account with Twitter. However, we find many users with their Foursquare accounts not linked to Twitter, and hence no check-in information is available for them. Table 2 gives the details of the social network data collected. Even though we collect many users’ check-ins, these check-ins are not useful as the check-ins of the friends of the users are not available. The distribution for the number of friends with check-in information available is shown in Figure 2. Notice that, most of the users have less than five friends whose check-in information is available. Our similarity analysis is based on this sparse check-in data from 2279 users.
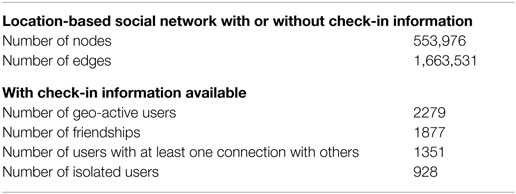
Table 2. Location-based social network details.
Figure 2. Distribution for the number of friends with check-in information.
3. Analysis of the Location-Based Social Network
3.1. Global Structure
In this section, we present a large-scale location-based social network of Foursquare users. Our goal here is to see the global structure of the social network involved. Figure 3 shows the network having many clusters or communities with few distinct hierarchical levels. One plausible explanation of these clusters might be the way we collect the sample of the network. The snowball sampling method, used to collect the social network information, had three steps. In each step, we collected the friends of the new users obtained in the previous step. These three levels of collections are clear in the Figure of the network. The three communities at the center have the most dense connections within themselves; most of the initial 600 users may belong to one of these three communities. The number of communities increases as we move away from the center of the circle.
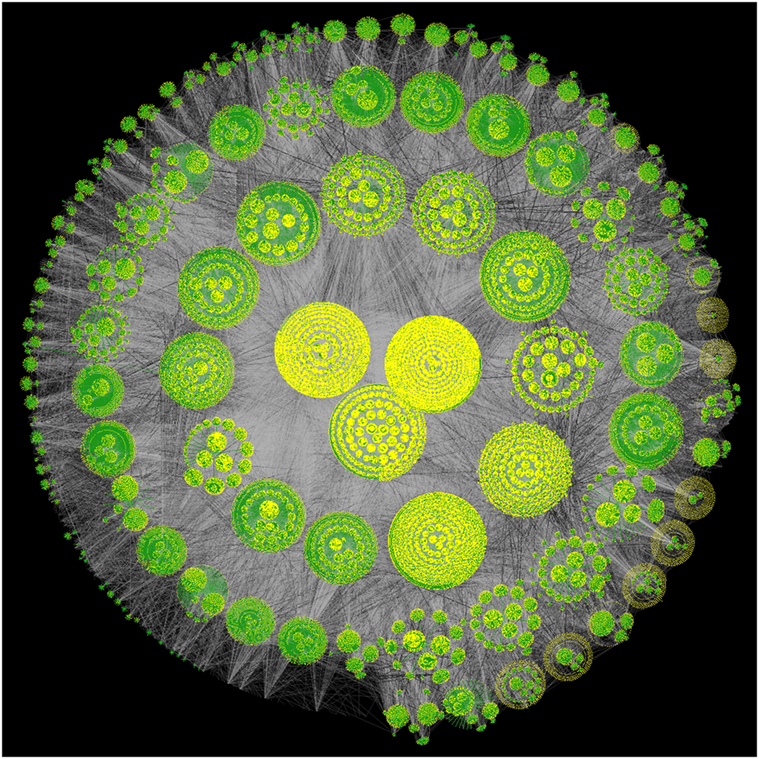
Figure 3. Structure of the location-based social network; the figure is created using a graph visualization tool called Walrus (Munzner, 2000); the yellow dots represent the nodes, green lines represent the tree links required to draw the graph, and the gray lines represent the edges.
3.2. Degree Distribution
An important quantity that is measured in almost all of the empirical studies related to networks is the degree distribution, pk. The degree of a user in a network is represented by the number of friends the user has, and pk is the fraction of the users in the network having exactly k friends. The degree distribution of the social network of the collected Foursquare users is plotted in Figure 4. There is a clear cutoff value in the distribution at 1000, which is the limit for the number of friends provided by Foursquare API. The figure clearly shows that very few users have friends close to 1000.
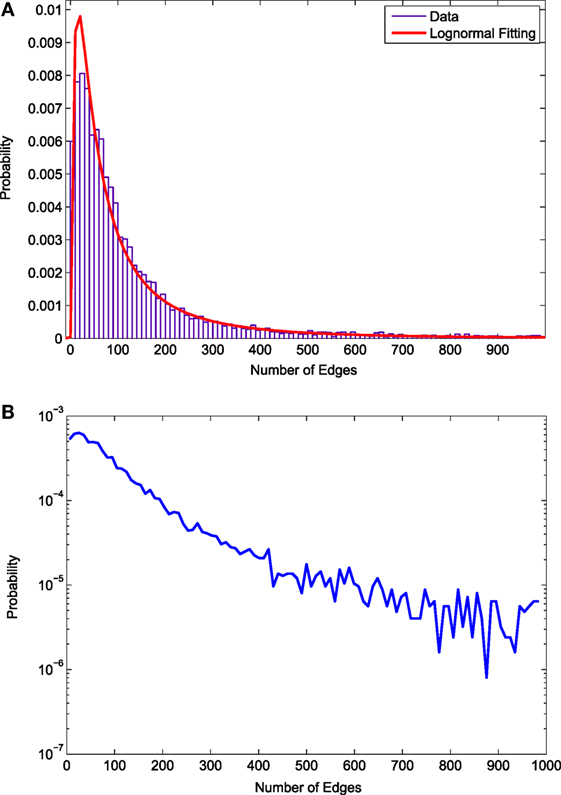
Figure 4. Degree distribution of the location-based social network. (A) degree distribution plotted in a linear scale (B) degree distribution plotted in a log-linear scale.
Figure 4A presents the degree distribution in linear scale. Most of the users have friends less than 100. This is an interesting trait of location-based social networks in contrast to other social networks, such as the network of Facebook users. In Facebook, most users have less than 200 friends, which is twice than what Foursquare users have (Ugander et al., 2011). This reflects the sparsity of social relationships among Foursquare users. In the literature, many networks have been found to have power-law degree distributions (Barabási and Albert, 1999; Clauset et al., 2009). However, such a degree distribution is not found in our case. Instead, we find that a log-normal distribution fits the data quite well.
The distribution is also plotted in log-linear scale, as shown in Figure 4B. When plotted in the log-linear scale, the distribution shows a smooth straight line relationship up to 400 friends. After 400, the figure shows larger variance in pk. This figure also shows that pk decreases with the increase of k, reflecting that Foursquare users have greater number of friends with diminishing probability.
4. Methodology
To measure the social influence, we first compute the related distributions for each user. We select two types of distributions here: (1) check-in distributions in different neighborhoods and (2) lifestyle pattern distributions. We use check-in distributions to see how users are similar in terms of going to different neighborhoods. To compute the distribution, for each user, we count the number of check-ins by the user to the 195 neighborhoods in New York City. Thus, each user has a vector of 195 items.
To compute the distribution of lifestyle patterns, we infer individual geo lifestyle patterns by using a topic model [for a detailed description of the model, see Hasan and Ukkusuri (2015)]. The model assumes that each user’s lifestyle is a distribution of patterns where each pattern is a distribution of location contexts. A graphical representation of the model is shown in Figure 5. The probabilistic generative process for the model is summarized as following:
1. For each lifestyle pattern k ∈ 1, 2, …, K, select a distribution over location contexts ϕ(k) ∼ Dirichlet(β).
2. For each user u ∈ 1, 2, …, U,
a. Select a distribution over lifestyle patterns θ(u) ∼ Dirichlet(α).
b. For each location context i,
(1) Select a pattern zi ∼ Multinomial(θ(u)); zi ∈ 1, 2, …, K.
(2) From lifestyle pattern zi, select a location context.
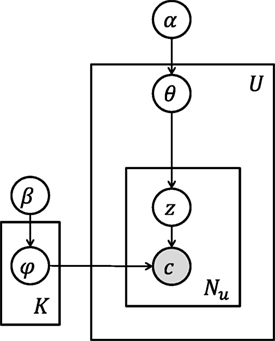
Figure 5. Topic model of geo lifestyle pattern inference. White circles represent random variables, shaded circles represent observed variables, rectangles represent the repetitiveness of the data, and arrows represent the dependency among the entities.
Given U users’ location contexts, K lifestyle patterns over C unique location contexts, the objectives of the inference of lifestyle pattern extraction are to:
1. find the probability of a location context c given each pattern k, , where P(c|z = k) is represented with K multinomial distributions ϕ over location contexts of size C.
2. find the probability of a pattern k for a location context in the location visits of user u, . Here, P(z|u) is represented with U multinomial distributions θ over K lifestyle patterns.
The above model views a lifestyle pattern as a probability distribution over location contexts and user lifestyle as a mixture of these patterns. Intuitively, P(c|z) determines the importance of a location context to a pattern, and P(z|u) determines the prevalence of the patterns in user u’s location choices.
To compute the distribution of lifestyle patterns, we estimate a topic model for 50 patterns and use the pattern proportions [P(z|u)] found. Thus, from the estimated parameters, each user has a discrete distribution of 50 patterns. This distribution is used to measure the similarity among user lifestyle choices.
To measure the similarity between two users we use two metrics: (1) cosine similarity and (2) Jensen–Shannon divergence. The first one represents a geometric distance between two vectors where the distributions can be considered as vectors. The distribution may represent any characteristic of the user. For instance, one possible characteristic can be the distribution of the geo lifestyle patterns of the user.
Let P and Q be two probability distributions. Considering these distributions as vectors, the cosine similarity can be defined as:
The second metric, Jensen–Shannon (JS) divergence, measures the distance between two probability distributions directly. The more similar two persons are in terms of their geo lifestyle patterns or mobility behavior, the less their Jensen–Shannon divergence will be. The JS divergence, between two probability distributions P and Q, can be defined as:
5. Social Relationships and Check-in Similarity
5.1. Using Cosine Similarity Metric
Figure 6 shows the results for the influence of social relationships on check-in behavior. Figure 6A shows that the check-in similarity between two users increases with the increase of the friendship probability. The procedure to compute friendship probability for a specific similarity value is as following:
• compute the similarities between all the possible pairs
• for a specific range of similarity values, count how many of the users are actually connected in the social network and
• divide the above number by the total number of users within the similarity range, and find the friendship probability value.
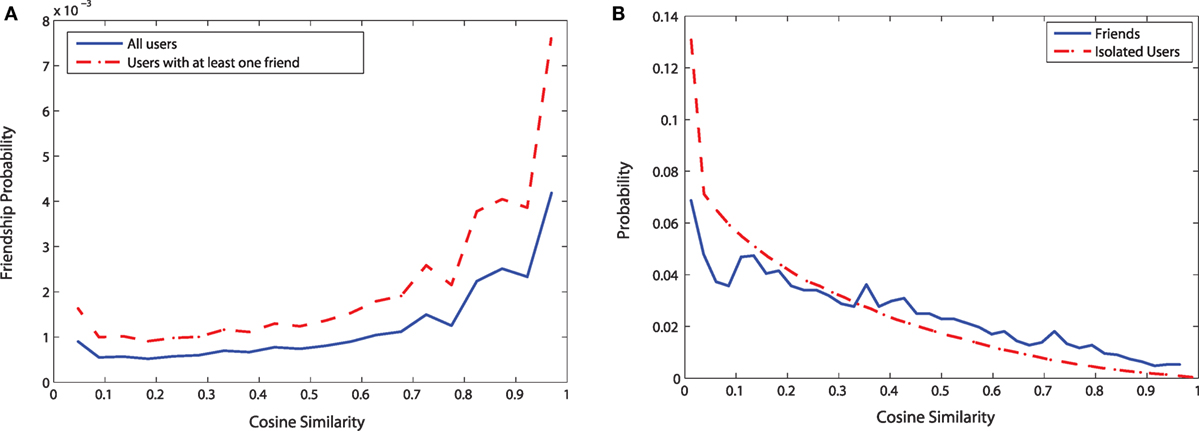
Figure 6. Measuring check-in similarity using Cosine similarity metric. (A) Friendship probability vs. Cosine similarity (B) Distributions of Cosine similarity.
Although we find an intuitive relationship between friendship probability and check-in similarity, our friendship probabilities are very small. This is due to the sparsity of the sampled network as we do not observe the check-ins of all the friends of a user. When we consider only those having at least one friend, the curve shifts upward, indicating a more pronounced effect of friendship on check-in similarity.
Figure 6B shows the distributions for the cosine similarity for the isolated users and the users who have at least one friend in the data. For the isolated users, there is a high number of users having very low similarity among their check-ins, and the probability to have higher cosine similarity decreases monotonically. For the users having at least one friend in the data, the probability to have low cosine similarity is much less compared to the isolated users. The two curves cross at similarity value close to 0.32. After here, for the users having at least one friend in the data, the probability of a particular similarity value is higher than that for the isolated users. This confirms the positive role of friendship in check-in similarity.
5.2. Using Jensen–Shannon Divergence Metric
To confirm that the relationship between friendship and check-in similarity is not an artifact of our chosen metric, we analyze the similarity with another measure called Jensen–Shannon divergence. Figure 7 shows the results for the influence of social relationships on check-in similarity using Jensen–Shannon divergence.
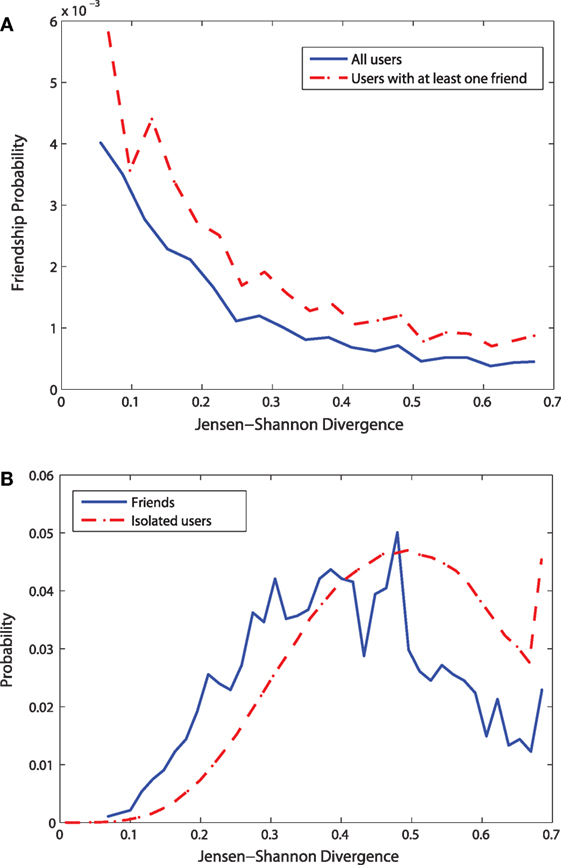
Figure 7. Measuring check-in similarity using Jensen–Shannon divergence. (A) Friendship probability vs. Jensen-Shannon divergence (B) Distributions of Jensen-Shannon divergence.
Figure 7A shows that divergence between any two users decreases with the increase of the friendship probability between them. This means that users who are friend to each other have less different check-in behavior. When only the users with at least one friend are considered, the curve shifts upward, reflecting the effect of friendship on check-in similarity.
Figure 7B shows the distributions of the Jensen–Shannon divergence for the isolated users and the users having at least a friend in the data. Similar to the distribution of cosine similarity metrics, for the isolated users, there is a high number of users having very high Jensen–Shannon (JS) divergence. For these users with high JS divergence, the extent of similarity to each other in terms of their check-in behavior is very low. The probability to have lower JS divergence decreases monotonically. For the users having at least one friend in the data, the probability to have high JS divergence is much less compared to the isolated users. The two curves cross at JS value near 0.4. Below this value of JS divergence, for the users having at least one friend in the data, the probability of a particular JS divergence is higher than that for the isolated users. This means that the users having friends in the data have higher likelihood of a low JS divergence (i.e., high similarity) than isolated users. Similar to the conclusion for cosine similarity metric, the distributions of JS divergence also confirm the positive role of friendship in check-in similarity.
6. Social Relationships and Lifestyle Similarity
6.1. Using Cosine Similarity Metric
Figure 8 shows the results for the influence of social relationships on lifestyle similarity. Figure 8A shows that the similarity between any two users with respect to their lifestyle patterns increases with the increase of friendship probability. When we consider only the users with at least one friend in the data, the curve shifts upward. The data from the isolated users increase the number of users without any friend; therefore, when these isolated users are included in the analysis, friendship probabilities are reduced for a given similarity value. Thus, when isolated users are ignored, we observe a more pronounced effect of friendship on lifestyle similarity. This clearly shows the effects of lifestyle similarity due to social relationships.
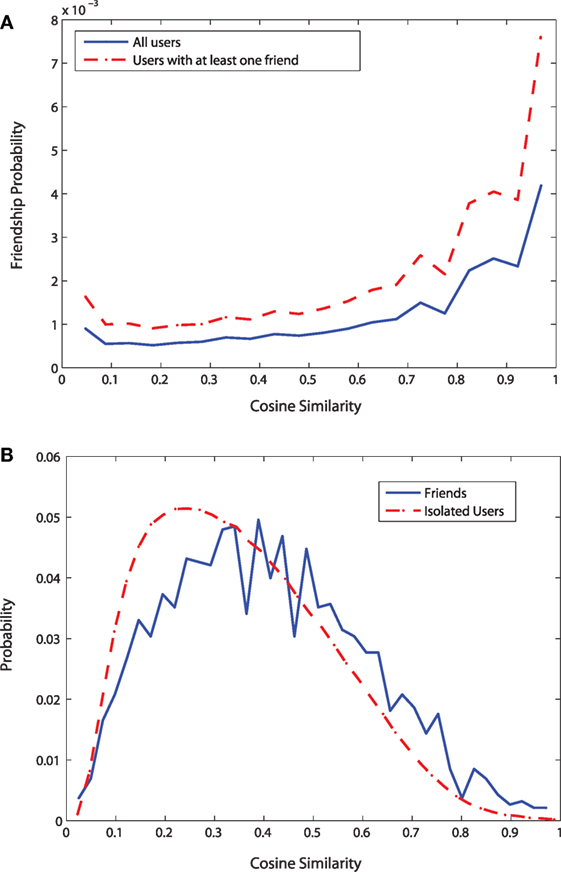
Figure 8. Measuring lifestyle similarity using Cosine similarity metric. (A) Friendship probability vs. Cosine similarity (B) Distributions of Cosine similarity.
Figure 8B shows the distributions of the cosine similarity for lifestyle patterns for the isolated users and the users having at least a friend in the data. Both the curves show that there is very low probability to have no lifestyle similarity. For the isolated users, there is a high number of users having similarity value close to 0.2; for them, the probability to have cosine similarity higher than 0.2 decreases monotonically. For the users having at least one friend in the data, the probability to have cosine similarity close to 0.2 is low compared to the isolated users. The two curves cross at similarity value close to 0.45. After here, for the users having at least one friend in the data, the probability of a particular similarity value is higher than that for the isolated users. Similar to the results from check-in similarity, this confirms the positive role of friendship in lifestyle similarity.
6.2. Using Jensen–Shannon Divergence Metric
Figure 9 shows the results for the influence of social relationships on lifestyle similarity based on Jensen–Shannon divergence. However, unlike the previous cases, we find here that Jensen–Shannon divergence can not capture the role of social influence very clearly. For a range of friendship probabilities, the divergence values do not change very significantly.
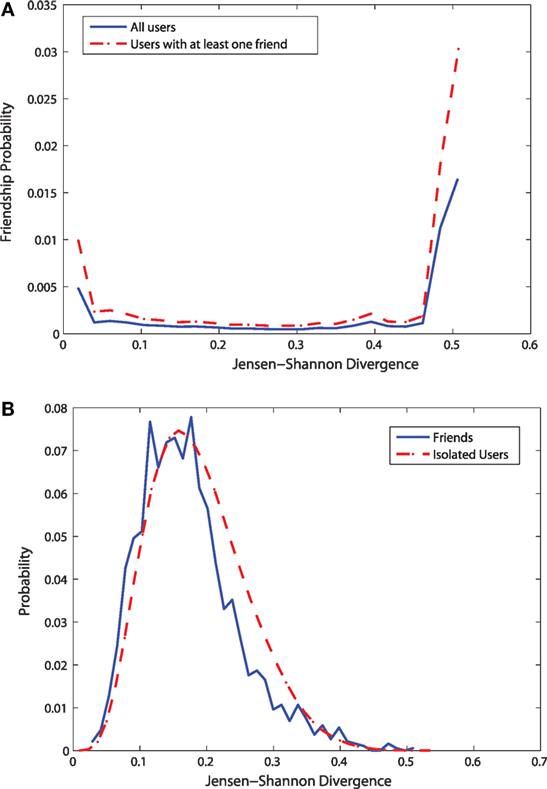
Figure 9. Measuring lifestyle similarity using Jensen–Shannon divergence. (A) Friendship probability vs. Jensen-Shannon divergence (B) Distributions of Jensen-Shannon divergence.
Figure 9A shows the distributions of the Jensen–Shannon divergence for lifestyle patterns for the isolated users and the users having at least a friend in the data. Unlike the previous results related to check-in similarity, the effects of social relationships are not very prominent. For the distribution of the JS divergence, the bias due to friendship is very small. The two distributions look almost similar.
7. Conclusion
In this paper, we measure the influence of social relationships on user check-in behavior and lifestyle choices. We also find the properties of the location-based social network involved in the analysis. The location-based social network of Foursquare users has many communities. Most of the users in the network have friends less than 100, reflecting the sparsity of connections among the users of location-based services. Unlike many other empirical studies on networks, a power-law degree distribution is not found for the location-based social network.
The analysis has found relationships between friendship probabilities and check-in similarities and confirms the influence of social relationships on activity location and lifestyle choices. We find that the similarity between two users, in terms of check-in behavior and lifestyle patterns, increases with the increase of the friendship probability. The distributions of the cosine similarity metrics and Jensen–Shannon divergences also show the effects of social relationships in check-in behavior and lifestyle choices.
Activity-travel behavior modeling can utilize the measured correlation between the social connections and mobility and activity patterns. Characterizing the social influence on individual activity choices will help us to develop a more realistic activity-travel behavior model. Thus, we expect that our analysis will contribute toward creating a future mobility model, considering the social connections among the users.
Author Contributions
SH and SU conceived and designed the study and wrote the paper. SH and XZ performed the experiments, analyzed the data, and contributed analysis tools.
Conflict of Interest Statement
The authors declare that the research was conducted in the absence of any commercial or financial relationships that could be construed as a potential conflict of interest.
Acknowledgments
We are grateful to Zhiyuan Cheng and James Caverlee of Texas A&M University for providing us the original Twitter check-in dataset. We also thank Victoria Mutran for helping us to collect Foursquare social network data.
Funding
The first author of the paper is supported by CSIRO strategic project “Infrastructure Systems Resilience.”
References
Arentze, T., and Timmermans, H. (2008). Social networks, social interactions, and activity-travel behavior: a framework for microsimulation. Environ. Plann. B Plann. Des. 35, 1012–1027. doi: 10.1068/b3319t
Bao, J., Zheng, Y., and Mokbel, M. F. (2012). “Location-based and preference-aware recommendation using sparse geo-social network data,” in ACM SIGSPATIAL GIS’12 (Redondo Beach, CA: ACM), 199–208.
Barabási, A.-L., and Albert, R. (1999). Emergence of scaling in random networks. Science 286, 509–512. doi:10.1126/science.286.5439.509
Bhat, C. R., and Lawton, T. (1999). Passenger Travel Demand Forecasting, Transportation in the New Millennium. Washington, DC: Transportation Research Board, National Academy of Sciences.
Carrasco, J., and Miller, E. J. (2006). Exploring the propensity to perform social activities: a social network approach. Transportation 33, 463–480. doi:10.1007/s11116-006-8074-z
Carrasco, J., and Miller, E. J. (2009). The social dimension in action: a multilevel, personal networks model of social activity frequency between individuals. Transp. Res. A Policy Prac. 43, 90–104. doi:10.1016/j.tra.2008.06.006
Chang, J., and Sun, E. (2011). “Location 3: how users share and respond to location-based data on social networking sites,” in Proceedings of the International Conference on the Weblogs and Social Media (ICWSM), Barcelona.
Cheng, Z., Caverlee, J., Lee, K., and Sui, D. Z. (2011). “Exploring millions of footprints in location sharing services,” in Proceedings of the 5th International AAAI Conference on Weblogs and Social Media (ICWSM), Barcelona.
Cho, E., Myers, S. A., and Leskovec, J. (2011). “Friendship and mobility: user movement in location-based social networks,” in Proceedings of the 17th ACM SIGKDD International Conference on Knowledge Discovery and Data Mining (San Diego, CA: ACM), 1082–1090.
Choo, S., and Mokhtarian, P. L. (2004). What type of vehicle do people drive? The role of attitude and lifestyle in influencing vehicle type choice. Transp. Res. A Policy Prac. 38, 201–222. doi:10.1016/j.tra.2003.10.005
Clauset, A., Shalizi, C. R., and Newman, M. E. (2009). Power-law distributions in empirical data. SIAM Rev. 51, 661–703. doi:10.1137/070710111
Frank, O. (1979). Sampling and estimation in large social networks. Soc. Networks 1, 91–101. doi:10.1016/0378-8733(78)90015-1
Hackney, J. K. (2005). Coevolving Social and Transportation Networks. Arbeitsbericht Verkehrs- und Raumplanung 335. Switzerland: IVT, ETH Zürich, ETH Zürich.
Hasan, S. (2013). Modeling Urban Mobility Dynamics Using Geo-Location Data. Ph.D. Dissertation, Purdue University, West Lafayette, IN.
Hasan, S., and Ukkusuri, S. V. (2014). Urban activity pattern classification using topic models from online geo-location data. Transp. Res. C Emerging Technol. 44, 363–381. doi:10.1016/j.trc.2014.04.003
Hasan, S., and Ukkusuri, S. V. (2015). Location contexts of user check-ins to model urban geo life-style patterns. PLoS ONE 10:e0124819. doi:10.1371/journal.pone.0124819
Hasan, S., Zhan, X., and Ukkusuri, S. V. (2013). “Understanding urban human activity and mobility patterns using large-scale location-based data from online social media,” in Proceedings of the 2nd ACM SIGKDD International Workshop on Urban Computing, UrbComp ’13 (New York, NY: ACM), 1–8.
Kitamura, R. (2009). Life-style and travel demand. Transportation 36, 679–710. doi:10.1007/s11116-009-9244-6
Krizek, K. J., and Waddell, P. (2002). Analysis of lifestyle choices: neighborhood type, travel patterns, and activity participation. Transp. Res. Rec. 1807, 119–128. doi:10.3141/1807-15
Lian, D., and Xie, X. (2011). “Collaborative activity recognition via check-in history,” in Proceedings of the 3rd ACM SIGSPATIAL International Workshop on Location-Based Social Networks, LBSN ’11 (Chicago, IL: ACM), 45–48.
Liu, Y., Sui, Z., Kang, C., and Gao, Y. (2014). Uncovering patterns of inter-urban trip and spatial interaction from social media check-in data. PLoS ONE 9:e86026. doi:10.1371/journal.pone.0086026
Munzner, T. (2000). Interactive Visualization of Large Graphs and Networks. Ph.D. Dissertation, Stanford University, Stanford, CA.
Noulas, A., Scellato, S., Lambiotte, R., Pontil, M., and Mascolo, C. (2012). A tale of many cities: universal patterns in human urban mobility. PLoS ONE 7:e37027. doi:10.1371/journal.pone.0037027
Pianese, F., An, X., Kawsar, F., and Ishizuka, H. (2013). “Discovering and predicting user routines by differential analysis of social network traces,” in World of Wireless, Mobile and Multimedia Networks (WoWMoM), 2013 IEEE 14th International Symposium and Workshops on a (Madrid: IEEE), 1–9.
Saez-Trumper, D., Quercia, D., and Crowcroft, J. (2012). “Ads and the city: considering geographic distance goes a long way,” in RecSys’12 (Dublin, Ireland: ACM), 187–194.
Toole, J. L., Herrera-Yaqüe, C., Schneider, C. M., and González, M. C. (2015). Coupling human mobility and social ties. J. R. Soc. Interface 12:20141128, doi:10.1098/rsif.2014.1128
Ugander, J., Karrer, B., Backstrom, L., and Marlow, C. (2011). The anatomy of the facebook social graph. arXiv preprint 1111.4503.
Vij, A., Carrel, A., and Walker, J. L. (2011). “Latent modal preferences: behavioral mixture models with longitudinal data,” in International Choice Modeling Conference (Leeds, UK).
Vredin Johansson, M., Heldt, T., and Johansson, P. (2006). The effects of attitudes and personality traits on mode choice. Transp. Res. A Policy Prac. 40, 507–525. doi:10.1016/j.tra.2005.09.001
Wang, D., Pedreschi, D., Song, C., Giannotti, F., and Barabasi, A.-L. (2011). “Human mobility, social ties, and link prediction,” in Proceedings of the 17th ACM SIGKDD International Conference on Knowledge Discovery and Data Mining (San Diego, CA: ACM), 1100–1108.
Wei, L.-Y., Zheng, Y., and Peng, W.-C. (2012). “Constructing popular routes from uncertain trajectories,” in KDD’12 (Beijing, China: ACM), 195–203.
Wu, L., Zhi, Y., Sui, Z., and Liu, Y. (2014). Intra-urban human mobility and activity transition: evidence from social media check-in data. PLoS ONE 9:e97010. doi:10.1371/journal.pone.0097010
Zheng, V. W., Zheng, Y., Xie, X., and Qiang, Y. (2010). “Collaborative location and acitivty recommendations with gps history data,” in WWW 2010 (Releigh, NC: ACM), 1029–1038.
Keywords: social influence, activity-travel behavior, social media, location-based social networks, geolocation data, topic models
Citation: Hasan S, Ukkusuri SV and Zhan X (2016) Understanding Social Influence in Activity Location Choice and Lifestyle Patterns Using Geolocation Data from Social Media. Front. ICT 3:10. doi: 10.3389/fict.2016.00010
Received: 10 March 2016; Accepted: 03 June 2016;
Published: 20 June 2016
Edited by:
Bruce Hunter Thomas, University of South Australia, AustraliaReviewed by:
Maki Sugimoto, Keio University, JapanThuong Hoang, The University of Melbourne, Australia
Copyright: © 2016 Hasan, Ukkusuri and Zhan. This is an open-access article distributed under the terms of the Creative Commons Attribution License (CC BY). The use, distribution or reproduction in other forums is permitted, provided the original author(s) or licensor are credited and that the original publication in this journal is cited, in accordance with accepted academic practice. No use, distribution or reproduction is permitted which does not comply with these terms.
*Correspondence: Samiul Hasan, c2FtaXVsLmhhc2FuQGNzaXJvLmF1, c2FtaXVsLmhhc2FuQGdtYWlsLmNvbQ==