 Mahdi Nabiyouni
 Siroberto Scerbo2
 Doug A. Bowman
 Tobias Höllerer
- 1Center for Human-Computer Interaction, Department of Computer Science, Virginia Tech, Blacksburg, VA, USA
- 2Walt Disney Imagineering R&D, Glendale, CA, USA
- 3Four Eyes Laboratory, Department of Computer Science, University of California Santa Barbara, Santa Barbara, CA, USA
In augmented reality (AR), virtual objects and information are overlaid onto the user’s view of the physical world and can appear to become part of the real-world. Accurate registration of virtual objects is a key requirement for an effective and natural AR system, but misregistration can break the illusion of virtual objects being part of the real-world and disrupt immersion. End-to-end system latency severely impacts the quality of AR registration. In this research, we present a controlled study that aims at a deeper understanding of the effects of latency on virtual and real-world imagery and its influences on task performance in an AR training task. We utilize an AR simulation approach, in which an outdoor AR training task is simulated in a high-fidelity virtual reality (VR) system. The real and augmented portions of the AR training scenarios are simulated in VR, affording us detailed control over a variety of immersion parameters and the ability to explore the effects of different types of simulated latency. We utilized a representative task inspired by outdoor AR military training systems to compare various AR system configurations, including optical see-through and video see-through setups with both matched and unmatched levels of real and virtual objects latency. Our findings indicate that users are able to perform significantly better when virtual and real-world latencies are matched (as in the case of simulated video see-through AR with perfect augmentation-to-real-world registration). Unequal levels of latency led to reduction in performance, even when overall latency levels were lower compared to the matched case. The relative results hold up with increased overall latency.
Introduction
Augmented reality (AR) systems, including those used for training applications, offer a natural, first-person view of real-world imagery, enhanced by virtual objects and annotations that are, ideally, registered or fixed with respect to the real-world (Azuma, 1997). Accurate registration is one of the features that determines the quality and effectiveness of AR, since misregistration breaks the illusion that virtual objects are part of the physical world and hinders perception of spatial relationships between real and virtual objects. These effects might have a significant negative impact on the effectiveness of AR training, since trainees need to perceive both the real-world and the virtual objects as part of one coherent environment.
Although there are various factors that influence the quality of AR registration, latency is perhaps the most prominent (Lee, 2012). Delays in updating the virtual scene after the user’s head/camera movements can cause the position of virtual objects on the display to lag behind their real-world counterparts, resulting in “swimming” and misregistration. There are many potential sources of virtual-world latency, including tracking delays, rendering delays, and display update delays (Mine, 1993), but in this work, we are concerned only with end-to-end latency, sometimes called “motion to photon” latency because it represents the total delay from the time a motion occurs to the time the display is updated to reflect the results of that motion.
In optical see-through (OST) AR, users view the real-world directly through the optics of the display, which often is a head-mounted display (HMD). In this case, latency only affects virtual objects. In video see-through (VST) AR, however, the user’s view of the real-world is mediated by a camera–display system. Capture of the real-world imagery by the camera, processing of that imagery, and display of the imagery all take time, and so such systems have some level of real-world latency, independent of, and possibly overlapping with, the virtual-world latency.
Thus, the goal with respect to latency in OST AR is to reduce virtual-world latency to the absolute minimum, in order to improve registration and reduce swimming. Recent work has succeeded in reducing end-to-end latency in a special-purpose OST AR system to less than 1 ms (Lincoln et al., 2016), but this level is nowhere near achievable in today’s off-the-shelf systems. In VST AR, on the other hand, a more modest goal would be to reduce virtual-world latency to the same level as real-world latency, since this would result in perfect registration [although the entire mixed reality (MR) scene would still lag behind the users’ head movements].
This observation leads to our research question: for AR tasks in which registration is important, such as those in some AR training systems, is it more useful to reduce all latencies to minimal levels, or to match virtual- and real-world latencies? An answer to this question would have implications for the design of AR systems in critical application areas, such as military training (Livingston et al., 2004), maintenance training (Boud et al., 1999), and emergency response (Ebersole et al., 2002).
Unfortunately, studying this question experimentally is challenging. Comparing actual OST and VST AR systems with different levels of latency would result in a loss of experimental control, since the systems being compared would differ in many ways. In addition, current AR systems have many limitations in terms of tracking quality, field of view (FOV), and display quality, so the results of such experiments might not be generalizable to high-performance AR systems of the future. For these reasons, we chose to run our experiments in virtual reality (VR), using the concept of AR simulation (Lee et al., 2010, 2013; Bowman et al., 2012). We used a high-end VR display and tracking system to simulate various AR system configurations, maintaining experimental control, and reducing the dependence of the results on system limitations.
In this paper, we report on an AR simulation experiment exploring the effects of real-world and virtual-world latency on task performance in a representative task inspired by AR military training systems. We compared various configurations simulating both OST and VST AR with both matched and unmatched levels of real- and virtual-world latency. Our results indicate that for a time-sensitive task relying on accurate registration, matched latency levels are superior to unmatched levels, even when the unmatched levels have a lower total latency.
Related Work
In this section, we briefly summarize some background concepts and related research. Our AR simulation experiment on the effects of real-world and virtual-world latency on outdoor AR task performance is related to existing work on the concept of MR simulation, to research on task training using AR and VR training simulators, and to basic research on controlled experimentation regarding the influence of immersion factors, particularly latency, on AR and VR task performance.
Training Applications of VR and AR
Military training is one of the early applications of VR (Mavor and Durlach, 1994) and AR (Julier et al., 2001). The early 1990s in particular saw a plethora of research activities on novel technologies and interfaces for combat simulation (Congress, 1994), and today we are witnessing a new wave of exciting possibilities. VR training can be a compromise between real-world training drills and traditional classroom tutoring sessions (Bowman and McMahan, 2007). The level of realism provided by VR/AR training cannot be achieved in classroom-based training, and it has lower cost and higher flexibility than real-world training exercises. VR military training success has led to adopting this technology for other training applications, such as training for pilots (Brooks, 1999), medical personnel (Seymour et al., 2002), general education (Psotka, 1995), and firefighters (Ebersole et al., 2002), for manufacturing (Schwald and De Laval, 2003), and for maintenance and assembly tasks (Neumann and Majoros, 1998; Boud et al., 1999).
Brooks (1999) reported success stories of using a 747 simulator at British Airways as well a merchant ship simulation at Warsash. Seymour et al. (2002) showed a positive effect of VR-based training on operating room performance. They observed that the use of VR surgical training significantly improved operating room performance of the surgical residents during a laparoscopic cholecystectomy. Psotka (1995) analyzed the cognitive variables of immersion in VR and compared use of tracked immersive displays to non-immersive simulation for educational and training purposes. Ebersole et al. (2002) patented an AR-based system for firefighter training. They designed hardware for motion tracking, display, and vari-nozzle instruments, as well as software for realistic fire models and layered smoke obstruction models. Schwald and De Laval (2003) employed an OST AR system and an infrared tracking system for training and maintaining equipment in industrial contexts.
Benefits of specific immersion factors have commonly been addressed as side observations in specific VR/MR implementation efforts for military training, but there have also been some notable efforts to go beyond mere technological solutions and to emphasize human-centric design and the interconnections between technological capabilities, interface design, and human performance evaluations [e.g., Cohn et al. (2004)]. Several existing studies are concerned with users’ cognitive abilities when working with novel simulation and training tools (Thomas and Wickens, 1999; Pair and Rizzo, 2006). In our work, the focus is to evaluate users’ performance. Goldberg et al. (2003) studied training tasks for dismounted warfighters using a virtual dismounted soldier simulation system and observed significant improvements in the user ratings of usability and training effectiveness. Goldiez et al. (2006) have studied the benefits of AR for navigation in a search and rescue task. They observed a positive effect of using AR on accuracy performance. Julier et al. (2001) designed and developed a mobile interactive AR system, the battlefield AR, to demonstrate specific military information to dismounted soldiers. A methodology for system evaluation and measuring users’ performance has been developed by Livingston et al. (2004) to evaluate the battlefield AR. Such mobile AR systems can be used to simulate battlefield scenarios for systematic training exercises, as well as for augmenting a mobile squad leader’s view of actual battlefield scenes (Tappert et al., 2001).
How Latency Influences Effectiveness of Training Systems
Various studies demonstrate the benefits of immersive training systems. However, the use of high-end AR and VR systems is still challenging and costly, and state-of-the-art technologies are not widely employed in the practical training systems. Decision makers need to know how various specifications [e.g., display type (Bowman et al., 2012) and latency (Jacobs and Livingston, 1997)] of such training systems influence its effectiveness. Simulation of AR in VR will enable us to study various characteristics of the high-end or even future AR systems and speculate how such characteristics influence the effectiveness and user experience.
Latency affects both OST and VST AR, as the virtual overlays can be outdated in either case. One potential advantage of VST over OST is the option of delaying the video of the real scene so that it matches the virtual elements. The resulting AR display will be free from spatial misalignments, but at the cost of higher lag in the presentation of the real-world backdrop. Our work seeks to illuminate the trade-offs in these choices.
Virtual objects’ registration is crucial for the effectiveness of AR systems (Hirota et al., 1996; Jacobs and Livingston, 1997; Azuma et al., 2001), and latency significantly affects the registration of the virtual imagery (Azuma et al., 2001). Moreover, latency can disturb the user performance and cause simulator sickness (Steed, 2008). Predictive compensation can be utilized to reduce apparent latency, resulting in a lower magnitude of simulator sickness (Buker et al., 2012).
Researchers have developed methods to measure or estimate the amount of latency in the AR and VR systems (Jacobs and Livingston, 1997; Di Luca, 2010), to help better understand the effects of latency and how to reduce it. Friston and Steed (2014) have characterized these techniques and developed a controllable mechanical simulator to simulate virtual environments (VEs) with various amounts of delay. They developed an Automated Frame Counting method to assess the amount of latency. Steed (2008) proposed a sensitive and easily configurable method using a standard camera. They attached a tracker to a pendulum and mapped the tracker’s movement to a simulated image. By video recording, both pendulum and the simulated image, they could calculate the time difference based on the phase difference between the two movement patterns. In general, measuring the latency can help to reveal and understand its disruptive effects.
Frank et al. (1988) studied the effect of visual–motion coupling delays in a driving simulator. They found that visual delay can be more disruptive to the users’ control performance and experience as compared to motion delay. Latencies above 100 ms have been shown to be disruptive to applications, such as first-person shooters (FPS) (Beigbeder et al., 2004) or racing games (Pantel and Wolf, 2002). Ivkovic et al. (2015) studied the effects of local latency on the user performance. They have focused on targeting and tracking tasks in FPS games and studied the latencies in the range of 23–243 ms. Their results show that latency can cause significant degradation in performance even for latencies as low as 41 ms. Teather et al. (2009) investigated how input device latency and spatial jitter influence 3D object movement and 2D pointing tasks. They observed that latency has a significantly stronger effect on user performance than low amounts of spatial jitter. Azuma (1997) stated that the temporal mismatch between virtual and real-world objects can cause problems. A better understanding of this effect requires a thorough study of these latency types.
Simulation of AR Systems
Researchers employed AR simulation to study various system components, controlled interactions, environments with various levels of perceptual fidelity, and hardware configurations (Gabbard et al., 2006; Ragan et al., 2009). Lee et al. (2010) simulated multiple AR systems using VR for a 3D tracing task. To validate this system, they replicated a study by Ellis et al. (1997) and obtained similar results. They designed a second experiment to study the effects of simulator latency on the results. They found simulator latency to be slightly less impactful on task performance than simulated latency (which they termed artificial latency) and found no interaction effect between simulator latency and artificial latency. There were indications for an overall additive effect of the two types of latency.
Bowman et al. (2012), systematically studied display fidelity using a display simulator. They discussed the concept of MR simulation as a novel evaluation methodology for evaluating individual components of display fidelity. They validated this methodology by developing a simulator using high-end VR systems, which can be used to study displays spanning the MR spectrum including AR and VR. Ren et al. (2016) explored the influence of FOV and AR registration accuracy on a wide-field-of-regard AR task in the tourism domain through AR simulation. A constrained FOV significantly increased task completion time. Mild tracking artifacts did not have a significant overall task effect, but older participants appeared to cope worse with them. Moreover, Lee et al. (2013) investigated the validity of the MR simulation concept for various search tasks. They conducted an experiment to study the effects of multiple levels of visual realism in AR for simulated environments. They employed a high-fidelity VR display to simulate various levels of display fidelity along the MR continuum. Their work demonstrated the usefulness of simulating AR in immersive VR for various search tasks. Based on the aforementioned literature, we presume AR simulation in VR to be a valid method for studying various components of AR systems, and we base our experiments on such a system.
Materials and Methods
Despite a massive recent growth in capability and popularity, VR and AR technologies are not yet widely employed in ambulant military and emergency response training systems. Deploying state-of-the-art AR systems for such training is still costly and difficult. Researchers and investors require empirical data to better understand the specifications of various AR systems and be able to decide which technology is the most beneficial for the to-be-deployed AR training systems. Therefore, we designed and implemented an AR simulation platform inside VR to study different aspects of AR systems.
In the work presented in this paper, we used this AR simulation platform to study the effects of different types of latency on a task we designed as a simulated representative for an AR training task, in which trainees in a real outdoor environment would observe and interact with various training scenarios that are too costly or complicated to realize in real life. For example, our task involves the observation of crates being dropped from aircraft near different target zones and the assessment of targeting accuracy. Using real aircraft and dropped objects would be prohibitive in terms of cost, safety, and overall logistics. Hence, the aircraft and dropped crates are simulated as AR augmentations, while the drop zones and target indicators would be deployed in the real environment, to make training in the actual outdoor locations possible. In our AR simulation setup, we simulate both the real environment and all AR augmentations in a high-fidelity VR environment in order to isolate the effects of different latency parameters on task performance.
Goals and Hypothesis
A simulation of AR inside VR allows us to manipulate different characteristics of the AR system and better understand the effects of various characteristics on performance and the user experience. In particular, we were interested in how the different relative levels of latency in both VST and OST AR systems affect the user experience. This leads us to our research question:
What are the effects of different combinations of real-world latency and virtual object latency on an AR observation task?
We designed an experiment in which we varied the amounts of latency for the virtual and real-world to study this question. To understand the relation between the virtual and real-world latencies and the effect on users’ performance, we studied the combination of different levels of latency. Different combinations simulate the qualities of various VST and OST AR systems. We hypothesized that AR systems in which the virtual and real-world had perfect registration, even in the presence of higher overall latencies, would produce the best performance.
Apparatus
The experiment took place in the VisCube at Virginia Tech. The VisCube is a four-sided CAVE-like facility with a 120″ × 120″ (10 ft2) floor area. A wireless Intersense IS-900 motion tracking system tracks the 3D position and orientation of the user’s head. The tracking data were streamed via a wireless connection to the rendering machines. A server machine controlled the study and rendered the researcher’s view, while four client machines each rendered one wall of the VisCube with 1,920 × 1,920 resolution. The VisCube employs 16 projectors in total for the four walls. We tried to minimize the overall system latency as much as possible. The Intersense tracking system has a typical 4 ms latency. We attached the Intersense head tracker to a hard hat to track the user’s head (Figure 1B). We attached a wireless mouse to the hat and developed a HatMouse (Figure 1B) to activate a binoculars view (Figure 1C; see The Binoculars View). Users carried a wireless transmitter connected to the head tracker (Figure 1A). We used the Unity3D game engine (version 4.6.1) to render the VE, interface with the hardware, manage the flow of the experiment, and log the data. Imagery was rendered monoscopically, so stereo depth cues were not present; however, we argue that these cues are not critical for the forward observer task we designed (see The Training Task).
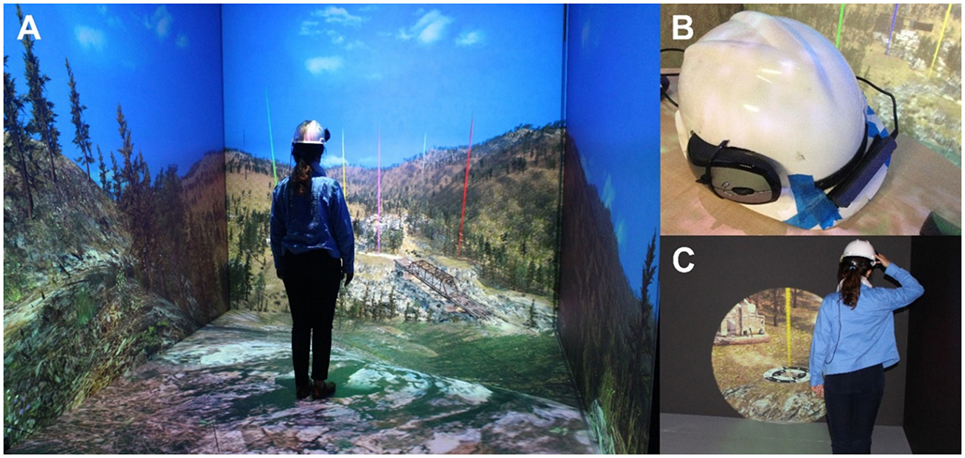
Figure 1. (A) The user is observing the environment in the VisCube. (B) The HatMouse used in this project. (C) The user is using the binoculars view to observe the target.
AR Simulation Design
The goal in this project is to study the combined effects of two types of latency in AR, real-world latency, and virtual object latency. The fundamental difference between the latency in OST and VST AR systems is that OST AR adds latency only to the virtual objects, since the user can observe the real-world directly through the display, while VST AR adds latency to both virtual and real-world imagery. A VST AR system receives real-world imagery through cameras, adds virtual objects, and renders the whole scene on the display(s), thus the real-world imagery will have a certain amount of latency, and the amount of latency for virtual and real-world imagery can be equal or different.
An AR simulation system can be used to simulate state-of-the-art or future AR systems and provide design guidelines for further improvements. In this experiment, AR simulation can also allow us to carefully control the levels of the two types of latency.
Since we target an AR training system, we will simulate a scout-observer training task. This task involves a user observing the environment from a specific point, both with the naked eye and through binoculars and making judgments about the accuracy with which projectiles hit targets. The task does not require significant movement around the environment, which makes a CAVE an appropriate VR system to implement this idea.
The Binoculars View
The binoculars view simulates using an actual pair of binoculars in the field. Our binoculars simulation, is based on the existing Augmented Immersion Team Training (AITT) system (Squire, 2013). The AITT uses an unmagnified OST system, which users wear all the time (similar to the normal view in our simulation). To see a zoomed-in view, they can flip up the unmagnified OST display and replace it with a pair of AR-enhanced binoculars.
We implemented our virtual binoculars by attaching a black box with a circular opening to the user’s head when the HatMouse button is depressed. Just outside the circular opening, we placed a rectangle on which we rendered the view from a virtual camera at the user’s head position. The virtual camera’s FOV was decreased, and the resulting imagery scaled to the size of the rectangle, so that the image was magnified by four times compared to the unmagnified normal view. Figure 1C shows the result.
The Training Task
Our simulation is an analog for a training system that trains forward observers (and similar personnel) in the skills and procedures needed to find, observe, and track locations, assets, and targets of interest and to communicate this information to others (e.g., air support or wildfire emergency coordination). The core elements of the training task in this training environment analog involve:
– Visual search for small faraway objects in potentially cluttered or low visibility conditions
– Maintaining situation awareness (e.g., for dropping a crate)
– Communicating information about target location
– Determining status of targets (e.g., if the crate landed safely)
– Following proper procedures and protocols.
We focus on visual search, following the object, and communicating and status determination tasks, because we believe these are the tasks most likely to be affected by the characteristics of the AR training system.
The task involves finding and following crates dropping from the sky, all the way down to the targets on the ground. Beacons of various colors indicate targets. The user is allowed and encouraged to use the binoculars view (Figure 2 and Figure 1C, respectively) to follow the dropping objects to the targets and determine the landing location and condition. Using the unaided view, the user will be able to rapidly search and find the dropping crates, and by employing the binoculars view, the user can precisely determine the drop location. To encourage the use of the binoculars view and avoid inaccurate presumptions based on the unaided view, we allow the users to observe targets on the ground only in the binoculars view. Upon landing, 50% of the crates will explode and illuminate with a red halo, and the rest will land safely (Figures 2C,D). Crates can land on any of the nine regions on the target or might land outside the target (Figures 2C,D). Users were asked to report the color of the beacon indicating the target, the region the crate landed on, and whether it exploded. This task requires timely head movements and accurate alignment between the real and virtual worlds, making it an excellent test for the effects of latency.
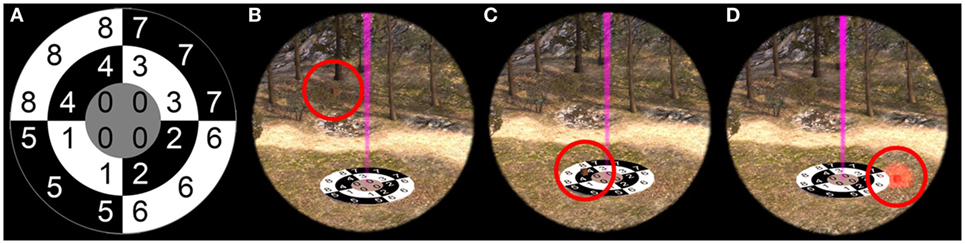
Figure 2. A target in the environment. (A) The target. (B) The crate is dropping and can land on any region of the target or outside of it. (C) The crate might land safely on the target. (D) The crate might explode as it lands.
AR Simulation Implementation
Virtual Environment
We placed the user on a mountain, looking at a valley with natural and human-made elements, as shown in Figure 3. This replicates a scenario in which the trainees are in an outdoor environment using an AR system.
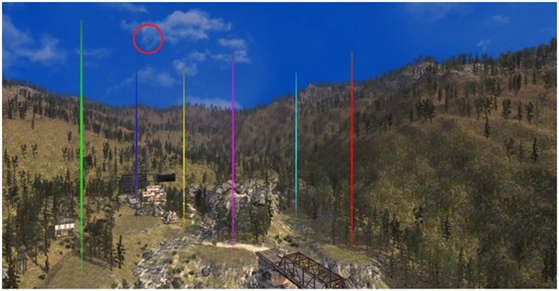
Figure 3. Overall view of the environment. A crate is being dropped. Beacons with different colors indicate the position of the targets.
The beacons of various colors (Figure 3) and the crates shown in Figure 2 are all treated as virtual objects, generated by the AR system. The crates drop from the sky and descend down to the targets on the ground (Figure 2). The beacons indicate the position of the targets on the ground.
The natural elements, such as mountains, trees, sky, and human-made elements, such as buildings and structures, as well as the targets on the ground, are pieces of the realistic VE and are dealt with as real-world objects.
Control of Different Latency Types
To simulate OST and VST AR systems based on their latency effects, we need to add different amounts of artificial latency to the imagery users’ receive.
OST Simulation
To simulate an OST AR system, we add artificial latency only to the virtual objects. The real-world imagery is rendered with the lowest possible latency (the simulation system’s latency). We simulated two types of OST systems, a low-latency system with 25 ms artificial latency and a high-latency system with 75 ms artificial latency. We chose 25 ms as representative of an “acceptable” amount of latency similar to what is found in current VR systems, and 75 ms as representative of a more problematic level of latency similar to what is found in current AR systems.
VST Simulation
In a VST system, since the real-world imagery comes through the camera, processing and rendering system, it will have a certain amount of latency. Similarly, the virtual objects will have some amount of latency, which might be equal to or different from the latency of the real-world imagery.
We have designed four different VST simulations, with either low (25 ms) or high (75 ms) amounts of artificial latency, and with either matched or unmatched latencies between the real-world and virtual imagery. Thus, the four combinations were (real-world latency/virtual latency) 25/25, 25/50, 75/75, and 75/150.
Real-world Simulation
We needed a baseline condition to simulate the real-world. This condition did not add any additional latency for real-world or virtual imagery, in addition to the existing minimal system latency.
Limitations of This Study
In this study, we accurately controlled the amount of latency between the seven aforementioned conditions. However, unfortunately we do not have measurements of the end-to-end latency of the system. The baseline system latency is an unavoidable characteristic of using AR simulation and the synthetic latency we used to simulate AR systems was added to the baseline latency. We tried to minimize the system latency as much as possible. In this study we consider the delta between the amounts of latency for various conditions and use the difference in latency as the controlled variable. Nonetheless, we acknowledge that the amount of baseline latency can have an effect on the results.
Experimental Design
In order to understand the effects of real-world and virtual object latency and the combination of the two, we designed an empirical study.
Independent Variables
Based on the design described in Section “Materials and Methods,” we have manipulated the type and the amount of latency and whether or not AR objects have additional latency. We aggregate these issues into a single independent variable (“condition”). We defined seven AR simulation conditions shown in Table 1. The condition I: baseline did not include any additional latency. The condition I: baseline is used as the “real-world” condition, and other conditions will be compared to this condition to perceive their effectiveness.
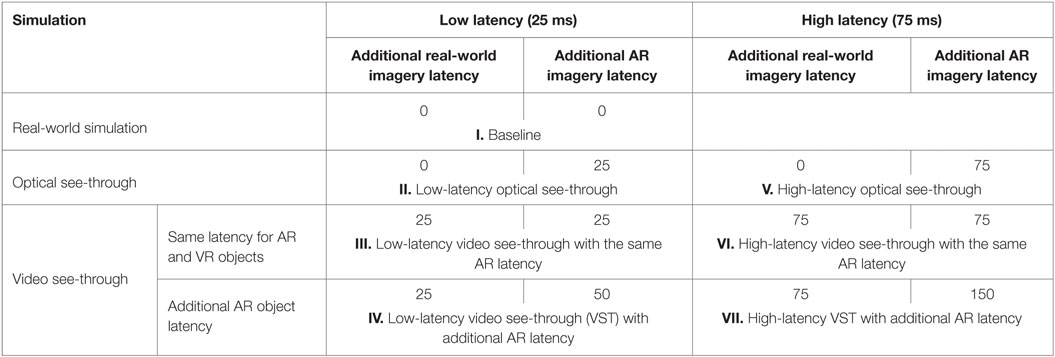
Table 1. Augmented reality (AR) simulation conditions based on optical see-through and video see-through latency.
We defined two OST simulations with low and high amounts of latency: condition II: low-latency optical see-through and condition V: high-latency optical see-through as shown in Table 1.
For VST simulations, we used high and low amounts of latency as well as whether AR objects have the same or more latency compared to real-world objects. We defined four different VST conditions: condition III: low-latency video see-through with the same AR latency, condition VI: high-latency video see-through with the same AR latency, condition IV: low-latency VST with additional AR latency, and condition VII: high-latency VST with additional AR latency, as shown in Table 1.
Thus, in terms of registration, conditions I, III, and VI had perfect registration; conditions II and IV had some misregistration; and conditions V and VII had significant misregistration.
In the study, participants experienced all seven conditions (within-subject design). We randomized the order of the conditions based on a Latin square design. In each condition, six crates were dropped from the sky onto the targets, one by one in order from left to right (Figure 3).
A secondary independent variable was target. Targets were set at distances of 400, 450, 500, 550, 600, and 650 ft. Each target was indicated with a beacon of color green, purple, red, yellow, blue, and cyan accordingly. The order of the targets was fixed as shown in Figure 3. We included target as a variable in our analyses because we speculated that target distance and/or order might have an effect on the user’s accuracy.
Measures
To measure accuracy, we designed a penalty function to calculate the score for each user. The penalty function was based on the distance between the region where the crate actually landed and the region that the user reported (Figure 2A). As an example, if the crate landed in region 0 and the user reported that it landed in region 2, since these two regions are adjacent, there would be one penalty point. In another scenario, if the crate landed in region 1 and the user reported that it landed in region 7, there would be three penalty points since regions 1 and 7 are three regions apart.
A mistaken report about whether the target exploded would result in one penalty point. Moreover, there would be one penalty point for each unreported target. Participants’ background was captured using a background questionnaire asking for their gender, age, eyesight, dominant hand, occupation, tiredness level, and their prior experience with different types of video games and VR and AR systems. After trying each AR simulation condition, the users completed an interface questionnaire. The interface questionnaire used a 7-point Likert scale to measure the participants’ experience and opinions about each condition regarding difficulty, naturalness, fatigue, ease of learning and ease of use, being fun, being irritating, precision, and similarity to real-world. An exit survey asked the participants to choose the most comfortable, most natural, most preferable, most precise, most fun, and easiest to learn conditions.
Participants
We recruited 30 participants including 12 females and 18 males from 18 to 33 years old. The recruitment was on a voluntary basis from the undergraduate and graduate students. Seven people had prior experience with HMDs, such as Oculus Rift and Google Cardboard, and two had prior experience with AR systems such as Google Glass.
Procedure
The Institutional Review Board (IRB) of Virginia Tech approved this study. Upon arrival, participants were asked to read and sign an informed consent form. Next, they filled in the background questionnaire. Participants were then provided with a summary document about the facility to be used, the experiment, and the different AR simulation conditions, followed by a training session, which let them acclimate with the CAVE, the binoculars view, and the task.
For each condition, participants were asked to observe and report on five sets of drops. Each set of drops consisted of six crates dropped consecutively with a 6-s difference between subsequent crates, dropping from the sky onto the six targets. Users were asked to report orally about which target they were reporting (color of the beacon), where the crate landed, and whether it exploded. Their results were collected in a form by the researchers and were compared to the correct data.
After completing the five sets of drops for each interface, the participant was given a rest break and was asked to complete the interface questionnaire. After completing all seven conditions, participants were asked to fill out the exit survey.
Results
To understand the significant interaction effects and main effects of the independent variables, we ran a two-way ANOVA with condition and target as independent variables. When we found significant effects, we performed post hoc pairwise comparisons using Tukey–Kramer HSD tests.
Accuracy
We found a significant interaction between condition and target (F41,6259 = 278.73; p < 0.0001) on the amount of error. For AR simulation conditions with perfect registration (i.e., conditions I, III, and VI), target did not influence accuracy (Figure 4). For conditions with some misregistration (i.e., conditions II and IV) and conditions with significant misregistration (i.e., conditions V and VII), in general, participants were significantly more accurate with the targets that were closer and earlier in the order. Although target order and target distance were varied together in our experiment, our observations suggest that target order was the more important factor. As the participant completed a set of trials in conditions with misregistration, it was possible for them to fall behind (i.e., since it was difficult to determine the location one crate hit the ground, they might miss the drop or impact of the next crate). This meant that errors tended to increase with later targets as compared to earlier ones.
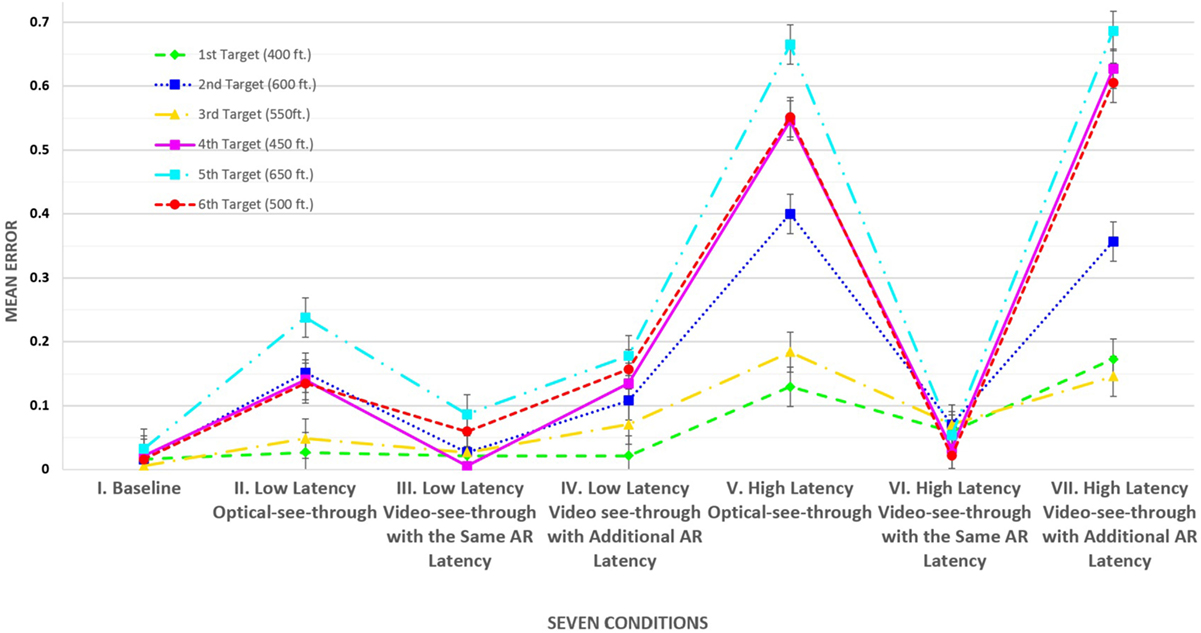
Figure 4. Interaction between augmented reality simulation condition and target. Dark lines indicate SE.
We observed a significant main effect of target on the amount of error (F5,30 = 51.56; p < 0.0001). Moreover, we observed a significant effect of condition on the amount of error (F6,30 = 167.56; p < 0.0001).
After we found the main effect of condition, we performed a post hoc pairwise comparison using Tukey–Kramer HSD tests. The groups A–C shown in Figure 5 came from our post hoc analysis. Conditions not connected by the same letter are significantly different. Participants had significantly less error using each of the conditions in group A, including condition I (mean = 0.40), condition III (mean = 0.87), and condition VI (mean = 1.2), as compared to each condition in group B, including condition II (mean = 3.63) and condition IV (mean = 3.47) (p < 0.0001 for all pairs). Similarly, each condition in group B had significantly less error as compared to each condition in group C, including condition V (mean = 9.93) and condition VII (mean = 10.67) (p < 0.0001 for all pairs).
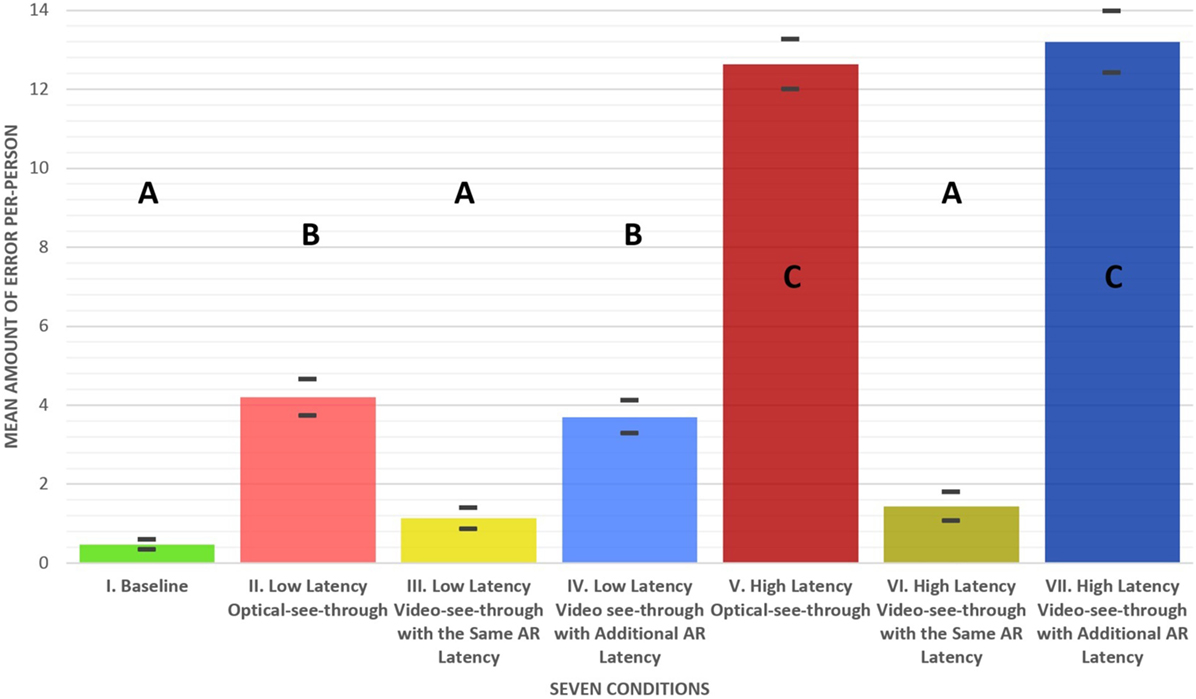
Figure 5. Mean amount of error per person for each augmented reality simulation condition. Conditions not connected by the same letter are significantly different. Dark lines indicate SE. Less amount of error is better.
Interface Questionnaire Results
To analyze the results of the questionnaire participants completed for each condition, we took a slightly different approach. We wanted to understand how user experience was affected by real-world latency and virtual-world latency separately and in combination, so we ran a series of two-way ANOVAs (one for each question) with the levels of latency as the independent variables.
We found a significant interaction effect of real-world latency and virtual-world latency on perceived difficulty (F3,206 = 27.87; p = 0.0052), irritation (F3,206 = 18.37; p = 0.0005), ease of learning (F3,206 = 9.17; p = 0.0375), naturalness (F3,206 = 23.31; p = 0.0151), and precision (F3,206 = 22.43; p = 0.0011). Figure 6 shows the data for the four extreme conditions (conditions I, V, VI, and VII, where real-world latency is either 0 or 75 ms and virtual-world latency is either 0 or 75 additional milliseconds). As shown in Figure 6, with no additional virtual-world latency, the user perceived less irritation and difficulty with no additional real-world latency than with high real-world latency. On the other hand, with a high amount of virtual-world latency, high real-world latency was significantly better in terms of irritation and difficulty than with low real-world latency.
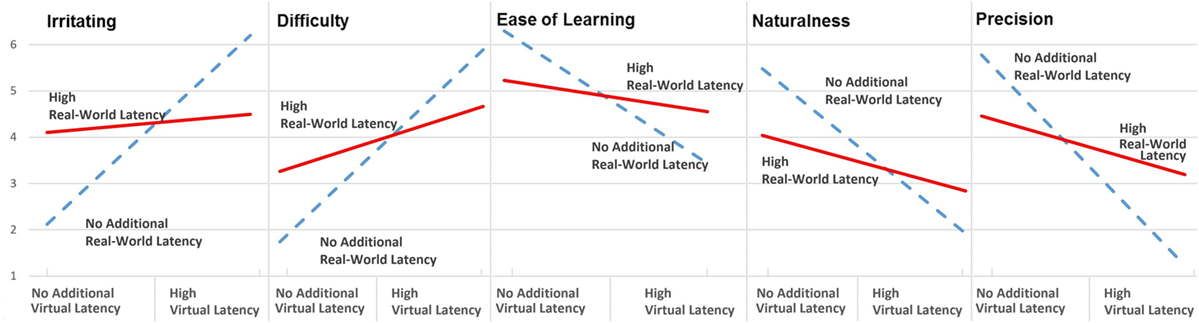
Figure 6. Significant interaction effect of virtual and real-world latency for the subjective ratings. The red line indicates high real-world latency, and the dotted blue line indicates no additional real-world latency.
For ease of learning, naturalness, and perceived precision, with no additional virtual-world latency, no additional real-world latency was significantly better than high real-world latency. However, with a high amount of virtual-world latency, high real-world latency was significantly better than no additional real-world latency (Figure 6).
Both of these results again point to registration as a key factor driving user experience. With a fixed level of virtual-world latency, the matching real-world latency condition provided a significantly better user experience than the unmatched condition, even when the unmatched condition had lower absolute latency.
As shown in Figure 7, most users felt that condition I was not difficult at all. In conditions with increasingly higher levels of latency, the difficulty rating increases (Figure 7). The groups A–E shown in Figure 7 are generated by our post hoc analysis. Significantly different conditions are not connected by the same letter.
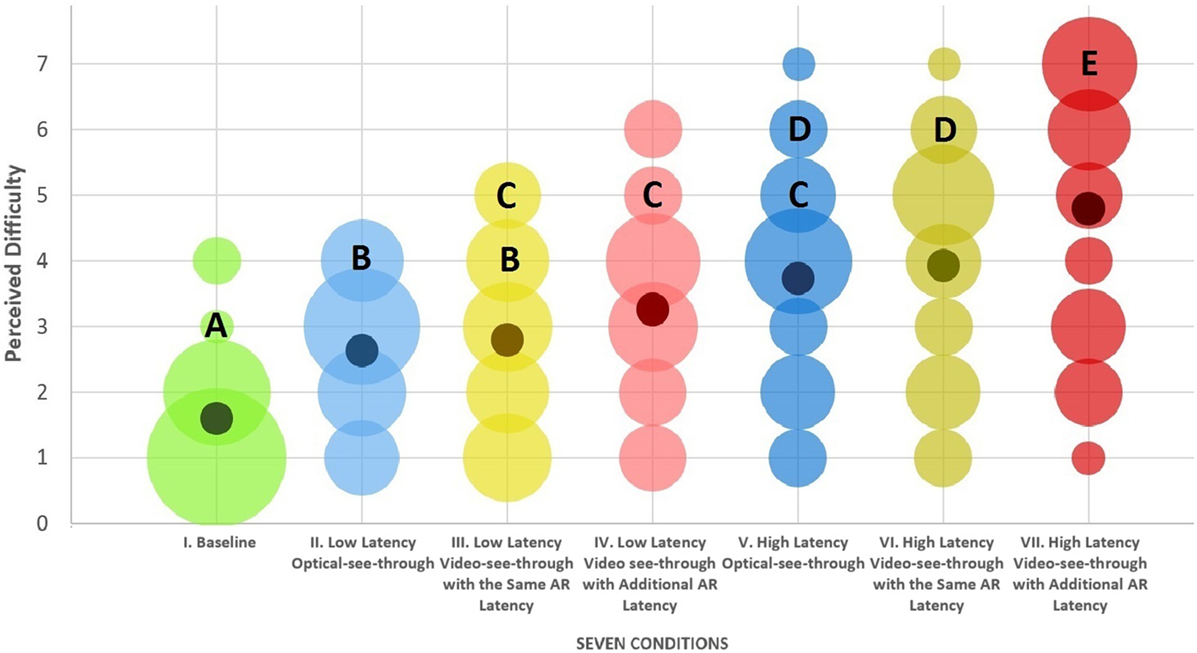
Figure 7. Perceived difficulty for each augmented reality simulation condition. The size of the bubbles indicates the number of ratings. Dark dots are the mean values. Conditions not connected by the same letter are significantly different.
Discussion
As we expected, conditions with high levels of absolute latency, such as conditions V and VII, had low accuracy. However, condition VI, which also had a high amount of latency, had significantly better results than conditions V and VII. Similarly, for low-latency conditions, condition III had significantly better results than conditions II and IV. This indicates that it was not the absolute level of latency that determined performance in our study.
Even when both virtual and real-world imagery had high levels of latency (condition VI, with 75 ms of latency for both types of imagery), participants were more accurate than they were in the condition with no added latency for real-world imagery and a small amount of added latency for virtual objects (condition II). Thus, the difference between the levels of virtual and real-world imagery latency appears to be the best predictor of accuracy for this task. As we have noted, this difference will prevent the virtual objects from registering exactly to the real-world imagery and will cause a flickering and shaking effect, which will affect users’ ability to effectively observe and track the targets.
In addition, we found that different levels of misregistration can affect accuracy. Larger differences between virtual and real-world latency made performance on this task worse. However, the reader should note that we only observed this fact for a particular task (training forward observers), and further investigation is required for other type of tasks.
We did not observe any significant differences between the real-world condition and the conditions with matched virtual and real-world latency (conditions I, III, and VI). However, results were not the same for the user experience parameters. Higher latency, in general, impacted negatively on the user experience for all parameters we examined (Figure 8).
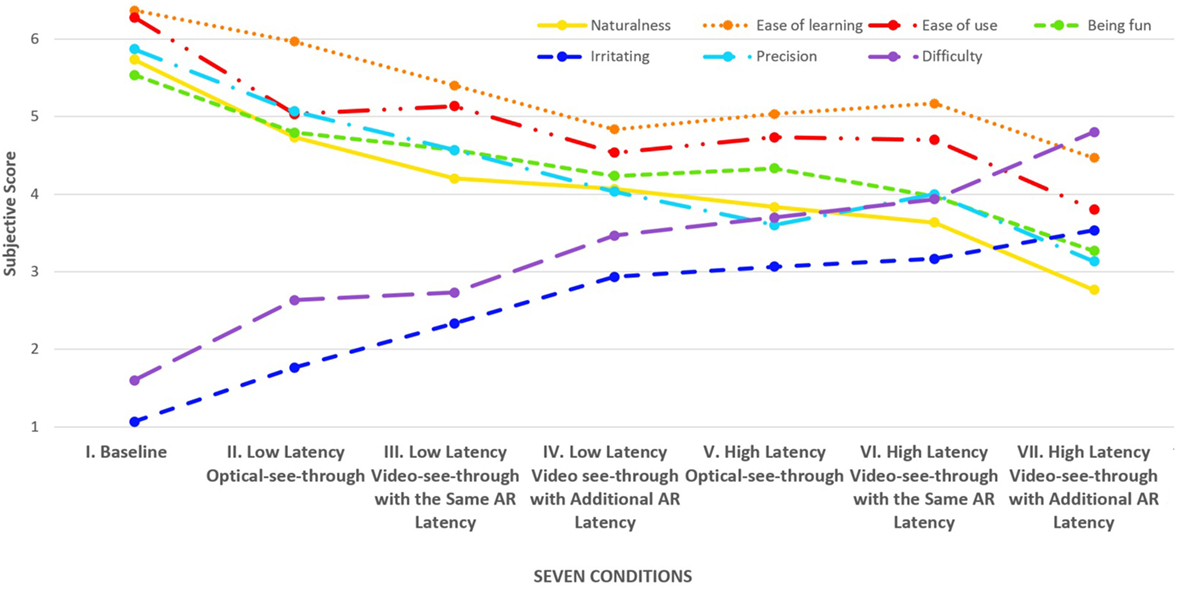
Figure 8. The user-perceived parameters from the interface questionnaire for each augmented reality simulation condition. Dots are mean values. The Y-axis includes the users’ subjective score.
The interaction between the real-world and virtual-world latencies for the interface questionnaire signifies that, if we have low virtual latency, then low real-world imagery latency is preferred for the measures of user-perceived difficulty, irritation, ease of learning, naturalness, and precision. On the other hand, with a high amount of virtual-world latency, users had a better experience with the high amount of real-world latency. This might seem surprising, but it strengthens the idea that a robust registration for the virtual objects seems more important than the effects of latency on the real-world image.
Even though high real-world latency might look “ugly” from the user’s perspective, low real-world latency in the presence of high virtual latency can be detrimental to both user experience and performance. For tasks where registration is critical, systems designers might even want to consider adding some latency to the real-world imagery.
We acknowledge that this experiment tested a simulation of AR systems, and it had differences with actual AR systems. The baseline system latency of the VR system is an inherent feature of the AR simulation. Unfortunately, we do not have a measurement of the amount of baseline latency. However, based on our experience in the experiment, the amount of latency was considerably low. Moreover, we considered the additional AR latency which was added to the baseline system latency for simulating various AR systems, and used this delta between various conditions as the controlled variable. The delta in latencies of the conditions was accurately applied to the simulation conditions, therefore we believe that our results are valid and can be applied to similar systems.
In our system, all objects, including virtual and real-world imagery, were in focus when users accommodated at the distance of the screen. In a real OST AR system, accommodation cues differ between real-world and virtual imagery. Similarly, in an actual OST system, the virtual imagery is semitransparent, while in our simulation, the virtual imagery was fully opaque. Moreover, in current OST and real VST systems, FOV for virtual objects (and sometimes real-world objects) is rather narrow, while our system provided an unconstrained FOV. Considering this, we cannot be certain that these results will be true for all real-world AR systems. However, our system simulates future AR system with ideal specifications such as complete FOV, no transparency and high brightness, which cannot be reached using current AR systems. Furthermore, we argue that the effects we saw in this study should generalize to real AR systems because they were due to registration errors, which we simulated accurately.
Conclusion and Future Work
Augmented reality systems for critical tasks such as training have a variety of characteristics that may affect their effectiveness. In this work, we have studied the impact of registration error due to latency in such systems, using an AR simulation approach.
We found that increasing latency affects user experience negatively, in general. However, for the sake of task performance, it may be worthwhile to maintain registration accuracy at the cost of overall higher latency. We found that the best performance on a forward observer task came in conditions where levels of real-world latency and virtual object latency were matched, leading to perfect registration. This was true even when the absolute level of latency was high.
In the future, using this AR-VR simulation system, we plan to study other characteristics of AR systems, such as resolution, FOV, contrast, brightness, and mobility, independently, in a controlled environment. We can employ other types of displays, such as larger CAVEs, six-sided CAVEs, or HMDs, to increase field of regard. This system is able to support tasks other than training forward observers, and we can employ this system for other types of training applications. We also hope to incorporate more realistic props (e.g., physical binoculars), to study the effects of different levels of interaction fidelity.
Ethics Statement
The IRB of Virginia Tech approved this study. Informed consent for participant of Investigative Project. Virginia Polytechnic Institute and State University. Title of project: Simulation of Augmented Reality inside Virtual Reality: Comparing Different Augmented Reality Systems.
Author Contributions
MN contributed to the main solution as well as design and implementation of this research and conducted the research experiment. SS contributed to the solution as well as design and implementation. DB mentored this research project and contributed to the design and solution. TH collaborated to this project and contributed ideas.
Conflict of Interest Statement
The authors declare that the research was conducted in the absence of any commercial or financial relationships that could be construed as a potential conflict of interest.
Acknowledgments
This work was supported by the Immersive Sciences program of the Office of Naval Research. The authors thank Fintan Kelly for his collaboration on this project.
References
Azuma, R., Baillot, Y., Behringer, R., Feiner, S., Julier, S., and MacIntyre, B. (2001). Recent advances in augmented reality. IEEE Comput. Graph. Appl. 21, 34–47. doi: 10.1109/38.963459
Azuma, R. T. (1997). A survey of augmented reality. Presence 6, 355–385. doi:10.1162/pres.1997.6.4.355
Beigbeder, T., Coughlan, R., Lusher, C., Plunkett, J., Agu, E., and Claypool, M. (2004). “The effects of loss and latency on user performance in unreal tournament 2003®,” in Proceedings of 3rd ACM SIGCOMM Workshop on Network and System Support for Games, (ACM), p. 144–151.
Boud, A. C., Haniff, D. J., Baber, C., and Steiner, S. J. (1999). “Virtual reality and augmented reality as a training tool for assembly tasks,” in Proceedings of 1999 IEEE International Conference on Information Visualization, (IEEE), 32–36.
Bowman, D., and McMahan, R. P. (2007). Virtual reality: how much immersion is enough? Computer 40, 36–43. doi:10.1109/MC.2007.257
Bowman, D. A., Stinson, C., Ragan, E. D., Scerbo, S., Höllerer, T., Lee, C., et al. (2012). “Evaluating effectiveness in virtual environments with MR simulation,” in Interservice/Industry Training, Simulation, and Education Conference.
Brooks, F. P. Jr. (1999). What’s real about virtual reality? Comput. Graph. Appl. IEEE 19, 16–27. doi:10.1109/38.799723
Buker, T. J., Vincenzi, D. A., and Deaton, J. E. (2012). The effect of apparent latency on simulator sickness while using a see-through helmet-mounted display reducing apparent latency with predictive compensation. Hum. Factors 54, 235–249. doi:10.1177/0018720811428734
Cohn, J., Schmorrow, D., Lyons, D., Templeman, J., and Muller, P. (2004). Virtual Technologies and Environments for Expeditionary Warfare Training. Washington DC: Naval Research Lab.
Congress, U. S. (1994). Virtual Reality and Technologies for Combat Simulation-Background Paper. US Government Printing Office.
Di Luca, M. (2010). New method to measure end-to-end delay of virtual reality. Presence 19, 569–584. doi:10.1162/pres_a_00023
Ebersole, J. F., Furlong, T. J., and Ebersole, J. F. Jr. (2002). U.S. Patent No. 6,500,008. Washington DC: U.S. Patent and Trademark Office.
Ellis, S. R., Breant, F., Manges, B., Jacoby, R., and Adelstein, B. D. (1997). “Factors influencing operator interaction with virtual objects viewed via head-mounted see-through displays: viewing conditions and rendering latency,” in Virtual Reality Annual International Symposium, 1997, IEEE 1997, (IEEE), 138–145.
Frank, L. H., Casali, J. G., and Wierwille, W. W. (1988). Effects of visual display and motion system delays on operator performance and uneasiness in a driving simulator. Hum. Factors 30, 201–217.
Friston, S., and Steed, A. (2014). Measuring latency in virtual environments. IEEE Trans. Vis. Comput. Graph. 20, 616–625. doi:10.1109/TVCG.2014.30
Gabbard, J. L., Edward Swan, J., and Hix, D. (2006). The effects of text drawing styles, background textures, and natural lighting on text legibility in outdoor augmented reality. Presence 15, 16–32. doi:10.1162/pres.2006.15.1.16
Goldberg, S. L., Knerr, B. W., and Grosse, J. (2003). Training Dismounted Combatants in Virtual Environments. Army Research Development and Engineering Command Orlando FL Simulation Technology Center.
Goldiez, B. F., Saptoka, N., and Aedunuthula, P. (2006). Human Performance Assessments when Using Augmented Reality for Navigation. University of Central Florida Orlando Inst for Simulation and Training.
Hirota, G., Chen, D. T., Garrett, W. F., and Livingston, M. A. (1996). “Superior augmented reality registration by integrating landmark tracking and magnetic tracking,” in Paper Presented at the Proceedings of the 23rd Annual Conference on Computer Graphics and Interactive Techniques.
Ivkovic, Z., Stavness, I., Gutwin, C., and Sutcliffe, S. (2015). “Quantifying and mitigating the negative effects of local latencies on aiming in 3D shooter games,” in Paper Presented at the Proceedings of the 33rd Annual ACM Conference on Human Factors in Computing Systems.
Jacobs, M. C., and Livingston, M. A. (1997). “Managing latency in complex augmented reality systems,” in Paper Presented at the Proceedings of the 1997 Symposium on Interactive 3D Graphics.
Julier, S., Baillot, Y., Lanzagorta, M., Brown, D., and Rosenblum, L. (2001). Bars: Battlefield Augmented Reality System. Naval Research Lab Washington DC Advanced Information Technology.
Lee, C., Bonebrake, S., Bowman, D. A., and Höllerer, T. (2010). “The role of latency in the validity of AR simulation,” in Paper Presented at the 2010 IEEE Virtual Reality Conference (VR).
Lee, C., Rincon, G. A., Meyer, G., Höllerer, T., and Bowman, D. A. (2013). The effects of visual realism on search tasks in mixed reality simulation. IEEE Trans. Vis. Comput. Graph. 19, 547–556. doi:10.1109/TVCG.2013.41
Lee, K. (2012). Augmented reality in education and training. TechTrends 56, 13–21. doi:10.1007/s11528-012-0559-3
Lincoln, P., Blate, A., Singh, M., Whitted, T., State, A., Lastra, A., et al. (2016). From motion to photons in 80 microseconds: towards minimal latency for virtual and augmented reality. IEEE Trans. Vis. Comput. Graph. 22, 1367–1376. doi:10.1109/TVCG.2016.2518038
Livingston, M. A., Swan, I. I., Julier, S. J., Baillot, Y., Brown, D., Rosenblum, L. J., et al. (2004). Evaluating System Capabilities and User Performance in the Battlefield Augmented Reality System. Naval Research Lab Washington DC Virtual Reality Lab.
Mavor, A. S., and Durlach, N. I. (1994). Virtual Reality: Scientific and Technological Challenges. National Academies Press.
Mine, M. R. (1993). Characterization of End-to-End Delays in Head-Mounted Display Systems. Chapel Hill: The University of North Carolina, TR93–TR91.
Neumann, U., and Majoros, A. (1998). “Cognitive, performance, and systems issues for augmented reality applications in manufacturing and maintenance,” in Paper Presented at the Virtual Reality Annual International Symposium, 1998, (IEEE).
Pair, J., and Rizzo, A. (2006). Cognitive Performance Assessment in Mixed and Virtual Environment Systems. University of Southern California Marina Del Rey CA Inst for Creative Technologies.
Pantel, L., and Wolf, L. C. (2002). “On the impact of delay on real-time multiplayer games,” in Paper Presented at the Proceedings of the 12th International Workshop on Network and Operating Systems Support for Digital Audio and Video.
Psotka, J. (1995). Immersive training systems: virtual reality and education and training. Instr. Sci. 23, 405–431. doi:10.1007/BF00896880
Ragan, E., Wilkes, C., Bowman, D. A., and Hollerer, T. (2009). “Simulation of augmented reality systems in purely virtual environments,” in Paper Presented at the 2009 IEEE Virtual Reality Conference.
Ren, D., Goldschwendt, T., Chang, Y., and Höllerer, T. (2016). Evaluating Wide-Field-of-View Augmented Reality with Mixed Reality Simulation.
Schwald, B., and De Laval, B. (2003). An Augmented Reality System for Training and Assistance to Maintenance in the Industrial Context.
Seymour, N. E., Gallagher, A. G., Roman, S. A., O’Brien, M. K., Bansal, V. K., Andersen, D. K., et al. (2002). Virtual reality training improves operating room performance: results of a randomized, double-blinded study. Ann. Surg. 236, 458–464. doi:10.1097/00000658-200210000-00008
Squire, P. (2013). Augmented Immersive Team Training. Available at: http://www.onr.navy.mil/Media-Center/Fact-Sheets/AITT.aspx
Steed, A. (2008). “A simple method for estimating the latency of interactive, real-time graphics simulations,” in Paper Presented at the Proceedings of the 2008 ACM Symposium on Virtual Reality Software and Technology.
Tappert, C. C., Ruocco, A. S., Langdorf, K. A., Mabry, F. J., Heineman, K. J., Brick, T. A., et al. (2001). Military applications of wearable computers and augmented reality. Fundamentals of Wearable Computers and Augmented Reality, 625–647.
Teather, R. J., Pavlovych, A., Stuerzlinger, W., and MacKenzie, I. S. (2009). “Effects of tracking technology, latency, and spatial jitter on object movement,” in Paper Presented at the 3D User Interfaces, 2009. IEEE Symposium on 3DUI 2009.
Keywords: augmented reality, latency, AR simulation, optical see-through, video see-through
Citation: Nabiyouni M, Scerbo S, Bowman DA and Höllerer T (2017) Relative Effects of Real-world and Virtual-World Latency on an Augmented Reality Training Task: An AR Simulation Experiment. Front. ICT 3:34. doi: 10.3389/fict.2016.00034
Received: 28 June 2016; Accepted: 21 December 2016;
Published: 30 January 2017
Edited by:
John Quarles, University of Texas at San Antonio, USAReviewed by:
Jean-Marie Normand, Ecole Centrale de Nantes, FranceAndreas Duenser, Commonwealth Scientific and Industrial Research Organisation (CSIRO), Australia
Copyright: © 2017 Nabiyouni, Scerbo, Bowman and Höllerer. This is an open-access article distributed under the terms of the Creative Commons Attribution License (CC BY). The use, distribution or reproduction in other forums is permitted, provided the original author(s) or licensor are credited and that the original publication in this journal is cited, in accordance with accepted academic practice. No use, distribution or reproduction is permitted which does not comply with these terms.
*Correspondence: Mahdi Nabiyouni, bmFiaXlvdW5AdnQuZWR1