 Haojie Wu
 Daniel H. Ashmead
 Haley Adams
 Bobby Bodenheimer
- 1Department of Electrical Engineering and Computer Science, Vanderbilt University, Nashville, TN, United States
- 2Department of Hearing and Speech Sciences, Vanderbilt University, Nashville, TN, United States
This work investigates how pedestrian street crossing behavior at a virtual traffic roundabout is affected by central visual field loss. We exposed participants with normal vision to a first-person virtual experience of central visual field loss of variable size in the form of a simulated scotoma, an area of the visual field with degraded visual acuity. A larger size of scotoma influenced people to select longer gaps between traffic, and to wait longer before initiating a crossing. In addition, a gender difference was found for risk taking behavior. Male subjects tended to take more risk, as indicated by the selection of shorter gaps in traffic and a shorter delay before the initiation of a crossing. Our findings generally replicate those of studies done in real-world conditions using participants afflicted with genuine central vision loss, supporting the hypothesis that virtual reality is a safe and accessible alternative for investigating similar issues of public concern.
1. Introduction
Virtual Reality (VR) provides an effective medium for the study of human behavior. The appeal of this technology lies in its capacity to control environmental factors. VR also finds applications in research where conducting an experiment may be too dangerous or infeasible for real-world execution. Thus, VR has been used to investigate pedestrian behavior at intersections (Clancy et al., 2006; Seward et al., 2007; Bernhard et al., 2008; Meir et al., 2015; Morrongiello et al., 2015). Real traffic scenarios present unnecessary risk to participants and are difficult to control with accuracy. Contributing to previous virtual traffic research, we conducted an investigation into the ability of pedestrians to make street-crossing decisions under simulated visual impairment. In contrast to prior studies, our virtual environment consists of a roundabout, rather than a traditional, linear intersection, because the ability of a pedestrian to judge sufficient openings, or gaps, in traffic is essential for crossing the street at circular junctions safely. For the visually impaired and other vulnerable populations, this ability may be compromised, resulting in unsafe decision making at these special crossroads. This concern is motivated by real-world studies (Ashmead et al., 2005; Guth et al., 2005), which have established that blind individuals make poor gap judgments at traffic roundabouts. Accordingly, these populations have been of interest for behavioral analysis within the domain of pedestrian safety.
We are interested in how macular degeneration in particular affects performance and safety in pedestrian situations. Macular degeneration is a medical condition that primarily affects older populations and results in vision loss to the center of the visual field. This loss is due to the deterioration of the macula, which lies near the center of the eye's retina. The resulting degradation of visual acuity, or scotoma, may present itself as a partial vision loss or complete occlusion. Clear central vision is essential for observing fine detail, and central vision deficits affect performance in daily activities such as reading and walking (Hassan et al., 2002; Ergun et al., 2003). At present macular degeneration accounts for 8.7% of all blindness worldwide and is the most common cause of blindness in developed countries (Wong et al., 2014). Alarmingly, the number of people worldwide with age-related macular degeneration alone is projected to rise to 196 million by 2020, advancing to 288 million by 2040.
In an effort to aid in determining the extent to which macular degeneration affects the movement and safety of afflicted pedestrians, we analyzed pedestrian performance at a roundabout intersection without traffic signal guidance. To achieve this goal, we embedded a simulation of our desired visual deficit into an immersive virtual reality application. Both our experimental setup and virtual environment were inspired by prior literature, which analyzes gap crossing judgments in order to evaluate pedestrian safety (Wu et al., 2009). We define gap crossing as the selection of a break in the traffic stream followed by traversal of an intersection. By exposing normally sighted individuals to this first-person experience and assessing their gap crossing behavior, we were able to investigate the effect of macular degeneration on gap crossing judgments.
Thus, this study simulates a visual impairment (macular degeneration) in a virtual traffic crossing to assess a vulnerable population's ability to make critical judgments on issues of safety. Recruiting a population with actual visual impairments for either real-world or virtual studies is problematic as this population is often elderly and may have balance issues that limit use of head-mounted displays (HMDs); also, the limited contrast range of most HMDs makes viewing difficult for such a group. It may therefore be more effective to simulate the visual impairment and use healthy subjects. Likewise, the virtual traffic simulation itself provides a safe means of studying a dynamic and potentially hazardous phenomena under controlled conditions. We show that our macular degeneration simulation offers a controlled and well defined model of real visual impairment; and our roundabout traffic simulation provides a realistic and safe environment.
Our head-mounted display (HMD) based virtual environment consisted of a roundabout, a controllable traffic simulation, a 3D acoustic subsystem, and a vision deficit simulation. The virtual environment modeled a single lane roundabout accompanied with crosswalks and splitter islands. The simulated traffic reproduced vehicle acceleration and deceleration patterns as well as other natural traffic interactions, such as collision avoidance and pedestrian yielding.
2. Background and Related Work
Plumert et al. (2004, 2007) studied street crossings and gap affordances at linear intersections in a large screen virtual environment in the context of cycling safety, with particular attention to children. They found children and adults chose the same-size gaps and yet children ended up with less time to spare when they cleared the path of the approaching car, providing evidence of a significant developmental change in affordance judgments for adolescents. Their work has also studied pedestrian behavior at such intersections O'Neal et al. (2017) and judgments involving two lanes of traffic Grechkin et al. (2013). In contrast to their work, our work takes place in the context of the exit lane of a roundabout, where traffic decisions can be more complex, and involves visual impairment.
Geruschat et al. (2006) found that macular degeneration patients appear to have different gaze behavior in comparison to fully-sighted people during high-risk activities. Geruschat et al. (2011) compared traffic gap detection among pedestrians with normal vision, central vision loss, and peripheral vision loss. While their results suggested that all groups could identify crossable and uncrossable gaps accurately, there was a significant effect of low vision in measures of latency and safety. The study also found that decisions at the exit lane of a roundabout are more difficult than those at then entry lane. These experiments, done in the real world at an uncontrolled intersection with a handheld trigger as the indicator of deciding to cross are best viewed as complementary to ours, which involve real locomotion in a controlled traffic simulation in a virtual environment.
Hassan (2012) compared normally sighted, visually impaired, and blind pedestrians' street crossing decisions, and found that visually impaired participants' performance was as accurate and reliable as normally sighted participants. Unsurprisingly, blind pedestrians were the least accurate in making street crossing decisions. Hassan and Snyder (2012) continued this investigation among elderly people with macular degeneration, elderly people with normal vision, and young normally sighted pedestrians. Again, no significant differences were found between macular degeneration and age-matched, normally-sighted pedestrians in street crossing decisions. However, the study found a risky tendency for macular degeneration pedestrians to make unsafe street-crossing decisions. Our study seeks to provide a simulation that provides normally sighted people with an understanding of the difficulties faced by these visual deficits and is behaviorially equivalent. This work is again best viewed as complementary to ours since it involved decisions at simpler traffic intersections (the single lane of a one-way street), and used a handheld trigger as an indicator of deciding to cross. It is likely that our simulation presented visual impairments that were in a broader range of impairment than those studied by this body of work as well, as Hassan and colleagues focused on subjects with mild to moderate visual impairments.
Virtual reality has been applied to simulate visual impairments for medical training and education purposes, as well. These simulations provide first-person experiences for medical professionals to better understand the daily difficulties encountered by patients. Ai et al. (2000) and Jin et al. (2005) simulated various forms of eye diseases in the context of a virtual apartment and received positive user response. They simulated macular degeneration through the application of an opacity mask and a wavy mask. Banks and McCrindle (2008) created a similar, specialized visual eye disease simulator for architects to view their designs through the perspective of a visually impaired onlooker. This work provides engineers with a better understanding of how to design public spaces for better accessibility and easier navigation. In the study presented by Lewis et al. (2012), a Gaussian blur and a distortion shader were applied to simulate macular degeneration. They also conducted an effectiveness test which showed that using their visual impairment simulator improved users understanding of visual impairments in general. Expanding the virtual microcosm, Väyrynen et al. (2016) designed a navigation task amidst a city environment that allowed for participants to experience various visual impairments such as macular degeneration, cataracts, glaucoma, and myopia in a dynamic setting.
In augmented reality, various types and levels of visual impairment have also been simulated. Through the coupling of head-mounted displays and stereoscopic cameras, Ates et al. (2015) and Werfel et al. (2016) produced simulation tools to generate experiences using real-time video feedback. Both developments focus primarily on user experience, invoked empathy, and understanding as metrics for evaluation. While most studies recreate computational estimations of low vision experiences, an assessment tool was designed by Pamplona et al. (2011) to capture retinal information from a high-contrast light-field display. Although this information is not displayed in real-time, it is able to create an accurate depiction of the visual occlusion experienced by a participating subject.
3. The Roundabout Virtual Environment
A roundabout is a circular intersection in which an entering vehicle must adjust direction and speed in order to merge into a uni-directional traffic circle. Our environment is modeled after the Pullen-Stinson roundabout, at North Carolina State University. Figure 1 shows a bird's eye view of the scene. Upon approach to the roundabout, a vehicle in the system gradually reduces momentum from a default speed (15 m/s) to a circulating speed (7.5 m/s), maintaining the circulating speed for the duration of its roundabout traversal. Upon exiting, the vehicle gradually accelerates back to the original, default speed of 15 m/s. A vehicle must also avoid collisions, although our subjects were instructed not to “force” such yielding.
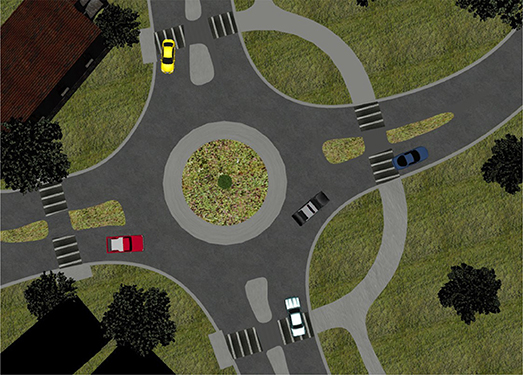
Figure 1. An overview of a roundabout virtual environment.
Our system controls travel paths, start times, and velocities for all vehicles so that a variable stream of virtual automobiles may be scheduled and launched for each trial. These trials can therefore represent a variety of traffic scenarios by providing a series of time gaps between moving vehicles, based on a specified distribution. In our procedure each traffic stream includes a maximum of eight vehicles, which are randomly selected from eight distinct vehicle models.
To include both auditory and visual cues in our environment, we added a three-dimensional (3D) acoustic subsystem capable of synthesizing the spatialized sound associated with moving vehicles in real-time. Our spatialized audio rendering uses a non-individual head-related transfer function (HRTF) (Begault, 1994; Kapralos et al., 2008), derived from the anthropomorphic audio logical research mannequin KEMAR (Knowles Electronics) (Gardner and Martin, 1995).
Within this HMD-based virtual environment, users can safely interact with controlled traffic streams, which allocate sufficient time for street traversal upon the event of a designated, safe time gap in traffic. A sample rendering of the pedestrian's viewpoint of the roundabout with traffic is shown in Figure 2. More details about the roundabout environment can be found in Wu et al. (2009).
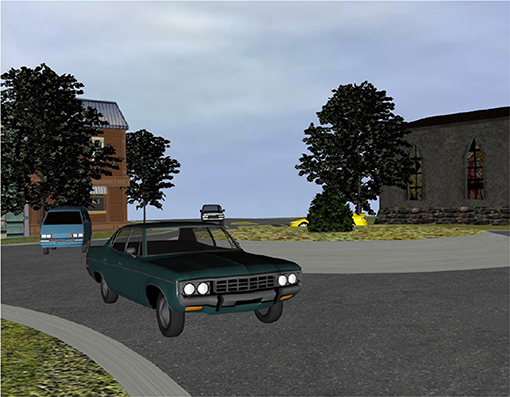
Figure 2. Traffic view within the roundabout.
4. Simulating Macular Degeneration
4.1. Optical Distortions
Induced by retinal damage, macular degeneration often results in scotomas, or areas of reduced light sensitivity, in the retina. A relative scotoma, which can be simulated by blurring images, refers to an area that retains some residual light sensitivity. An absolute scotoma, which can be simulated as an opaque spot, describes the absence of any light perception. The shape and size of scotomas vary across patients. In this simulation, we generalize a model of macular degeneration through the combination of a blur and opacity filter, which is expressed by a circle of black area within a circle of a blurred region. Figure 3 provides a sample rendering of the low-vision simulation for clarification. Our filter was implemented via the OpenGL Shading Language (GLSL) embedded in Vizard.
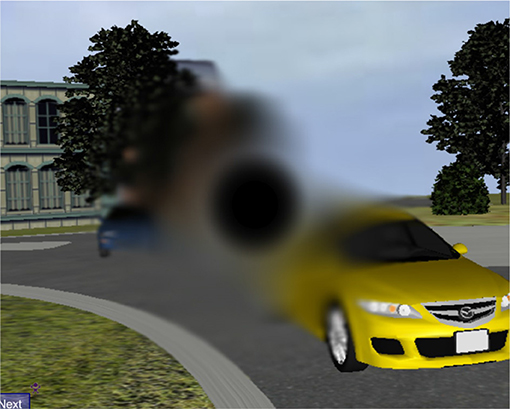
Figure 3. Macular degeneration simulation (a black area, 10° of visual angle, surround by a blurred area, 20° of visual angle).
Central scotomas are represented by a variety of shapes including: circles, ellipses, ring-shapes, and horseshoes, as well as more irregular geometries. The majority of macular degeneration studies (Guez et al., 1993; Hassan et al., 2002) use diameters to infer scotomas, so we have generated a circle-based approximation to provide a reasonable comparison. The macula refers to an area of approximately 5-6 mm in diameter, centered on the fovea, which corresponds to the central 15°-20° of visual angle (Cheung and Legge, 2005). Our HMD has field of view 44° horizontally and 35° vertically, so there is a wide range to the visual angles of scotomas it can generate. Previous studies (Hassan et al., 2002; Ergun et al., 2003) have revealed that the size of the absolute scotoma correlates significantly with one's ability to perform daily tasks. Therefore, for the efficacy of our simulation, it is imperative to provide an allowance for any size of potential scotoma.
Visual acuity is another indication of a person's ability to perform a range of vision-dependent daily living tasks (McClure et al., 2000). In our system, changing the amount of blur for the relative scotoma can control visual acuity. We asked 8 people to report letters binocularly using a Snellen chart in a virtual environment. The acuity estimates were systematically related to the blur factor and fit to an exponential curve, as shown in Figure 4. The image transitions from clear to blur or opacity needs to be smoothed without sharp edges. A Gaussian function was applied to define the level of blur or opacity over the transition on edges. This type of simulation of visual deficit is consistent with other simulations of such phenomenon (Cornelissen et al., 2005; Geringswald et al., 2012).
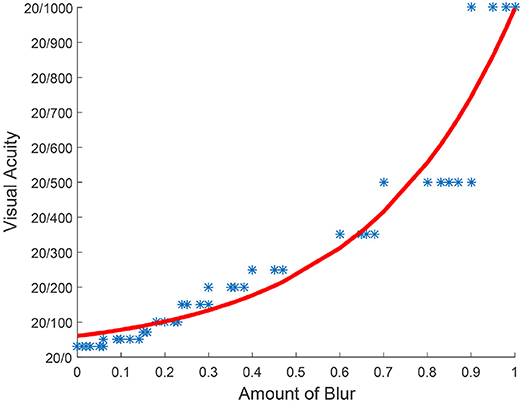
Figure 4. Visual acuity tested by a snellen chart (X axis represents the scale of the blur. Scale 1 makes the scene opaque and scale 0 makes the scene clear. Y axis represents Snellen fraction).
4.2. Gaze-Contingent
Scotomas frequently affect the same region of the visual field in both eyes (Cheung and Legge, 2005) and shift with eye movement in real-time. This type of degradation to the visual field in the foveal region can be simulated with a stereoscopic head-mounted display (HMD) equipped with an eye-tracker. With only a static occlusion in the middle of the display, subjects may circumvent visual occlusions by looking at the clear, peripheral portion of the viewport. However, by using an eye-tracker, gaze position is provided in real-time so that the system can link simulated scotomas with current gaze position. This allows scotomas to shift with real-time gaze movement and provides a dynamic occlusion at the center of the user's visual field. In this paper we used an NVis SX60 HMD equipped with an Arrington eye-tracker. The Nvisor SX-60 HMD provides 1,280 × 1,024 resolution per eye, a field of view (FOV) of approximately 47° (horizontal) by 37° (vertical) degrees, full binocular overlap, and a frame rate of 60 Hz. The HMD weighs approximately 1 kg. The Arrington eyetracker provides eye tracking with infrared video. The accuracy is approximately 0.25°−1.0° visual arc with spatial resolution approximately 0.15° visual arc. The system records the (X, Y) position of gaze at a rate between 60 and 30 Hz. This rate is faster than the 50 ms of average saccadic suppression (Volkmann, 1986). The position data can be transmitted in real-time to other software applications.
The eye-tracker requires calibration, which was done at two levels. Initially, a calibration to the user was done at the system level. However, optimal calibration was difficult to maintain given the unavoidable slippage of the HMD on the head as people turned their heads to track vehicles and as they crossed the road. To minimize this, we had subjects wear silicone swimming caps before wearing the HMD, and we secured the cable of the HMD to each subject with a belt. Additionally, a second, application layer calibration was conducted within the virtual environment on a per trial basis. This calibration application involved subjects fixating on the center of the visual field and adjusting the eyetracking to match this position.
5. Experiment and Results
5.1. General Design
The purpose of this experiment was to observe how our simulation affected normal-sighted individuals' street crossing decisions at roundabout intersections. In particular, we examined the time gap between vehicles where pedestrians select to cross the street—the gap threshold—under different vision conditions.
In the roundabout virtual environment, subjects were asked to cross the street in an exit lane. This area is shown as the shaded area between point A and point B in Figure 5. For that particular position, there are six paths along which vehicles travel must be checked. These paths are depicted by yellow curves on the same figure: (1) M ->N ->C; (2) M ->N ->E ->F; (3) J ->K ->N ->C; (4) J ->K ->N ->E ->F; (5) G ->H ->K ->N ->C; (6) G ->H ->K ->N ->E ->F. The system creates traffic streams by randomly selecting travel paths for each of eight vehicles from these six paths, allowing half of the vehicles to exit at point C and half of them to exit at point F.
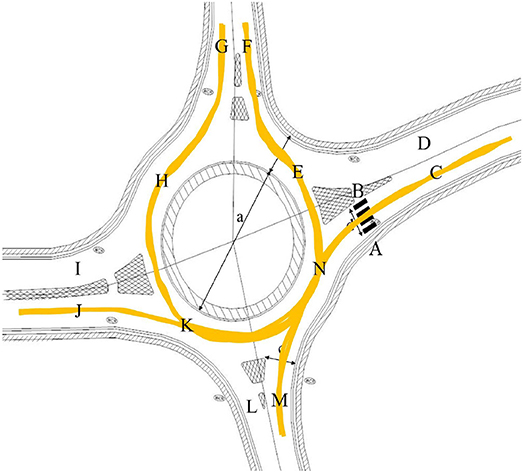
Figure 5. The architectural model of the roundabout, showing the pedestrians crossing area and vehicle travel paths.
The system creates the traffic stream so that there is a gap between vehicles such that a pedestrian at A or B might choose to cross. This gap is the target gap. Each traffic stream is scheduled based on a specified time gap between every two adjacent vehicles. Most of these time gaps represent non-target intervals, which are set to <1.5 s. Only one randomly selected gap in the stream is set to the target gap value, which can range between a minimum of 2 s and a maximum of 10 s. We were interested in analyzing street-crossing decisions made at this interval, which simulated a safe crossing interval.
As in our previous study (Wu et al., 2009), we applied a maximum-likelihood stimulus procedure (MLP) (Grassi and Soranzo, 2009) as an evaluation methodology to obtain the minimal threshold of gap selection. Each pedestrian crossed the street 20 times, either from point A–B or from point B–A as seen in Figure 5. Each time they either crossed the street in a target gap or in a non-target gap. Based on the specified target gap duration and the pedestrian crossing outcome, MLP found a minimal gap duration that says this participant chose to cross the street 75% of the time.
Participants were instructed to find a safe and comfortable gap in traffic to cross the street without running and without wasting any chances to cross, just as they would in the real world. Participants were instructed to wait until the first car passed before attempting to cross. In addition, they were asked to assume that vehicles would not yield in response to their crossing. We desired participants to assume responsibility for their safety through this assumption even though virtual vehicles in the environment would yield to pedestrians in practice. Participants were encouraged to finish after initiating a crossing, even if they believed that their decision was unsafe. Based in pilot testing, each subject completed 20 trial crossings, which was enough to insure convergence of the maximum likelihood procedure.
The outcome in a trial was deemed a “go” if the pedestrian started crossing during the target gap for a given stream of traffic. A “no-go” outcome occurred if the target gap passed without the pedestrian initiating a cross. Under “go” conditions a safe crossing indicates the subject successfully crossed before the target gap passed, otherwise it fell into the unsafe crossing category. An invalid outcome occurred if the pedestrian started crossing during a gap preceding the target gap, in which case that stream was invalidated and repeated in later trials.
For all go outcomes, the system recorded the time points when a pedestrian started crossing and finished crossing the street. With this system we recorded two other dependent variables in addition to the gap threshold. One was the curb delay, which was the time elapsed from the beginning of the target gap to the start of crossing behavior, meaning how long the pedestrian delayed on the curb before they actually initiated their crossing. The other was the crossing time, which was the elapsed time between the start of a crossing and the finish of that crossing. More details of the general design of street crossing are in Wu et al. (2009).
5.2. Hypotheses
The independent variable for this experiment was scotoma size, which generated three visual conditions: normal vision (zero scotoma), which provided base line results; 10° of visual angle of absolute scotoma with 20° of visual angle of relative scotoma; and 20° of visual angle of absolute scotoma with 40° of visual angle of relative scotoma. Each subject was randomly assigned to one of these three viewing conditions.
Our size decision was based on the research of Sunness et al. (2007). They showed a progression of increasing scotoma size at different stages of macular degeneration, from <10° of visual angle near the onset of the disease, to up to 20° of visual angle for late stage. We selected a small and large size of absolute scotoma and doubled the size of relative scotoma to compare the effect.
In pilot studies conducted with full screen visual acuity variations, we found that varying acuity alone did not significantly change gap estimation performance, possibly because it is easy to estimate moving blobs in a static background. This finding held even at severe degradations in acuity of 20/1,000. We did not, therefore, plan to vary the acuity in this study but set the relative scotoma at a fixed value of 20/500 for both simulated conditions.
By simulating a controllable scotoma coupled with low visual acuity, we were able to simulate the main characteristics foveal vision loss characteristic of macular degeneration. We hypothesized that simulated macular degeneration would cause subjects to select a longer target gap to cross, experience a longer curb delay, and experience a longer gap crossing time in comparison to subjects who do not experience the simulated impairment. There is some suggestion in the literature—e.g., Simpson et al. (2003); Holland and Hill (2007)—of males making riskier road crossing decisions than females, and we hypothesized that this will be the case regardless of visual condition.
5.3. Participants
A pilot study revealed that some participants experienced difficulties with the eye-tracking solution. While most participants could be calibrated in approximately 10 min, some could not be accurately calibrated at all with the eye-tracker, due to imperfect fit of the HMD and eye-tracker on the head. Therefore, we conducted pre-screening sessions prior to the experiment to train subjects to use the eye-tracking HMD. If a participant's pupil still evaded detection by the eye-tracker, then they were eliminated from the experiment.
We recruited 41 subjects in total. Three subjects were excluded because of inability to calibrate the eye-tracker. Another two subjects were excluded due to motion sickness during the experiment. Our final results are derived from the remaining 36 subjects. The subject group included 18 males and 18 females aged from 18 to 31 years old. All subjects were normally sighted without eyeglasses, although subjects who were corrected to normal with contact lenses were allowed.
Subjects were randomly assigned to one of the visual conditions of no simulated scotoma, a 10° of visual angle of absolute scotoma with 20° of visual angle of relative scotoma (10/20), or a 20° of visual angle of absolute scotoma with 40° of visual angle of relative scotoma (20/40). A between groups design was chosen to minimize overall time in the HMD and to avoid the possibility of carry-over effects from one condition to another.
5.4. Apparatus
The experiment was conducted in a 29 × 23 ft. room. We used the Vizard (Worldviz, Santa Barbara, CA) platform to develop the virtual roundabout environment. Our system includes a WorldViz rendering computer, Precision Position Tracker server with 4 cameras, an audio rendering computer with a pair of Klipsch S4 earbuds. The HMD and eye tracker were described previously in section 4.2.
An InterSense IS-900 precision motion tracker is used to update the participant rotational movements with six degrees of freedom. Position is updated using 4 optical tracking cameras working in coordination with 2 LED lights at 60 Hz. For the ViewPoint EyeTracker, the expected difference in degrees of visual angle between true eye position and mean computed eye position is approximately 0.25°–1.0° visual arc. The smallest change in eye position that can be measured is approximately 0.15° visual arc.
As mentioned previously, in order to preserve proper calibration and prevent slipping of the HMD, we required subjects to don a silicone-swimming cap before using the HMD and we required subjects to wear a belt to secure the HMD's tethered cable. In addition, throughout the experiment a helper, carrying a backpack which held the HMD machine, followed the subjects to ensure that the cable would not be pulled or pushed.
5.5. Procedure
Participants started by completing a written consent form and questionnaire asking about prior experience with video games and virtual reality. The experimental protocols were approved the Institutional Review Board at our Univerity. In particular, subjects were assured that they could take a break or quit at any point if they desired or if they began to feel sick. Next, participants were shown a Google map depiction of the real world roundabout from which the virtual model was derived. The direction of traffic flow was depicted. The experimental task (safe road crossing in the face of traffic) was explained to the participant and they were informed that their vision would be obstructed if they were in one of the visual impairment conditions. Subjects were told that they would be crossing the street 20 times with traffic over the course of the experiment. Subjects then donned ear buds, swim cap, HMD, and belt. The eye cameras were calibrated in a process taking between 5 and 10 min. The HMD was adjusted to be secure before calibration and subjects were asked not to touch the HMD unless they wanted to take a break or quit the experiment, as the calibration procedure would need to be repeated. Subjects were then introduced to the virtual environment with full vision and crossed the street once without traffic to introduce them to locomotion in the HMD. After each street crossing, a quick recalibration of the eyetracker as described in section 4.2 was performed. At this point, subjects were introduced to their specific visual condition. Subjects were asked to inform the experimenter if the central scotoma was not in line with their gaze, at which time another recalibration was performed. The traffic simulation was started, and the participant began to cross the street in traffic. After 20 crossings, subjects were compensated for their time in the experiment.
5.6. Results
Figure 6 shows the overall gap crossing distributions, grouped by vision condition and gender, for the 36 subjects in their 20 crossings. This diagram illustrates the various conditions defined in section 5.1 for the gaps in traffic: “go and safe” represents the percentage of trials where participants selected a target gap and crossed the street safely; “go but unsafe” represents the percentage of trials in which participants selected an unsafe gap to cross the street; and “no-go” represents the percentage of trials in which participants elected to not cross the street during the presented traffic stream.
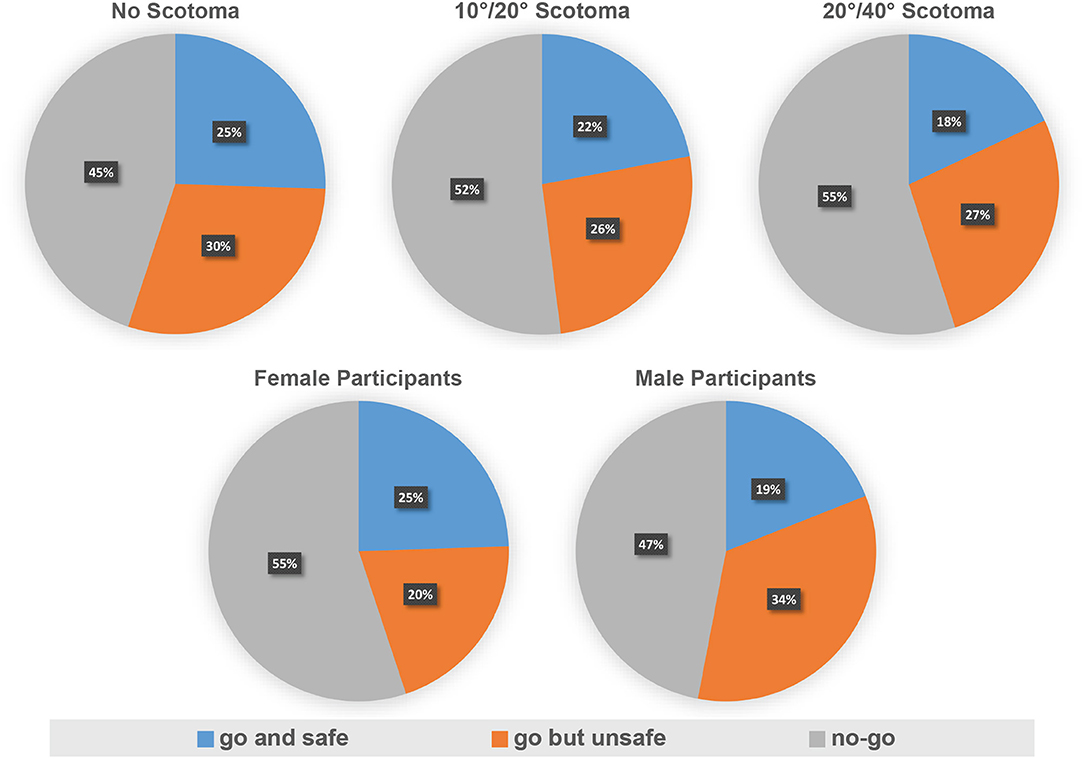
Figure 6. Crossing distribution by group and crossing distribution by gender in experiment.
The first row of Figure 6 displays the data broken out by vision condition. Qualitatively, it demonstrates that a larger size of simulated scotoma results in a lower percentage of safe crossings. In particular, this is indicated by a decrease in the percentage of go and safe crossings, which drops from 25 to 18% between the no scotoma and the 20°/40° scotoma conditions. This result is consistent with the hypothesis that subjects with simulated macular degeneration will have fewer safe crossings. In addition, the percentage of no-go trials increased from 45 to 55%, indicating that participants with larger sizes of simulated scotomas missed more chances to cross the street. However, the percentage of unsafe crossings did not increase. These results suggest that participants became more conservative with their risk taking behavior as the size of scotoma increased. In the second row of the figure, which displays the data as grouped by gender, we observe that male subjects had fewer “no-go” trials and that they perform fewer safe crossings, indicating that male subjects have a greater propensity for risk taking than their female counterparts.
There are two between-subjects independent variables: gender (two levels: male, female) and vision condition (three levels: no scotoma, 10°/20° of absolute/relative scotoma, 20°/40° of absolute/relative scotoma). Table 1 lists the complete breakdown of mean and standard error values for these three dependent variables in the experiment: gap threshold (the discrimination threshold of crossing gaps), curb delay (the time elapsed from the beginning of the designated gap to the start of actual street crossing), and crossing time (the time elapsed from the start of street crossing to the finish of street crossing). The no scotoma participants had the smallest gap threshold (4.204 s) with smallest curb delay (1.661 s); and participants with 20°/40° of absolute/relative scotoma had largest gap threshold (6.177 s) with largest curb delay (2.639 s).
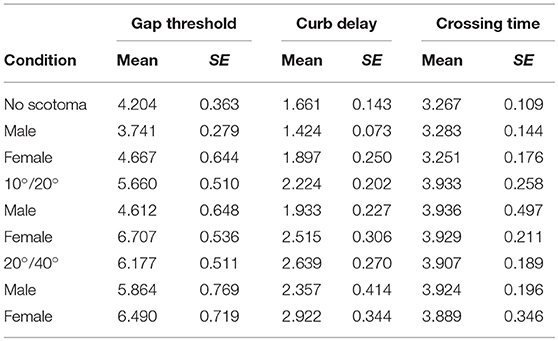
Table 1. Key measures in seconds.
Figure 7 shows the mean gap thresholds, mean curb delays, and mean crossing times broken out by both vision condition and gender. We analyzed our results using a two-way between-subjects analysis of variance (ANOVA). For the gap threshold, there are main effects of vision condition, F(2, 30) = 5.4415, p = 0.0096, and of gender, F(1, 30) = 5.7624, p = 0.023. A post-hoc Tukey test showed that the no scotoma, 10°/20° scotoma, and 20°/40° scotoma all differed significantly. Also males had significantly shorter gap thresholds than females. Likewise, for curb delay, ANOVA there were main effects of both vision condition, F(2, 30) = 5.6694, p = 0.0082, and gender, F(1, 30) = 5.1099, p = 0.031. A post-hoc Tukey test showed that the no scotoma condition had a significantly shorter curb delay than the 20°/40° scotoma condition; the 10°/20° scotoma condition was not significantly different from either, but lay somewhere in the middle. Crossing time was not statistically different between groups.
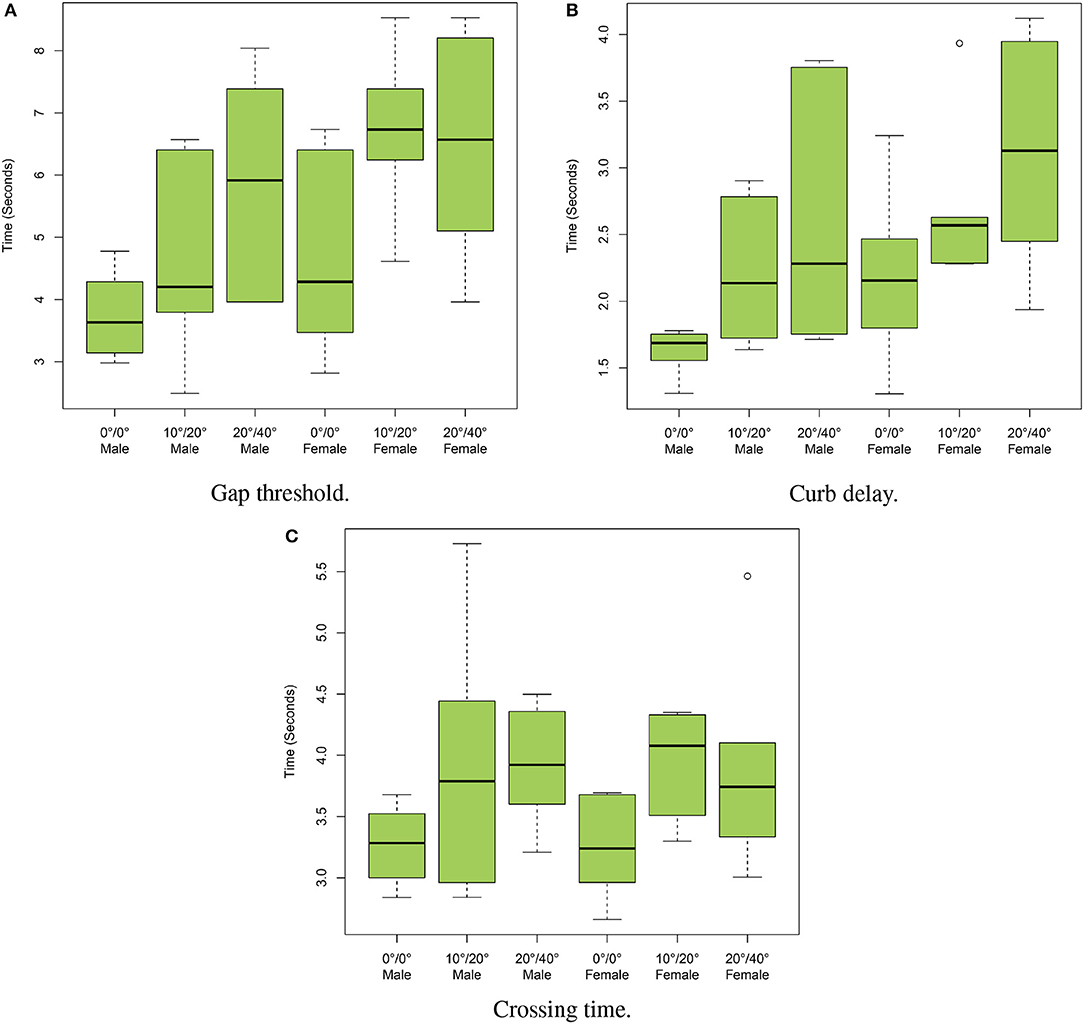
Figure 7. Medians and quartiles of the various measures broken out by vision condition and gender. (A) Gap threshold, (B) curb delay, and (C) crossing time.
There is a linear correlation between these dependent variables. Pearson's coefficient of correlation between gap threshold and curb delay is 0.888 (t = 11.259, df = 34, p < 0.001). Likewise, the Pearson's coefficient of correlation between gap threshold and crossing time is 0.533 (t = 3.6763, df = 34, p < 0.001); and the coefficient of correlation between curb delay and crossing time is 0.595 (t = 4.3208, df = 34, p < 0.001). Thus, high gap threshold tends to be paired with relatively high curb delay and high crossing time.
In summary, we found statistically significant differences between vision conditions. A larger size scotoma resulted in a longer gap threshold, and a longer curb delay. However, the most dramatic differences were typically found between the presence and the absence of a scotoma. These findings are consistent with our hypotheses that subjects with simulated macular degeneration will select a longer gap to cross and experience a longer curb delay. We also found gender differences in some measures. Male subjects tended to take more risk, which was demonstrated by the selection of shorter gaps and shorter waiting times prior to crossing. This finding is consistent with our second hypothesis. However, the males in our sample group were also more familiar with video games as self-reported in their responses to our questionnaire, with 10 of 18 subjects reporting regularly playing video games an average of 7 h per week (SD = 5.2 h); in contrast, only one of 18 females reported playing video games regularly, an average of 7 h per week. It is possible that increased familiarity with the virtual environment leads to increased risk-taking, although Spearman's rank-order correlation did not achieve significance.
6. Discussion
We simulated central visual field loss and assessed the affect of this loss on normally sighted individuals making road crossing decisions at a roundabout. We found support for our hypothesis that this loss would increase the gap threshold and result in increased curb delay, but did not find a statistically significant difference in crossing times for subjects once they had selected a gap to cross. Compared to no scotoma, each level of increased scotoma size that we implemented resulted in a longer gap threshold selection, but our only significant difference in the curb delay was between the no scotoma and the largest scotoma size (20/40). Regarding crossing times, it may be that once subjects decide to cross the street, their walking pace is not strongly subject to visual feedback and thus visual field impairment may result in only incidental increases. We also found support for our hypothesis that there would be gender differences in the data. Male subjects tended to take more risk, which was demonstrated by the selection of shorter gaps and shorter waiting times prior to crossing. This gender difference was not due to faster crossing times by males, since both genders crossed in about 3.9 s on average.
Hassan et al. (2002) studied macular degeneration patients and found that mobility performance, such as walking speed, decreased as the size of a binocular central scotoma increased. In our study, normal-sighted participants exposed to central vision loss selected a longer gap threshold with increasing scotoma size. Our gap thresholds and crossing times are in accord with those of our prior work (Wu et al., 2009). O'Neal et al. (2017) used a linear intersection and large screen immersive display environment and found gap thresholds generally consistent with ours but crossing times that were faster, possibly an artifact in our work of subjects wearing an HMD. It is potentially interesting to note that their simulation involved a wide, naturalistic field of view in a linear intersection, and ours involved a restricted field of view in a roundabout, and yet the gaps chosen by their adult population (approximately 4.45 s) and our no scotoma adult population (4.2 s) were close. It is always important to examine field of view as an ecological factor in assessing simulation validity when using HMDs, and the NVIS SX60 has limited field of view compared to commodity level devices available today, but it may not be an important factor in this area of investigation. Our work showing that males make riskier choices is consistent with a large body of literature that indicates male gender as a risk factor in pedestrian injury (e.g., Schiff and Oldak, 1990; Assailly, 1997; Rosenbloom et al., 2004; Barton and Schwebel, 2007).
Our simulation allowed us to explore the effect central vision loss on these gap thresholds. The simulation is configurable to allow a variety of visual impairments to be implemented. We chose extreme central vision loss as a test case since with moderate blur locomotion and road crossing seem to be unaffected (although such things as reading would be severely affected), as evidenced by Figure 4. Future work will model foveal deficits and maculopathies in more detail, with the goal of examining mechanisms of disease progression through behavior. Some limitations in the present simulation that may hinder this work are that it is difficult to characterize the accuracy of eye-tracker given the two-step calibration procedure used and the slippage of the HMD on the head. Our assessment criterion in this study was behavioral, and did not require more accurate assessment of the eye tracking system's limits (c.f., Geringswald et al., 2013), but that may not be true of future work.
Our simulation incorporated spatialized audio as a component of the experience. It was not tested as a factor in any of these experiments, but sound is known to be a cue for making crossing decisions in the real world. Geruschat et al. (2011) found that pedestrians with full sight were more sensitive when their hearing was occluded, whereas in the low vision groups hearing occlusion did not affect sensitivity. Hassan (2012) was also noted that the visually impaired participants traffic gap detection performance was unaffected by hearing occlusion. There is significant interest in how audio cues are used by the visually impaired, particularly with the increase of quieter hybrid and electric vehicles on the street (Emerson et al., 2011), and such investigation is a topic of future research.
The use of virtual reality in this work was critical. Virtual reality provides an environment in which a dangerous scenario—traffic crossing with visual impairment—can be investigated in a controlled and rigorous manner. Testing subjects with true visual impairment in true traffic situations is difficult, and some from of proxy is often used. For example, Geruschat et al. (2011) used subjects with actual macular degeneration or peripheral vision loss at a live intersection with real traffic, but had them press triggers to indicate when they would cross rather than actually cross. Our results are nonetheless consistent with theirs, with ours having considerably easier recruitment, ease of execution, no real danger, and containing actual locomotion. This suggests that our traffic crossing scenario allows us to design and conduct effective research in perception and action in dynamic situations. The simulation of visual impairment for normally sighted individuals can provide an important educational tool to investigate a significant social problem. The result of this research could deliver important insight in how to improve structures for the safety of those with visual impairments. In particular, the first-person experience provided by our simulation could provide important insights for safe design in engineering intersections and more.
Ethics Statement
This study was carried out with the approval of the Institutional Review Board of Vanderbilt University. All subjects completed a written informed consent document prior to participation in the study and were verbally assured that they could pause or withdraw at any point during the experiment. Subjects were compensated for their participation in the experiment in the amount of $10.
Author Contributions
HW, DA, and BB conceived the idea to simulate macular degeneration in a virtual environment and test it in a roundabout environment. HW developed and implemented the virtual environment and necessary software. HW, DA, and BB participated in the experimental design, pilot testing and development of experimental measures. HW primarily carried out the experimental sessions. All authors participated in data analysis and in writing the manuscript.
Conflict of Interest Statement
The authors declare that the research was conducted in the absence of any commercial or financial relationships that could be construed as a potential conflict of interest.
Acknowledgments
This material is based upon work supported by the National Eye Institute, National Institutes of Health, under R01 EY12894-04, and by the National Science Foundation under grants 0821640 and 1526448. Any opinions, findings, and conclusions or recommendations expressed in this material are those of the authors and do not necessarily reflect the views of the sponsors.
References
Ai, Z., Gupta, B. K., Rasmussen, M., Lin, Y. J., Dech, F., Panko, W., et al. (2000). “Simulation of eye diseases in a virtual environment,” in Proceedings of the 33rd Annual Hawaii International Conference on System Sciences (Washington, DC: IEEE Computer Society), 5.
Ashmead, D., Guth, D., Wall, R., Long, R., and Ponchillia, P. (2005). Street crossing by sighted and blind pedestrians at a modern roundabout. J. Transport. Eng. 131, 812–821. doi: 10.1061/(ASCE)0733-947X(2005)131:11(812)
Assailly, J. (1997). Characterization and prevention of child pedestrian accidents: an overview. J. Appl. Dev. Psychol. 18, 257–262. doi: 10.1016/S0193-3973(97)90039-3
Ates, H. C., Fiannaca, A., and Folmer, E. (2015). “Immersive simulation of visual impairments using a wearable see-through display,” in Proceedings of the Ninth International Conference on Tangible, Embedded, and Embodied Interaction (Stanford, CA: ACM), 225–228.
Banks, D., and McCrindle, R. J. (2008). “Visual eye disease simulator.” in Proceedings 7th ICDVRAT With ArtAbilitation, (Maia).
Barton, B. K., and Schwebel, D. C. (2007). The roles of age, gender, inhibitory control, and parental supervision in children's pedestrian safety. J. Pediatr. Psychol. 32, 517–526. doi: 10.1093/jpepsy/jsm014
Begault, D. R. (1994). 3-D Sound for Virtual Reality and Multimedia. San Diego, CA: Academic Press Professional, Inc.,
Bernhard, M., Grosse, K., and Wimmer, M. (2008). Bimodal task-facilitation in a virtual traffic scenario through spatialized sound rendering. ACM Trans. Appl. Percept. 8, 24:1–24:22. doi: 10.1145/2043603.2043606
Cheung, S. H., and Legge, G. R. (2005). Functional and cortical adaptations to central vision loss. Vis. Neurosci. 22, 187–201. doi: 10.1017/S0952523805222071
Clancy, T. A., Rucklidge, J. J., and Owen, D. H. (2006). Road-crossing safety in virtual reality: a comparison of adolescents with and without adhd. J. Clin. Child Adolesc. Psychol. 35, 203–215. doi: 10.1207/s15374424jccp3502_4
Cornelissen, F. W., Bruin, K. J., and Kooijman, A. C. (2005). The influence of artificial scotomas on eye movements during visual search. Optom. Vis. Sci. 82, 27–35. doi: 10.1097/01.OPX.0000150250.14720.C5
Emerson, R. W., Naghshineh, K., Hapeman, J., and Wiener, W. (2011). A pilot study of pedestrians with visual impairments detecting traffic gaps and surges containing hybrid vehicles. Transport. Res. F Traffic Psychol. Behav. 14, 117–127. doi: 10.1016/j.trf.2010.11.007
Ergun, E., Maar, N., Radner, W., Barbazetto, I., Schmidt-Erfurth, U., and Stur, M. (2003). Scotoma size and reading speed in patients with subfoveal occult choroidal neovascularization in age-related macular degeneration. Ophthalmology 110, 65–69. doi: 10.1016/S0161-6420(02)01566-X
Gardner, W. G., and Martin, K. D. (1995). Hrtf measurements of a kemar. Optom. Vis. Sci. 97, 3907–3908.
Geringswald, F., Baumgartner, F., and Pollmann, S. (2012). Simulated loss of foveal vision eliminates visual search advantage in repeated displays. Front. Hum. Neurosci. 6:134. doi: 10.3389/fnhum.2012.00134
Geringswald, F., Baumgartner, F. J., and Pollmann, S. (2013). A behavioral task for the validation of a gaze-contingent simulated scotoma. Behav. Res. Methods 45, 1313–1321. doi: 10.3758/s13428-013-0321-6
Geruschat, D., Fujiwara, K., and Wall Emerson, R. (2011). Traffic gap detection for pedestrians with low vision. Optom. Vis. Sci. 88, 208–216. doi: 10.1097/OPX.0b013e3182045988
Geruschat, D., Fujiwara, K., and Wall-Emerson, R. S. (2006). Gaze behavior of the visually impaired during street crossing. Optom. Vis. Sci. 83, 550–558. doi: 10.1097/01.opx.0000232219.23362.a6
Grassi, M., and Soranzo, A. (2009). Mlp: a matlab toolbox for rapid and reliable auditory threshold estimation. Behav. Res. Methods 41, 21–28. doi: 10.3758/BRM.41.1.20
Grechkin, T. Y., Chihak, B. J., Cremer, J. F., Kearney, J. K., and Plumert, J. M. (2013). Perceiving and acting on complex affordances: How children and adults bicycle across two lanes of opposing traffic. J. Exp. Psychol. 29, 23–36. doi: 10.1037/a0029716
Guez, J., Le Gargasson, J., Rigaudiere, F., and O Regan, J. (1993). Is there a systematic location for the pseudo-fovea in patients with central scotoma? Vis. Res. 33, 1271–1279.
Guth, D., Ashmead, D., Long, R., Wall, R., and Ponchillia, P. (2005). Blind and sighted pedestrians' judgments of gaps in traffic at roundabouts. Hum. Factors 47, 314–331. doi: 10.1518/0018720054679533
Hassan, S. (2012). Are normally sighted, visually impaired, and blind pedestrians accurate and reliable at making street crossing decisions? Invest. Ophthalmol. Vis. Sci. 53, 2593–2600. doi: 10.1167/iovs.11-9340
Hassan, S., Lovie-kitchin, J., and Woods, R. (2002). Vision and mobility performance of subjects with age-related macular degeneration. Optom. Vis. Sci. 79, 697–707. doi: 10.1097/00006324-200211000-00007
Hassan, S., and Snyder, B. (2012). Street-crossing decision-making: a comparison between patients with age-related macular degeneration and normal vision. Invest. Ophthalmol. Vis. Sci. 53, 6137–6144. doi: 10.1167/iovs.12-10023
Holland, C., and Hill, R. (2007). The effect of age, gender and driver status on pedestrians intentions to cross the road in risky situations. Accid. Anal. Prev. 39, 224–237. doi: 10.1016/j.aap.2006.07.003
Jin, B., Ai, Z., and Rasmussen, M. (2005). “Simulation of eye disease in virtual reality,” in Proceedings of the 27th Annual International Conference of the IEEE Engineering in Medicine and Biology Society (Shanghai: IEEE Computer Society), 5128–5131.
Kapralos, B., Jenkin, M. R., and Milios, E. (2008). Virtual audio systems. Presence 17, 529–549. doi: 10.1162/pres.17.6.527
Lewis, J., Shires, L., and Brown, D. (2012). “Development of a visual impairment simulator using the microsoft xna framework,” in Proceedings of the the 9th International Conference on Disability, Virtual Reality and Associated Technologies (Laval), 10–12.
McClure, M., Hart, P., Jackson, A., Stevenson, M., and Chakravarthy, U. (2000). Macular degeneration: do conventional measurements of impaired visual function equate with visual disability? Br. J. Ophthalmol. 84, 244–250. doi: 10.1136/bjo.84.3.244
Meir, A., Oron-Gilad, T., and Parmet, Y. (2015). Are child-pedestrians able to identify hazardous traffic situations? measuring their abilities in a virtual reality environment. Safety Sci. 80, 33–40. doi: 10.1016/j.ssci.2015.07.007
Morrongiello, B. A., Corbett, M., Milanovic, M., Pyne, S., and Vierich, R. (2015). Innovations in using virtual reality to study how children cross streets in traffic: evidence for evasive action skills. Inj. Prev. 21, 266–270. doi: 10.1136/injuryprev-2014-041357
O'Neal, E. E., Jiang, Y., Franzen, L. J., Rahimian, P., Yon, J. P., Kearney, J. K., et al. (2017). Changes in perception–action tuning over long time scales: How children and adults perceive and act on dynamic affordances when crossing roads. J. Exp. Psychol. Hum. Percept. Perform. 44, 18–26. doi: 10.1037/xhp0000378
Pamplona, V. F., Passos, E. B., Zizka, J., Oliveira, M. M., Lawson, E., Clua, E., et al. (2011). “Catra: interactive measuring and modeling of cataracts,” in ACM SIGGRAPH 2011 Papers (Vancouver, BC: ACM), 47:1–47:8.
Plumert, J. M., Kearney, J. K., and Cremer, J. F. (2004). Children perception of gap affordances: Bicycling across traffic-filled intersections in an immersive virtual environment. Child Dev. 75, 243–1253. doi: 10.1111/j.1467-8624.2004.00736.x
Plumert, J. M., Kearney, J. K., and Cremer, J. F. (2007). Childrens road crossing: a window into perceptual motor development. Curr. Dir. Psychol. Sci. 16, 255–258. doi: 10.1111/j.1467-8721.2007.00515.x
Rosenbloom, T., Nemrodov, D., and Barkan, H. (2004). For heavens sake follow the rules: pedestrians behavior in an ultra-orthodox and a non-orthodox city. Trans. Res. F Traffic Psychol. Behav. 7, 395–404. doi: 10.1016/j.trf.2004.10.004
Schiff, W., and Oldak, R. (1990). Accuracy of judging time to arrival: effects of modality, trajectory, and gender. J. Exp. Psychol. 16, 303–316.
Seward, A. E., Ashmead, D. H., and Bodenheimer, B. (2007). Using virtual environments to assess time-to-contact judgments from pedestrian viewpoints. ACM Trans. Appl. Percept. 4, 1–19. doi: 10.1145/1278387.1278392
Simpson, G., Johnston, L., and Richardson, M. (2003). An investigation of road crossing in a virtual environment. Accid. Anal. Prevent. 35, 787–796. doi: 10.1016/S0001-4575(02)00081-7
Sunness, J., Margalit, E., Srikumaran, D., Applegate, C., Tian, Y., Perry, D., et al. (2007). The long-term natural history of geographic atrophy from age-related macular degeneration: Enlargement of atrophy and implications for interventional clinical trials. Ophthalmology 114, 271–277. doi: 10.1016/j.ophtha.2006.09.016
Väyrynen, J., Colley, A., and Häkkilä, J. (2016). “Head mounted display design tool for simulating visual disabilities,” in Proceedings of the 15th International Conference on Mobile and Ubiquitous Multimedia (Rovaniemi: ACM), 69–73.
Volkmann, F. C. (1986). Human visual suppression. Vis. Res. 26, 1401–1416. doi: 10.1016/0042-6989(86)90164-1
Werfel, F., Wiche, R., Feitsch, J., and Geiger, C. (2016). “Empathizing audiovisual sense impairments: interactive real-time illustration of diminished sense perception,” in Proceedings of the 7th Augmented Human International Conference 2016 (Geneva: ACM) 15:1–15:8.
Wong, W. L., Su, X., Li, X., Cheung, C. M. G., Klein, R., Cheng, C.-Y., et al. (2014). Global prevalence of age-related macular degeneration and disease burden projection for 2020 and 2040: a systematic review and meta-analysis. Lancet Glob. Health 2, 106–116. doi: 10.1016/S2214-109X(13)70145-1
Keywords: macular degeneration, immersive traffic simulation, visual deficit simulation, gap affordances, perception, street crossing, roundabout
Citation: Wu H, Ashmead DH, Adams H and Bodenheimer B (2018) Using Virtual Reality to Assess the Street Crossing Behavior of Pedestrians With Simulated Macular Degeneration at a Roundabout. Front. ICT 5:27. doi: 10.3389/fict.2018.00027
Received: 02 January 2018; Accepted: 13 September 2018;
Published: 16 October 2018.
Edited by:
Joseph L. Gabbard, Virginia Tech, United StatesReviewed by:
Bruno Herbelin, École Polytechnique Fédérale de Lausanne, SwitzerlandDorian Gorgan, Technical University of Cluj-Napoca, Romania
Copyright © 2018 Wu, Ashmead, Adams and Bodenheimer. This is an open-access article distributed under the terms of the Creative Commons Attribution License (CC BY). The use, distribution or reproduction in other forums is permitted, provided the original author(s) and the copyright owner(s) are credited and that the original publication in this journal is cited, in accordance with accepted academic practice. No use, distribution or reproduction is permitted which does not comply with these terms.
*Correspondence: Bobby Bodenheimer, cm9iZXJ0LmUuYm9kZW5oZWltZXJAdmFuZGVyYmlsdC5lZHU=