 Mathis Fleury
 Christian Barillot
 Marsel Mano
 Elise Bannier
 Pierre Maurel
- 1INRIA, CNRS, Inserm, IRISA UMR 6074, VISAGES ERL U-1228, Univ Rennes, Rennes, France
- 2Department of Radiology, INRIA, CNRS, Inserm, IRISA UMR 6074, VISAGES ERL U-1228, Univ Rennes, University Hospital of Rennnes, Rennes, France
The coupling of Electroencephalography (EEG) and functional magnetic resonance imaging (fMRI) enables the measure of brain activity at high spatial and temporal resolution. The localization of EEG sources depends on several parameters including the knowledge of the position of the electrodes on the scalp. An accurate knowledge about this information is important for source reconstruction. Currently, when acquiring EEG and fMRI together, the position of the electrodes is generally estimated according to fiducial points by using a template. In the context of simultaneous EEG/fMRI acquisition, a natural idea is to use magnetic resonance (MR) images to localize EEG electrodes. However, most MR compatible electrodes are built to be almost invisible on MR Images. Taking advantage of a recently proposed Ultra short Echo Time (UTE) sequence, we introduce a fully automatic method to detect and label those electrodes in MR images. Our method was tested on 8 subjects wearing a 64-channel EEG cap. This automated method showed an average detection accuracy of 94% and the average position error was 3.1 mm. These results suggest that the proposed method has potential for determining the position of the electrodes during simultaneous EEG/fMRI acquisition with a very light cost procedure.
1. Introduction
Electroencephalography (EEG) measures the electrical potential generated by the neuronal activity over the scalp with electrodes placed on the surface of the scalp (Petsche et al., 1984; Murakami and Okada, 2006; Buzsáki et al., 2012). Usually electrodes are placed thanks to a flexible cap and positioned according to anatomical points enabling optimal covering of brain regions regardless of the size and shape of the subject's head. Currently, when acquiring EEG and functional magnetic resonance imaging (fMRI) simultaneously, the position of the electrodes is calculated according to fiducial points (anatomical points of the skull) such as inion, nasion and vertex (Strobel et al., 2008). The localization of EEG sources in the brain depends on several parameters including the position of the electrodes on the scalp. A precise knowledge of these positions is important because inaccurate information on EEG electrodes coordinates may affect EEG inverse solution (Khosla et al., 1999). This knowledge is even more crucial in the case of simultaneous EEG and fMRI study, when the sessions are conducted repeatedly over a long period of time. Approximations in the positioning of the electrodes are then made in each session and will give rise to important inaccuracies in the measured evoked potential (Wood and Allison, 1981). As a matter of fact, magnetic resonance (MR) images and EEG need to be registered to be able to compare activations given by fMRI and by EEG. This simultaneous acquisition allows the concordance of two different kind of information, a high temporal resolution in the order of a millisecond with EEG, and a high spatial resolution in the order of millimeter with MRI.
In this article an automated and efficient method to determine EEG electrodes positions based on a specific MR sequence is presented and evaluated. Compared to other existing approaches, the proposed method does not need additional hardware (like 3D electromagnetic digitizer devices Adjamian et al., 2004; Whalen et al., 2008, artificial electrode markers Sijbers et al., 2000, or laser scanner Koessler et al., 2011; Bardouille et al., 2012), which might be uncomfortable for the subject if he must stay still during acquisition (Le et al., 1998) and add time to the preparation of the patient. Semi-automated electrodes localization methods exist (de Munck et al., 2012; Butler et al., 2017), which require a manual fiducial landmark identification to guide co-registration without any markers but these approach relies on the efficiency of the accuracy of the operator. Another automated method was recently developed and shown great results with an anatomical MR image (Marino et al., 2016), however, this method is only working with a high density cap also compatible with MRI: the GES 300 from Geodesic EEG Systems. Since this kind of cap includes plastic around electrodes and contain hydrogen protons, it can be visible on T1-w image. For seek of genericity (i.e., able to operate on all types of caps when artifacts do not appear on T1-w images), we propose to make use of a MRI sequence with radial k-space sampling named UTE for Ultra-short Echo-Time. It allows to visualize the tissues with a very short T2 and T2*, such as cortical bone, tendons and ligaments (Holmes and Bydder, 2005; Keereman et al., 2010). This sequence is all the more interesting in our context because it enables the visualization of the MR compatible electrodes (Springer et al., 2008; Butler et al., 2017) on the scalp with a capability to be performed rapidly enough to not overwhelm the whole MRI protocol.
We propose a fully automated method, which provides reliable and reproducible results for the detection and labeling of a MR compatible EEG cap into the MR space.
2. Methods
The retrieval of the electrodes consisted in two parts; firstly, we provided a mask that includes the volume where the electrodes are located; secondly, we performed the electrode detection inside this volume of interest (VOI). Figure 1 presents a flowchart of the method's main steps. We hypothesized that electrodes would appear as spheres inside the UTE volume and it allows us to perform a Hough transform in a consistent manner across subjects.
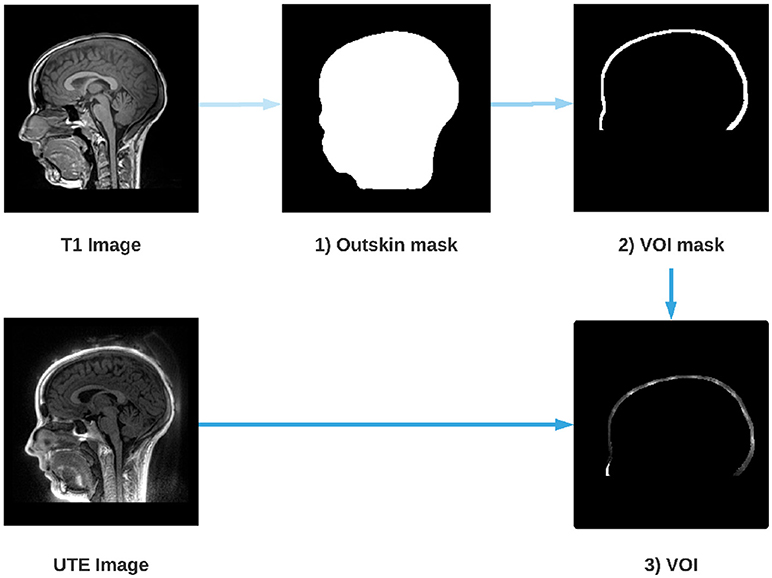
Figure 1. Steps for the extraction of the Volume Of Interest (VOI). An outskin mask is performed from the T1 image (1), then a dilation and a removal of the mask is performed (2) in order to obtain the layer where the electrodes are located. Finally, the UTE image is masked by the dilated mask (2) which gives us the VOI (3).
2.1. Scalp Segmentation
Several reliable scalp segmentation methods exist for T1-w imaging. Because UTE images are noisier, we performed the scalp segmentation on the T1-w images and co-registered the UTE images with the T1-w images to apply the mask. The T1-w is first registered on the UTE and the anatomical T1 image is then segmented using FSL, an open-library of analysis tools for MRI and its function BET (Brain Extraction Tool) (Smith, 2002; Popescu et al., 2012). A mask of the scalp is computed from the segmentation. Since electrodes are located around the head of the subject, the scalp mask is dilated toward the periphery in order to isolate this layer. What is outside the dilated mask is subtracted in order to isolate only the layer where the electrodes are located.
2.2. Detection of Electrodes With the Spherical Hough Transform
A 3D Hough transform was used to segment the electrodes inside the VOI. Hough transform is typically used to detect circles or lines in 2-dimensional data sets, but was recently extended to detect spheres in 3-dimensional data sets (Borrmann et al., 2011; Xie et al., 2012). As the shape of an electrode can be assimilated to a sphere, the Spherical Hough Transformation algorithm seemed particularly well adapted to this task. The VOI image is first smoothed using a Gaussian kernel, with a FWHM (Full Width at Half Maximum) adapted to the size of the electrode (10 mm) in order to reduce the noise of the image while saving electrode information. Then, the Hough algorithm is performed and provides a list of n potential electrodes, D = [d1, …, dn]. Figure 2 shows an example of such detections on a 2D slice of the VOI. Because the VOI includes also anatomical structures (nose, ears) and noise (artifacts due to the cap or gel), the number of potentially detected electrodes is substantially higher than the number of “true” electrodes N, in our case 64.
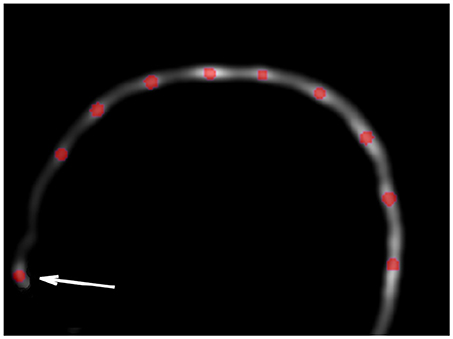
Figure 2. Example of Hough transform detection (red dots) on the VOI smoothed image. Hough transform detects also anatomical parts (arrow), which will be excluded in the filtering steps (cf. section 2.3).
2.3. Selection of Detected Electrodes
The detected electrodes are then filtered to get rid of the potential false detections given by the Hough transform. A 64 electrodes spherical EEG template pj (1 ≤ j ≤ 64) ∈ P was given by the cap manufacturer, indicating theoretical positions of every electrodes relatively to each other. Due to the non-sphericity of the head and the elastic deformations of the cap, these positions are not sufficient enough to give a reliable detection by itself. However, this template will be used to identify outliers in our detections. This spherical template is registered onto the detected electrodes from previous section, through the Iterative Closest Point (ICP) algorithm, a well-known algorithm for registering two-cloud of points (Besl and McKay, 1992; Chen and Medioni, 1992). The algorithm takes a first point cloud which will be kept fixed, while the other one will be spatially transformed in order to best align the reference. The goal is to iteratively minimize a metric error, usually the distance between the two sets of points, by modifying the transformation applied to the source.
In our case, the ICP will find the optimal rotation, translation and scale to fit the data point set D obtained with the Hough transform and the model point P. The algorithm is divided into 2 steps. The first step consists in estimating correspondences between the two set of points. During this step, for each point pj, in the reference set P, the closest point di of the detected points set D is computed. This point will be noted cj and therefore defined as follows:
The second step consists in computing the similarity transform that best aligns every cj to the corresponding pj. The minimization is expressed by:
where R is a rotation matrix (3 × 3), t is a translation vector (3 × 1) and S is a scale matrix (S = s ∗ Id, 3 × 3). The ICP runs until convergence. The registered template P′ can then be written as:
Once the ICP is completed, a two-part filtering phase is implemented. The first one consists in taking the closest point of the Hough transform data set; for each of the N electrodes of the registered model P′, the closest detected point cj is selected. Unselected points are discarded and, after this first filtering step, the number of electrodes is therefore equal to N, the total number of electrodes desired (64 in our case). Figure 3 illustrates the impact of this step.
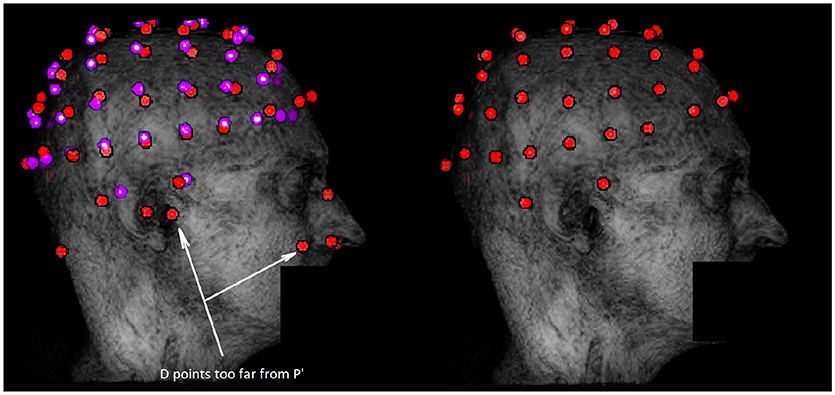
Figure 3. Example of outliers removal in potential electrodes data set D with the ICP algorithm. The dataset D is represented in red on the left along with the registered template P′ in purple. The data set obtained after the first filtering step is in red on the right. Outliers are mostly due to external anatomical parts or noise not taken in account during the segmentation. These outliers are discarded by the filtering step because they are too far from P′.
For the second and final step, all points cj, which are too far from the closest point of the template P′, are removed. A threshold equals to four times the Median Absolute Deviation (MAD) of all distances is applied. For each removed point, a replacement is determined by a new detection from the local maxima on the VOI image around the theoretical position given by the registered template (cf. Figure 4). The new data set D′ is obtained and the N electrodes are then labeled using the template.
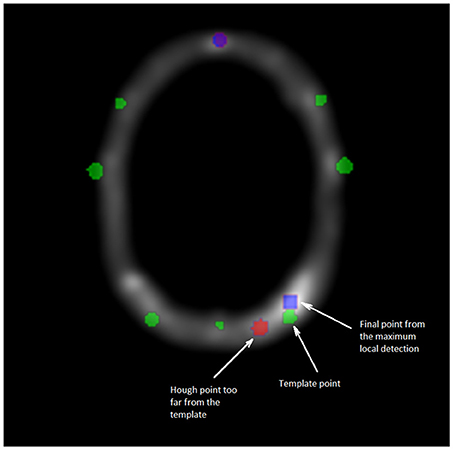
Figure 4. Cross section of the VOI image. Green points are corresponding to the template data set P′, blue points to the maximum local detection and the red one are the outliers from D. The second and final filtering step consists in replacing any point from the Hough data set too far from the registered template P′. The substituted point comes from a detection by local maxima, closest to the template P′.
2.4. Validation of the Method
A manual selection of the electrodes positions was done on the UTE sequence and the quality of our detection was assessed using this manual selection as a ground truth. Instead of selecting the center of each electrode in a 3D image, we choose to use a more convenient procedure for the manual detection. Following Butler et al. (2017), the manual detection was performed by picking up the Cartesian position (xi, yi, zi) of each 64 electrodes for each subject on a pancake view, which is roughly a 2D projection of the scalp (de Munck et al., 2012).
The performance indicators of our automated detection will be the position error (PE) and the positive predictive value (PPV). The position error is the average Euclidean distance between each pair of electrodes (the manually selected one, considered as the ground truth, and the detected one) and the PPV is the percentage of electrodes that have been well detected. We considered than a detected electrodes is well localized when the PE is below 10 mm, which corresponds to the diameter of the electrode (Kavanagk et al., 1978).
We also compared the performance of our method against a more traditional semi-automatic one: five fiducial points were selected manually and the spherical template was adjusted to these points (Towle et al., 1993). This method, although not recent, is still used by many studies (e.g., Ge et al., 2017; Thornton et al., 2017; Jenson et al., 2018).
3. Materials
3.1. Subjects and EEG Equipment
After IRB approval, eight healthy volunteers provided written informed consent to take part in the study. They all underwent a simultaneous EEG/fMRI examination (fully described in Mano et al., 2017). EEG was acquired using two 32-channel MR compatible amplifiers (actiCHamp, Brainproduct, Gilching, Germany) and a cap providing 64 Ag/AgCl electrodes positioned according to the extended 10–20 system and one additional ground electrode. Electrodes are attached to small cups with inner diameter of 10 and 4 mm height, inserted in the cap and filled with gel to minimize the contact impedance. All subject wore a large (circumference between 56 and 58 cm) MR compatible cap from Brainproduct (Gilching, Germany) and a particular attention was given to its positioning according to standard fiducial points.
3.2. UTE Sequences Parameters
All MR data were collected on a 3T Siemens Verio MR scanner (VB17, Siemens Healthineers, Erlangen, Germany). Specifically, the UTE sequence using 3D radial k-space sampling was performed with the following parameters: repetition time (TR) = 3.45 ms, echo time (TE) = 0.07 ms, flip angle (FA) = 14° and voxel size 1.33 × 1.33 × 1.33mm3. A 3D T1 MPRAGE was also performed: TR = 1900 ms, TI = 900 ms, TE = 2.26 ms, FA = 9° and voxel size 1 × 1 × 1 mm3. Two additional UTE sequences with lower sampling resolution were acquired in order to decrease the acquisition time and to investigate the impact on electrodes detection. To reduce the acquisition time, the number of spokes has to decrease; from 60,000 spokes (60 K) for the original, to 30,000 (30 K) and 15,000 (15 K) spokes for the additional ones. The UTE acquisition time goes down from 5 min 35 s to 2 min 47 s and 1 min 23 s. A comparison between these acquisitions is shown in Figure 5.
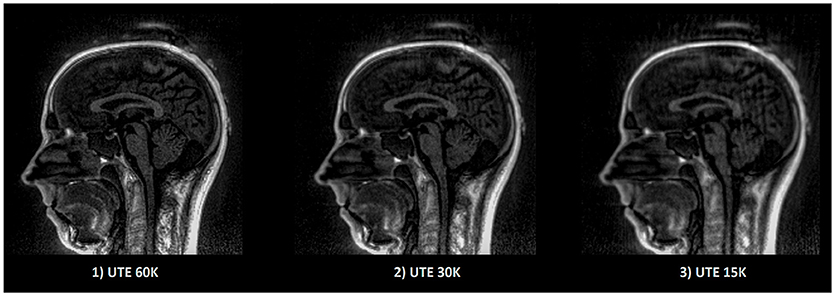
Figure 5. Example of UTE images with different sampling. The image quality as well as the acquisition time decrease linearly according to the sampling. Acquisition time for (1) 5 min 35 s, (2) 2 min 47 s, (3) 1 min 23 s.
4. Results
The creation of an image (VOI) containing only the information related to the electrode allows to remove external noise while protecting the information related to the electrode. This image enables robust detection of the position of the electrodes for all subjects. Furthermore, since our method always detects exactly N (64 in our case) electrodes, the number of false negatives (missed electrodes) will automatically be equal to the number of false positives (wrongly detected electrodes). Table 1 presents the mean position error (PE), the standard deviation of the PE and the maximum PE of our detections for each of the eight subjects. The max PE reflected a high difficulty to detect the electrodes near anatomical parts or in posterior regions where the head apply a pressure on the EEG cap inside the MRI. Our UTE-based electrode detection showed an average PE of 3.1 mm for all subjects. The detection accuracy, represented by the positive predictive value (PPV), is also shown and corresponds to the percentage of electrodes correctly found. The average PPV for all subjects was 94.22%.
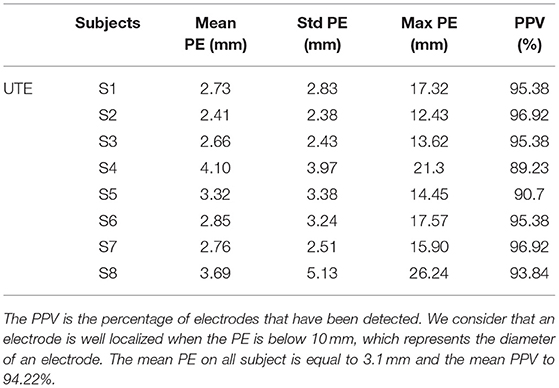
Table 1. Position error (PE) and positive predictive value (PPV) for each subject (S1-S8) for UTE-MR electrodes detection.
We then compared the performance of our method with the semi-automatic one presented in section 2.4 (FID). The PE and PPV were calculated in the same way. The results are shown in Table 2 and Figure 6 shows, for each subject, a comparison of the PEs obtained by the two methods. The mean PE on all subject is equal to 7.7 mm and the mean PPV to 79.41%. Moreover, for every subjects, our method produced smaller PE and better PPV. A paired t-test was computed between the two PEs sets and a significant difference was obtained (p < 0.0001).
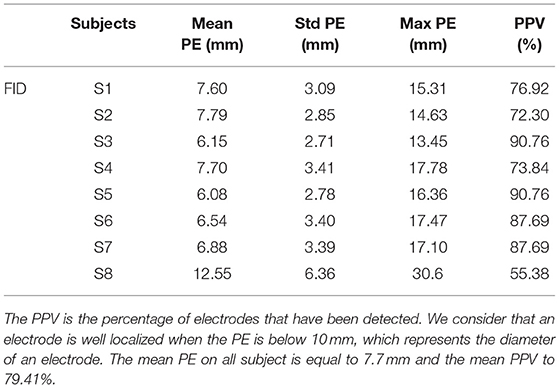
Table 2. Positive predictive value (PPV) and position error (PE) for each subject (S1-S8) for semi-automated electrodes detection based on manual delineation of fiducial landmark (FID).
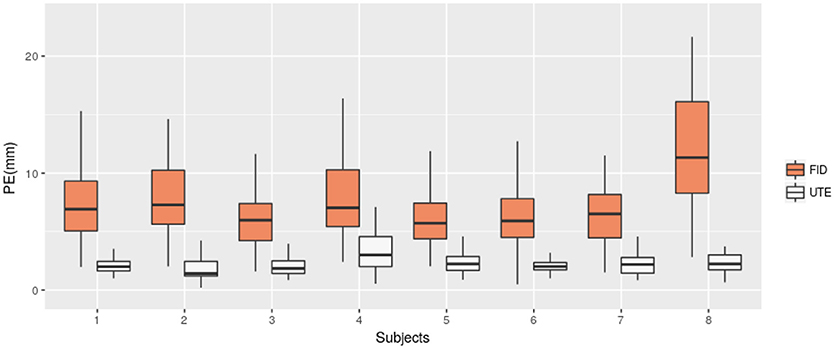
Figure 6. Position Error (PE) for UTE-based electrodes detection method (UTE) and the semi-automatic method based on fiducial points (FID). Box-plots for the eight subjects are shown.
Finally, we investigated the impact of lower sample UTE sequences, which allow reducing the acquisition time, on electrode detection. We tested two others UTE sequence (cf. section 3.2). We applied our detection method on the three different UTE images and compared the quality of the detections. Table 3 reports the mean PE and mean PPV obtained for the three UTE sequences on seven subjects (the first subject did not receive the additional sequences). As expected, the mislocalisation, as well as the position error, increase according to the decrease of the sampling. However, our results are still clearly better than the semi-automatic one for the 30 k sequence (half the acquisition time than the original one) and are slightly better for the fastest sequence.
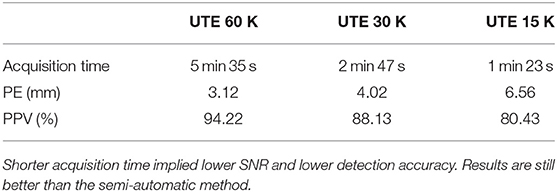
Table 3. Mean of position error (PE) and mean positive predictive value (PPV) for three different sampling resolutions of the UTE sequence.
5. Discussion
We have proposed an automated method for detecting and labeling EEG electrodes based on UTE MR images without using any external sensors. Previous results indicate that a localization technique using electromagnetic digitization technology is time-consuming (Dalal et al., 2014) and others techniques such as 3D digitization can be affected by errors of registration and projection of EEG electrodes on the head model. We have shown that our method offers constant and precise results. Moreover, the proposed method provides the position of the electrodes directly into the MR-space, which is crucial in case of simultaneous EEG/fMRI acquisitions.
Furthermore, for seek of genericity, the proposed method is able to operate on all types of caps and does not need specific electrodes, unlike a recent work from Marino et al. (2016) for example. To the best of our knowledge, this is first automated electrodes detection method implying non-visible electrodes on anatomical MR sequence.
The method presented here requires only an additional sequence (the UTE acquisition sequence) in the experimental protocol. This acquisition takes from 1 to 5 min. From our experiments, a good compromise between acquisition time and detection quality can be achieved with a 2 or 3 min sequences. Further optimization of the sequence parameters could enable an improvement of the images without increasing the acquisition time.
6. Conclusion
We presented a method to automatically detect and label EEG electrodes during an EEG/fMRI acquisition. We used a UTE MR sequence to obtain electrodes positions on a MR-volume. This method only has for additional cost the acquisition time of the UTE sequence in the MR protocol. We have demonstrated that our method achieves a significantly more accurate electrode detection compared to a semi-automatic detection one that is more commonly used during EEG/fMRI protocols. For future research, since the proposed method can be totally automated and does not require complex processing, this technique may be used to extract the position and the label of the electrodes in real time. Indeed, this technique is interesting for applications requiring immediate knowledge of the position of the electrodes. We believe this method will be useful to improve the fusion of EEG and fMRI signals.
Ethics Statement
This study was carried out in accordance with the recommendations of Comité de Protection des Personnes Ouest V Rennes with written informed consent from all subjects. All subjects gave written informed consent in accordance with the Declaration of Helsinki. The protocol was approved by the Comité de Protection des Personnes Ouest V Rennes.
Author Contributions
PM and CB: definition of the scientific question; MF: bibliographic search; MF, PM, and EB: choice and development of the methodology; MF and PM: programming and realization of the experiment; MF: recruitment of subjects; MF, PM, and MM: realization of tests on subjects; MF: the collection, counting, coding of the data and statistical analysis of the data and interpretation of the results, production of tables or figures, and writing; MF, CB, and PM: correction of the method; MF, EB, MM, PM, and CB: correction of the draft.
Conflict of Interest Statement
The authors declare that the research was conducted in the absence of any commercial or financial relationships that could be construed as a potential conflict of interest.
Acknowledgments
MRI data acquisition was partly supported by the Neurinfo MRI research facility from the University of Rennes I. Neurinfo is granted by the the European Union (FEDER), the French State, the Brittany Council, Rennes Metropole, INRIA, IMSERM, and the University Hospital of Rennes. The authors would like to thank their collaborators at Siemens Healthineers, in particular Vladimir Jellus and P. Speier for their valuable contributions to the development and testing of the prototype Ultra Short TE for this project.
References
Adjamian, P., Barnes, G., Hillebrand, A., Holliday, I., Singh, K., Furlong, P., et al. (2004). Co-registration of magnetoencephalography with magnetic resonance imaging using bite-bar-based fiducials and surface-matching. Clin. Neurophysiol. 115, 691–698. doi: 10.1016/j.clinph.2003.10.023
Bardouille, T., Krishnamurthy, S. V., Hajra, S. G., and D'Arcy, R. C. (2012). Improved localization accuracy in magnetic source imaging using a 3-d laser scanner. IEEE Trans. Biomed. Eng. 59, 3491–3497. doi: 10.1109/TBME.2012.2220356
Besl, P. J., and McKay, N. D., (1992). A method for registration of 3-d shapes. IEEE Trans. Patt. Anal. Mach. Intell. 14, 239–256. doi: 10.1109/34.121791
Borrmann, D., Elseberg, J., Lingemann, K., and Nüchter, A. (2011). The 3d hough transform for plane detection in point clouds: a review and a new accumulator design. 3D Research 2:3. doi: 10.1007/3DRes.02(2011)3
Butler, R., Gilbert, G., Descoteaux, M., Bernier, P.-M., and Whittingstall, K. (2017). Application of polymer sensitive MRI sequence to localization of EEG electrodes. J. Neurosci. Methods 278, 36–45. doi: 10.1016/j.jneumeth.2016.12.013
Buzsáki, G., Anastassiou, C. A., and Koch, C. (2012). The origin of extracellular fields and currents – EEG, ECoG, LFP and spikes. Nature Rev. Neurosci. 13, 407–420. doi: 10.1038/nrn3241
Chen, Y., and Medioni, G. (1992). Object modelling by registration of multiple range images. Image Vision Comput. 10, 145–155. doi: 10.1016/0262-8856(92)90066-C
Dalal, S. S., Rampp, S., Willomitzer, F., and Ettl, S. (2014). Consequences of EEG electrode position error on ultimate beamformer source reconstruction performance. Front. Neurosci. 8:42. doi: 10.3389/fnins.2014.00042
de Munck, J. C., van Houdt, P. J., Verdaasdonk, R. M., and Ossenblok, P. P. (2012). A semi-automatic method to determine electrode positions and labels from gel artifacts in EEG/fMRI-studies. Neuroimage 59, 399–403. doi: 10.1016/j.neuroimage.2011.07.021
Ge, S., Ding, M.-Y., Zhang, Z., Lin, P., Gao, J.-F., Wang, R.-M., et al. (2017). Temporal-Spatial Features of Intention Understanding Based on EEG-fNIRS Bimodal Measurement. IEEE Access 5, 14245–14258. doi: 10.1109/ACCESS.2017.2723428
Holmes, J. E., and Bydder, G. M. (2005). MR imaging with ultrashort TE (UTE) pulse sequences: basic principles. Radiography 11, 163–174. doi: 10.1016/j.radi.2004.07.007
Jenson, D., Reilly, K. J., Harkrider, A. W., Thornton, D., and Saltuklaroglu, T. (2018). Trait related sensorimotor deficits in people who stutter: an EEG investigation of μ rhythm dynamics during spontaneous fluency. Neuroimage 19, 690–702. doi: 10.1016/j.nicl.2018.05.026
Kavanagk, R. N., Darcey, T. M., Lehmann, D., and Fender, D. H. (1978). Evaluation of methods for three-dimensional localization of electrical sources in the human brain. IEEE Trans. Biomed. Eng. 25, 421–429. doi: 10.1109/TBME.1978.326339
Keereman, V., Fierens, Y., Broux, T., De Deene, Y., Lonneux, M., and Vandenberghe, S. (2010). MRI-based attenuation correction for PET/MRI using ultrashort echo time sequences. J. Nuclear Med. 51, 812–818. doi: 10.2967/jnumed.109.065425
Khosla, D., Don, M., and Kwong, B. (1999). Spatial mislocalization of EEG electrodes–effects on accuracy of dipole estimation. Clin. Neurophysiol. 110, 261–271. doi: 10.1016/S0013-4694(98)00121-7
Koessler, L., Cecchin, T., Caspary, O., Benhadid, A., Vespignani, H., and Maillard, L. (2011). EEG-MRI Co-registration and Sensor Labeling Using a 3D Laser Scanner. Ann. Biomed. Eng. 39, 983–995. doi: 10.1007/s10439-010-0230-0
Le, J., Lu, M., Pellouchoud, E., and Gevins, A. (1998). A rapid method for determining standard 10/10 electrode positions for high resolution EEG studies. Electroencephalogr. Clin. Neurophysiol. 106, 554–558. doi: 10.1016/S0013-4694(98)00004-2
Mano, M., Lécuyer, A., Bannier, E., Perronnet, L., Noorzadeh, S., and Barillot, C. (2017). How to build a hybrid neurofeedback platform combining EEG and fMRI. Front. Neurosci. 11:140. doi: 10.3389/fnins.2017.00140
Marino, M., Liu, Q., Brem, S., Wenderoth, N., and Mantini, D. (2016). Automated detection and labeling of high-density EEG electrodes from structural MR images. J. Neural Eng. 13:056003. doi: 10.1088/1741-2560/13/5/056003
Murakami, S., and Okada, Y. (2006). Contributions of principal neocortical neurons to magnetoencephalography and electroencephalography signals. J. Physiol. 575, 925–936. doi: 10.1113/jphysiol.2006.105379
Petsche, H., Pockberger, H., and Rappelsberger, P. (1984). On the search for the sources of the electroencephalogram. Neuroscience 11, 1–27. doi: 10.1016/0306-4522(84)90212-4
Popescu, V., Battaglini, M., Hoogstrate, W., Verfaillie, S., Sluimer, I., van Schijndel, R., et al. (2012). Optimizing parameter choice for FSL-Brain Extraction Tool (BET) on 3D T1 images in multiple sclerosis. Neuroimage 61, 1484–1494. doi: 10.1016/j.neuroimage.2012.03.074
Sijbers, J., Vanrumste, B., Van Hoey, G., Boon, P., Verhoye, M., Van der Linden, A., et al. (2000). Automatic localization of EEG electrode markers within 3D MR data. Magn. Reson. Imaging 18, 485–488. doi: 10.1016/S0730-725X(00)00121-1
Smith, S. M. (2002). Fast robust automated brain extraction. Hum. Brain Mapp. 17, 143–155. doi: 10.1002/hbm.10062
Springer, F., Martirosian, P., Schwenzer, N. F., Szimtenings, M., Kreisler, P., Claussen, C. D., et al. (2008). Three-dimensional ultrashort echo time imaging of solid polymers on a 3-tesla whole-body MRI scanner. Investig. Radiol. 43, 802–808. doi: 10.1097/RLI.0b013e318188601f
Strobel, A., Debener, S., Sorger, B., Peters, J. C., Kranczioch, C., Hoechstetter, K., et al. (2008). Novelty and target processing during an auditory novelty oddball: a simultaneous event-related potential and functional magnetic resonance imaging study. Neuroimage 40, 869–883. doi: 10.1016/j.neuroimage.2007.10.065
Thornton, D., Harkrider, A. W., Jenson, D., and Saltuklaroglu, T. (2017). Sensorimotor activity measured via oscillations of EEG mu rhythms in speech and non-speech discrimination tasks with and without segmentation demands. Brain Lang. 187, 62–73. doi: 10.1016/j.bandl.2017.03.011
Towle, V. L., Bolaños, J., Suarez, D., Tan, K., Grzeszczuk, R., Levin, D. N., et al. (1993). The spatial location of EEG electrodes: locating the best-fitting sphere relative to cortical anatomy. Electroencephalogr. Clin. Neurophysiol. 86, 1–6. doi: 10.1016/0013-4694(93)90061-Y
Whalen, C., Maclin, E. L., Fabiani, M., and Gratton, G. (2008). Validation of a method for coregistering scalp recording locations with 3D structural MR images. Hum. Brain Mapp. 29, 1288–1301. doi: 10.1002/hbm.20465
Wood, C. C., and Allison, T. (1981). Interpretation of evoked potentials: a neurophysiological perspective. Can. J. Psychol. 35:113. doi: 10.1037/h0081149
Keywords: EEG, fMRI, electrode localization, UTE, simultaneous EEG/fMRI
Citation: Fleury M, Barillot C, Mano M, Bannier E and Maurel P (2019) Automated Electrodes Detection During Simultaneous EEG/fMRI. Front. ICT 5:31. doi: 10.3389/fict.2018.00031
Received: 24 July 2018; Accepted: 13 December 2018;
Published: 14 January 2019.
Edited by:
Kaleem Siddiqi, McGill University, CanadaReviewed by:
Zhengyi Yang, The University of Queensland, AustraliaMaria L. Bringas, Clinical Hospital of Chengdu Brain Science Institute, China
Copyright © 2019 Fleury, Barillot, Mano, Bannier and Maurel. This is an open-access article distributed under the terms of the Creative Commons Attribution License (CC BY). The use, distribution or reproduction in other forums is permitted, provided the original author(s) and the copyright owner(s) are credited and that the original publication in this journal is cited, in accordance with accepted academic practice. No use, distribution or reproduction is permitted which does not comply with these terms.
*Correspondence: Mathis Fleury, bWF0aGlzLmZsZXVyeUBnbWFpbC5jb20=